Corporate Ownership & Control / Volume 5, Issue 4, Summer 2008 - 93 - A CORPORATE GOVERNANCE STUDY ON ITALIAN FAMILY FIRMS Fabrizio Colarossi*, Marco Giorgino**, Roberto Steri***, Diego Viviani**** Abstract In this paper we investigate three corporate governance issues in 30 Italian family firms: (i) the com governance (Openness Index) and the decision-making quality (Extension Index) and we analyze empirical results through a cluster analysis by following the Gubitta (2002). Our conclusion suggests that (i) to be consistent with the guidelines suggested by the Stewardship Theory and boards are characterized by a relevant presence of family members. Keywords: family business, corporate governance, small firms *Department of Management, Economics, and Industrial Engineering, Politecnico di Milano ** Department of Management, Economics, and Industrial Engineering, Politecnico di Milano ***Department of Management, Economics, and Industrial Engineering, Politecnico di Milano ****Corresponding Author, Department of Industrial and Management Engineering Politecnico di Milano, Via Giuseppe Colombo, 40 I 20113 Milano- Phone (+39) 02.2399.2794 Fax (+39) 02.2399.2720 E-mail: [email protected] Introduction Family enterprises are firms in which the majority of the capital is held by one, or few, families connected from ties of relative, affinity or solid alliances. They still represent the dominant business model all over the world. In Italy, they account for approximately 83% of the number of medium and small capital enterprises (Corbetta et al. , 2002); analogous percentages can be found all around the world. However, this is not a phenomenon that involves only small businesses: in fact, 175 of Fortune 500 US companies are family-controlled (Anderson and Reeb, 2003). Family businesses are responsible for 50% of U.S. gross domestic product. They generate 60% of the country's employment and 78% of all new job creation (Perman, 2006). These data help understand the importance of family-owned firms in economic activities all over the world. Several scholars still attribute them several self-defeating behaviors such as nepotism and favoritism towards the family members (Kets de Vries, 1996; Gomez- -Nickel shareholders. On the other hand, family firms are known for a number of strenght points: (i) the (Anderson and Reeb, 2003); (ii) the long-term strategic horizon (Stein, 1988; Stein, 1989, Casson, 1999; James, 1999); (iii) the access to cheaper debt (Anderson et al. , 2003); (iv) the continuous preferential relationships both with suppliers and financial supporters (Anderson et al. , 2003); (v) the reduced agency costs due to the trust among family members (Demsetz and Lehn, 1985; Ang et al., 2000). In family firms, the entrepreneur is used to concentrate all responsibilities in his hands and the governance structure is not considered a relevant issue. But when the firm grows, the agency costs increase as well. The complexity of business increases to handle the new situation (Ward, 1997). Many family firms, with the purpose of reducing the internal lack of knowledge and skills, decide to hire nonfamily managers and to involve them in running the company. In this case, adopting mechanisms of delegation is a critical success factor for the firm: according to the New Theory of Property Rights, the step from strategic planning to action become more complex, since the external managers are now taking part in the coalition and are responsible of one or more organizational units (Gubitta and Gianecchini, 2002). Moreover, as long as the most important decisions are taken by the entrepreneur, or by a restrict number of relatives, these usually come out from informal meetings. By the way, when the firm grows, it is important to create an executive board made up of those family and nonfamily members who hold critical positions in the company. Every family firm owner should understand which type of governance model better fits to his or her firm and how to implement it by taking appropriate decisions about the role, the composition, the size and the tasks of the board of directors and other boards which may have In this paper, we empirically investigate three corporate governance issues in Italian family firms: (i) the orientation either to Agency Theory or to

Welcome message from author
This document is posted to help you gain knowledge. Please leave a comment to let me know what you think about it! Share it to your friends and learn new things together.
Transcript

Corporate Ownership & Control / Volume 5, Issue 4, Summer 2008
- 93 -
A CORPORATE GOVERNANCE STUDY ON ITALIAN FAMILY FIRMS
Fabrizio Colarossi*, Marco Giorgino**, Roberto Steri***, Diego Viviani****
Abstract In this paper we investigate three corporate governance issues in 30 Italian family firms: (i) the
comgovernance (Openness Index) and the decision-making quality (Extension Index) and we analyze empirical results through a cluster analysis by following the Gubitta (2002). Our conclusion suggests that (i) to be consistent with the guidelines suggested by the Stewardship Theory and boards are characterized by a relevant presence of family members. Keywords: family business, corporate governance, small firms *Department of Management, Economics, and Industrial Engineering, Politecnico di Milano ** Department of Management, Economics, and Industrial Engineering, Politecnico di Milano ***Department of Management, Economics, and Industrial Engineering, Politecnico di Milano ****Corresponding Author, Department of Industrial and Management Engineering Politecnico di Milano, Via Giuseppe Colombo, 40 I 20113 Milano- Phone (+39) 02.2399.2794 Fax (+39) 02.2399.2720 E-mail: [email protected]
Introduction
Family enterprises are firms in which the majority of
the capital is held by one, or few, families connected
from ties of relative, affinity or solid alliances. They
still represent the dominant business model all over
the world. In Italy, they account for approximately
83% of the number of medium and small capital
enterprises (Corbetta et al. , 2002); analogous
percentages can be found all around the world.
However, this is not a phenomenon that involves only
small businesses: in fact, 175 of Fortune 500 US
companies are family-controlled (Anderson and Reeb,
2003). Family businesses are responsible for 50% of
U.S. gross domestic product. They generate 60% of
the country's employment and 78% of all new job
creation (Perman, 2006). These data help understand
the importance of family-owned firms in economic
activities all over the world. Several scholars still
attribute them several self-defeating behaviors such as
nepotism and favoritism towards the family members
(Kets de Vries, 1996; Gomez- -Nickel
shareholders. On the other hand, family firms are
known for a number of strenght points: (i) the
(Anderson and Reeb, 2003); (ii) the long-term
strategic horizon (Stein, 1988; Stein, 1989, Casson,
1999; James, 1999); (iii) the access to cheaper debt
(Anderson et al. , 2003); (iv) the continuous
preferential relationships both with suppliers and
financial supporters (Anderson et al. , 2003); (v) the
reduced agency costs due to the trust among family
members (Demsetz and Lehn, 1985; Ang et al., 2000).
In family firms, the entrepreneur is used to
concentrate all responsibilities in his hands and the
governance structure is not considered a relevant
issue. But when the firm grows, the agency costs
increase as well. The complexity of business increases
to handle the new situation (Ward, 1997). Many
family firms, with the purpose of reducing the internal
lack of knowledge and skills, decide to hire nonfamily
managers and to involve them in running the
company. In this case, adopting mechanisms of
delegation is a critical success factor for the firm:
according to the New Theory of Property Rights, the
step from strategic planning to action become more
complex, since the external managers are now taking
part in the coalition and are responsible of one or
more organizational units (Gubitta and Gianecchini,
2002). Moreover, as long as the most important
decisions are taken by the entrepreneur, or by a
restrict number of relatives, these usually come out
from informal meetings. By the way, when the firm
grows, it is important to create an executive board
made up of those family and nonfamily members who
hold critical positions in the company. Every family
firm owner should understand which type of
governance model better fits to his or her firm and
how to implement it by taking appropriate decisions
about the role, the composition, the size and the tasks
of the board of directors and other boards which may
have
In this paper, we empirically investigate three
corporate governance issues in Italian family firms: (i)
the orientation either to Agency Theory or to
Corporate Ownership & Control / Volume 5, Issue 4, Summer 2008
- 94 -
composition, by introducing a new classification in
Familiar Board of
Directors, Hybrid Board of Directors, and Evolved
Board of Directors); (iii) the ability to involve
and governanc -
(Gubitta and Gianecchini, 2002). The paper is
organized as follows: Section 2 briefly reviews the
literature on corporate governance in family business;
Section 3 describes both the research data collection
process and methodology; Section 4 illustrates the
results of the study; and Section 5 provides a
conclusion, by pointing out the key results, briefly
discussing the limits of our study, and suggesting new
research directions.
Literature Review
Corporate governance is a pivotal subject in business
literature, and the debate about the improvement of
governance systems is of great interest. Both the
theoretical issues regarding corporate governance and
the potential benefits achievable through its
improvement have been already deeply discussed in
literature.
Nevertheless, corporate governance has received
an increasing attention during the last two decades
(Tricker, 1996; Keasey, 1999). The notion of
corporate governance can be dated back to 1932,
when Berle and Means argued about the separation of
corporate control and ownership that causes
executives, rather than owners, to determine the
corporate governance is focusing on the relationships
and interactions among some different actors of the
firm: shareholders, boards of directors, senior
managers and other corporate stakeholders (Cochran
and Wartrick, 1988; Tricker, 1996). Concerning the
separation between ownership and management, not
all studies go towards the same direction. There are
two main schools of thought: (i) the Agency Theory
(Jensen and Meckling, 1976; Fama and Jensen, 1983)
and (ii) the Stewardship Theory (Donaldson and
Davis, 1991; Davis et al. , 1997; Muth and
Donaldson, 1998). The two theories consider the way
the owners can structure the corporate governance
systems of their business from different perspectives.
running in different ways. The family might choose
either to act mainly as an owner/inspector, leaving the
executive power to professional managers, or to act
both as owner and leading manager (Dyer, 1989;
Daily and Dollinger, 1992; Gersick et al. , 1997).
According to the Agency Theory, the separation
between a principal (the family owners) and an agent
(the nonfamily managers). Some studies show that
dissociation between ownership and managerial
decision-
managerial decisions (Fama and Jensen, 1983;
Johnson et al. , 1993). According to the Agency
Theory the main task of the board of directors is to
opportunistic behaviours (Muth and Donaldson,
1998).
objectives through suitable incentive systems and
continuous monitoring. However, incentives and
monitoring activity cause agency costs as well
(Demsetz, 1972). In family companies, separation of
ownership from control arises with fragmented
ownership a
in the business (Johannisson and Huse, 2000). The
main guidelines this theory suggests in order to build
a corporate governance system are: (i) the board
should be mainly composed of non-executive
directors, in order not to undermine its objectivity; (ii)
the positions of CEO and chairman of the board
should not be hold by the same person; (iii) the total
size of the board should range from 9 to 15 members
(Goodstein, Gautam, Boeker, 1994), in order to
prevent the st
decisions (Gubitta and Gianecchini, 2002).
On the other hand, the Stewardship Theory
argues that managerial self-interest is not the only
relevant issue (Donaldson and Davis, 1991; Davis et
al., 1997; Muth and Donaldson, 1998). Doucouliagos
driven only by self-interest, because of the complexity
of human action, not well exlplained by the agency
theory. The lackness of the principal-agent theory is a
model of man that does not suit the demands of a
theory, the model of man is based on a steward whose
behavior is ordered such that pro-organizational,
collectivistic behaviors have higher utility than
individualistic, self- et al.,
1997).
Applying this framework to family firms, the
goals of the family ownership and the nonfamily
managers seem to be aligned; thus there are no
significant shortcomings in a strong separation
between ownership and management. This theory
comes to the following conclusions: (i) the
involvement of the executive directors increases the
leadership structure is preferable to the separated one;
(iii) the size of the board of directors should be small -
between 5 and 9 people (Lane, Astrachan, Keyt,
McMillan, 2006) - to help the communication among
members (Gubitta and Gianecchini, 2002).
Several studies on both theories have been
conducted and their results are mixed. There is no
reason to argue that one theory is better than the other
one, because it depends on many contingent factors.
For instance, Davis, et al. (1997) explain that there are
psychological and cultural factors that affect the
Corporate Ownership & Control / Volume 5, Issue 4, Summer 2008
- 95 -
results, while Muth and Donaldson (1998) suggest
that industry characteristics affect them. Other
scholars assert that corporate governance is influenced
by institutional factors and that the legal environment
defines property rights and sets boundaries within
which the companies must operate (Shleifer and
Vishny, 1997). Also, the efficiency of capital markets
directly affects the corporate governance system in
different countries (Klapper and Love, 2004).
Lansberg (1999) asserts that most families do not pay
enough attention to the governance of their
businesses, and that good family firm governance
should be the result of good family governance too. In
fact, inside family businesses, conflicts can easily
arise. Such conflicts may be of several types: justice
conflicts, role conflicts, work-family conflicts,
identity conflicts, succession conflicts, arguments
about power and control, role ambiguities, rivalries
between brothers and sisters, conflicts between family
members and employees caused by nepotism (Dyer
1994; Cosier and Harvey, 1998; Danes et. al. , 1999).
Moreover, business decisions sometimes badly affect
the family equilibrium (Harvey and Evans, 1994) by
creating long-term family feuds (LaChapelle and
Barnes, 1998). Thus, the creation of effective
corporate governance structures could improve not
only the relationships between family ownership and
agents, but also the rules and hierarchies established
inside the family (Whisler, 1988).
Scholars have tried to establish some guidelines
for deciding which features the board of d
should have. Some researchers affirm that, in order to
reduce the lack of competencies, an ideal board
should also include active or retired CEOs and other
skilled professionals who operate in different areas,
such as finance, marketing, operations, technology,
law and public policy (Baysinger and Butler, 1985).
Regarding the independence of the board, it should be
made up of both dependent and independent
individuals. A board composed only of insiders and
outsiders who depend on insiders might not
effectively control other insiders (Lynall et al. , 2003).
Independent professionals are taken in great
consideration because they usually provide firm-
specific knowledge and strong commitment towards
the company (Sundaramurthy and Lewis, 2003).
Concerni
that since each member is used to underweight his or
her individual responsibility in a bigger group, smaller
boards are more adequate for family companies
(Ward, 1991; Lane, Astrachan, Keyt, McMillan,
2006). Many of these scholars believe that an
effective board of directors should count from 5 up to
9 directors (Forbes, Milliken, 1999; Lane, Astrachan,
Keyt, McMillan, 2006). In contrast, other researchers
believe that a board ranging from 9 to 15 directors
would be more suitable (Goodstein, Gautam, Boeker,
1994). As regards to the frequency of board meetings,
family business experience recommends that the
board meets formally at least four-six times per year;
in addition, an executive committee attended by the
main directors, the chairman, and the CEO along with
the senior managers should meet once a month (Ward,
1991). However, this threshold should not be
overcome, in order to avoid the risk that the board
carries over into the role of management. Finally,
according to Shen and Cannella (2002) a board
Therefore, in order to keep a director in service for a
longer period of time, he or she should still give a
substantial support to the company. Ward (1991)
recommends maintaining directors in force from two
up to three years, even if the terms are reviewed
annually, with a mandatory retirement age between 62
and 65 years old.
Methodology
This study has been conducted using the answers of a
survey which has been submitted to a sample of 121
family owned Italian firms. Such firms have been
sampled from the database provided by the Italian
chamber of Commerce (InfoCamere), in accordance
with the family business definitions provided by
Holland and Oliver (1992) and Daily and Dollinger
(1993). Specifically, the family firms have been
chosen in respect of the following three basic
requirements: (i) the presence of a board of directors;
(ii) the presence of, at least, one family member inside
the managerial team and the shareholder base; (iii) the
coherence with the distributions of age, size, and
survey, which has been conducted in 2003 by the
Central Bank Of Italy. We sent an e-letter to each
firm, explaining the study and its objectives. Among
the family firms that have answered, 30 fulfilled the
requirements of the research. In fact, in Italy, most of
family businesses are very small and they do not feel
the need to establish a formal board of directors, but
they usually have a Sole Director. The questionnaire
was composed of 48 questions; some needed
quantitative answers, while others needed qualitative
ones. Interviews were conducted either with a family
member operating in the top management or with the
top nonfamily manager of the firm. Interviews took
place between October 2006 and January 2007, and
each interview lasted about one hour and a half.
The questionnaire is divided into three sections.
The first section collected data in order to understand
which theory, Agency or Stewardship, better fits to
the small family owned Italian firms. We considered
three main directions of analysis: (i) the board of
management; (iii) the size of the board of directors.
The second section examined the relationships
between relatives, managers and independent
directors. Specifically, we have considered three
different kind of board composition: (i) the familiar
board of directors; (ii) the hybrid board of directors;
(iii) the evolved board of directors (Figure 1).

Corporate Ownership & Control / Volume 5, Issue 4, Summer 2008
- 96 -
Family Members
Family Members
Managers
Family Members
Managers
Indipendent directors
The familiar board of directors
The hybrid board of directors
The evolved board of directors
Figure 1. The three models of board of directors
The familiar board of directors is totally made
up of family members. This type of board is very
common in those firms whose decisional power is
firmly in the hands of the family, which does not have
any intention to share it with other people. The hybrid board of directors is composed of both family and
nonfamily members. The involvement of the
nonfamily managers is an uncritical feature, but it
both contributes to widen the portfolio of
competences of the family and to support the leader to
face the increasing managerial complexity. The
evolved board of directors is made up of relatives,
nonfamily managers and independent directors. The
independent directors are non-executive directors who
are not directly associated with the family. Their role
is to give external opinions inside the board. Their
independence is really important, because they are not
involved in the ordinary running of the firm and they
are not as affected by the emotional biases as the
owners. The compensation of each independent
director should be a small part of his or her total
income, in order to prevent him from receiving
pressures from the family.
The third section concerned the study of the
ability of the surveyed firms to open to nonfamily
members and measure the quality of their decision-
making process. By following the Gubitta and
modified version of the Openness and the Extension
Indexes, in order to better take into consideration the
features of the corporate governance system of the
family firms in our sample. The Openness Index is a
cross-
owners to involve managers in both formal and
informal boards, and to put them on the head of
strategic business functions (Gubitta and Gianecchini,
2002). The Openness Index can be computed using
the following:
M
M Index Openness
nf (1)
where Mnf is the number of all nonfamily individuals
who manage business functions or units and all
nonfamily members who sit on executive board, board
of directors or family council, and M is the number of
all individuals who manage business functions or
units and all family and nonfamily members who sit
on some boards excluded the family council. The
Openness Index values can vary among 0 and 1. The
are no family members involved in the board of
directors or at the head of business units.
The Extension Index measures the quality of the
decision-making process of the firms. This index is
based on the idea that there are two main kinds of
decisions: (i) the strategic decisions, which are
defined as choices that have a high degree of
specificity and complexity, that require a great effort,
and that might be irreversible, and (ii) the tactical-
operational decisions, which can be defined as those
that have an impact on the short period rather than on
the long run, even if they are very important in the
daily management of the company. Unlike Gubitta
and Gianecchini (2002) - in order to better take into
account the characteristics of the family firms in our
sample - we have considered the possibility that the
decisions are made from the board of directors, formal
and informal executive boards, family council and
from individuals as well. We have considered
decisions taken by either the chairman of the board or
the CEO as the result of a board of directors meeting.
In family firms, even in biggest ones, the executive
committee is not always formalized, but its role is
often replaced by informal meetings to which the
result, we have decided to consider the decisions
taken inside the informal meetings and the decisions
taken by one or more business units heads as they
were taken by a formal executive board. On the other
hand, the family council should not be a place where
strategic and tactical-operational decisions are taken,
but a place where relatives can express and discuss
their needs, points of view, worries, opinions, values
and develop politics and procedures to the service of
the family.
The formula of the Extension Index is the
following:
6
)_3_2_1(75,06 Index Extension
errortypeerrortypeerrortypeVAOL rdndst
(2)
by more than one board among family council, board
the sum of decisions never made by any board, 1st
type error is the sum of tactical-operational decisions
made by the board of directors, 2nd
type error is the
sum of strategic decisions made by the executive
board and the 3rd
type error is the sum of both
strategic and tactical-operational decisions made by
the family council. In order to compute the Extension

Corporate Ownership & Control / Volume 5, Issue 4, Summer 2008
- 97 -
Index values, coherently with Gubitta and
Giannecchini (2002), we identified the six types of
decisions shown in Table 1.
Table 1. Strategic vs Tactical and Operational Decisions
Strategic decisions Tactical-operational decisions
Definition of -
term objectives
Financial investment decisions
Definition of the final balance and budget
Definition of the organizational structure
Evaluation of the competitive advantage, start-up
of corrective and development actions
Choice of formal and informal systems for
monitoring business performances
Source: Gubitta and Gianecchini (2002)
The Extension Index can range from 0 - when all
decisions are taken by more that one governing body
or when no one takes any decision - to 1 - when the
governance system makes all decisions correctly.
After computing both the Openness Index and the
Extension Index for every firm of the sample, we
analyze the results by considering four groups of
companies: low extension-low openness, high
extension-low openness, low extension-high openness
and high openness-high extension.
Description of the sample
Our sample is made up of 30 Italian family firms.
Most of them are small and medium enterprises; only
10% of them have a turnover greater than 50 millions
euro, and 30% of them have revenues lower than 10
millions euro. The average turnaround of the sample
is 20.8 millions euro. Around 56% percent of the
companies are joint-stock companies, whereas the
others are limited companies. The average number of
employees is 99.87. Twenty percent of the firms
employ less than 50 employees, while 16.67% have
more than 150 workers. Most firms are still led by
their founders (60%), 23.33% by the second
generation, 13.33% by the third and only 3.33% by
the forth generation. Approximately 43% are B2C
(Business to consumer) firms, around 46% are B2B
(Business to business) and the remaining are both
B2B and B2C. Most companies belong to the metal
and mechanical industry (33.33%), whereas the other
most common industries are logistics (16.67%) and
industrial services (13.33%).
The average number of owners is 5.07, and
almost 4 of them are family members. There is a high
degree of ownership concentration, since the average
share held by the first owner is around 50%. The
average number of nonfamily managers that are heads
of a function is 2.27. The board of directors is
averagely made up of 4.44 members: 3.23 of them are
family members, 0.47 are nonfamily manager, 0.47
are independent directors, and 0.27 are external
people somehow linked with the family. The board of
directors meets, on average, 3.13 times per year. A
formal executive board exists in the 40% of the cases.
It is averagely composed of 4.92 members, but only
2.08 of them are family managers. Finally, 16.67% of
the firms have a formal family council and it is
averagely composed of 5 relatives.
Empirical results and discussion Agency theory vs. Stewardship theory We asked the firms of the sample if they consider the
board as an instrument of defence from potential
opportunistic behaviours arising from the external
managers. Only 10% of the companies attributes this
purpose to the board. Moreover, incentive systems,
which are really common in nonfamily firms, are not
very diffused (26.7 % of the cases). Both evidence
drive us thinking that the managerial opportunism is
The family
firms included in our sample show a large presence of
executive directors (71%) and 87% of these executive
directors are family members. These data highlight
the little separation between ownership and
management. In addition, 70% of the firms declares
the fusion of the CEO and chairman positions.
With reference to the size of board, in our
sample the average number of directors is 4.43. Our
findings on Italian family firms seem to suit with the
Board of directors Firms with a familiar board of directors model are the
most common (43%), followed by those with an
evolved model (30%) and those with a hybrid model
(27%). Firms with a familiar board of directors model
are also the smallest ones, with an average number of
employees around 70 and a turnover around 12.9
sample: the weighted average family generation who
is running them is close to the second (1.85). The size
of this type of board is averagely around 4 family
members. Besides, there is a big overlap between the
role of the CEO and that of the chairman of the board
(more than 80% of the firms). Other formal structures
of governance are not very diffused: the executive
boards and the family councils are respectively
present in the 30.8% and in the 7.7% of the cases.
Moreover, both nonfamily shareholders and external
managers are not often present in these firms. Indeed,
family shareholders account for more than 95% of the
total number of shareholders, and on average 80.9%

Corporate Ownership & Control / Volume 5, Issue 4, Summer 2008
- 98 -
on the basis of our sample, familiar boards of
directors are the smallest ones, with a mean number
of members of 4.08.
Firms with a hybrid board of directors are the
generation number equal to 1.25). The role of the
external managers is emphasized by their presence in
the board: more than 25% of the members is made up
of nonfamily managers. By the way, the presence of
members who are not employed in the company but
who have some kind of relationship with the family is
considerable (19.4%). The executive board is quite
diffused; 62.5% of the firms has a formal board with a
majority of external managers (around 62% of the
members). Probably because of the average young age
of the companies, the family council is not present at
all. Firms with an evolved board of directors are the
biggest in our sample, with an average turnover of 38
millions euro and a number of employees around 140.
The evolved board of directors is the biggest in size,
with a mean of 4.89 members. The independent
directors count for more than 30% of the total number
of members, whereas both nonfamily managers and
family-linked people are not usually in the board. The
family council is present in most of these companies.
Comparing firms with a familiar board of directors
model with those with an evolved board of directors
model, as the number of actors involved in the board
increases, the percentage of nonfamily shareholders
increases as well. Firms with an evolved board of directors model have an average of 5.56 owners, and
only 3.22 of them are family members. On the other
hand, firms with familiar board of directors model
have averagely 5.46 owners, and 5.23 of them are
relatives. Moreover, firms with an evolved board of directors have not only the highest number of
business functions (more than 11), but also the highest
percentage of nonfamily business functions heads.
Finally, incentive systems are diffused (55.56%), and
internal audit systems are very common as well
(77.78%).
Table 2. Board of directors: empirical results
Number 13 8 9
Percent to Total 43,33% 26,67% 30,00%
Turnover
Employees 70,5 101,3 141,0
Year of foundation 1959 1947 1971
Family Generation First 7 (53.84%) First 6 (75.00%) First 5 (55.56%)
Second 2 (15.38%) Second 2 (25.00%) Second 3 (33.33%)
Third 3 (23.08%) Third 0 (0.00%) Third 1 (11.11%)
Fourth 1 (7.69%) Fourth 0 (0.00%) Fourth 0 (0.00%)
Number of Shareholders 5,46 3,88 5,56
Family ShareHolders 5.23 (95.77%) 2.50 (64.51%) 3.22 (58.00%)
Nonfamily Shareholders 0.23 (4.23%) 1.38 (35.49%) 2.33 (42.00%)
Highest Stake 49,64% 51,63% 48,17%
Number of Business Units 8,46 9,13 11,22
Headed by Family Managers 6.85 (80.90%) 6.88 (75,34%) 8.00 (71.29%)
Headed by Nonfamily Managers 1.62 (19.10%) 2.25 (24.66%) 3.22 (28.71%)
Board of Directors' Size (# of members) 4,08 4,50 4,89
Relatives 4.08 (100.00%) 2.37 (52.78%) 2.78 (56.82%)
Nonfamily Managers / 1,25 (27.78%) 0.44 (9,09%)
Family-Linked Directors / 0,88 (19.44%) 0.11 (2.27%)
Independent Directors / / 1,56 (31.82%)
Number of Firms with Executive Board 4 (30.77%) 5 (62.50%) 3 (33.33%)
Executive Board's Size (# of members) 4,75 4,20 6,33
Family Members 2.25 (47.37%) 1.60 (38.10%) 2.67 (42.10%)
Nonfamily Members 2.50 (52.63%) 2.60 (61.90%) 3.67 (57.89%)
Number of Firms with Family Council 1 (7.69%) 0 (0.00%) 4 (44.44%)
Family Council's Size (# of members) 3,00 / 5,50
Number of Firms with CEO/Chairmain Overlap 11 (84.62%) 5 (62.50%) 5 (55.56%)
Number of Firms that consider the Board of
Directors as a protection from managers'
opportunistic behaviour
0 (0.00%) 2 (25.00%) 1 (11.11%)
Number of Firms with Incentive Systems 2 (15.38%) 1 (12,50%) 5 (55.56%)
Number of Firms with Internal Auditing Systems 5 (38.46%) 4 (50.00%) 7 (77.78%)
MANAGEMENT
CORPORATE GOVERNANCE
OWNERSHIP
Familiar Hybrid Evolved
GENERAL DATA
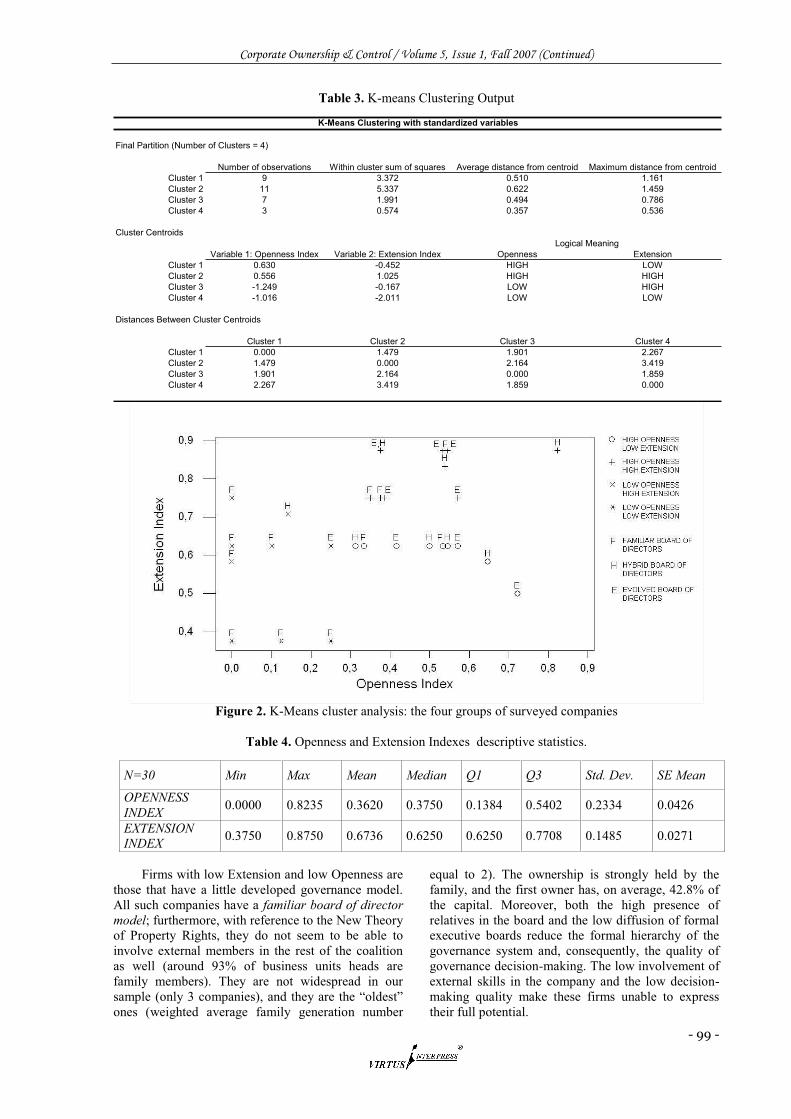
Openness and Decision Making Quality Figure 4 shows the positioning of the surveyed firms
on the basis of the computed values of both the
Extension Index and the Openness Index. In order to
better interpret the empirical results from our sample,
we performed a cluster analysis by the k-means
algorithm (MacQueen, 1967). As shown in Figure 5,
we identified four clusters that logically correspond to
those identified by Gubitta and Giannecchini (2002).
multidimensional space containing a high density of
points, separated from other such regions by a region
and Dubes, 1988). In other words, each cluster
represents a subgroup of similar family firms, but that
significantly differs from those that belong to other
clusters (on the basis of the values of the clustering
variables). Thus, we are going to discuss the
characteristics of the companies that are in each of the
following groups: (i) low Openness Index and low
Extension Index; (ii) low Openness Index and high
Extension Index; (iii) high Openness Index and low
Extension Index; (iv) high Openness Index and high
Extension Index.
Corporate Ownership & Control / Volume 5, Issue 1, Fall 2007 (Continued)
- 99 -
Table 3. K-means Clustering Output
Final Partition (Number of Clusters = 4)
Number of observations Within cluster sum of squares Average distance from centroid Maximum distance from centroid
Cluster 1 9 3.372 0.510 1.161
Cluster 2 11 5.337 0.622 1.459
Cluster 3 7 1.991 0.494 0.786
Cluster 4 3 0.574 0.357 0.536
Cluster Centroids
Variable 1: Openness Index Variable 2: Extension Index Openness Extension
Cluster 1 0.630 -0.452 HIGH LOW
Cluster 2 0.556 1.025 HIGH HIGH
Cluster 3 -1.249 -0.167 LOW HIGH
Cluster 4 -1.016 -2.011 LOW LOW
Distances Between Cluster Centroids
Cluster 1 Cluster 2 Cluster 3 Cluster 4
Cluster 1 0.000 1.479 1.901 2.267
Cluster 2 1.479 0.000 2.164 3.419
Cluster 3 1.901 2.164 0.000 1.859
Cluster 4 2.267 3.419 1.859 0.000
K-Means Clustering with standardized variables
Logical Meaning
Figure 2. K-Means cluster analysis: the four groups of surveyed companies
Table 4. Openness and Extension Indexes descriptive statistics.
Firms with low Extension and low Openness are
those that have a little developed governance model.
All such companies have a familiar board of director
model; furthermore, with reference to the New Theory
of Property Rights, they do not seem to be able to
involve external members in the rest of the coalition
as well (around 93% of business units heads are
family members). They are not widespread in our
ones (weighted average family generation number
equal to 2). The ownership is strongly held by the
family, and the first owner has, on average, 42.8% of
the capital. Moreover, both the high presence of
relatives in the board and the low diffusion of formal
executive boards reduce the formal hierarchy of the
governance system and, consequently, the quality of
governance decision-making. The low involvement of
external skills in the company and the low decision-
making quality make these firms unable to express
their full potential.
N=30 Min Max Mean Median Q1 Q3 Std. Dev. SE Mean
OPENNESS
INDEX 0.0000 0.8235 0.3620 0.3750 0.1384 0.5402 0.2334 0.0426
EXTENSION INDEX
0.3750 0.8750 0.6736 0.6250 0.6250 0.7708 0.1485 0.0271

Corporate Ownership & Control / Volume 5, Issue 4, Summer 2008
- 100 -
Firms with a high Extension Index and a low
Openness Index are those where the decision-making
process is correctly planned, but the nonfamily
governance and management. The prevailing board
model for these companies is the familiar one
(71.4%); besides, all directors are family members. In
addition, the firms in this cluster have the highest
mean percentage of family business-functions heads.
To sum up, these firms are characterized by the
highest presence o
governance and management. Moreover, the number
of family members involved in the company
management usually grows along with each
ownership succession in family businesses. In this
cluster, firms that are being run by the third
generation have a mean number of family directors of
4 and of family shareholders of 6. On the other hand,
firms that are within the cluster but that are being run
by the first generation have an average number of
family directors of 3.75 and of family shareholders of
4.25. Considering the whole sample, the mean number
of family directors is 3 for the first and the second
generation, 3.75 for the third and 7 for the fourth;
besides, the average number of family shareholders is
2.78 for the first generation, 3.86 for the second, 5.25
for the third and 19 for the company being run by the
fourth generation. This phenomenon is called
generational drift. In order to prevent generational
drift from becoming an uncontrollable problem, the
family should set procedures to regulate the
participation of family members in the ownership. In
particular, the family should introduce such formal
procedures, develop systems to measure their
contributions, establish rewards, and select only the
best family members as managers. These firms are the
smallest of the sample (on average, they have 70
employees and a turnover around 10 millions euro);
their corporate governance systems work pretty well,
but their inability to open the ownership, the boards
and the management to nonfamily members might not
allow them to grow.
In firms with a high Openness Index and a low
Extension Index, external managers have an important
role in running the firm, but the corporate governance
hierarchy is not always respected. The size of these
firms is considerable (about 108 employees and 20
in our sample, with an average family generation
number of 1.33. The prevailing type of board of
directors is the hybrid one (44.44%), even if both the
familiar model and the evolved model are diffused as
well. Nonfamily professionals are significantly
involved in managing such companies, with
approximately 38% of business units leaded by
external managers. Concerning the ownership, the
firms in this cluster have the highest mean percentage
of nonfamily shareholders (27.3%) in our sample, but
on average the main shareholder holds a very high
stake (67.2%). The big dimensions of these
companies, often reached in a short time, suggest that
the considerable involvement of external managers
supported their growth pretty well. On the contrary,
the corporate governance systems of these firms are
usually affected by some confusion of roles (both 1st
type and 2nd
type errors are very common), which is
responsible for their low decision-making quality.
Finally, firms with a high degree of both
Extension and Openness should be taken as best
practices. Concerning the ownership structure, they
have the highest mean number of shareholders (6.27),
and the highest average percentage of nonfamily ones
(around 35%). External managers are significantly
of business functions heads are nonfamily members.
Moreover, their board of directors is the largest in our
sample (around 5 directors), and the prevailing model
is the evolved one (45.5%); the board of directors
meets quite frequently, averagely 3.38 times per year.
The formal executive board is widespread (it is
present in the 72.7% of the cases) and most of its
members are nonfamily individuals (64.4%). The
companies in this cluster are the largest of the sample,
with an average turnover around 29 millions euro and
a mean number of employees of 117.1. Both incentive
and internal auditing systems are quite diffused in
these companies, and although the overlap between
CEO and chairman roles is considerable (63.6%) all
the firms that consider the board as a protection from
cluster
(however, they represent only 27.3% of the
companies in the cluster).
Conclusion
In this paper, we have empirically investigated small
three different perspectives. Although the research is
limited by the small number of companies, our study
suggests the following findings:
i) Agency theory vs. Stewardship theory. Small
systems seem to be consistent with the
guidelines suggested by the Stewardship
Theory.
ii) Board of directors. The familiar board of
directors model is the most diffused in small
Italian family firms, although both the hybrid
and the evolved models are quite common as
well. Moreover:
firms with a familiar board of directors are
relatively smaller and older than other ones,
have both ownership and management
structures with a dominant presence of
family members, and formal corporate
governance structures (executive board,
family council) are not diffused;
firms with an evolved board of directors are
relatively bigger than other ones, nonfamily
members have a high incidence in their
ownership and management structures,
independent directors rather than both

Corporate Ownership & Control / Volume 5, Issue 4, Summer 2008
- 101 -
nonfamily managers and family-linked
directors represent a significant part of the
board of directors, formal executive boards
and family councils are quite diffused, and
both incentive and internal auditing systems
are widespread.
firms with a hybrid board of directors are, on
average, bigger than those with a familiar
board of directors, but smaller than those
with an evolved one; they are relatively
young, there are some nonfamily members
involved in both their management and
ownership structures, nonfamily managers
and family-linked directors are relevant in
companies have a formal executive board.
Table 5. Openness and Decision Making Quality: empirical results
Number 3 7 9 11
Percent to Total 10.00% 23.33% 30.00% 36.67%
Turnover
Employees 82.7 70.1 107.7 117.1
Family Generation First 1 (33.33%) First 4 (57.14%) First 6 (66.67%) First 7 (63.64%)
Second 1 (33.33%) Second 1 (14.28%) Second 3 (33.33%) Second 2 (18.18%)
Third 1 (33.33%) Third 2 (28.57%) Third 0 (0.00%) Third 1 (9.09%)
Fourth 0 (0.00%) Fourth 0 (0.00%) Fourth 0 (0.00%) Fourth 1 (9.09%)
Number of Shareholders 5.33 4.86 3.67 6.27
Family ShareHolders 4.67 (87.50%) 4.86 (100.00%) 2.67 (72.73%) 4.09 (65.22%)
Nonfamily Shareholders 0.67 (12.50%) 0 (0.00%) 1.00 (27.27%) 2.18 (34.78%)
Highest Stake 42.83% 40.70% 67.17% 43.09%
Number of Business Units 9.67 7.57 10.11 10.09
Headed by Family Managers 9.00 (93.10%) 7.29 (96.23%) 6.22 (61.54%) 7.45 (73.87%)
Headed by Nonfamily Managers 0.67(6.90%) 0.29 (3.77%) 3.89 (38.46%) 2.64 (26.13%)
Board of Directors' Size (# of members) 4.33 4.00 4.44 4.73
Board of Directors' Type Familiar 3 (100.00%) 5 (71.43%) 2 (22.22%) 3 (27.27%)
Hybrid 0 (0.00%) 1 (14.28%) 4 (44.44%) 3 (27.27%)
Evolved 0 (0.00%) 1 (14.28%) 3 (33.33%) 5 (45.45%)
Board of Directors' Meetings per Year 1.67 2.79 3.28 3.64
Number of Firms with Executive Board 1 (33.33%) 1 (14.28%) 2 (22.22%) 8 (72.73%)
Executive Board's Size (# of members) 2.00 4.00 5.50 5.25
Family Members 1.00 (50.00%) 4.00 (100.00%) 2.50 (45.45%) 1.87 (35.62)
Nonfamily Members 1.00 (50.00%) 0.00 (0.00%) 3.00 (55.55%) 3.38 (64.38)
Number of Firms with Family Council 1 (33.33%) 1 (14.28%) 1 (11.11%) 2 (18.18%)
Family Council's Size (# of members) 3.00 3.00 11.00 4.00
Number of Firms with CEO/Chairmain Overlap 3 (100.00%) 6 (85.71%) 5 (55.56%) 7 (63.64%)
Number of Firms that consider the Board of
Directors as a protection from managers'
opportunistic behaviour
0 (0.00%) 0 (0.00%) 0 (0.00%) 3 (27.27%)
Number of Firms with Incentive Systems 0 (0.00%) 1 (14.28%) 3 (33.33%) 4 (36.36%)
Number of Firms with Internal Auditing Systems 2 (66.66%) 1 (14.28%) 7 (77.78%) 6 (54.54%)
CORPORATE GOVERNANCE
Low Openness - Low Extension Low Openness - High Extension High Openness - Low Extension High Openness - High Extension
GENERAL DATA
OWNERSHIP
MANAGEMENT
iii) Openness and Decision Making Quality. In
accordance with Gubitta and Gianecchini
(2002) findings, Italian family firms can be
divided into four categories on the basis of
the Openness Index and the Extension Index
values:
Low Openness and Low Extension. These
companies are incapable to involve
nonfamily members in their management,
ownership and corporate governance
structures; furthermore, they fail to establish
and effective hierarchy in the corporate
governance systems: as a result, they have a
low quality decision-making. These firms are
relatively old, and they are not very common.
Low Openness and High Extension. In these
firms, decision-making process is correctly
planned, but the nonfamily individuals are
and management. Like companies with both
low Openness and low Extension, their
owners, managers and directors are almost
all family members. However, these
companies are more diffused and, above all,
smaller than them: in fact, they have a lower
turnover, a lower number of employees, and
a less complex organizational structure. The
limited size of these firms probably helps
them effectively arrange their corporate
governance decision-making processes.
High Openness and Low Extension. In these
companies, external managers have an
important role in running the firm, but the
corporate governance hierarchy is not always
respected. They are relatively younger and
bigger than firms with a low Openness, the
prevailing board of directors model is the
hybrid one, and formal corporate governance
structures (executive board, family council)
are not diffused.
High Openness and High Extension. These
companies succeed in both involving
external professiona
and achieving a high decision-making
quality. They are relatively big and, although
family members still play a primary role in
the company, external individuals are
significantly involved in ownership,
management, and corporate governance.
They usually have a formal executive board,
model is the evolved one.
A larger sample of family firms would allow
reinforcing the validity of our results. By the way, we
underline that most small Italian family firms have a
sole director rather than a board of directors, and our

Corporate Ownership & Control / Volume 5, Issue 4, Summer 2008
- 102 -
sample has been selected among only those firms with
a board of directors.
A logical extension of this study includes the
performances and their corporate governance choices,
Openness and Extension. Moreover, it would be
interesting to analyze what are the main contingent
variables that are relevant to explain why a family
firm chooses a certain board of directors composition,
decides to involve nonfamily professionals in the
company, and introduces mechanisms that allow the
company to achieve a high level of Extension.
References 1. Anderson, R.C., and Reeb, D.M. (2003). Founding-
Family Ownership and Firm Performance: Evidence
from the SandP500. The Journal of Finance, Vol. 58
No.3, pp. 1301-1327.
2. Anderson, R., Sattar A., Mansi, E., and Reeb, D.M.
(2003). Founding family Ownership and the Agency
Cost of Debt. Journal of Financial Economics, Vol.
68 No.2, pp. 263-285.
3. Ang, J., Cole, R., and Lin, J. (2000). Agency Costs
and Ownership Structure. The Journal of Finance,
Vol. 55 No.1, pp. 81-106.
4. Astrachan J., Lane S., Keyt A., McMillan K., (2006).
Guidelines for Family Business Boards of Directors,
Family Business Review, Vol. 19 No. 2, pp. 147-167.
5. Berle, A., and Means, G. (1932), The Modern
Corporate and Private Property, Macmillan, New
York:, NY.
6. Baysinger B. D., Butler H. N., (1985). Corporate
Governance and the Board of Directors: Performance
Effects of Changes in Board Composition, Journal of
Law, Economics, and Organization, Vol. 1 No. 1, pp.
101-124
7. Casson, M., (1999). The economics of the family
firms. Scandinavian Economics History review, 47,
pp. 10-23.
8. Cochran, P.L., and Wartrick, S.L. (1988). Corporate
Governance A Review of the Literature, Financial
Executives Research Foundation, Morristown, NJ.
9. Corbetta, G., Gnan, L., Montemerlo, D. (2002).
Governance Systems and Company Performance in
Italian SMEs. Working Paper ISEA, Bocconi
University, Milan, Italy.
10. Cosier, R.A., and Harvey, M. (1998). The Hidden
Strength in Family Business: Functional Conflict.
Family Business Review, Vol. 11 No.1, pp. 75-79.
11. Daily, C.M, and Dollinger, M.J. (1992). An Empirical
Examination of Ownership Structure in Family and
Professionally Managed Firms. Family Business
Review, Vol. 5 No. 2, pp. 117-136.
12. Danes, S. M., Zuiker, V., Kean, R., and Arbuthnot, J.
(1999). Predictors of family business tensions and
goal achievements. Family Business Review, Vol. 12
No.3, pp. 241-252
13. Davis J.H., Schoorman, F.D., and Donaldson, L.
(1997). Toward a Stewardship Theory of
Management. The Academy of Management Review,
Vol. 22 No. 1, pp. 20-47.
14. Daily, C.M., and Dollinger, M. J. (1993). Alternative
methodologies for identifying family- versus
nonfamily-managed businesses. Journal of Small
Business Management, Vol. 31 No. 2, pp. 79-90.
15. Demsetz, H. (1972). When Does the Rule of Liability
Matter?. The Journal of Legal Studies, Vol. 1 No.1,
pp. 13-38.
16. Demsetz, H., and Lehn, K. (1985). The Structure of
Corporate Ownership: Causes and Consequences.
Journal of Political Economy, Vol. 93 No. 6, pp.
1155-1177.
17. Donaldson L., and Davis, J.H. (1991). Stewardship
Theory or Agency Theory: CEO Governance and
Shareholder Returns. Australian Journal of
Management, Vol. 16 No.1, pp. 49-64.
18. Doucouliagos, C. 1994. A note on the evolution of
homo economicus . Journal of Economic Issues, Vol.
28, pp 877- 883.
19. Dyer, W.G. (1994). Potential Contributions of
Organizational Behaviour to the Study of Family-
Owned Businesses. Family Business Review, Vol. 7
No.2, pp. 109-131.
20. Dyer, W.G. (1989). Integrating Professional
Management into a Family Owned Business. Family
Business Review, Vol. 2 No.3, pp. 221-235.
21. Fama E.F., and Jensen M.C. (1983). Separation of
ownership and control. Journal of Law and
Economics, Vol. 26 No.2, pp. 301-325.
22. Forbes D. P., Milliken F. J., (1999). Cognition and
Corporate Governance: Understanding Boards of
Directors as Strategic Decision-Making Groups, The
Academy of Management Review, Vol. 24 No. 3, pp.
489-505
23. Frank, R.H., (1994). Microeconomics and behavior.
New York: McGraw-Hill
24. Gersick, K., Davis, J., and McCollom Hampton, M.
(1997). Generation to Generation: Life Cycles of the
Family Business, Harvard Business School Press,
Boston, MA.
25. Goodstein J., Gautam K., Boeker W., (1994). The
Effects of Board Size and Diversity on Strategic
Change. Strategic Management Journal, Vol. 15 No.
3, pp. 241-250
26. Gomez- -
(2001). The role of family ties in agency contracts.
Academy of Management Journal, 44, 81-95.
27. Gubitta P., and Gianecchini M. (2002). Governance
and Flexibility in family-owned SMEs. Family
Business Review, Vol. 15 No. 4, pp. 277-297.
28. Harvey, M., and Evans, R.E. (1994). Family Business
and Multiple Levels of Conflict. Family Business
Review, Vol. 7 No.4, pp. 331-348.
29. Holland, P.G., and Oliver, J.E. (1992). An Empirical
Examination of the Stages of Development of Family
Business. Journal of Business and Entrepreneurship,
Vol. 4 No.3, pp. 27-38.
30. James, H., (1999). Owner as manager, extended
horizons and the family firm. International Journal of
the Economics Business, Vol. 6, 41-56.
31. Jain, A.K., and Dubes, R.C. (1988). Algorithms for
clustering data, Practice Hall, Upper Saddle River,
NJ.
32. Jensen M.C., Meckling, E.W. (1976). Theory of the
Firm: Managerial Behaviour, Agency Costs and
Capital Structure. Journal of Financial Economics,
Vol. 3 No. 4, pp. 305-360.
33. Johannisson, B., Huse, M. (2000). Recruiting outside
board members in the small family business: An
ideological challenge. Entrepreneurship and Regional
Development, 12(4), pp. 353-378.
Corporate Ownership & Control / Volume 5, Issue 4, Summer 2008
- 103 -
34. Johnson, R.A., Hoskisson, R.E., Hitt, M.A. (1993).
Board of director involvement in restructuring: The
effects of board versus managerial controls and
characteristics. Strategic Management Journal,
Vol.14, pp. 33-50.
35. Kets de Vries, M. (1996). Family Business: Human
dilemmas in the family firm, International Thompson
Business Press, London,,UK.Klapper L. F., Love I.,
(2004). Corporate governance, investor protection,
and performance in emerging markets, Journal of
Corporate Finance, Volume 10, Issue 5, pp. 703-728.
36. LaChapelle, K., Barnes, L. (1998). The trust catalyst
in family-owned businesses. Family Business Review,
Vol. 11 No.1, pp. 1-17.
37. Lansberg, I. (1999). Succeeding Generations:
Realizing the Dream of Families in Business, Harvard
Business School Press, Boston, MA.
38. Lynall, M.D., Golden, B.R., Hillman, A.J. (2003).
Board composition from adolescence to maturity: A
multitheoretic view. The Academy of Management
Review, Vol. 28 No. 3, pp. 416 431.
39. Macqueen, J.B. (1967). Some methods for
classification and analysis of Multivariate
Observations. Proceedings of the 5-th Berkeley
Symposium on Mathematical Statistics and
Probability, Vol. 1, pp. 281-297.
40. Muth, M.M., Donaldson, L. (1998). Stewardship
Theory and Board Structure: a Contingency
Approach. Corporate Governance: an International
Review, Vol. 6 No.1, pp.5-28.
41. Perman, S. (2006). Taking the pulse of family
business. Business week, Feb. 13, 2006.
42. Shen, W., Cannella, C. (2002). Revisiting: The
performance consequences of CEO succession, the
impacts of successor type, postsuccession senior
executive turnover, and departing CEO tenure.
Academy of Management Journal, Vol. 45 No. 4,
717 733.
43. Shleifer, A., Vishny, R. (1997). A survey of corporate
governance. The Journal of Finance, Vol. 52 No.2,
pp. 737 783.
44. Stein J.C. (1988). Takeover threats and managerial
myopia. Journal of Political Economy, Vol. 96 No.1,
pp. 61 79.
45. Stein, J.C. (1989). Efficient Capital Markets,
Inefficient Firms: A Model of Myopic Corporate
Behavior. The Quarterly Journal of Economics, Vol.
104 No.4, pp. 655-669.
46. Sundaramurthy, C., Lewis, M. (2003). Control and
collaboration: Paradoxes of governance. The Academy
of Management Review, Vol. 28 No.3, pp. 397 415.
47. Tricker, B. (1996). Pocket Director, The Economist
Books, London, UK.
48. Ward, J. (1991). Creating Effective Boards for Private
Enterprises, Jossey-Bass Publishers, San Francisco,
CA.
49. Ward, J. (1997). Growing the family business: special
challenges and best practices. Family Business
Review, Vol. 10 No.4, pp. 323-337.
50. Whisler, T.L.(1988). The role of the board in the
threshold firm. Family Business Review, Vol. 1 No.3,
pp. 309 321.
Related Documents