A Concise Taxonomy for Describing Data as an Art Material Julie Freeman * Queen Mary University of London Professor Geraint Wiggins † Queen Mary University of London Gavin Starks ‡ Open Data Institute Professor Mark Sandler § Queen Mary University of London ABSTRACT How can we describe data when used as an art material? As the number of artists using data in their work increases, so too must our ability to describe the material in a way that is understood by both specialist and general audiences alike. In this paper we review ex- isting vocabularies, glossaries, and taxonomies of data, and propose our own concise taxonomy. We present a number of examples of how existing data art works are described, and demonstrate our tax- onomy by applying it to these works. To conclude we propose the adoption of this concise taxonomy by artists, critics, and curators, and suggest that on-going refinement of the taxonomy takes place through crowd-sourced knowledge sharing on the web. Keywords: Data, art, visualization, taxonomy Index Terms: A.2 [Reference]: Taxonomies; E.m [Data]: Miscellaneous—Definitions General Terms: Professional Communication: Taxonomies, Data Visualization, Data Art 1 I NTRODUCTION Data is no longer just in the domain of engineers and scientists. In fact it never was; designers and cartographers have been visualizing data for around 3,000 years [9]. Today, data are deeply embedded within all subject domains and into our daily lives. From the mun- dane to the specialist, whether 3D printing a kidney [21], doing your washing [20], scheduling a meeting, designing a city [4, 5], or finding a partner [7], it takes some consideration to find an activity that does not involve data. As electricity is pervasive in many societies, so too is digital data 1 : it has become another layer of essential infrastructure 2 . For clarity, we will use the word data in this paper to refer to digital (binary) data specifically: machine-readable, representing a set of distinct pieces of information (datum) in a particular structure and format which describe something. So what do data mean to us? Again, like electricity, data are invisible yet necessary components in many of the systems which surround us. Enablers and disablers, data can inform decisions, help solve problems, and provide insight. In their raw format they are sets of individual values which can be manipulated, reconfigured, and transformed. This highly flexible, malleable substance is an ideal art material. Artists need to understand any material they work with so that they can use them effectively to convey their ideas. The same ap- * e-mail: [email protected] † e-mail: [email protected] ‡ e-mail: [email protected] § e-mail: [email protected] 1 Bruce Sterling, science fiction author, refers to digital data, as opposed to general data, as data which is generated with, or stored on, a computer. [27] 2 http://theodi.org/who-owns-our-data- infrastructure? Accessed 24 June 2015. plies to data, which are not usually framed as an art material. This lack of conceptualising data as an art material has led us to notice that it does not often receive adequate depth of description when mentioned in interpretation texts supporting artworks. There is a difference between experiencing works which incorporate real-time data as opposed to historical data, or which depict a so-called ‘truth’ garnered from a sample size of five participants versus 50,000 par- ticipants. To interpret the work fully these differences should be made accessible to any audience. In this paper we consider why artists use data as a material. We then look at existing vocabularies used specifically within the arts. Based on our initial findings, we propose a concise taxonomy for use in the description of data as an art material, designed for artists, curators, critics and associated general audiences. Through exam- ining how a number of artists refer to data when describing their work, we note whether or not our taxonomy terms are synonymous with the language in the practitioners descriptions. We conclude that although there are many taxonomies and vocabularies for cata- loguing art, they are not easily adoptable tools in this context, and that our concise taxonomy is more practical. 1.1 Motivation Through the definition of this working taxonomy we hope to en- courage discourse around data as an art material, and to enable comparison and critical review in a consistent manner. Our work will assist in revealing a deeper understanding of the inclusion of data in the artistic process, and help us gain insight into differences and similarities between artists in their conceptualisation, approach, and implementation of data in their work. In addition, a formal way of describing data is important as it becomes prolific as an artistic material and as data types and tools evolve. 2 ON DATA Data is a broad term that refers to collections of values which help us understand a phenomenon more deeply. It is used as a concep- tual container for the reader to fill with facts and figures. Data are measurements of all kinds, and can be used to generate more data. Euclid’s book of propositions from around 300BCE, Data [6], was written to “facilitate and promote the method of resolution or anal- ysis”, in other words to clarify what we can do with the data we have. His propositions (such as if X then Y) take givens (exist- ing datum 3 ) and enable the deduction or inference of new data—a process we are very familiar with. How would Euclid respond to today’s data-driven world? Data (with their perception of benevolent evidence) can hold the promise of a previously unseen overview 4 from a different perspec- tive, and can be the foundation of many different outputs and expe- 3 Datum is a Latin term meaning ‘something given’. In The Data Rev- olution [16] we read a quote by Jensen from 1950 (originally cited in [2]) which explains that really we should be referring to data as ‘catpta’ from the Latin ‘capere’ meaning ‘to take’. Have we lost the idea that data are a collection of things to be given, as opposed to taken [13]? 4 The Overview Effect is a photographic analogy—when the first images of the earth from outer space were broadcast it fun- damentally and irreversibly shifted our world view. http: //www.overviewinstitute.org/about-us/declaration- of-vision-and-principles. Accessed 2 June 2015 22 Proceedings of the IEEE VIS 2015 Arts Program, VISAP'15: Data Improvisations, Chicago, Illinois, October 25th-30th 2015

Welcome message from author
This document is posted to help you gain knowledge. Please leave a comment to let me know what you think about it! Share it to your friends and learn new things together.
Transcript
A Concise Taxonomy for Describing Data as an Art MaterialJulie Freeman∗
Queen Mary University of LondonProfessor Geraint Wiggins†
Queen Mary University of LondonGavin Starks‡
Open Data InstituteProfessor Mark Sandler§
Queen Mary University of London
ABSTRACT
How can we describe data when used as an art material? As thenumber of artists using data in their work increases, so too must ourability to describe the material in a way that is understood by bothspecialist and general audiences alike. In this paper we review ex-isting vocabularies, glossaries, and taxonomies of data, and proposeour own concise taxonomy. We present a number of examples ofhow existing data art works are described, and demonstrate our tax-onomy by applying it to these works. To conclude we propose theadoption of this concise taxonomy by artists, critics, and curators,and suggest that on-going refinement of the taxonomy takes placethrough crowd-sourced knowledge sharing on the web.
Keywords: Data, art, visualization, taxonomy
Index Terms: A.2 [Reference]: Taxonomies; E.m [Data]:Miscellaneous—Definitions
General Terms: Professional Communication: Taxonomies,Data Visualization, Data Art
1 INTRODUCTION
Data is no longer just in the domain of engineers and scientists. Infact it never was; designers and cartographers have been visualizingdata for around 3,000 years [9]. Today, data are deeply embeddedwithin all subject domains and into our daily lives. From the mun-dane to the specialist, whether 3D printing a kidney [21], doingyour washing [20], scheduling a meeting, designing a city [4, 5], orfinding a partner [7], it takes some consideration to find an activitythat does not involve data.
As electricity is pervasive in many societies, so too is digitaldata1: it has become another layer of essential infrastructure2. Forclarity, we will use the word data in this paper to refer to digital(binary) data specifically: machine-readable, representing a set ofdistinct pieces of information (datum) in a particular structure andformat which describe something.
So what do data mean to us? Again, like electricity, data areinvisible yet necessary components in many of the systems whichsurround us. Enablers and disablers, data can inform decisions, helpsolve problems, and provide insight. In their raw format they aresets of individual values which can be manipulated, reconfigured,and transformed. This highly flexible, malleable substance is anideal art material.
Artists need to understand any material they work with so thatthey can use them effectively to convey their ideas. The same ap-
∗e-mail: [email protected]†e-mail: [email protected]‡e-mail: [email protected]§e-mail: [email protected]
1Bruce Sterling, science fiction author, refers to digital data, as opposedto general data, as data which is generated with, or stored on, a computer.[27]
2http://theodi.org/who-owns-our-data-infrastructure? Accessed 24 June 2015.
plies to data, which are not usually framed as an art material. Thislack of conceptualising data as an art material has led us to noticethat it does not often receive adequate depth of description whenmentioned in interpretation texts supporting artworks. There is adifference between experiencing works which incorporate real-timedata as opposed to historical data, or which depict a so-called ‘truth’garnered from a sample size of five participants versus 50,000 par-ticipants. To interpret the work fully these differences should bemade accessible to any audience.
In this paper we consider why artists use data as a material. Wethen look at existing vocabularies used specifically within the arts.Based on our initial findings, we propose a concise taxonomy foruse in the description of data as an art material, designed for artists,curators, critics and associated general audiences. Through exam-ining how a number of artists refer to data when describing theirwork, we note whether or not our taxonomy terms are synonymouswith the language in the practitioners descriptions. We concludethat although there are many taxonomies and vocabularies for cata-loguing art, they are not easily adoptable tools in this context, andthat our concise taxonomy is more practical.
1.1 MotivationThrough the definition of this working taxonomy we hope to en-courage discourse around data as an art material, and to enablecomparison and critical review in a consistent manner. Our workwill assist in revealing a deeper understanding of the inclusion ofdata in the artistic process, and help us gain insight into differencesand similarities between artists in their conceptualisation, approach,and implementation of data in their work. In addition, a formal wayof describing data is important as it becomes prolific as an artisticmaterial and as data types and tools evolve.
2 ON DATA
Data is a broad term that refers to collections of values which helpus understand a phenomenon more deeply. It is used as a concep-tual container for the reader to fill with facts and figures. Data aremeasurements of all kinds, and can be used to generate more data.Euclid’s book of propositions from around 300BCE, Data [6], waswritten to “facilitate and promote the method of resolution or anal-ysis”, in other words to clarify what we can do with the data wehave. His propositions (such as if X then Y) take givens (exist-ing datum3) and enable the deduction or inference of new data—aprocess we are very familiar with. How would Euclid respond totoday’s data-driven world?
Data (with their perception of benevolent evidence) can hold thepromise of a previously unseen overview4 from a different perspec-tive, and can be the foundation of many different outputs and expe-
3Datum is a Latin term meaning ‘something given’. In The Data Rev-olution [16] we read a quote by Jensen from 1950 (originally cited in [2])which explains that really we should be referring to data as ‘catpta’ fromthe Latin ‘capere’ meaning ‘to take’. Have we lost the idea that data are acollection of things to be given, as opposed to taken [13]?
4The Overview Effect is a photographic analogy—when thefirst images of the earth from outer space were broadcast it fun-damentally and irreversibly shifted our world view. http://www.overviewinstitute.org/about-us/declaration-of-vision-and-principles. Accessed 2 June 2015
22 Proceedings of the IEEE VIS 2015 Arts Program, VISAP'15: Data Improvisations, Chicago, Illinois, October 25th-30th 2015
riences, such as graphic visualisations, artworks, animations, soundand music, narratives, tactile experiences, objects, scent, and tex-tiles, and even personalised cosmetics5.
2.1 Why Use Data as an Art Material?
As an art material6 data has a great many attributes including beinglow in cost (often free), widely available, easy to manipulate, andabundant. It can even self-replicate. This variety and depth presenta challenge to an artist who wishes to become fully proficient witha material they cannot handle directly. Although seemingly intan-gible, data can help illuminate and make sense of things we cannotsee, feel, or hear with our human senses. For an artist, it is a partic-ular medium via which to be curious about the world.
There are many different ways data can be used in an artwork.For example, it can generate the essence of the work, allowingshapes and forms to be derived from the dataset itself.7 It can be:used as a driver to generate dynamics8; mapped conscientiouslyto communicate a message; used to reveal patterns;9 or misap-propriated into artifice.10 In The Anti-Sublime Ideal in Data Art,Manovich [19] discusses mapping as the primary way of using datain art, this clearly identifies data as process but not data as material,framing it in computer science rather than fine art.
Given the ubiquity of digital technology, we argue that it is alegitimate material through which to reflect our lives, and shouldbe acknowledged as such. Data is at the heart of the current digi-tal culture. Without its prevalence, the systems we rely on—fromglobal finance through to personal communications—would fail. Itis integral to governance, economics, social accord (and discord),and of course generation of, and access to, the arts. Like the steamengine as a catalyst of the industrial revolution, and TV and radiobringing democratisation to education, data is seen as the technol-ogy that will save us. How? By giving us the raw material withwhich to expose more knowledge than ever before, that is to gaininsight beyond expectations of the past. And as we instrument theworld through sensors and mass-measurement, and data becomesinfrastructure, the language we use to describe and to criticize itbecomes paramount.
2.2 Translating Data
The impact of the delivery, type, properties, and other characteris-tics of data on the creation and experience of an artwork is signifi-cant. If the work uses real-time data from a living source, what arethe consequences of the death of the source? What does it suggestif the data transfer fails? If the data is anecdotal, or fabricated, isthat made obvious? Does it need to be? Do preconceived ideas ofdata as evidence (real or not) reinforce the artist’s intention? Doesthe intimacy of the work increase if the data is personal, or doesit heighten discomfort? Is the temporal aspect of the work true tothe data, or is the artist manipulating time? Whether the answersto these questions are of importance to the way in which the work
5Data-driven beauty http://www.fitnyc.edu/files/pdfs/Digital Analytics.pdf. Accessed 22 June 2015.
6Without getting overly semantic or physical, we chose to use the wordmaterial over medium as the word medium has greater association withtransference, data as a method to communicate, as opposed to an integralpart. In addition, digital data is formed of electrons which are classed asmatter. In this physical sense, data as material is valid. If it all ends up asphotons that’s another story.
7http://nathaliemiebach.com/gulf.html. Accessed 18June 2015.
8http://yoha.co.uk/invisible. Accessed 18 June 2015.9https://youtu.be/DYp3hV0cM30. Accessed 21 June 2015.
10http://benedikt-gross.de/log/2012/02/metrography-london-tube-map-to-large-scale-collective-mental-map. Accessed 20 June 2015.
is interpreted is up to the artist, but for comprehensive critical re-view, they are essential. Jer Thorpe11, artist and educator, author ofBeautiful Visualisation and Data Flow 2, comments:
“The biggest failure of data art, in my opinion, is inneglecting to address the individual character of a dataset. [. . . ] Almost any data set you find has some spe-cific character that could and should be addressed in avisualization—and certainly in a data art project.” [3]
The design and construction of the work can also affect how datais experienced. Obfuscation can take place within code through fil-ters, randomness, subjective programming, or biased algorithms.The aesthetic of the work can conceal or alter meaning derivedfrom the data if it is over-bearing or has some strong characteristics.As Negroponte [23] says “the signature of the machine can be toostrong”, at the same time acknowledging that the benefits of work-ing with digital materials is that “the process, not just the product,[can] be conveyed”. These thoughts point us toward refinement ofthe way data art is described, and the level of detail about the corematerial, the data, that is included in those descriptions.
3 EXISTING TAXONOMIES & VOCABULARIES
Every taxonomy has a purpose—to elucidate information within afield, to define an index, to enable meaningful relationships to bemade. Often they are created to work within existing higher levelontologies, removing accidental duplication and furthering stan-dardisation.
Cataloguing art is a wide and established field, provoking ongo-ing debate [11, 12]. Media-based arts are in constant flux as the ma-terials change continually, even whilst part of a live work. Softwareand hardware redundancy rates are high, protocols and interfaceschange and can become unusable very quickly [28]. In this oscil-lating culture we can easily mislay important developments throughan inability to log, capture and retrieve them. In addition, the lackof palpability of data elevates the need for careful metadata taggingand permanent linking as without physical actuality, the retrieval ofthe work relies solely on future audiences being able to establishits digital existence. As an example, unlike finding an Old Mas-ter in an attic, a seminal piece of net art from 1996 could easilybecome redundant: stored on a powered-down server, never to beseen again.
Following is a summary of some significant on-line artworkarchives of net art, data art, and other media art. Within thesetagging and categorising techniques are reviewed. Then followsmention of a small sample of visual taxonomies. A review of thesubstantial body of research on data visualisation categorisation andtaxonomies that focus on the semiology, syntax and visual meaningof graphics is beyond the scope of this paper.12 Two highly rele-vant and recent data glossaries are highlighted, however, there area large number of technical data taxonomies, including the W3Cdefinitions, which, again, are beyond the of scope of this paper.
3.1 The Getty Art & Architecture Thesaurus (AAT)
The AAT is a comprehensive structured vocabulary for describingand cataloguing art, architecture, and cultural heritage.13 The vo-cabularies have been released as linked open data (LOD) which theauthors believe will have “a truly transformative effect on the disci-pline of art history in general, and on Digital Art History in partic-ular.” The AAT is aimed at domain experts—curators, taxonomists,archivists. Viewable as a semantic hierarchy, in JSON, RDF, and
11http://blog.blprnt.com/about. Accessed 23 June 2015.12See work by Edward A. Tutfe, Jacques Bertin, and Jorg von Engelhardt.13http://www.getty.edu/research/tools/
vocabularies/aat/. Accessed 21 June 2015.
23 Proceedings of the IEEE VIS 2015 Arts Program, VISAP'15: Data Improvisations, Chicago, Illinois, October 25th-30th 2015

other ontological views, it is a vast set of generic terms that encom-pass a huge range of topics. It is not an easy reference to navigateand, although there are many data categories, such as metadata,data processing, data loggers, and so on, we could not locate a setof terms for describing data as a material within an artwork.
3.2 New Media Art DatabasesThe Rhizome ArtBase14, established in 1999, is one of the mostdeveloped and medium-aware of the databases in the media artsfield. The ArtBase is not just an index or catalogue, it archivesthe artworks and attempts to preserve and update them as technolo-gies progress. Rinehart [25] completed extensive work summaris-ing existing notations for creating a database and scoring systemfor artworks, underpinning this he previously described a meta-data system that would work using existing schema elements fromDublin Core and the Categories for Description of Works of Art(CDWA-lite) [24]. The schema is viewable in the appendix of Dig-ital Preservation Practices and the Rhizome ArtBase [8]. Tags dataand database are used for the works, but no comprehensive data de-scriptions are present, leaving scope for a data category to be addedto the metadata schema.
The Digital Art Archive15 is a community-led catalogue. It usesan interesting taxonomy: under the section Aesthetics are listedprocessual, sublime, vicinity, and inebriation (frenzy)—words thatare perhaps included at the point of submission by the artist. Underthe technology section more standard terms are listed: display, in-terface, and software, with more detailed tags one level below. Wesuggest that Data and the proposed sub-categories are added to thissection. This archive, due to the ability for its knowledgeable com-munity to submit content, has a good chance of becoming a highquality reference site for, amongst other genres, Data Art.
At the forefront of cataloguing networked art, Turbulence.orghas commissioned, exhibited, and archived net art for over 19 years.Their archival system is based on blog author metatags. Aside fromthe tag cloud, there is no obvious taxonomy published. An analysisof the existing metadata would be of great interest. The Turbulencewebsite is currently a static archive on the Rose Goldsen Archive ofNew Media Art16 at Cornell University Library. The Rose Goldsenarchive is a resource for CD-ROM, DVDs, and ,increasingly, on-line artworks. It is a slowly developing work in progress, and doesnot appear to use standardised cataloguing or tagging techniques atthe present time.
3.3 Visual Design TaxonomiesShneiderman [26] sets about his data type taxonomy by listingseven tasks performed on data from a user perspective: overview,zoom, filter, details-on-demand, relate, history, extract. This isfollowed by seven data types: 1-dimensional, 2-dimensional, 3-dimensional, temporal, multi-dimensional, tree, network. The tax-onomy has some useful and usable terms. The updated work byHeer and Shneiderman [15] greatly improves on this, and focusesmore deeply on the process and user, whilst dropping the data typeterms—they are only loosely referred to as examples multivariate,geospatial, textual, temporal, networked. Both these works are akey influence on the taxonomy that follows.
Visualizing.org17 has a simple taxonomy of visualisation tech-niques which is based on diagrammatic methods such as maps,charts, networks. In The Book of Trees [18], Lima explores the evo-lution of visualisation, using a visual tree language to categorise
14http://rhizome.org/artbase/. Accessed 21 June 2015.15https://www.digitalartarchive.at/nc/database/
database-info/keywords.html. Accessed 21 June 2015.16http://goldsen.library.cornell.edu/. Accessed 20 June
2015.17http://www.visualizing.org/stories/taxonomy-
data-visualization. Accessed 21 June 2015.
the techniques used, and in Visual Complexity [17] he creates hisSyntax of a New Language, also a visual reference. These visualtaxonomies are aimed at designers and complement the more de-scriptive work of Shneiderman and our proposed taxonomy.
3.4 Data GlossariesA number of comprehensive definitions of data have come fromthe relatively new (since around 2007 [1]) open data movement.Both the US and UK governments have on-line glossaries whichprovide some reference for how to label data. It is possible thatthese glossaries18 would benefit from merging. The US glossaryhas a metadata section which is a condensed version of the ProjectOpen Data metadata schema.19 Project Open Data (founded by theWhite House) has a comprehensive open data glossary and detailedmetadata schema aimed at anyone interested in open data. With itsroots in the Dublin Core Library, it is a useful and relevant resource.
3.5 SummaryIt is evident from reviewing these archives, vocabularies, and tax-onomies, that there is a lack of consistency in the language usedwhen describing data art and data visualisation. Moreover, it isonly the open data resources which mention of the type, origin, ordelivery method of data. All of the artwork archives fail to compre-hensively describe data despite them being a core material in manyworks. It could be that not conceptualising data as a material hasled to the exclusion of comprehensive descriptors from the collec-tions of terms referenced above.
4 A CONCISE TAXONOMY FOR DESCRIBING DATA
Table 1: A Concise Taxonomy for Describing Data as an Art Material
Of living Biological; EnvironmentalOf non-living ObjectOf social context Commercial; Personal; Social; StateOf licence Closed; Open; SharedOf time or space Live; Real-time; Geospatial; Static; TemporalOf type Anecdata; Causal; Generated; Metadata; Processed;
Retrieved; StreamedOf disclosure Anonymised; Identifiable; Unknown
The taxonomy (see table 1) was first compiled in 2012 by JulieFreeman during her Masters studies at Queen Mary University ofLondon (unpublished), together with Gavin Starks, from the OpenData Institute. It has since been refined through a mixture of infor-mal qualitative research, including an examination of existing dataart work descriptions, and from direct experience of working withdata artists. In addition, Freeman has worked with data as a materialin her art practise for many years.
Within an artwork, as opposed to a visualisation, the viewer isallowed flexibility in translation. An artist may have the intention ofprovoking emotion or passing comment on a subject, but we cannotassume that it is the role of the artwork to convey a certain messagedue to the use of a particular dataset.
This taxonomy is designed for artists, curators, critics, and con-sumers of any art which incorporates data as a material. It is adescriptive set of terms, that is, it eschews some technical accuracyfor classifications that are more commonly understood and easy toapply. To borrow from Guarino’s ontology definitions [14], we haveworked in a philosophical manner to create a set of words that form
18https://www.data.gov/glossary and http://data.gov.uk/glossary. Both accessed 23 June 2015.
19https://project-open-data.cio.gov/v1.1/schema. Ac-cessed 16 June 2015.
24 Proceedings of the IEEE VIS 2015 Arts Program, VISAP'15: Data Improvisations, Chicago, Illinois, October 25th-30th 2015

an informal conceptual system, which is that the terms underlie amore specific knowledge base (such as the Getty Art & Architec-ture vocabulary and the Project Open Data metadata schema). It isa challenge to represent all aspects of data in a uniform way, there-fore this taxonomy includes generic terms which guide the readertoward a richer understanding of the data, and perhaps why it isbeing used in the artwork.
We have aimed to create a concise taxonomy which enables datato be described in an objective way. Its purpose is not to describesubjective response of the viewer or listener, hence we have not in-cluded terms that can be applied to the affective descriptions of theexperience of the work, such as ‘evocative’ or ‘intimate’. We havealso avoided terms that describe the aesthetic that the data yieldsin the artwork itself such as ‘dynamic’ or ‘abstract’. We acknowl-edge that whilst useful for categorising and grouping art for somepurposes, these more subjective terms are often personal and user-defined (by the artist, curator, audience, or critic) which makes acontrolled vocabulary less effective and relevant.
The material (data) is examined from a number of perspectives—delivery method, how it emerged, format of existence, which sys-tem it represents, the source or origin, the license. In comparison,when considering a traditional art material, we may ask where itwas made, who made it, where is it from, what does it comprise of,who owns it, how does it need to be stored, does it transform or de-grade? Any number of the terms in the taxonomy may be relevantto any one artwork, and it should be used with this in mind. For ex-ample, Listening Post by Mark Hansen and Ben Rubin [22] wouldbe tagged personal, social, live, real-time, temporal, retrieved, pro-cessed, anecdata.
4.1 DefinitionsThis section contains descriptions and examples for each term inthe taxonomy as introduced above in table 1.
Living: Biological Data whose origin is directly linked tosomething that is alive. Data that occurs without conscious origin(i.e not from a human typing). Often from sensors. Examples: a)species migration reported by a sensor; b) quantified self data suchas output from a heart-rate monitor); c) a bird-call.
Living: Environmental Data whose origin is directly linked tothe natural world. Often from sensors. Examples: a) ocean temper-ature; b) solar storm activity; c) seed bank information.
Non-Living: Object Data whose origin is a physical objector device. Object data is often generated for machine to machinecommunication, however, the Internet of Things will see a greatermachine to (human) consumer communication. Examples: a) afridge’s energy use; b) a CCTV camera; c) a smart watch.
Social Context: Commercial Data produced by or about acorporate entity. Examples: a) 10 years of financial informationabout a company; b) the expiry date on a chocolate bar.
Social Context: Personal Data produced by or about an in-dividual. Certain types will have restricted access, and some legaland technical protections. Other will be accessible by some, if notall, of the general public. Examples: a) Google’s search analysisprofile of a non-anonymised individual’s interests; b) Internationaltravel logs held at border controls; c) a recording of a private tele-phone conversation; d) family photos publicly tagged on Flickr; e)your social network feed.
Social Context: Social Data produced by or about a socialgroup or society. Examples; a) global number of births each day;b) voting preference in a London borough; c) immigration figures.
Social Context: State Data produced by or about a govern-ment or ruling authority. Examples: a) the economy of the euro-zone; b) legislation documents.
Licence: Closed Closed data is generally only accessible topeople within an organisation or to certain individuals. Examples:a) company personnel files; b) national security documents.
Licence: Open Open data can be accessed, used, and sharedby anyone. Examples: a) publicly funded research data; b) earth-quake monitoring data.
Licence: Shared Shared data is data available to a specificgroup of people for a specific purpose. Examples: a) the electoralregister; b) anonymised supermarket shopping patterns.
Time/Space: Live Data which is, or was, captured in real-time. The recording does not necessarily get played-back at thesame rate, or in the same moment. Examples: a) a football matchon TV; b) animal tracking data.
Time/Space: Real-time Data that is created, captured anddisseminated in an immediate20 time-frame relative to the contextof its use; it changes over time. Examples: a) smart-meter reportingelectricity usage every 30 seconds (real-time data acquisition witha relevant-time display); b) feeds from sensors such as a webcamon a birds nest, a GPS location of a mobile phone, or a humidityreading in an gallery space.
Time/Space: Geospatial Data describing, is relevant to, oris derived from a space or geographic area. Examples: a) GPScoordinates from a cross-country walk; b) the number of peoplevisiting the Tate Modern art gallery; c) the area of a baseball pitch;d) longitude and latitude.
Time/Space: Static Data in which the items do not changeonce created, but the dataset can grow over time. Includes histor-ical datasets and archive indexes. Examples: a) historical globalpopulation size; b) a recording in the sound archive at the BritishLibrary.
Time/Space: Temporal Data which is time-based in its na-ture, relevant to a specific time, or which may only exist for a shorttime period (transient). Examples: a) the value of a kilogram of riceover time; b) your date of birth; c) the radio signals received froman exploding star.
Type: Anecdata Anecdotal information gathered and thenpresented as evidence. Anecdata is often not precisely measurable,has no reliable provenance, is hard to compare, and/or cannot beunproven by the scientific method. Examples: a) a collection ofcomments on a product website; b) proverbs such as “Never look agift horse in the mouth”.
Type: Causal Data in which it is (or is made) obvious to theobserver what its origin is. Example: a vocal recording.
Type: Generated Data created by a software program. Exam-ples: a) algorithmic music; b) cellular automaton; c) a model of agalaxy exploding.
Type: Metadata Data about data. Data which describes in-formation about other data. Examples: a) the number of rows in adatabase; b) the time and date a phone call was made.
Type: Processed Data which has been calculated, altered orprocessed in some way. Examples: a) a sonification of stock marketfigures; b) aggregated statistics; c) a colourful digital photographreduced to black and white.
20Immediate is approximate, and assumes some minimal systemlatency. In a video stream end-to-end latency would be due to en-coding, post-processing, network processing, buffering, decoding,and pre-processing (see http://www.cast-inc.com/blog/white-paper-understanding-and-reducing-latency-in-video-compression-systems). Accessed 20 June 2015. Foracceptable latency times that ensure user engagement varies, refer to JakobNielsen’s work.
25 Proceedings of the IEEE VIS 2015 Arts Program, VISAP'15: Data Improvisations, Chicago, Illinois, October 25th-30th 2015
Type: Retrieved Data made available on request by machineor user. Examples: a) compilation of weather data from the past 24hours as a single CSV file; b) availability status of a library book.
Type: Streamed The technical means of delivering real-timedata as a contiguous stream. The primary use-cases are where thereis no requirement for data storage, or that the data-sets involved aretoo large to be manipulated in any other manner (the entire Twitterback catalogue). Examples: a) real-time audio and video from acarnival procession; b) on-demand replay of a film from 1960; c)music playing from a digital radio.
Disclosure: Anonymised Data that has had any identifiableinformation about a person, animal, or thing removed. Exam-ples: a) CCTV camera footage containing people which have beenblurred or obfuscated; b) all bicycle hire users across a city withuser IDs and names removed.
Disclosure: Identifiable Data in which the direct sourcewithin it (person, animal, or thing) can be identified. Examples: a)a Facebook data export including friend names; b) a set of mobilephone numbers with owner address details.
Disclosure: Unknown Data which contains informationabout a person, animal, or thing but in which it is not clear if itis adequately anonymised. Examples: a) a live Twitter feed con-taining some geolocated photos of people and animals; b) a soundrecording from a public space that includes ambient conversation.
4.2 Additional Dataset ParametersThere are aspects of data that are useful to explore in the processof understanding datasets which are not included in the taxonomy.These tend toward more technical descriptions and are used byarchivists and preservation experts. The W3C Data on the Web BestPractices Use Cases & Requirements Note21, recommends these el-ements are used for defining data: domains, obligation/motivation,usage, quality, lineage, size, type/format, rate of change, data lifes-pan, potential audience. We recommend considering the following,particularly for retrieval, maintenance, and archival purposes of theartwork (see table 2).
4.3 A Note on LicensingThe taxonomy includes reference to open, shared and closed li-cences. It is important to note that datasets are nearly all issued un-der some form of restriction. Even open datasets (available for free,to reuse, for any purpose) can have attribution requirements. Withinartwork, which by default has copyright assigned to the artist, it isimperative that the use of a restricted material within it is acknowl-edged. Freeman’s recent work, We Need Us, uses real-time opendata from zooniverse.org. As the core material in the artwork isopen, the ability for her to completely own the work outright is im-possible. Therefore, the work has a series of different licences thatapply to various elements and uses of the work.22 Using certaintypes of data as an art material requires us to reconsider ownershipof the work.
4.4 A Note on Privacy and Anonymised DataMuch of the data used within artwork can be directly attributed toits source. Indeed, the revelation of the source often confers a largepart of the meaning of the artwork. In the taxonomy the Of Disclo-sure category includes anonymised, identifiable and unknown tags.Whereas in other categories unknown is not specifically required,the declaration of using data in which it is not known whether it isanonymised is important.
21http://www.w3.org/TR/dwbp-ucr. Accessed 20 June 2015.22Licence details http://weneedus.org/webpages/
licence.htm and artwork http://www.weneedus.org. Bothaccessed 22 June 2015.
Table 2: Additional Dataset Parameters
Accuracy How exact are the individual data points (e.g. if it isreal-time data is there latency to acknowledge).
Utility Does the data have potential to provide utility by provid-ing new content or insight, is this important to the work?
Provenance Scientific datasets should be reproducible, others shouldbe collated from, or by, reliable sources. Any bias shouldbe declared or detected.
Context Does this dataset provide meaning through its relation-ships to other datasets (for comparative interest, for rati-fication)?
Relevancy Are the data points relevant to each other, to someone orsomething (e.g. a machine)?
Accessibility How and by whom can the dataset be accessed and used(licensing rights, availability, database rights), and is thisreliable and future-proof?
Format What is the structure and format (technical data structureand/or data definition, distribution)?
Dimensionality How many dimensions are represented (e.g. a pointagainst time, a number of parameters)?
Size The order of magnitude of the number of data points,the sample size (e.g. 1 or 1 million). Often impreciselyreferred to as large (big) data or small data.
Endless War23 by YoHa (with Matthew Fuller) uses the wik-ileaked Afghan War Diaries as it’s core material. This data con-tains ”. . . over 91,000 (15,000 withheld) reports covering the warin Afghanistan from 2004 to 2010. The reports were written bysoldiers and intelligence officers. . . ”. The work takes a month tovisualise the data set presenting the potential to reveal closed, con-fidential, but identifiable data—an aspect of the work that gives itgravitas and relevance.
Paolo Cirio’s work Face to Facebook24 uses shared, easy to ac-quire, but unauthorised and identifiable scraped data to create a fic-titious dating website. The controversy of the action would notexist if the data did not link us directly to real people. Further,Cirio sources hard-to-acquire identifiable data in Overexposed25, awork which publicly displays billboard sized photos of unautho-rised high-ranking U.S. intelligence officials. Taking officials whohope to remain anonymous and putting them into public view usesthe power of anonymity to make the work anything other than aseries of photos on walls.
The disclosure section of the taxonomy requires more thought,including consideration on whether animals and certain objectshave rights to privacy, and whether re-dentification possibilitiesthrough merging multiple datasets renders absolute anonymity pos-sible.26
23http://yoha.co.uk/node/761. Accessed 20 August 2015.24http://www.paolocirio.net/work/face-to-facebook.
Accessed 20 August 2015.25http://www.paolocirio.net/work/hd-stencils/
overexposed. Accessed 20 August 2015.26The UK government have produced an Anonymisation Code
of Practice for personal data: https://ico.org.uk/media/for-organisations/documents/1061/anonymisation-code.pdf. Also see http://ukanon.net. Both accessed 20 August2015.
26 Proceedings of the IEEE VIS 2015 Arts Program, VISAP'15: Data Improvisations, Chicago, Illinois, October 25th-30th 2015
5 USING THE TAXONOMY
During the development of this taxonomy a small database27 of dataart has been maintained as a resource for applying the terms to ex-isting works. The database contains works which sit on a spectrumspanning fine art to visualisation tools to technical display, althoughmany pieces are hard to pinpoint precisely on this scale. From thisdatabase we have selected five exemplars, choosing works fromartists with varying levels of experience, technical expertise, andexposure. Visual, sonic, installations, screen and non-screen basedworks are included. We aimed to select both known and possiblyunknown works in an attempt to represent a broad range of prac-titioners. For more case studies please refer to the database—itcontains around 40 works that have been tagged using our taxon-omy. Through a review of both the short descriptions and longertexts (where available), we look at how the artist refers to data, andthen apply terms from our vocabulary.
5.1 dataMorphose (2009) by Christiane Keller
Figure 1: dataMorphose by Christiane Keller
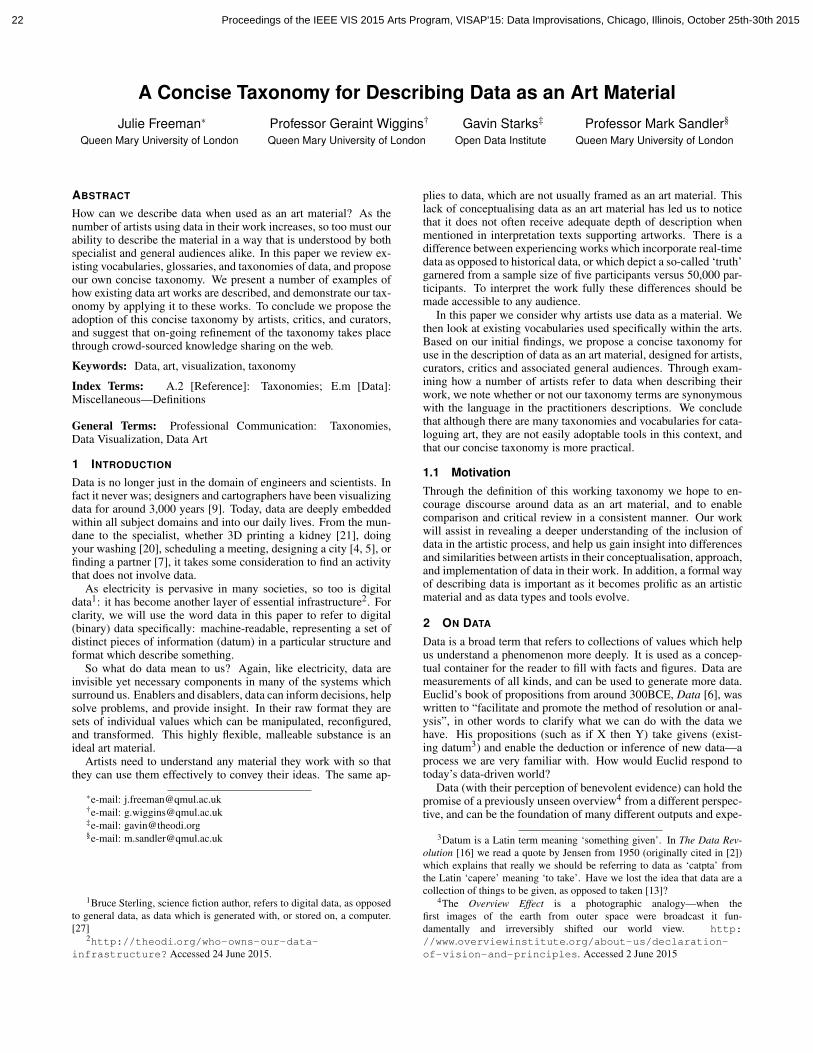
This work (see figure 1) is a physical representation of data. It isan example in which data is fundamental to the work conceptuallyand aesthetically. Summarising the work, the artist states:
‘‘dataMorphose is an interactive installation whichprojects data into real space and visualizes it three-dimensionally. Information is represented by spannedand moving sails directly in the room. Thus abstractand virtual data becomes real and tangible. As theuser takes new positions and perspectives, he canexperience a completely novel and sensual perceptionof data. Three spatial displays visualize statisticaldata, web activities and the current time. The codingand procurement of data is visualized by the tensionof the canvas, the pace of movement, the position of thecanvas and the change of their shape.”From http://www.christianekeller.de/datamorphose. Accessed 20 June 2015. Emphasisadded.
Keller refers to generic “data” a number of times, “information”,and “abstract and virtual data”. She goes some way to explain thedata in more detail in the phrase “statistical data, web activities andthe current time”. Applying our taxonomy we try to describe thethree datasets in more detail. Current time is a straight forwardconcept—real-time, live, retrieved, temporal and geospatial (it isalways associated with a time zone). It is also open (public do-main). For “web activities” we could make the assumption that thedata is real-time, retrieved, shared, metadata based on the sourcescited (Google Trends, Google Insights for Search). As we do notknow the origin, type, and context, we are left unable to categorisethe data further (unknown). The term “statistical data” also leavesus without clarity. We can assume only inclusion of processed data
27http://translatingdata.org. Accessed 22 August 2015.
(that the values are the output from some statistical analysis). Inthe longer description the artist refers simply to “values and param-eters” but without any details. Keller also refers to the “coding andprocurement of data” being visualized in the work, however, de-spite reading the extended description it is hard to ascertain whatthis means. We conclude that the work seeks to demonstrate kineticpotential of data through physical form with the content of the dataitself of little relevance to this.
5.2 A Conversation Between Trees (2012) by Active In-gredient
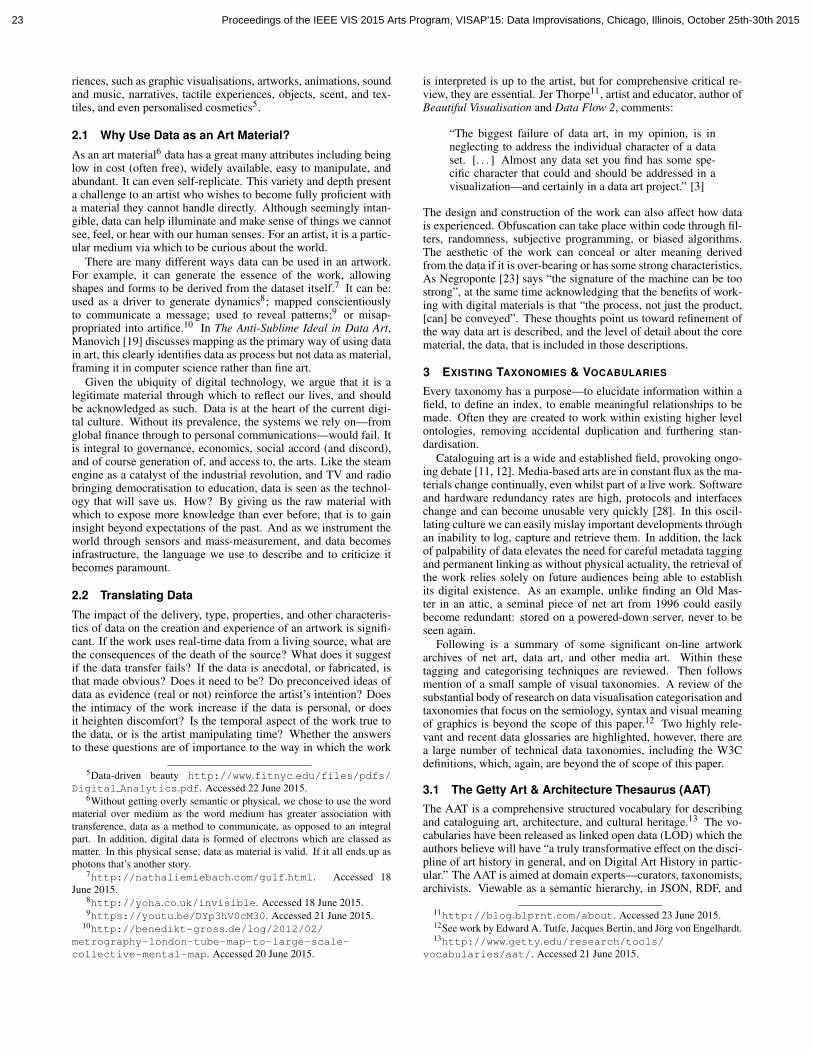
Figure 2: A Conversation Between Trees by Active Ingredient. Partialinstallation view
A Conversation Between Trees (see figure 2) uses a number ofdata sources, each bringing something to the experience—real-timesensor data mixed with scientific records. It is the meeting of thepast and the present that reinforces the artistic concept about a needto act now for climate change.
“[A Conversation Between Trees is] an exhibition thatgenerates clues of the climate and history of our forestsin the UK and Brazil. . . a screen flickers and glows witha dynamic 3D visualisation of changes in temperature,humidity, light, decibels, colour and CO2 collectedfrom trees in both forests. Hanging from the ceilingis a full set of global C02 data scorched into circularsheets. Each sheet shows a year of changes in C02levels in the Earth’s atmosphere as a scorched ring. Theprints will show a steady annual increase recordedover the last 53 years since scientific records began. Abox attached to tree branches in both locations, containssensors that sense levels of temperature, humidity,C02, light, colour and sound levels, which is sent liveto the gallery via the internet.”From http://hello-tree.com/exhibition.Accessed 20 June 2015. Emphasis added.
In the longer descriptive text the artists refer to environmental, tem-poral, real-time, streamed, static, processed and metadata albeit inless direct terms. Some references to ‘live’ are used to mean real-time. There are elements of assumption here too, that the reader willunderstand that data is informing change in the artwork, rather thanthe heat or humidity themselves, this enables us to add the identifi-able tag. The description of the project and the variety of data usedas a material, could benefit from using standardised keywords fromthe taxonomy to enable clearer categorisation and comparison.
5.3 Mori (1999) by Ken Goldberg, Randall Packer, Gre-gory Kuhn, and Wojciech Matusik
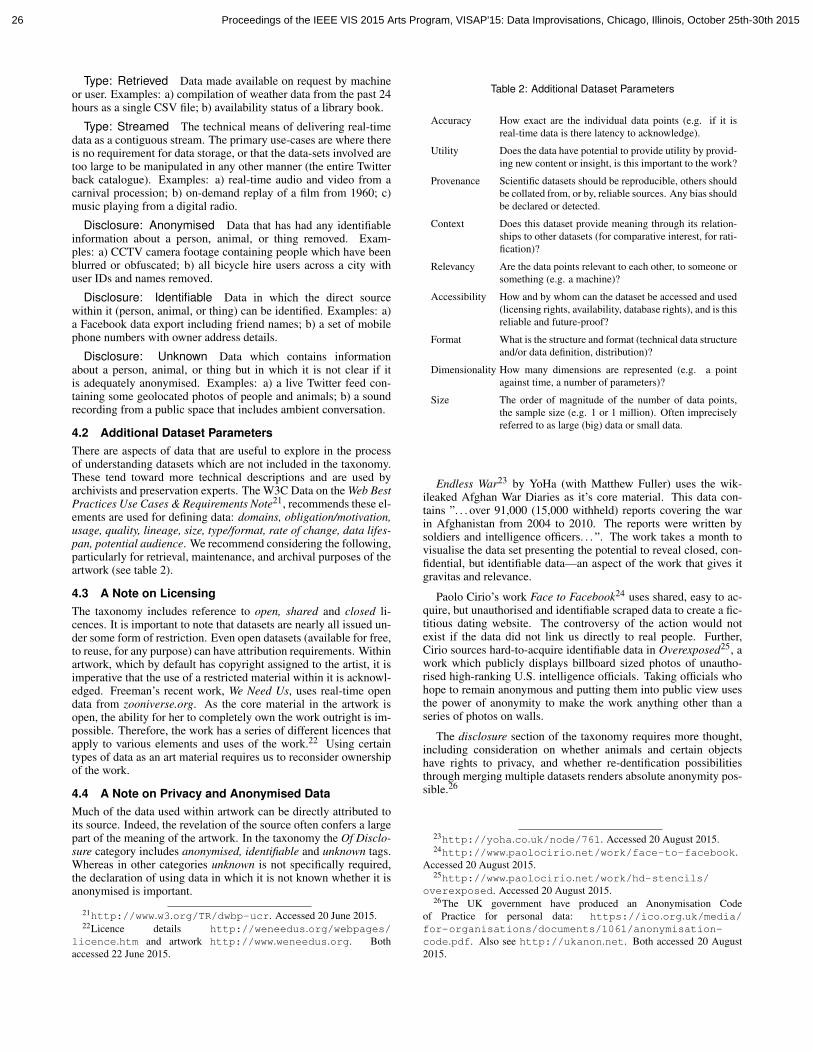
Mori (see figure 3) is an early example of data art. It began as aminimal visual on-line work in 1998 and was developed into an
27 Proceedings of the IEEE VIS 2015 Arts Program, VISAP'15: Data Improvisations, Chicago, Illinois, October 25th-30th 2015

Figure 3: Mori: an internet-based earthwork by Ken Goldberg, Ran-dall Packer, Gregory Kuhn, and Wojciech Matusik (1999). Phototaken at at ICC Tokyo, November 1999, by Takasi Otaka
installation and on-line audio work 1999 and 2003, using the samesource of live data.
“Mori engages the earth as a living medium. Minutemovements of the Hayward Fault in California aredetected by a seismograph, converted to digital signals,and transmitted continuously via the Internet to theinstallation. Inside the entry curtain, visitors followa fiber optic cable to the center of the resonatingenclosure, where a portal through the floor frames theinstallation’s focal point. The live seismic data streamdrives an embedded visual display and immersivelow-frequency sounds, which echo the unpredictablefluctuations of the earth’s movement.”From http://goldberg.berkeley.edu/art/mori. Accessed 20 August 2015. Emphasis added.
The work employs data that is live, real-time, environmental, shared(this may well be classified as open now), streamed, identifiable,geospatial, and temporal. The artists description is comprehensive,clearly reflecting on the importance of the data to convey the alive-ness of the work. A recent (2013) development of Mori is an on-linevisualisation, called Bloom produced in collaboration with SanjayKrishnan, Fernanda Viegas, and Martin Wattenberg.28
5.4 The Shaping Grows (2012) by Semiconductor
Figure 4: The Shaping Grows by Semiconductor. Image: David Lev-ene
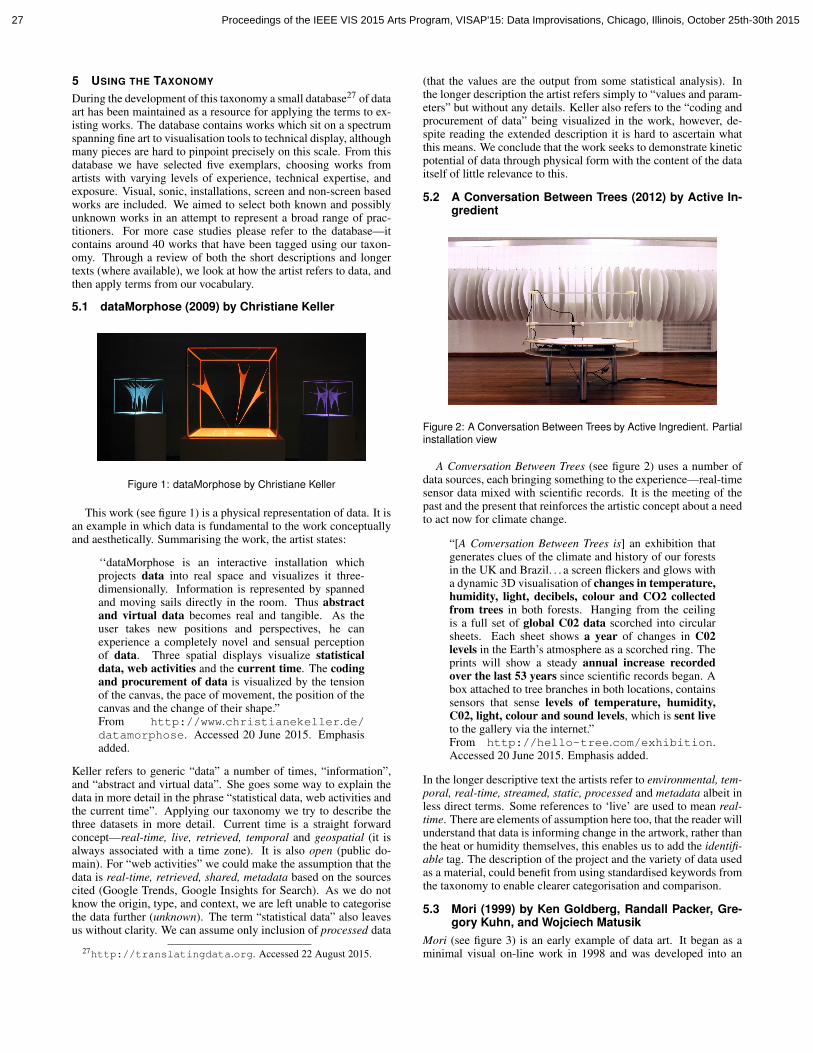
This sonic and visual installation (see figure 4) uses real worlddata to influence dynamic animation. The artists appear to havesought to generate a sense of aliveness within the work, even thoughthe data is not in real-time.
28http://goldberg.berkeley.edu/art/Bloom. Accessed 20August 2015.
“The Shaping Grows is a computer generated anima-tion of a subterranean cavern, brought to life throughseismic data. . . The animation spans multiple timeframes condensing geological events and processesthrough time-lapse techniques. . . crystals can becomeconsumed by larger formations or play host to wildlydifferent structures, as physical conditions changeover time and favour certain elemental and chemicalreactions. . . objects store the memory of their makingand can be read to learn the story of their evolution andthe conditions in which they grew. Semiconductor havecollected seismic data of recent earthquake activityfrom around the world and converted it into sound.This directly animates and controls the formations andprovides a sound-scape of the Earth in a state of flux.”From http://semiconductorfilms.com/art/the-shaping-grows. Accessed 20 June2015. Emphasis added.
This work has a multi-layered approach to data, and is on thewhole well described. The work contains static, environmental,geospatial, temporal, processed, identifiable, and generative data.These are referred to in the description explicitly—processed andgenerated—and obliquely as “time-lapse techniques” and “multi-ple time frames”. The minimal description reads: 03.00 minuteloop, 4 channel HD + 4 channel audio, and yet the core materialin the work which “directly animates and controls” it is seismic (en-vironmental) data. The general description provides a good sense ofthe data in the work demonstrating the artists comprehension of thematerial. However, we suggest that even in the minimal materialsdescription data could be acknowledged.
5.5 The Live Wire (1995) by Natalie Jeremijenko
Figure 5: The Live Wire (1995)
A simple yet effective artwork that relied on data as a core mate-rial, The Live Wire (see figure 5), was developed by Natalie Jeremi-jenko whilst she was artist-in-residence at Xerox PARC in 1995.
“The Live Wire is a 3D, real-time network traffic indica-tor. It is actually a material manifestation of cyberspace.Plugging into a local area network, it wiggles propor-tionally to the amount of traffic on the net. With eachdata package it convulses and sets up standing waves.It is placed in the spectacularly banal office environmentof the glamorous Xerox Park Computer Science Lab, theplace where WYSIWYG, Macintosh interface, ethernetand many other things were invented [. . . ] Live Wirecould be another graph on your computer screen, a real-time 3D rendering of network traffic, [. . . ] But in-stead it is in the periphery, in the shared physical space.”Edited from http://tech90s.walkerart.org/
28 Proceedings of the IEEE VIS 2015 Arts Program, VISAP'15: Data Improvisations, Chicago, Illinois, October 25th-30th 2015
nj/transcript/nj 04.html. Accessed 20 Au-gust 2015. Emphasis added.
The work is a fundamental representation of a data stream. It con-tains real-time, live, closed, temporal, anonymised, streamed data,all of which are easy to ascertain from the description. We havechosen to use the closed tag as it is unlikely that the local area net-work traffic information would be made available to anyone outsideof Xerox PARC.
6 CONCLUSION
The concise taxonomy for describing data used as an art materialhas been developed collaboratively and applied to a sample of art-works as a method of testing its usability and relevance. This pro-cess has highlighted that artists describe data in different ways mak-ing cross-referencing and comparison difficult, and that there is alack of standardised terms to refer to.
We note that the Getty vocabularies are complex, and are mainlyused by domain experts. The aim of our taxonomy is to create an ac-cessible, and adoptable, way of categorising data as an art material.We view the work as a neighbourly accompaniment to Heer andShneiderman’s taxonomy of interactive dynamics for visual analy-sis, and as a potential addition to the Digital Art Archive.
Current development work on the taxonomy includes pub-lic and targeted surveys, and its release on GitHub (seehttps://github.com/misslake/taxonomy-for-data-as-art-material/) toencourage a comments and suggestions for on-going improvement.Through this public collaboration we aspire to contribute to theProject Open Data metadata schema, and perhaps the Getty vo-cabularies themselves. We also invite contributions to the data artdatabase found at http://translatingdata.org, which, in time, will beavailable as open data.
We conclude that the proposed taxonomy will be an aid to thosearchiving and cataloguing works in the future, but more importantlyits light-weight nature should encourage use by practitioners, thosenew to the field of data art, and beyond29. In the words of Gillespie[10], we hope that it is
“specific enough to mean something, and vague enoughto work across multiple [areas] for multiple audiences.”
The taxonomy prompts us to think about data as a material, andas such an essential component of any artwork which demands fulldisclosure.
ACKNOWLEDGEMENTS
This work is supported by the Media and Arts Technology pro-gramme, EPSRC Doctoral Training Centre EP/G03723X/1. Theauthors wish to thank our anonymous reviewers for their valuablecontributions.
REFERENCES
[1] S. Auer, C. Bizer, G. Kobilarov, J. Lehmann, R. Cyganiak, and Z. Ives.Dbpedia: A nucleus for a web of open data. In Proceedings of the6th International The Semantic Web and 2nd Asian Conference onAsian Semantic Web Conference, ISWC’07/ASWC’07, pages 722–735, Berlin, Heidelberg, 2007. Springer-Verlag.
[2] H. Becker. Science, Culture, and Society. Philosophy of Science,19(4):273, Oct. 1952.
[3] K. Buford. Data Art vs. Visualization? The Dis-tinction is Unproductive, says Artist Jer Thorpe.http://siliconangle.com/blog/2012/08/22/data-art-vs-visualization-the-distinction-is-unproductive-says-artist-jer-thorp-qa/ . Aug.2012.
29As citizens become more familiar with data through the growing inter-est in the Internet of Things, this taxonomy is relevant here too.
[4] A. Caragliu, C. Del Bo, and P. Nijkamp. Smart Cities in Europe.Journal of Urban Technology, 18(2):65–82, Apr. 2011.
[5] H. Chourabi, T. Nam, S. Walker, J. R. Gil-Garcia, S. Mellouli, K. Na-hon, T. A. Pardo, and H. J. Scholl. Understanding Smart Cities: AnIntegrative Framework. In 2012 45th Hawaii International Confer-ence on System Sciences (HICSS), pages 2289–2297. IEEE.
[6] Euclides, R. Simson, and W. Rutherford. The Elements of Euclid(translation), 1854.
[7] E. J. Finkel, P. W. Eastwick, B. R. Karney, H. T. Reis, and S. Sprecher.Online Dating: A Critical Analysis From the Perspective of Psycho-logical Science. Psychological Science in the Public Interest, 13(1):3–66, Mar. 2012.
[8] B. Fino-Radin. Digital Preservation Practices and the Rhi-zome ArtBase. http://media.rhizome.org/artbase/documents/Digital-Preservation-Practices-and-the-Rhizome-ArtBase.pdf , July 2011.
[9] M. Friendly and D. J. Denis. Milestones in the history ofthematic cartography, statistical graphics, and data visualization.http://www.datavis.ca/milestones. 2001.
[10] T. Gillespie. The politics of platforms. New Media & Society,12(3):347–364, 2010.
[11] B. Graham. Taxonomies Of New Media Art – Real World Namings.In Museums and the Web 2005: Proceedings. Archives & MuseumInformatics, Mar. 2005.
[12] B. Graham. Edits from a CRUMB discussion list theme. CuratingImmateriality: The Work of the Curator in the . . . , 2006.
[13] G. Greenwald. No Place to Hide. Edward Snowden, the NSA, and theU.S. Surveillance State. Metropolitan Books, May 2014.
[14] N. Guarino. Formal Ontology in Information Systems. Proceedingsof the 1st International Conference June 6-8, 1998, Trento, Italy. IosPressInc, 1998.
[15] J. Heer and B. Shneiderman. Interactive Dynamics for Visual Analy-sis. Queue, 10(2):30, Feb. 2012.
[16] R. Kitchin. The Data Revolution. Big Data, Open Data, Data Infras-tructures and Their Consequences. SAGE, Aug. 2014.
[17] M. Lima. Visual Complexity. Mapping Patterns of Information.Princeton Architectural Press, Aug. 2013.
[18] M. Lima. The Book of Trees. Visualizing Branches of Knowledge.Princeton Architectural Press, Apr. 2014.
[19] L. Manovich. The Anti-Sublime Ideal in Data Art. http://www.manovich.net/DOCS/data art.doc, Aug. 2002.
[20] R. M. Milasi, C. Lucas, and B. N. Araabi. Intelligent modeling andcontrol of washing machine using LLNF modeling and modified BEL-BIC. Control and Automation, 2005.
[21] V. Mironov, T. Boland, T. Trusk, G. Forgacs, and R. R. Markwald. Or-gan printing: computer-aided jet-based 3D tissue engineering. Trendsin Biotechnology, 21(4):157–161, Apr. 2003.
[22] W. Modes. Revisiting the technical achievements of listening post tenyears on. The Journal of New Media & Culture, 9(1), Winter 2014.
[23] N. Negroponte. Being Digital. Vintage, 1996.[24] R. Rinehart. Preserving the Rhizome ArtBase.
http://media.rhizome.org/artbase/documents/Preserving-the-Rhizome-ArtBase.pdf , July 2002.
[25] R. Rinehart. A System of Formal Notation forScoring Works of Digital and Variable Media Art.http://www.bampfa.berkeley.edu/about/formalnotation.pdf , June2005.
[26] B. Shneiderman. The eyes have it: a task by data type taxonomy forinformation visualizations. In Visual Languages, 1996. Proceedings.,IEEE Symposium on, pages 336–343, Sept. 1996.
[27] B. Sterling. Digital Decay in Permanence Through Change: The Vari-able Media Approach, July 2003.
[28] M. O. Ward. A taxonomy of glyph placement strategies for multidi-mensional data visualization. Information Visualization, 1(3-4):194–210, Dec. 2002.
29 Proceedings of the IEEE VIS 2015 Arts Program, VISAP'15: Data Improvisations, Chicago, Illinois, October 25th-30th 2015
Related Documents