Genome Biology 2009, 10:R30 Open Access 2009 Akerman et al. Volume 10, Issue 3, Article R30 Method A computational approach for genome-wide mapping of splicing factor binding sites Martin Akerman * , Hilda David-Eden * , Ron Y Pinter † and Yael Mandel- Gutfreund * Addresses: * Department of Biology, the Technion - Israel Institute of Technology, Haifa 32000, Israel. † Department of Computer Science, Technion - Israel Institute of Technology, Haifa 32000, Israel. Correspondence: Yael Mandel-Gutfreund. Email: [email protected] © 2009 Akerman et al.; licensee BioMed Central Ltd. This is an open access article distributed under the terms of the Creative Commons Attribution License (http://creativecommons.org/licenses/by/2.0), which permits unrestricted use, distribution, and reproduction in any medium, provided the original work is properly cited. Mapping splicing factor binding sites <p>A computational method is presented for genome-wide mapping of splicing factor binding sites that considers both the genomic envi- ronment and evolutionary conservation.</p> Abstract Alternative splicing is regulated by splicing factors that serve as positive or negative effectors, interacting with regulatory elements along exons and introns. Here we present a novel computational method for genome-wide mapping of splicing factor binding sites that considers both the genomic environment and the evolutionary conservation of the regulatory elements. The method was applied to study the regulation of different alternative splicing events, uncovering an interesting network of interactions among splicing factors. Background Alternative splicing (AS) is a post-transcriptional process responsible for producing distinct protein isoforms as well as down-regulation of translation. Many experimental and com- putational studies revealed that AS can be regulated in a tis- sue-specific manner [1-4] during embryonic development [5] or in response to particular cellular stimuli [6]. AS regulation is known to be mediated by many splicing factors (SFs), gen- erally belonging to the serine-arginine-rich (SR) and hetero- geneous nuclear ribonucleoprotein (hnRNP) families [7]. These SFs can instigate positive or negative effects on the splicing reaction by differentially interacting with exonic or intronic splicing enhancers and silencers. SFs tend to assemble into a large complex known as the spli- ceosome [8]. Despite their remarkable diversity, SFs share common characteristics. Several SFs, such as the polypyrimi- dine tract-binding protein (PTB) [9] and hnRNP A1 [10], bind the pre-mRNA in multimeric units. In several cases the bind- ing sites are found in relatively long RNA stretches, such as the polypyrimidine tract that harbors binding sites for PTB and CELF proteins [11], the poly U sequences (length 5-10 nucleotides) that bind the TIA1/TIAL1 proteins [12], and G- rich sequences (between one to several G triplets) that have been shown to bind the hnRNP H/F [13]. Another example is the NOVA-1 splicing factor, which was reported to bind clus- ters of YCAY sequences that are specifically located nearby the splice sites of alternatively spliced exons [14]. The prefer- ence of some of the SFs to bind consecutive elements can par- tially be explained by the modularity of their structure, usually possessing several RNA recognition motifs (RRMs), which are involved in RNA binding [15]. As is true with many regulatory sequences, splicing regula- tory elements tend to be conserved among species [16]. These results are consistent with the overall high evolutionary con- servation levels observed in AS-related introns [17,18] and in the codon wobble position of alternative exons [19]. Further- more, high evolutionary conservation has been associated with constitutive splicing. In a recent study, Voelker and co- Published: 18 March 2009 Genome Biology 2009, 10:R30 (doi:10.1186/gb-2009-10-3-r30) Received: 18 December 2008 Revised: 26 February 2009 Accepted: 18 March 2009 The electronic version of this article is the complete one and can be found online at http://genomebiology.com/2009/10/3/R30

Welcome message from author
This document is posted to help you gain knowledge. Please leave a comment to let me know what you think about it! Share it to your friends and learn new things together.
Transcript
Open Access2009Akermanet al.Volume 10, Issue 3, Article R30MethodA computational approach for genome-wide mapping of splicing factor binding sitesMartin Akerman*, Hilda David-Eden*, Ron Y Pinter† and Yael Mandel-Gutfreund*
Addresses: *Department of Biology, the Technion - Israel Institute of Technology, Haifa 32000, Israel. †Department of Computer Science, Technion - Israel Institute of Technology, Haifa 32000, Israel.
Correspondence: Yael Mandel-Gutfreund. Email: [email protected]
© 2009 Akerman et al.; licensee BioMed Central Ltd. This is an open access article distributed under the terms of the Creative Commons Attribution License (http://creativecommons.org/licenses/by/2.0), which permits unrestricted use, distribution, and reproduction in any medium, provided the original work is properly cited.Mapping splicing factor binding sites<p>A computational method is presented for genome-wide mapping of splicing factor binding sites that considers both the genomic envi-ronment and evolutionary conservation.</p>
Abstract
Alternative splicing is regulated by splicing factors that serve as positive or negative effectors,interacting with regulatory elements along exons and introns. Here we present a novelcomputational method for genome-wide mapping of splicing factor binding sites that considers boththe genomic environment and the evolutionary conservation of the regulatory elements. Themethod was applied to study the regulation of different alternative splicing events, uncovering aninteresting network of interactions among splicing factors.
BackgroundAlternative splicing (AS) is a post-transcriptional processresponsible for producing distinct protein isoforms as well asdown-regulation of translation. Many experimental and com-putational studies revealed that AS can be regulated in a tis-sue-specific manner [1-4] during embryonic development [5]or in response to particular cellular stimuli [6]. AS regulationis known to be mediated by many splicing factors (SFs), gen-erally belonging to the serine-arginine-rich (SR) and hetero-geneous nuclear ribonucleoprotein (hnRNP) families [7].These SFs can instigate positive or negative effects on thesplicing reaction by differentially interacting with exonic orintronic splicing enhancers and silencers.
SFs tend to assemble into a large complex known as the spli-ceosome [8]. Despite their remarkable diversity, SFs sharecommon characteristics. Several SFs, such as the polypyrimi-dine tract-binding protein (PTB) [9] and hnRNP A1 [10], bindthe pre-mRNA in multimeric units. In several cases the bind-ing sites are found in relatively long RNA stretches, such as
the polypyrimidine tract that harbors binding sites for PTBand CELF proteins [11], the poly U sequences (length 5-10nucleotides) that bind the TIA1/TIAL1 proteins [12], and G-rich sequences (between one to several G triplets) that havebeen shown to bind the hnRNP H/F [13]. Another example isthe NOVA-1 splicing factor, which was reported to bind clus-ters of YCAY sequences that are specifically located nearbythe splice sites of alternatively spliced exons [14]. The prefer-ence of some of the SFs to bind consecutive elements can par-tially be explained by the modularity of their structure,usually possessing several RNA recognition motifs (RRMs),which are involved in RNA binding [15].
As is true with many regulatory sequences, splicing regula-tory elements tend to be conserved among species [16]. Theseresults are consistent with the overall high evolutionary con-servation levels observed in AS-related introns [17,18] and inthe codon wobble position of alternative exons [19]. Further-more, high evolutionary conservation has been associatedwith constitutive splicing. In a recent study, Voelker and co-
Published: 18 March 2009
Genome Biology 2009, 10:R30 (doi:10.1186/gb-2009-10-3-r30)
Received: 18 December 2008Revised: 26 February 2009Accepted: 18 March 2009
The electronic version of this article is the complete one and can be found online at http://genomebiology.com/2009/10/3/R30
Genome Biology 2009, 10:R30
http://genomebiology.com/2009/10/3/R30 Genome Biology 2009, Volume 10, Issue 3, Article R30 Akerman et al. R30.2
authors [20] identified sequence motifs that resemble cis-regulatory binding sites and that were found to be conservedin constitutive exons of six eutherian mammals. Unexpect-edly high evolutionary conservation was also observed inupstream distal splice sites in tandem acceptors that are con-stitutively spliced [21]. Clustering of evolutionarily conservedcis-regulatory elements has been previously demonstratedfor transcription factors binding sites. Recent transcriptionfactors binding site prediction tools have demonstrated thatconsideration of neighboring effects dramatically improvesprediction performance compared to strategies that consideronly a single site [22-25].
In recent years, several methodologies for identifying splicingfactor binding sites (SFBSs) have been developed [19,26-29].Generally, these methods employ two major approaches: sta-tistical methods based on overabundance of motifs in regula-tory regions (for example, [27]); and methods that are basedon identifying motifs from experimental binding data (forexample, [26]); for a review, see [30]. Several statisticalapproaches for searching splicing regulatory motifs, such asthat of Goren et al. [19], have also considered evolution con-servation. Overall, the available methods concentrate on thecore binding motif and do not consider genomic informationfrom flanking regions. Here we present a novel computa-tional approach for predicting and mapping SFBSs of knownsplicing factors that considers both the genomic environmentas well as the evolutionary conservation of the splicing factorcis-regulatory elements. The method was trained and testedon experimentally validated sequences, displaying high accu-racy of 93% with a relatively low false positive rate of 1% onthe tested data. In addition, the method was applied to differ-ent sets of exons and introns, and detected an enrichment ofSFBSs in different types of AS, such as cassette exons (CEs),alternative donors (ADs), and alternative acceptors (AAs),compared to constitutive exons. Furthermore, we used ourmethod to study splicing regulatory circuits connecting thesubset of splicing factors that were available in our dataset.Careful analysis of the splicing network's structure revealeddistinct features, characteristic of other regulatory networks,such as transcription networks. Specifically, we identifiedclear differences between tissue-specific versus broadlyexpressed SFs.
Results and discussionA method for mapping splicing factor binding sitesDuring the splicing process, many SFs bind and detach fromthe pre-mRNA at both the exonic and intronic sequencesflanking the splice sites. To accommodate for such dynamicinteractions, most SFs bind short (4-10 nucleotide) anddegenerate sequences (Table S1 in Additional data file 1)[11,14,26,31-53]. As a result, SFBSs are difficult to predictbased on motif profiles alone. In order to improve SFBS pre-diction, we sought to consider sequence information derivedfrom their genomic context as well as evolutionary informa-
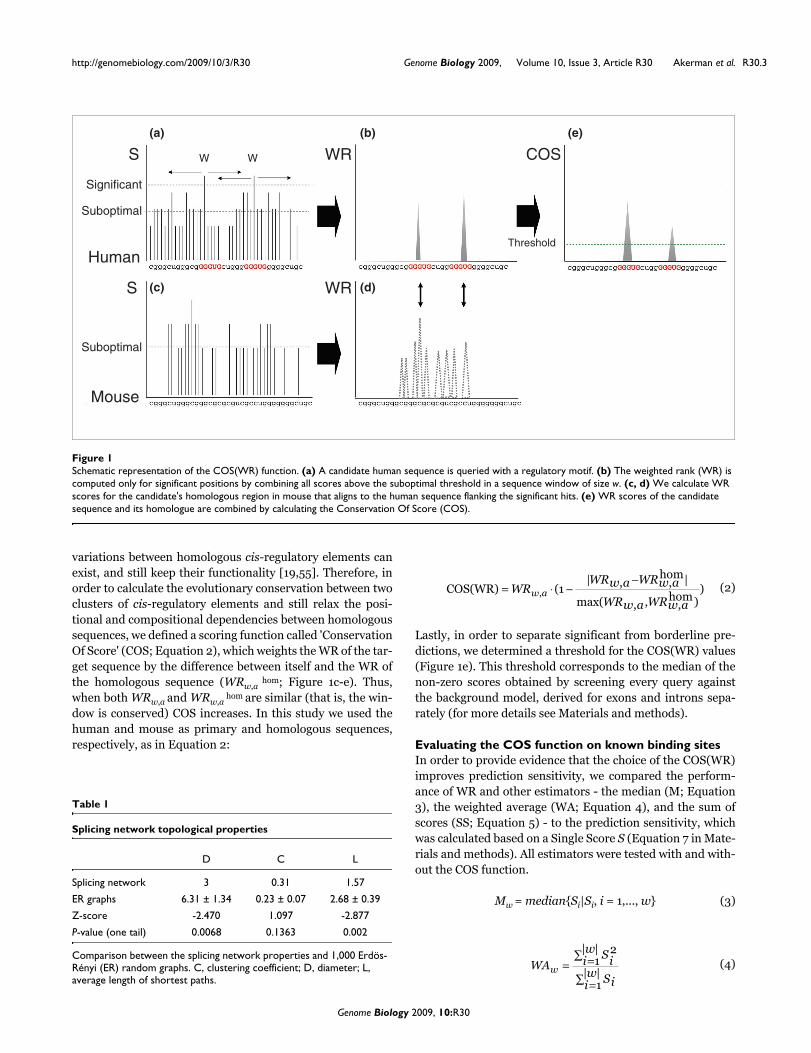
tion. The rationale behind our method relies on two mainassumptions: sequence signals flanking a binding motif areinformative for binding site recognition; and binding sitestend to be evolutionarily conserved. A diagram of the proce-dure is illustrated in Figure 1.
Multiplicity scoreAs a first step to identify SFBSs, we search a target sequencefor a match to a known binding motif. For this purpose abinding motif is represented as a consensus sequence, usingthe IUPAC definition. The list of binding motifs used in thisstudy to test the algorithm is given in Table S1 in Additionaldata file 1. The list was generated from the literature asdescribed in the Materials and methods section and itincludes only motifs that were experimentally verified (seereferences in Table 1). Subsequently, each sequence wasscored for a match, as described in detail in the Materials andmethods section. Upon identifying a significant match to asingle motif (Ssig; see Materials and methods), we extendedour search to a sequence window of size w flanking Ssig,searching for other short sequences that resemble thesequence of the query motif. Our assumption was that weaksignals around the protein binding sites may aid in attractingthe SFs to their binding sites, which are generally of lowsequence specificity [54]. In addition, though it is not generalto all SFs, some splicing regulatory proteins such as NOVA-1[14] tend to bind to clusters of short binding motifs. In orderto account for lower scored hits around a significant hit, wedefined a threshold for suboptimal (Ssub) hits (see Materialsand methods). We then calculated a multiplicity score for thewhole window by combining all Ssig and Ssub within w (Figure1a). The window size was chosen in the training procedure,described below (Table S2 in Additional data file 1). The mul-tiplicity score was computed using a weighted rank (WR) esti-mation approach (Figure 1b), described in Equation 1. TheWR approach was applied here in an attempt to boost thecontribution of the high-scored hits within the window (pre-sumably the real binding sites) while lowering the noise fromsuboptimal (that is, lower affinity sites) and non-significanthits:
- where S1 S2 ... S|w|.
WRw,a corresponds to the sum of Ssig and Ssub values decreas-ingly ranked and divided by the rth power of a, where r is theposition of the value in the ranked list and a is chosen to be asmall integer (for example, 2).
Conservation of scoreCalculating the conservation of short cis-regulatory elementsis not trivial, since in most cases the sequence specificity of agiven SF is not limited to a unique arrangement of nucleotidesbut rather to a group of similar k-mers. In addition, positional
WR a Sw ar
rr
w
,
| |= −
=∑ 1(1)
Genome Biology 2009, 10:R30
http://genomebiology.com/2009/10/3/R30 Genome Biology 2009, Volume 10, Issue 3, Article R30 Akerman et al. R30.3
variations between homologous cis-regulatory elements canexist, and still keep their functionality [19,55]. Therefore, inorder to calculate the evolutionary conservation between twoclusters of cis-regulatory elements and still relax the posi-tional and compositional dependencies between homologoussequences, we defined a scoring function called 'ConservationOf Score' (COS; Equation 2), which weights the WR of the tar-get sequence by the difference between itself and the WR ofthe homologous sequence (WRw,a
hom; Figure 1c-e). Thus,when both WRw,a and WRw,a
hom are similar (that is, the win-dow is conserved) COS increases. In this study we used thehuman and mouse as primary and homologous sequences,respectively, as in Equation 2:
Lastly, in order to separate significant from borderline pre-dictions, we determined a threshold for the COS(WR) values(Figure 1e). This threshold corresponds to the median of thenon-zero scores obtained by screening every query againstthe background model, derived for exons and introns sepa-rately (for more details see Materials and methods).
Evaluating the COS function on known binding sitesIn order to provide evidence that the choice of the COS(WR)improves prediction sensitivity, we compared the perform-ance of WR and other estimators - the median (M; Equation3), the weighted average (WA; Equation 4), and the sum ofscores (SS; Equation 5) - to the prediction sensitivity, whichwas calculated based on a Single Score S (Equation 7 in Mate-rials and methods). All estimators were tested with and with-out the COS function.
Mw = median{Si|Si, i = 1,..., w} (3)
COS(WR) = ⋅ −−
WRWRw a WRw a
WRw a WRw aw a, (
| , ,hom|
max( , , ,hom)
)1 (2)
WASii
w
Siiww = =∑
=∑
21
1
| |
| |(4)
Schematic representation of the COS(WR) functionFigure 1Schematic representation of the COS(WR) function. (a) A candidate human sequence is queried with a regulatory motif. (b) The weighted rank (WR) is computed only for significant positions by combining all scores above the suboptimal threshold in a sequence window of size w. (c, d) We calculate WR scores for the candidate's homologous region in mouse that aligns to the human sequence flanking the significant hits. (e) WR scores of the candidate sequence and its homologue are combined by calculating the Conservation Of Score (COS).
S
Significant
Suboptimal
Suboptimal
Human
Mouse
S
(a)
(c)
W W WR
WR
(b)
(d)
COS(e)
Threshold
Table 1
Splicing network topological properties
D C L
Splicing network 3 0.31 1.57
ER graphs 6.31 ± 1.34 0.23 ± 0.07 2.68 ± 0.39
Z-score -2.470 1.097 -2.877
P-value (one tail) 0.0068 0.1363 0.002
Comparison between the splicing network properties and 1,000 Erdös-Rényi (ER) random graphs. C, clustering coefficient; D, diameter; L, average length of shortest paths.
Genome Biology 2009, 10:R30
http://genomebiology.com/2009/10/3/R30 Genome Biology 2009, Volume 10, Issue 3, Article R30 Akerman et al. R30.4
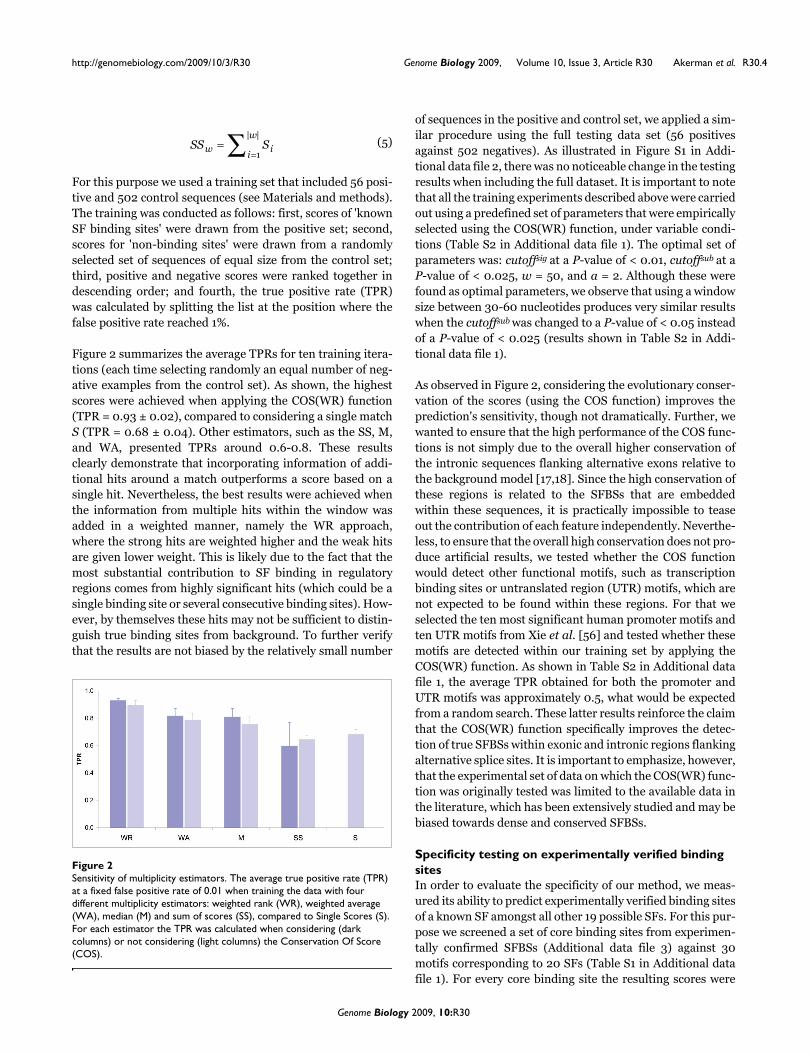
For this purpose we used a training set that included 56 posi-tive and 502 control sequences (see Materials and methods).The training was conducted as follows: first, scores of 'knownSF binding sites' were drawn from the positive set; second,scores for 'non-binding sites' were drawn from a randomlyselected set of sequences of equal size from the control set;third, positive and negative scores were ranked together indescending order; and fourth, the true positive rate (TPR)was calculated by splitting the list at the position where thefalse positive rate reached 1%.
Figure 2 summarizes the average TPRs for ten training itera-tions (each time selecting randomly an equal number of neg-ative examples from the control set). As shown, the highestscores were achieved when applying the COS(WR) function(TPR = 0.93 ± 0.02), compared to considering a single matchS (TPR = 0.68 ± 0.04). Other estimators, such as the SS, M,and WA, presented TPRs around 0.6-0.8. These resultsclearly demonstrate that incorporating information of addi-tional hits around a match outperforms a score based on asingle hit. Nevertheless, the best results were achieved whenthe information from multiple hits within the window wasadded in a weighted manner, namely the WR approach,where the strong hits are weighted higher and the weak hitsare given lower weight. This is likely due to the fact that themost substantial contribution to SF binding in regulatoryregions comes from highly significant hits (which could be asingle binding site or several consecutive binding sites). How-ever, by themselves these hits may not be sufficient to distin-guish true binding sites from background. To further verifythat the results are not biased by the relatively small number
of sequences in the positive and control set, we applied a sim-ilar procedure using the full testing data set (56 positivesagainst 502 negatives). As illustrated in Figure S1 in Addi-tional data file 2, there was no noticeable change in the testingresults when including the full dataset. It is important to notethat all the training experiments described above were carriedout using a predefined set of parameters that were empiricallyselected using the COS(WR) function, under variable condi-tions (Table S2 in Additional data file 1). The optimal set ofparameters was: cutoffsig at a P-value of < 0.01, cutoffsub at aP-value of < 0.025, w = 50, and a = 2. Although these werefound as optimal parameters, we observe that using a windowsize between 30-60 nucleotides produces very similar resultswhen the cutoffsub was changed to a P-value of < 0.05 insteadof a P-value of < 0.025 (results shown in Table S2 in Addi-tional data file 1).
As observed in Figure 2, considering the evolutionary conser-vation of the scores (using the COS function) improves theprediction's sensitivity, though not dramatically. Further, wewanted to ensure that the high performance of the COS func-tions is not simply due to the overall higher conservation ofthe intronic sequences flanking alternative exons relative tothe background model [17,18]. Since the high conservation ofthese regions is related to the SFBSs that are embeddedwithin these sequences, it is practically impossible to teaseout the contribution of each feature independently. Neverthe-less, to ensure that the overall high conservation does not pro-duce artificial results, we tested whether the COS functionwould detect other functional motifs, such as transcriptionbinding sites or untranslated region (UTR) motifs, which arenot expected to be found within these regions. For that weselected the ten most significant human promoter motifs andten UTR motifs from Xie et al. [56] and tested whether thesemotifs are detected within our training set by applying theCOS(WR) function. As shown in Table S2 in Additional datafile 1, the average TPR obtained for both the promoter andUTR motifs was approximately 0.5, what would be expectedfrom a random search. These latter results reinforce the claimthat the COS(WR) function specifically improves the detec-tion of true SFBSs within exonic and intronic regions flankingalternative splice sites. It is important to emphasize, however,that the experimental set of data on which the COS(WR) func-tion was originally tested was limited to the available data inthe literature, which has been extensively studied and may bebiased towards dense and conserved SFBSs.
Specificity testing on experimentally verified binding sitesIn order to evaluate the specificity of our method, we meas-ured its ability to predict experimentally verified binding sitesof a known SF amongst all other 19 possible SFs. For this pur-pose we screened a set of core binding sites from experimen-tally confirmed SFBSs (Additional data file 3) against 30motifs corresponding to 20 SFs (Table S1 in Additional datafile 1). For every core binding site the resulting scores were
SS Sw ii
w=
=∑ 1
| |(5)
Sensitivity of multiplicity estimatorsFigure 2Sensitivity of multiplicity estimators. The average true positive rate (TPR) at a fixed false positive rate of 0.01 when training the data with four different multiplicity estimators: weighted rank (WR), weighted average (WA), median (M) and sum of scores (SS), compared to Single Scores (S). For each estimator the TPR was calculated when considering (dark columns) or not considering (light columns) the Conservation Of Score (COS).
Genome Biology 2009, 10:R30
http://genomebiology.com/2009/10/3/R30 Genome Biology 2009, Volume 10, Issue 3, Article R30 Akerman et al. R30.5
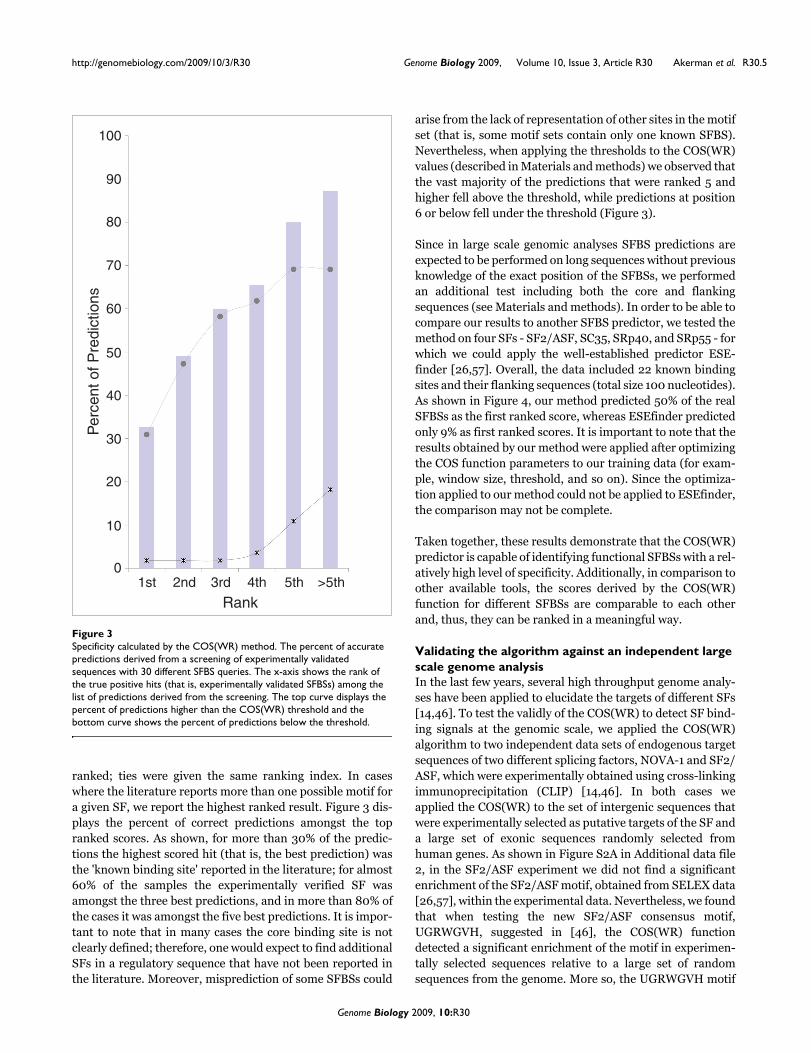
ranked; ties were given the same ranking index. In caseswhere the literature reports more than one possible motif fora given SF, we report the highest ranked result. Figure 3 dis-plays the percent of correct predictions amongst the topranked scores. As shown, for more than 30% of the predic-tions the highest scored hit (that is, the best prediction) wasthe 'known binding site' reported in the literature; for almost60% of the samples the experimentally verified SF wasamongst the three best predictions, and in more than 80% ofthe cases it was amongst the five best predictions. It is impor-tant to note that in many cases the core binding site is notclearly defined; therefore, one would expect to find additionalSFs in a regulatory sequence that have not been reported inthe literature. Moreover, misprediction of some SFBSs could
arise from the lack of representation of other sites in the motifset (that is, some motif sets contain only one known SFBS).Nevertheless, when applying the thresholds to the COS(WR)values (described in Materials and methods) we observed thatthe vast majority of the predictions that were ranked 5 andhigher fell above the threshold, while predictions at position6 or below fell under the threshold (Figure 3).
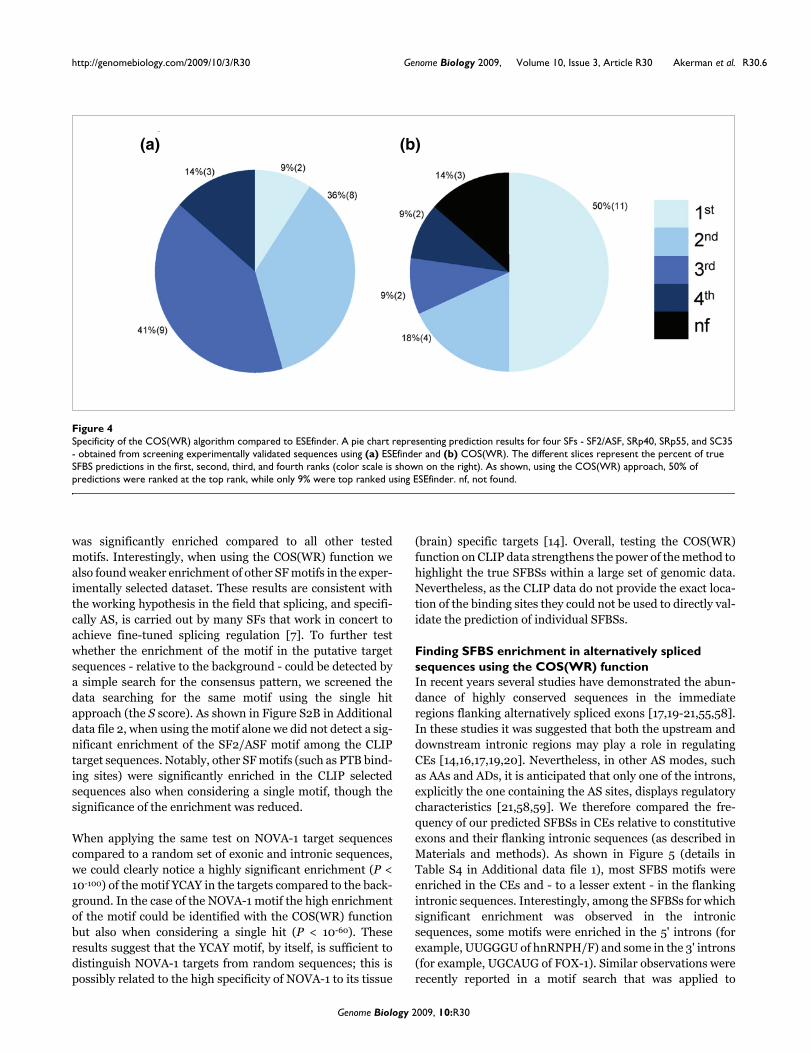
Since in large scale genomic analyses SFBS predictions areexpected to be performed on long sequences without previousknowledge of the exact position of the SFBSs, we performedan additional test including both the core and flankingsequences (see Materials and methods). In order to be able tocompare our results to another SFBS predictor, we tested themethod on four SFs - SF2/ASF, SC35, SRp40, and SRp55 - forwhich we could apply the well-established predictor ESE-finder [26,57]. Overall, the data included 22 known bindingsites and their flanking sequences (total size 100 nucleotides).As shown in Figure 4, our method predicted 50% of the realSFBSs as the first ranked score, whereas ESEfinder predictedonly 9% as first ranked scores. It is important to note that theresults obtained by our method were applied after optimizingthe COS function parameters to our training data (for exam-ple, window size, threshold, and so on). Since the optimiza-tion applied to our method could not be applied to ESEfinder,the comparison may not be complete.
Taken together, these results demonstrate that the COS(WR)predictor is capable of identifying functional SFBSs with a rel-atively high level of specificity. Additionally, in comparison toother available tools, the scores derived by the COS(WR)function for different SFBSs are comparable to each otherand, thus, they can be ranked in a meaningful way.
Validating the algorithm against an independent large scale genome analysisIn the last few years, several high throughput genome analy-ses have been applied to elucidate the targets of different SFs[14,46]. To test the validly of the COS(WR) to detect SF bind-ing signals at the genomic scale, we applied the COS(WR)algorithm to two independent data sets of endogenous targetsequences of two different splicing factors, NOVA-1 and SF2/ASF, which were experimentally obtained using cross-linkingimmunoprecipitation (CLIP) [14,46]. In both cases weapplied the COS(WR) to the set of intergenic sequences thatwere experimentally selected as putative targets of the SF anda large set of exonic sequences randomly selected fromhuman genes. As shown in Figure S2A in Additional data file2, in the SF2/ASF experiment we did not find a significantenrichment of the SF2/ASF motif, obtained from SELEX data[26,57], within the experimental data. Nevertheless, we foundthat when testing the new SF2/ASF consensus motif,UGRWGVH, suggested in [46], the COS(WR) functiondetected a significant enrichment of the motif in experimen-tally selected sequences relative to a large set of randomsequences from the genome. More so, the UGRWGVH motif
Specificity calculated by the COS(WR) methodFigure 3Specificity calculated by the COS(WR) method. The percent of accurate predictions derived from a screening of experimentally validated sequences with 30 different SFBS queries. The x-axis shows the rank of the true positive hits (that is, experimentally validated SFBSs) among the list of predictions derived from the screening. The top curve displays the percent of predictions higher than the COS(WR) threshold and the bottom curve shows the percent of predictions below the threshold.
Per
cent
of P
redi
ctio
ns
Rank1st 2nd 3rd 4th 5th >5th
0
10
20
30
40
50
60
70
80
90
100
Genome Biology 2009, 10:R30
http://genomebiology.com/2009/10/3/R30 Genome Biology 2009, Volume 10, Issue 3, Article R30 Akerman et al. R30.6
was significantly enriched compared to all other testedmotifs. Interestingly, when using the COS(WR) function wealso found weaker enrichment of other SF motifs in the exper-imentally selected dataset. These results are consistent withthe working hypothesis in the field that splicing, and specifi-cally AS, is carried out by many SFs that work in concert toachieve fine-tuned splicing regulation [7]. To further testwhether the enrichment of the motif in the putative targetsequences - relative to the background - could be detected bya simple search for the consensus pattern, we screened thedata searching for the same motif using the single hitapproach (the S score). As shown in Figure S2B in Additionaldata file 2, when using the motif alone we did not detect a sig-nificant enrichment of the SF2/ASF motif among the CLIPtarget sequences. Notably, other SF motifs (such as PTB bind-ing sites) were significantly enriched in the CLIP selectedsequences also when considering a single motif, though thesignificance of the enrichment was reduced.
When applying the same test on NOVA-1 target sequencescompared to a random set of exonic and intronic sequences,we could clearly notice a highly significant enrichment (P <10-100) of the motif YCAY in the targets compared to the back-ground. In the case of the NOVA-1 motif the high enrichmentof the motif could be identified with the COS(WR) functionbut also when considering a single hit (P < 10-60). Theseresults suggest that the YCAY motif, by itself, is sufficient todistinguish NOVA-1 targets from random sequences; this ispossibly related to the high specificity of NOVA-1 to its tissue
(brain) specific targets [14]. Overall, testing the COS(WR)function on CLIP data strengthens the power of the method tohighlight the true SFBSs within a large set of genomic data.Nevertheless, as the CLIP data do not provide the exact loca-tion of the binding sites they could not be used to directly val-idate the prediction of individual SFBSs.
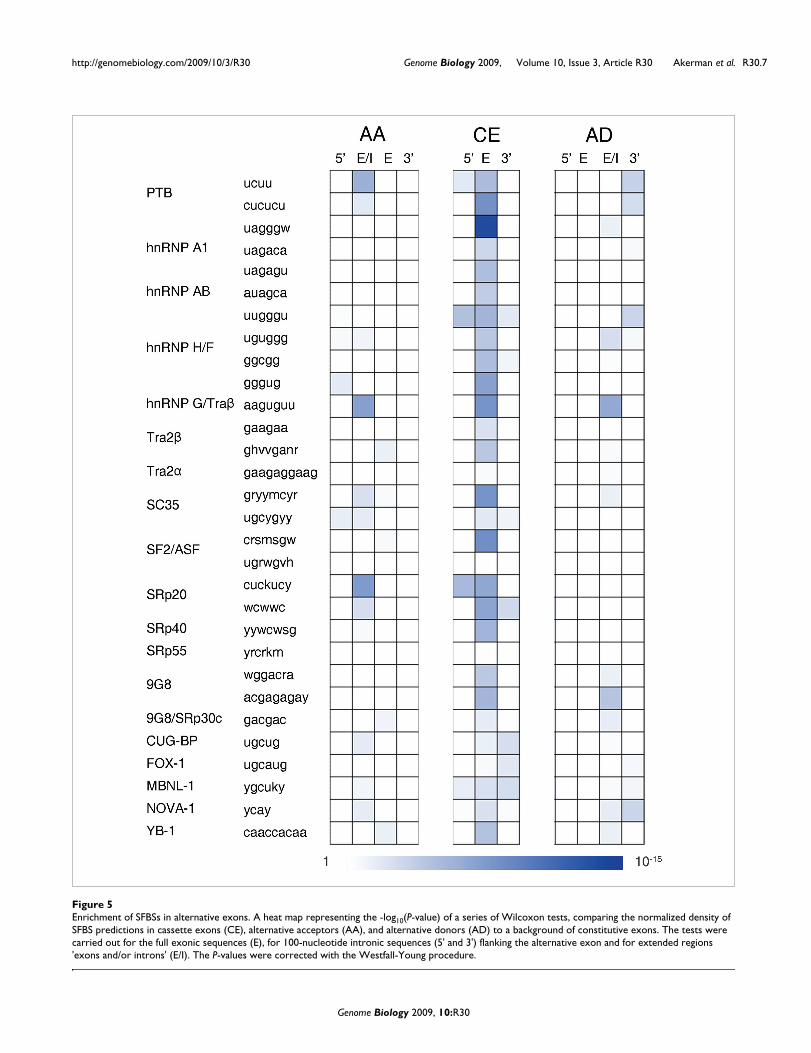
Finding SFBS enrichment in alternatively spliced sequences using the COS(WR) functionIn recent years several studies have demonstrated the abun-dance of highly conserved sequences in the immediateregions flanking alternatively spliced exons [17,19-21,55,58].In these studies it was suggested that both the upstream anddownstream intronic regions may play a role in regulatingCEs [14,16,17,19,20]. Nevertheless, in other AS modes, suchas AAs and ADs, it is anticipated that only one of the introns,explicitly the one containing the AS sites, displays regulatorycharacteristics [21,58,59]. We therefore compared the fre-quency of our predicted SFBSs in CEs relative to constitutiveexons and their flanking intronic sequences (as described inMaterials and methods). As shown in Figure 5 (details inTable S4 in Additional data file 1), most SFBS motifs wereenriched in the CEs and - to a lesser extent - in the flankingintronic sequences. Interestingly, among the SFBSs for whichsignificant enrichment was observed in the intronicsequences, some motifs were enriched in the 5' introns (forexample, UUGGGU of hnRNPH/F) and some in the 3' introns(for example, UGCAUG of FOX-1). Similar observations wererecently reported in a motif search that was applied to
Specificity of the COS(WR) algorithm compared to ESEfinderFigure 4Specificity of the COS(WR) algorithm compared to ESEfinder. A pie chart representing prediction results for four SFs - SF2/ASF, SRp40, SRp55, and SC35 - obtained from screening experimentally validated sequences using (a) ESEfinder and (b) COS(WR). The different slices represent the percent of true SFBS predictions in the first, second, third, and fourth ranks (color scale is shown on the right). As shown, using the COS(WR) approach, 50% of predictions were ranked at the top rank, while only 9% were top ranked using ESEfinder. nf, not found.
(a) (b)
Genome Biology 2009, 10:R30
http://genomebiology.com/2009/10/3/R30 Genome Biology 2009, Volume 10, Issue 3, Article R30 Akerman et al. R30.7
Genome Biology 2009, 10:R30
Enrichment of SFBSs in alternative exonsFigure 5Enrichment of SFBSs in alternative exons. A heat map representing the -log10(P-value) of a series of Wilcoxon tests, comparing the normalized density of SFBS predictions in cassette exons (CE), alternative acceptors (AA), and alternative donors (AD) to a background of constitutive exons. The tests were carried out for the full exonic sequences (E), for 100-nucleotide intronic sequences (5' and 3') flanking the alternative exon and for extended regions 'exons and/or introns' (E/I). The P-values were corrected with the Westfall-Young procedure.
http://genomebiology.com/2009/10/3/R30 Genome Biology 2009, Volume 10, Issue 3, Article R30 Akerman et al. R30.8
intronic regions flanking tissue-specific CEs derived from anexpression compendium of human AS events [60]. Asexpected, the AA exons were mainly enriched in SFBSs in the5' introns, but not in the 3' introns. Correspondingly, the ADexons were enriched with SFBSs in the 3' introns but not inthe 5' introns. As demonstrated in Figure 5, for both AAs andADs the enrichment was specifically found in the extendedregion 'exon and/or intron' (E/I), which - depending on thealternative event - could be either an exonic or an intronicregion. Overall, the genomic regions flanking AA and ADsplicing events were less enriched with SFBSs compared toequivalent regions near constitutive events. It is important tonote that when applying a similar enrichment analysis usingthe simple S function (as opposed to COS(WR)) no significantenrichment of binding sites in the AS events relative to con-stitutive splicing was detected (see Table S5 in Additionaldata file 1 and Figure S3 in Additional data file 2).
The patterns of enrichment that we observe when mappingSFBSs with the COS(WR) function on alternative exons rein-forces the strength of our method in filtering true SFBSs. Inaddition, further interesting observations can be derivedfrom this study. First, we observe that CEs display a largervariety of enriched SFBSs, compared to AAs and ADs, espe-cially on the exonic sequence itself. Second, in the CE group,in several cases (such as hnRNPH/F and SRp20) bindingsites of the same factor (usually different motifs) wereenriched on both flanking introns. This is in accordance withAS models suggesting cross-talk between the 5' and 3' splicesites [10,61]. The enrichment of PTB binding sites in alterna-tive versus constitutive splicing reinforces the prominent roleof PTB in AS in addition to its basal role in splicing regulationof constitutive events [62]. Finally, we observed that severalSFBSs were specifically enriched in the AA group (for exam-ple, SRp20) or in the AD group (for example, 9G8), while oth-ers (for example, hnRNPG/Tra2) seem to be equallyenriched in both groups (Figure 5).
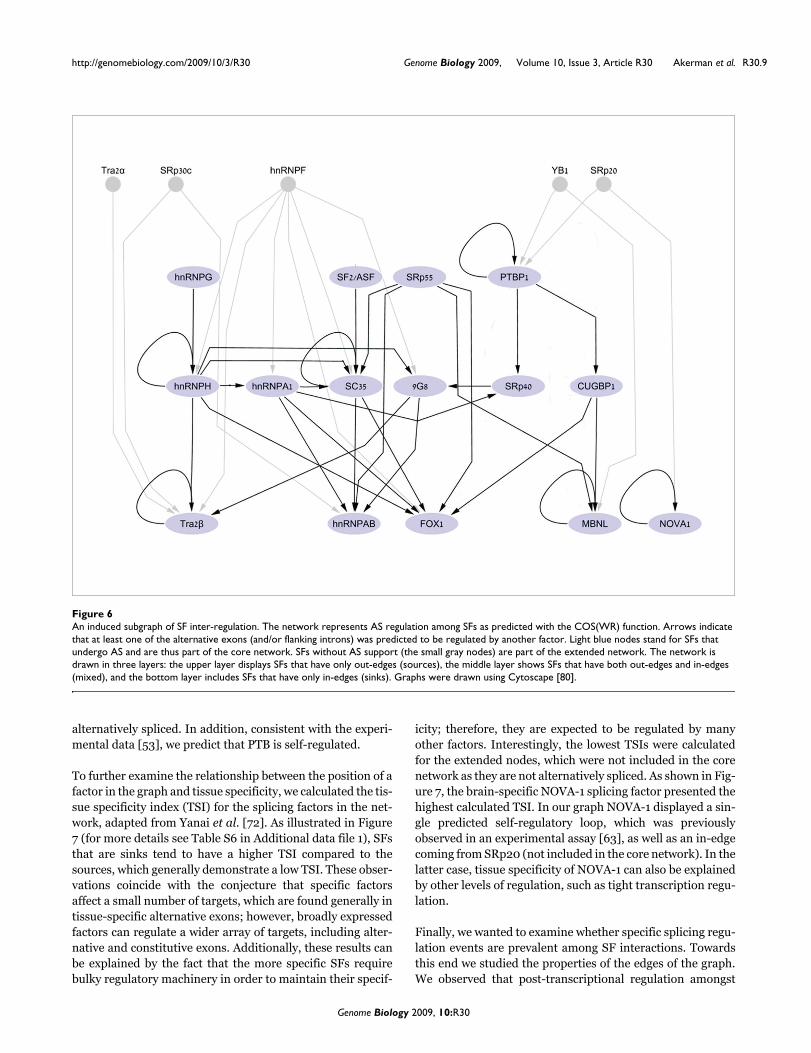
Inter-regulation among splicing factorsSFs' coding transcripts have been consistently observed to beregulated by AS. In many cases negative and positive feed-back via autoregulation have been observed [34,53,54,63,64].Recent studies demonstrated that AS-related nonsense-mediated decay in SR proteins involves inter-regulatory andautoregulatory loops [65,66]. The concept of SF regulationwas further strengthened by a recent computational genomicsurvey that demonstrated enrichment of specific SFBSs intheir own coding genes [67]. In order to analyze the cross-talk(at the AS level) between the SFs within our set, we repre-sented the relationships between the factors as a directedgraph (network; Figure 6). The nodes in the graph (light blueovals) are the SFs (both the proteins and the pre-mRNAsencoding for the SFs) and the directed edges (black arrows)denote putative regulations, predicted by the existence of aSFBS as defined by the COS(WR) function. Though themajority of SFs in our list are involved in constitutive splicing
as well as in AS, to account for regulation involved in differ-ential expression of the splicing factors, we included in thenetwork only putative interactions with alternative splicedexons of the SF genes. To account for interactions betweenSFs in our list that may be involved in AS regulation but arenot documented to undergo AS by themselves, we extendedthe core graph by adding five nodes (small grey circles) forwhich we could only predict out-edges (gray arrows), denot-ing putative interactions with other SFs via AS regulation.
Further, to study the unique properties of the SF network(including only the core network of 15 nodes for which adirected graph was constructed), we compared the networktopology of the core graph to 1,000 randomly generatedgraphs preserving the number of nodes and edges using theErdös-Rényi model [68]. As apparent from Table 1, the SFnetwork demonstrated a significantly lower average pathlength than calculated for random graphs; however, it was notfound to be highly clustered relative to random networks.Overall, the SF graph shown in Figure 6 displays a three-tierstructure that is reminiscent of other regulatory networks[69]. In such a network, each node is assigned a level number:1, 2, or 3. Generally, ignoring self loops, the three types ofnodes have the following properties: level 1 nodes are'sources', that is, nodes that have only out-going edges - theseare SFs that were shown to be only regulators but are not reg-ulated by other SFs in the core network; level 2 are 'mixednodes', which have both in-edges and out-edges; and level 3nodes are 'sinks', that is, nodes that have only in-going edges- these are SFs that are only regulated by other SFs and do notregulate other SFs within the network. Additionally, the net-work displayed many previously reported regulatory patternssuch as self-splicing regulation by PTB1 [53], NOVA-1 [63]and SC35 [64]. Notably, in our network we defined an edgebetween SFs only for AS events in which the predicted SFBSsare enriched relative to constitutive splicing; thus, we antici-pate that several autoregulatory interactions will not bereflected by the network. Obviously, our methodology will notidentify autoregulation of SFs, which could occur at other lev-els of the gene expression pathway, such as export and trans-lation levels (as, for example, described in [70]).
A deeper perusal of the members of the nodes in the differentlevels in our splicing network revealed that the sources in thenetwork tend to be more broadly expressed SFs, such as thesplicing factor SF2/ASF [71], while the sinks of the networkcorrespond to tissue-specific splicing factors, such as themuscle- and brain-specific factor FOX-1. A specifically inter-esting node in the graph is PTB. As described above, PTB iswell known as a basal factor, binding to polypyrimidine tractsupstream of the 3' splice sites, but it has also been shown toplay a critical role in regulating tissue-specific (mainly brain)exons, including its own mRNA [53]. In the core network,PTB is found in the first layer, but it has in-edges coming fromother factors (YB1, SRp20) that have not been documented as
Genome Biology 2009, 10:R30
http://genomebiology.com/2009/10/3/R30 Genome Biology 2009, Volume 10, Issue 3, Article R30 Akerman et al. R30.9
alternatively spliced. In addition, consistent with the experi-mental data [53], we predict that PTB is self-regulated.
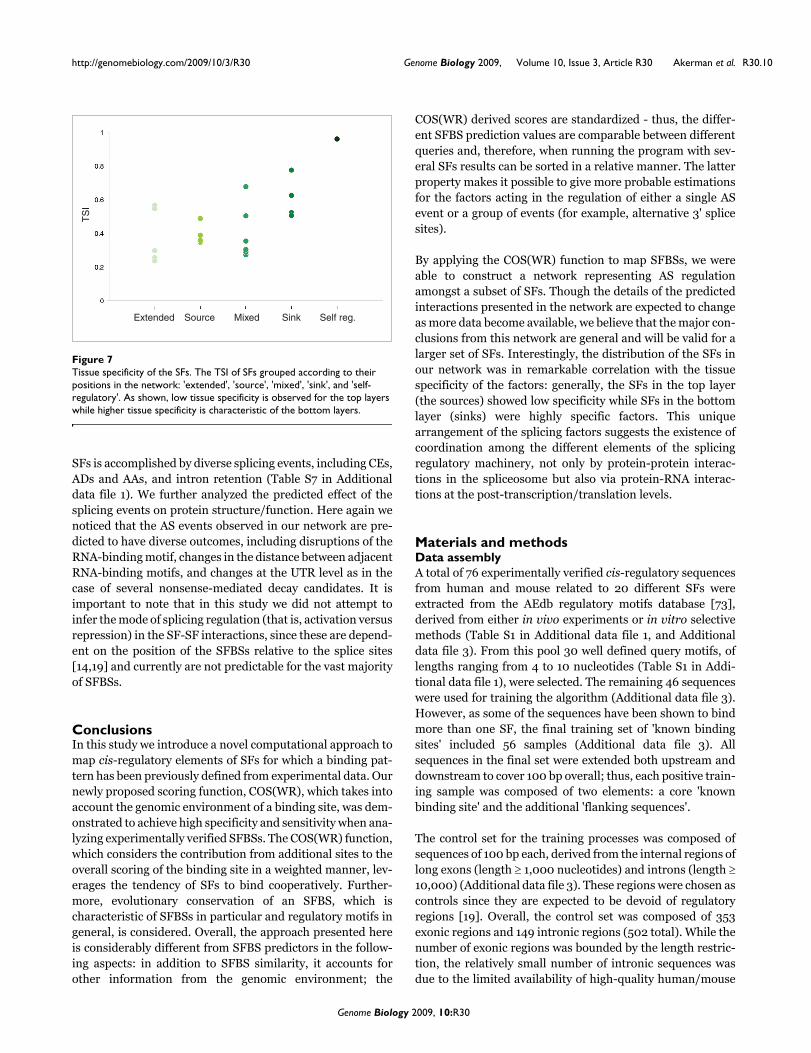
To further examine the relationship between the position of afactor in the graph and tissue specificity, we calculated the tis-sue specificity index (TSI) for the splicing factors in the net-work, adapted from Yanai et al. [72]. As illustrated in Figure7 (for more details see Table S6 in Additional data file 1), SFsthat are sinks tend to have a higher TSI compared to thesources, which generally demonstrate a low TSI. These obser-vations coincide with the conjecture that specific factorsaffect a small number of targets, which are found generally intissue-specific alternative exons; however, broadly expressedfactors can regulate a wider array of targets, including alter-native and constitutive exons. Additionally, these results canbe explained by the fact that the more specific SFs requirebulky regulatory machinery in order to maintain their specif-
icity; therefore, they are expected to be regulated by manyother factors. Interestingly, the lowest TSIs were calculatedfor the extended nodes, which were not included in the corenetwork as they are not alternatively spliced. As shown in Fig-ure 7, the brain-specific NOVA-1 splicing factor presented thehighest calculated TSI. In our graph NOVA-1 displayed a sin-gle predicted self-regulatory loop, which was previouslyobserved in an experimental assay [63], as well as an in-edgecoming from SRp20 (not included in the core network). In thelatter case, tissue specificity of NOVA-1 can also be explainedby other levels of regulation, such as tight transcription regu-lation.
Finally, we wanted to examine whether specific splicing regu-lation events are prevalent among SF interactions. Towardsthis end we studied the properties of the edges of the graph.We observed that post-transcriptional regulation amongst
An induced subgraph of SF inter-regulationFigure 6An induced subgraph of SF inter-regulation. The network represents AS regulation among SFs as predicted with the COS(WR) function. Arrows indicate that at least one of the alternative exons (and/or flanking introns) was predicted to be regulated by another factor. Light blue nodes stand for SFs that undergo AS and are thus part of the core network. SFs without AS support (the small gray nodes) are part of the extended network. The network is drawn in three layers: the upper layer displays SFs that have only out-edges (sources), the middle layer shows SFs that have both out-edges and in-edges (mixed), and the bottom layer includes SFs that have only in-edges (sinks). Graphs were drawn using Cytoscape [80].
Genome Biology 2009, 10:R30
http://genomebiology.com/2009/10/3/R30 Genome Biology 2009, Volume 10, Issue 3, Article R30 Akerman et al. R30.10
SFs is accomplished by diverse splicing events, including CEs,ADs and AAs, and intron retention (Table S7 in Additionaldata file 1). We further analyzed the predicted effect of thesplicing events on protein structure/function. Here again wenoticed that the AS events observed in our network are pre-dicted to have diverse outcomes, including disruptions of theRNA-binding motif, changes in the distance between adjacentRNA-binding motifs, and changes at the UTR level as in thecase of several nonsense-mediated decay candidates. It isimportant to note that in this study we did not attempt toinfer the mode of splicing regulation (that is, activation versusrepression) in the SF-SF interactions, since these are depend-ent on the position of the SFBSs relative to the splice sites[14,19] and currently are not predictable for the vast majorityof SFBSs.
ConclusionsIn this study we introduce a novel computational approach tomap cis-regulatory elements of SFs for which a binding pat-tern has been previously defined from experimental data. Ournewly proposed scoring function, COS(WR), which takes intoaccount the genomic environment of a binding site, was dem-onstrated to achieve high specificity and sensitivity when ana-lyzing experimentally verified SFBSs. The COS(WR) function,which considers the contribution from additional sites to theoverall scoring of the binding site in a weighted manner, lev-erages the tendency of SFs to bind cooperatively. Further-more, evolutionary conservation of an SFBS, which ischaracteristic of SFBSs in particular and regulatory motifs ingeneral, is considered. Overall, the approach presented hereis considerably different from SFBS predictors in the follow-ing aspects: in addition to SFBS similarity, it accounts forother information from the genomic environment; the
COS(WR) derived scores are standardized - thus, the differ-ent SFBS prediction values are comparable between differentqueries and, therefore, when running the program with sev-eral SFs results can be sorted in a relative manner. The latterproperty makes it possible to give more probable estimationsfor the factors acting in the regulation of either a single ASevent or a group of events (for example, alternative 3' splicesites).
By applying the COS(WR) function to map SFBSs, we wereable to construct a network representing AS regulationamongst a subset of SFs. Though the details of the predictedinteractions presented in the network are expected to changeas more data become available, we believe that the major con-clusions from this network are general and will be valid for alarger set of SFs. Interestingly, the distribution of the SFs inour network was in remarkable correlation with the tissuespecificity of the factors: generally, the SFs in the top layer(the sources) showed low specificity while SFs in the bottomlayer (sinks) were highly specific factors. This uniquearrangement of the splicing factors suggests the existence ofcoordination among the different elements of the splicingregulatory machinery, not only by protein-protein interac-tions in the spliceosome but also via protein-RNA interac-tions at the post-transcription/translation levels.
Materials and methodsData assemblyA total of 76 experimentally verified cis-regulatory sequencesfrom human and mouse related to 20 different SFs wereextracted from the AEdb regulatory motifs database [73],derived from either in vivo experiments or in vitro selectivemethods (Table S1 in Additional data file 1, and Additionaldata file 3). From this pool 30 well defined query motifs, oflengths ranging from 4 to 10 nucleotides (Table S1 in Addi-tional data file 1), were selected. The remaining 46 sequenceswere used for training the algorithm (Additional data file 3).However, as some of the sequences have been shown to bindmore than one SF, the final training set of 'known bindingsites' included 56 samples (Additional data file 3). Allsequences in the final set were extended both upstream anddownstream to cover 100 bp overall; thus, each positive train-ing sample was composed of two elements: a core 'knownbinding site' and the additional 'flanking sequences'.
The control set for the training processes was composed ofsequences of 100 bp each, derived from the internal regions oflong exons (length 1,000 nucleotides) and introns (length 10,000) (Additional data file 3). These regions were chosen ascontrols since they are expected to be devoid of regulatoryregions [19]. Overall, the control set was composed of 353exonic regions and 149 intronic regions (502 total). While thenumber of exonic regions was bounded by the length restric-tion, the relatively small number of intronic sequences wasdue to the limited availability of high-quality human/mouse
Tissue specificity of the SFsFigure 7Tissue specificity of the SFs. The TSI of SFs grouped according to their positions in the network: 'extended', 'source', 'mixed', 'sink', and 'self-regulatory'. As shown, low tissue specificity is observed for the top layers while higher tissue specificity is characteristic of the bottom layers.
TS
I
Extended Source Mixed Sink Self reg.
Genome Biology 2009, 10:R30
http://genomebiology.com/2009/10/3/R30 Genome Biology 2009, Volume 10, Issue 3, Article R30 Akerman et al. R30.11
alignments from internal intronic regions, which would berequired for further evolutionary conservation estimates.
A background model was built to evaluate statistical signifi-cance. The background set comprised 5,000 constitutive and1,637 alternative exons with their intronic flanking regions oflength 100 bp (Table S8 in Additional data file 1), all derivedfrom a human/mouse conserved database of alternative andconstitutive exons [18].
Defining a match to a SFBS queryTo search for single SFBSs in a given sequence, the examinedqueries were represented as a consensus using the IUPACdefinition (Table S1 in Additional data file 1). To estimate thematch between the SF consensus sequence (query) and the k-mers in each position of the sequences (targets), a mismatchexpectation (Em) between the query and the target wasdefined as:
Em slightly differs from an ordinary Hamming distance(namely the sum of all mismatches) as the mismatch at eachposition is weighted by its variability in the consensussequence. Mi is a Boolean variable (1 for a match and 0 for amismatch), indicating whether the target sequence matchesthe query at position i of the k-mer or not. Since for mostsplicing factors no informative position weight matrices arecurrently available (except for the SR proteins for whichdetailed position weight matrices from SELEX data werederived [26,57]), we use a simple approach to weigh eachposition in the query based on the available consensus pat-tern. The penalty weight pi was defined according to the queryconsensus pattern given in Table S1 in Additional data file 1:it is 1 when the position in the consensus sequence is invaria-ble and 0.25 when no restrictions are given in the consensus.The penalty weight was applied to down penalize mismatchesto variable positions. Thus, for example, if the query isA[CG]A[AGC] and the 4-mer on the target sequence is AUUU,then Em = 0 + 0.50 + 1 + 0.33 = 1.83.
Further, a standardized score S was defined to evaluate thematch between the query and each k-mer in the targetsequence. Since the Em of a query at a certain position ishighly dependent on the length and the expected nucleotideprobabilities of the query, we standardized the matchbetween the query and the k-mer in the target sequence as fol-lows:
- where Em max is the maximal mismatch expectation that can
be obtained between any k-mer and the query. The values ofS range from 0 to 1, increasing as the distance between the
query and the k-mer in the target decreases. Thus, when thek-mer in the target sequence completely matches the query,Em will be 0 and S will equal 1. In the above example, the 4-mer AUUU will be scored (2.83 - 1.83)/2.83 = 0.353.
For defining significance, Z-scores were calculated for eachquery independently, relative to the background model (seethe 'Data assembly' section above; Table S8 in Additional datafile 1). Two different thresholds were defined: cutoffsig (P-value < 0.01) and cutoffsub (P-value < 0.025) for significant(Ssig) and suboptimal (Ssub) hits, respectively. Here, a mixedbackground model (both exons and introns taken together)was chosen since we do not observe substantial differenceswhen considering each group separately (Table S8 in Addi-tional data file 1).
Testing on experimentally predicted SFBSs based on CLIP dataIn order to assess the specificity and sensitivity of our methodat a genome-wide scale, we employed the SF2/ASF CLIPdataset from Sanford et al. [46] and the NOVA-1 CLIP datafrom Ule et al. [14]. From the first set only intragenicsequences, which were identified by the CLIP technique asSF2/ASF targets, were selected (326 sequences in total) andcombined with 3,260 (10-fold) random exonic sequencesfrom the human genome. From the second set 48 validatedNOVA-1 targets and 480 random exonic and intronicsequences were selected. The choice of either pure exonic ormixed (intronic/exonic) backgrounds for SF2/ASF andNOVA-1, respectively, is based on the CLIP results, whereSF2/ASF targets were purely exonic while the NOVA-1 targetswere mixed. The COS(WR) function was applied to predictthe binding motifs from our initial SF list (Table S1 in Addi-tional data file 1). For each independent experiment, the pre-diction results of SFBS scores for the experimentally chosensequences and the random sequences were ranked. Further,the Fisher exact (hypergeometric distribution) test wasapplied to search which of the predicted motifs (above theCOS(WR) thresholds) was significantly enriched in the CLIPderived sequences compared to random sequences.
Enrichment analysisTo search for enrichment of SFBSs in sequences related to ASevents versus constitutive splicing events, three different setsof human/mouse conserved alternative exons were tested: aset of 983 CEs; 439 alternative acceptors; and 198 alternativedonors [18]. All the exon and intron (with masked splice sites)sets were compared with a non-parametric Wilcoxon test to aset of 5,000 randomly chosen constitutive exons, also con-served between human and mouse [18]. All the obtained P-values were corrected using the Westfall-Young procedure[74].
Splicing networksInteractions between splicing factors (via AS) were repre-sented by a directed graph G = (V, E) where the SFs are the
E M pm i ii
n= −
=∑ ( )11
(6)
SEm Em
Em= −max
max(7)
Genome Biology 2009, 10:R30
http://genomebiology.com/2009/10/3/R30 Genome Biology 2009, Volume 10, Issue 3, Article R30 Akerman et al. R30.12
nodes in V and the edges in E reflect interactions, as follows:a directed edge from SF s1(the candidate regulator) to SFs2(the target transcript) exists if at least one alternative exonof s2was significantly enriched in the SFBSs of s1. To establishinteractions, the alternative exons (and the flanking introns)of the SFs were queried with 30 SFBS motifs. Alternativeexons were defined based on annotations from RefSeq [75],H-DBAS [76], and dbCASE [77]. In the latter, we consideredAS events with 4 expressed sequence tags per isoform.Under these conditions, we observe a large extent of overlapbetween annotations in all the databases. Fisher's exact testswere performed for each independent motif to define thenumber of significant hits that minimizes the P-value (inexons and introns separately) when comparing alternative toconstitutive splicing events. In other words, the thresholdcorresponds to the minimal number of hits that is required toestablish a regulatory interaction in either exons or introns.Motifs with a P-value > 0.05 (that is, not enriched) were notqueried in the analysis.
The properties of this graph (network) were compared to1,000 randomly generated graphs with the same number ofnodes and edges using the Erdös-Rényi model [68]. Five SFsfor which alternative exons were not documented (Tra2,SRp20, SRp30c, hnRNPF, YB1) were excluded from the net-work analysis since they can only have out-edges (predictedto regulate other factors via AS but not vice versa). The fol-lowing topological properties were calculated for each graphG. First, the diameter (D), defined as the length of the longestshortest path between any two nodes in V. Second, the aver-age path length (L), defined as the average of path lengthstaken over all pairs of nodes for which a directed path exists,calculated as:
- where Np represents the number of connected pairs of nodesin the graph, and dist(u,v) is the length of the shortest pathbetween nodes u and v if one exists. Third, the clustering coef-ficient (C), which is the average value of the individual clus-tering coefficients (c) of all the nodes in the graph; the latter(c) is defined for a node v as the fraction of the number ofedges among v's neighbors out of all possible pairs of suchneighbors. Thus, C is defined as:
- where N is the number of nodes (vertices) in the graph, Nv isthe number of neighbors of node v, and nv is the actualnumber of edges between the neighbors of node v. The analy-ses were performed with the R software environment for sta-tistical computing release 2.5.1 [78] and the igraphcontributed (0.4.3) package using the functions:
erdos.reni.game, diameter, average.path.length and transi-tivity.
Tissue specificity indexThe TSI of the splicing factors was calculated using theGPL96-GDS596-MAS5 microarrays dataset [79]. SF expres-sion levels for a total of 28 normal tissues were used for cal-culating each TSI; cancer and fetal tissues were removed.Further, the expression levels were log transformed andbinned into ten groups ranging from 0 to 1 for every sampleindependently.
The TSI was adapted from the TSIhvr value, defined by Yanaiet al. [72]. As in the TSIhvr, the expression profile for each SFwas first normalized by dividing each intensity by the highestintensity of that profile, as follows:
- where N is the number of tissues (28) and x is the normal-ized expression vector.
AvailabilityThe method presented here is embodied in a software pack-age called Splicing Factor Finder (SFF), which is available inAdditional data file 4 as a standalone download suitable forrunning under the Linux OS.
AbbreviationsAA: alternative acceptor; AD: alternative donor; AS: alterna-tive splicing; CE: cassette exon; CLIP: cross-linking immuno-precipitation; COS: Conservation Of Score; hnRNP:heterogeneous nuclear ribonucleoprotein; M: median; PTB:polypyrimidine tract-binding protein; SF: splicing factor;SFBS: splicing factor binding site; SR: serine-arginine-rich;SS: sum of scores; TPR: true positive rate; TSI: tissue specifi-city index; UTR: untranslated region; WA: weighted average;WR: weighted rank.
Authors' contributionsMA participated in the design and development of the com-putational methodology, carried out the predictions and sta-tistical analyses, and drafted the manuscript. HDE carriedout the network analysis. RYP advised on the network designand analysis. YMG conceived and coordinated the study andwrote the manuscript. All authors read the manuscript andparticipated in the revisions that produced its final form.
LNp
dist u v
u v Vu v
=∈
→
∑1( , )
,(8)
CN
nvN v N vv V
=−
∈∑1
1 2( )/ (9)
TSI
xii
N
Nhvr =−∑
−
1
1
(10)
Genome Biology 2009, 10:R30
http://genomebiology.com/2009/10/3/R30 Genome Biology 2009, Volume 10, Issue 3, Article R30 Akerman et al. R30.13
Additional data filesThe following additional data are available with the onlineversion of this paper: a PDF including Tables S1-S8 (Addi-tional data file 1); a PDF including Figures S1-S3 (Additionaldata file 2); a detailed table of all experimentally definedSFBSs used for training and testing (Additional data file 3); acompressed file of the SFF standalone download, suitable forrunning under the Linux OS (Additional data file 4).Additional data file 1Tables S1-S8Table S1 includes a list of binding site motifs for known SFs used for training and testing the method. Table S2 summarizes the training results using different estimators and thresholds. Table S3 lists the thresholds used for the COS(WR) function for each binding site motif. Tables S4 and Table S5 display detailed results for the enrichment tests performed for AAs, CEs, and ADs, applying the COS(WR) and single score (S), respectively. Table S6 displays the values of the TSI calculated for the different SFs. Table S7 presents the details of the predicted SF-SF interactions. Table S8 displays the values for the background model calculated for the Single Scores (S).Click here for fileAdditional data file 2Figures S1-S3Figure S1 illustrates the TPR of different multiplicity estimators (WR, WA, M, SS and S) calculated at a fixed false positive rate of 0.01. TPRs were calculated with and without the COS. Figure S2 demonstrates the analysis of the SF2/ASF and NOVA-1 CLIP data-sets, when applying (a, c) COS(WR) and (b, d) Single Scores. Figure S3 is a heat map representing the calculated enrichment of SFBSs around different alternative events, when applying Single Scores (S) only.Click here for fileAdditional data file 3Experimentally defined SFBSs used for training and testingExperimentally defined SFBSs used for training and testing.Click here for fileAdditional data file 4SFF standalone downloadSFF standalone download, suitable for running under the Linux OS.Click here for file
AcknowledgementsWe would like to thank Yael Berstein and Yonina Eldar for advice on sta-tistical analysis and mathematical formulations. This work was supported bythe Mallat Family Fund granted to YMG. HDE was supported by the IsraeliScience Foundation 923/05.
References1. Das D, Clark TA, Schweitzer A, Yamamoto M, Marr H, Arribere J,
Minovitsky S, Poliakov A, Dubchak I, Blume JE, Conboy JG: A corre-lation with exon expression approach to identify cis-regula-tory elements for tissue-specific alternative splicing. NucleicAcids Res 2007, 35:4845-4857.
2. Jensen KB, Dredge BK, Stefani G, Zhong R, Buckanovich RJ, OkanoHJ, Yang YY, Darnell RB: Nova-1 regulates neuron-specificalternative splicing and is essential for neuronal viability.Neuron 2000, 25:359-371.
3. Jin Y, Suzuki H, Maegawa S, Endo H, Sugano S, Hashimoto K, YasudaK, Inoue K: A vertebrate RNA-binding protein Fox-1 regu-lates tissue-specific splicing via the pentanucleotideGCAUG. EMBO J 2003, 22:905-912.
4. Qi J, Su S, McGuffin ME, Mattox W: Concentration dependentselection of targets by an SR splicing regulator results in tis-sue-specific RNA processing. Nucleic Acids Res 2006,34:6256-6263.
5. Moroy T, Heyd F: The impact of alternative splicing in vivo:mouse models show the way. Rna 2007, 13:1155-1171.
6. Tarn WY: Cellular signals modulate alternative splicing. JBiomed Sci 2007, 14:517-522.
7. Smith CW, Valcarcel J: Alternative pre-mRNA splicing: thelogic of combinatorial control. Trends Biochem Sci 2000,25:381-388.
8. Jurica MS, Moore MJ: Pre-mRNA splicing: awash in a sea of pro-teins. Mol Cell 2003, 12:5-14.
9. Clerte C, Hall KB: Characterization of multimeric complexesformed by the human PTB1 protein on RNA. Rna 2006,12:457-475.
10. Eperon IC, Makarova OV, Mayeda A, Munroe SH, Caceres JF, Hay-ward DG, Krainer AR: Selection of alternative 5' splice sites:role of U1 snRNP and models for the antagonistic effects ofSF2/ASF and hnRNP A1. Mol Cell Biol 2000, 20:8303-8318.
11. Gromak N, Matlin AJ, Cooper TA, Smith CW: Antagonistic regu-lation of alpha-actinin alternative splicing by CELF proteinsand polypyrimidine tract binding protein. Rna 2003, 9:443-456.
12. Aznarez I, Barash Y, Shai O, He D, Zielenski J, Tsui LC, Parkinson J,Frey BJ, Rommens JM, Blencowe BJ: A systematic analysis ofintronic sequences downstream of 5' splice sites reveals awidespread role for U-rich motifs and TIA1/TIAL1 proteinsin alternative splicing regulation. Genome Res 2008,18:1247-1258.
13. McCullough AJ, Berget SM: G triplets located throughout a classof small vertebrate introns enforce intron borders and regu-late splice site selection. Mol Cell Biol 1997, 17:4562-4571.
14. Ule J, Stefani G, Mele A, Ruggiu M, Wang X, Taneri B, Gaasterland T,Blencowe BJ, Darnell RB: An RNA map predicting Nova-dependent splicing regulation. Nature 2006, 444:580-586.
15. Clery A, Blatter M, Allain FH: RNA recognition motifs: boring?Not quite. Curr Opin Struct Biol 2008, 18:290-298.
16. Stadler MB, Shomron N, Yeo GW, Schneider A, Xiao X, Burge CB:Inference of splicing regulatory activities by sequence neigh-borhood analysis. PLoS Genet 2006, 2:e191.
17. Sorek R, Ast G: Intronic sequences flanking alternatively
spliced exons are conserved between human and mouse.Genome Res 2003, 13:1631-1637.
18. Sugnet CW, Kent WJ, Ares M Jr, Haussler D: Transcriptome andgenome conservation of alternative splicing events inhumans and mice. Pac Symp Biocomput 2004:66-77.
19. Goren A, Ram O, Amit M, Keren H, Lev-Maor G, Vig I, Pupko T, AstG: Comparative analysis identifies exonic splicing regulatorysequences - the complex definition of enhancers and silenc-ers. Mol Cell 2006, 22:769-781.
20. Voelker RB, Berglund JA: A comprehensive computationalcharacterization of conserved mammalian intronicsequences reveals conserved motifs associated with consti-tutive and alternative splicing. Genome Res 2007, 17:1023-1033.
21. Akerman M, Mandel-Gutfreund Y: Alternative splicing regulationat tandem 3' splice sites. Nucleic Acids Res 2006, 34:23-31.
22. Kankainen M, Loytynoja A: MATLIGN: a motif clustering, com-parison and matching tool. BMC Bioinformatics 2007, 8:189.
23. Reddy TE, Shakhnovich BE, Roberts DS, Russek SJ, DeLisi C: Posi-tional clustering improves computational binding site detec-tion and identifies novel cis-regulatory sites in mammalianGABAA receptor subunit genes. Nucleic Acids Res 2007, 35:e20.
24. Wong WS, Nielsen R: Finding cis-regulatory modules in Dro-sophila using phylogenetic hidden Markov models. Bioinformat-ics 2007, 23:2031-2037.
25. Yang E, Simcha D, Almon RR, Dubois DC, Jusko WJ, Androulakis IP:Context specific transcription factor prediction. Ann BiomedEng 2007, 35:1053-1067.
26. Cartegni L, Wang J, Zhu Z, Zhang MQ, Krainer AR: ESEfinder: aweb resource to identify exonic splicing enhancers. NucleicAcids Res 2003, 31:3568-3571.
27. Fairbrother WG, Yeo GW, Yeh R, Goldstein P, Mawson M, Sharp PA,Burge CB: RESCUE-ESE identifies candidate exonic splicingenhancers in vertebrate exons. Nucleic Acids Res 2004,32:W187-190.
28. Zhang XH, Kangsamaksin T, Chao MS, Banerjee JK, Chasin LA: Exoninclusion is dependent on predictable exonic splicing enhanc-ers. Mol Cell Biol 2005, 25:7323-7332.
29. Wang Z, Rolish ME, Yeo G, Tung V, Mawson M, Burge CB: System-atic identification and analysis of exonic splicing silencers.Cell 2004, 119:831-845.
30. Chasin LA: Searching for splicing motifs. Adv Exp Med Biol 2007,623:85-106.
31. Burd CG, Dreyfuss G: RNA binding specificity of hnRNP A1:significance of hnRNP A1 high-affinity binding sites in pre-mRNA splicing. EMBO J 1994, 13:1197-1204.
32. Cartegni L, Chew SL, Krainer AR: Listening to silence and under-standing nonsense: exonic mutations that affect splicing. NatRev Genet 2002, 3:285-298.
33. Cavaloc Y, Bourgeois CF, Kister L, Stevenin J: The splicing factors9G8 and SRp20 transactivate splicing through different andspecific enhancers. Rna 1999, 5:468-483.
34. Chabot B, Blanchette M, Lapierre I, La Branche H: An intron ele-ment modulating 5' splice site selection in the hnRNP A1pre-mRNA interacts with hnRNP A1. Mol Cell Biol 1997,17:1776-1786.
35. Chan RC, Black DL: The polypyrimidine tract binding proteinbinds upstream of neural cell-specific c-src exon N1 torepress the splicing of the intron downstream. Mol Cell Biol1997, 17:4667-4676.
36. Chen CD, Kobayashi R, Helfman DM: Binding of hnRNP H to anexonic splicing silencer is involved in the regulation of alter-native splicing of the rat beta-tropomyosin gene. Genes Dev1999, 13:593-606.
37. Chou MY, Underwood JG, Nikolic J, Luu MH, Black DL: MultisiteRNA binding and release of polypyrimidine tract bindingprotein during the regulation of c-src neural-specific splicing.Mol Cell 2000, 5:949-957.
38. Hastings ML, Wilson CM, Munroe SH: A purine-rich intronic ele-ment enhances alternative splicing of thyroid hormonereceptor mRNA. Rna 2001, 7:859-874.
39. Ho TH, Charlet BN, Poulos MG, Singh G, Swanson MS, Cooper TA:Muscleblind proteins regulate alternative splicing. EMBO J2004, 23:3103-3112.
40. Hou VC, Lersch R, Gee SL, Ponthier JL, Lo AJ, Wu M, Turck CW,Koury M, Krainer AR, Mayeda A, Conboy JG: Decrease in hnRNPA/B expression during erythropoiesis mediates a pre-mRNAsplicing switch. EMBO J 2002, 21:6195-6204.
41. Jacquenet S, Mereau A, Bilodeau PS, Damier L, Stoltzfus CM, Branlant
Genome Biology 2009, 10:R30
http://www.ncbi.nlm.nih.gov/entrez/query.fcgi?cmd=Retrieve&db=PubMed&dopt=Abstract&list_uids=9234714
http://www.ncbi.nlm.nih.gov/entrez/query.fcgi?cmd=Retrieve&db=PubMed&dopt=Abstract&list_uids=9234714
http://www.ncbi.nlm.nih.gov/entrez/query.fcgi?cmd=Retrieve&db=PubMed&dopt=Abstract&list_uids=9234714
http://www.ncbi.nlm.nih.gov/entrez/query.fcgi?cmd=Retrieve&db=PubMed&dopt=Abstract&list_uids=7510636
http://www.ncbi.nlm.nih.gov/entrez/query.fcgi?cmd=Retrieve&db=PubMed&dopt=Abstract&list_uids=7510636
http://www.ncbi.nlm.nih.gov/entrez/query.fcgi?cmd=Retrieve&db=PubMed&dopt=Abstract&list_uids=7510636
http://www.ncbi.nlm.nih.gov/entrez/query.fcgi?cmd=Retrieve&db=PubMed&dopt=Abstract&list_uids=9121425
http://www.ncbi.nlm.nih.gov/entrez/query.fcgi?cmd=Retrieve&db=PubMed&dopt=Abstract&list_uids=9121425
http://www.ncbi.nlm.nih.gov/entrez/query.fcgi?cmd=Retrieve&db=PubMed&dopt=Abstract&list_uids=9121425
http://www.ncbi.nlm.nih.gov/entrez/query.fcgi?cmd=Retrieve&db=PubMed&dopt=Abstract&list_uids=9234723
http://www.ncbi.nlm.nih.gov/entrez/query.fcgi?cmd=Retrieve&db=PubMed&dopt=Abstract&list_uids=9234723
http://genomebiology.com/2009/10/3/R30 Genome Biology 2009, Volume 10, Issue 3, Article R30 Akerman et al. R30.14
C: A second exon splicing silencer within human immunode-ficiency virus type 1 tat exon 2 represses splicing of TatmRNA and binds protein hnRNP H. J Biol Chem 2001,276:40464-40475.
42. Kashima T, Manley JL: A negative element in SMN2 exon 7inhibits splicing in spinal muscular atrophy. Nat Genet 2003,34:460-463.
43. Minovitsky S, Gee SL, Schokrpur S, Dubchak I, Conboy JG: The splic-ing regulatory element, UGCAUG, is phylogenetically andspatially conserved in introns that flank tissue-specific alter-native exons. Nucleic Acids Res 2005, 33:714-724.
44. Nasim MT, Chernova TK, Chowdhury HM, Yue BG, Eperon IC:HnRNP G and Tra2beta: opposite effects on splicingmatched by antagonism in RNA binding. Hum Mol Genet 2003,12:1337-1348.
45. Pagani F, Buratti E, Stuani C, Baralle FE: Missense, nonsense, andneutral mutations define juxtaposed regulatory elements ofsplicing in cystic fibrosis transmembrane regulator exon 9. JBiol Chem 2003, 278:26580-26588.
46. Sanford JR, Coutinho P, Hackett JA, Wang X, Ranahan W, Caceres JF:Identification of nuclear and cytoplasmic mRNA targets forthe shuttling protein SF2/ASF. PLoS ONE 2008, 3:e3369.
47. Schaal TD, Maniatis T: Multiple distinct splicing enhancers inthe protein-coding sequences of a constitutively spliced pre-mRNA. Mol Cell Biol 1999, 19:261-273.
48. Seong JY, Han J, Park S, Wuttke W, Jarry H, Kim K: Exonic splicingenhancer-dependent splicing of the gonadotropin-releasinghormone premessenger ribonucleic acid is mediated bytra2alpha, a 40-kilodalton serine/arginine-rich protein. MolEndocrinol 2002, 16:2426-2438.
49. Stickeler E, Fraser SD, Honig A, Chen AL, Berget SM, Cooper TA:The RNA binding protein YB-1 binds A/C-rich exon enhanc-ers and stimulates splicing of the CD44 alternative exon v4.EMBO J 2001, 20:3821-3830.
50. Suzuki H, Jin Y, Otani H, Yasuda K, Inoue K: Regulation of alterna-tive splicing of alpha-actinin transcript by Bruno-like pro-teins. Genes Cells 2002, 7:133-141.
51. Tacke R, Tohyama M, Ogawa S, Manley JL: Human Tra2 proteinsare sequence-specific activators of pre-mRNA splicing. Cell1998, 93:139-148.
52. Tran Q, Coleman TP, Roesser JR: Human transformer 2beta andSRp55 interact with a calcitonin-specific splice enhancer. Bio-chim Biophys Acta 2003, 1625:141-152.
53. Wollerton MC, Gooding C, Robinson F, Brown EC, Jackson RJ, SmithCW: Differential alternative splicing activity of isoforms ofpolypyrimidine tract binding protein (PTB). Rna 2001,7:819-832.
54. Stoilov P, Daoud R, Nayler O, Stamm S: Human tra2-beta1autoregulates its protein concentration by influencing alter-native splicing of its pre-mRNA. Hum Mol Genet 2004,13:509-524.
55. Wang Z, Xiao X, Van Nostrand E, Burge CB: General and specificfunctions of exonic splicing silencers in splicing control. MolCell 2006, 23:61-70.
56. Xie X, Lu J, Kulbokas EJ, Golub TR, Mootha V, Lindblad-Toh K,Lander ES, Kellis M: Systematic discovery of regulatory motifsin human promoters and 3' UTRs by comparison of severalmammals. Nature 2005, 434:338-345.
57. Smith PJ, Zhang C, Wang J, Chew SL, Zhang MQ, Krainer AR: Anincreased specificity score matrix for the prediction of SF2/ASF-specific exonic splicing enhancers. Hum Mol Genet 2006,15:2490-2508.
58. Akerman M, Mandel-Gutfreund Y: Does distance matter? Varia-tions in alternative 3' splicing regulation. Nucleic Acids Res 2007,35:5487-5498.
59. Koren E, Lev-Maor G, Ast G: The emergence of alternative 3'and 5' splice site exons from constitutive exons. PLoS ComputBiol 2007, 3:e95.
60. Castle JC, Zhang C, Shah JK, Kulkarni AV, Kalsotra A, Cooper TA,Johnson JM: Expression of 24,426 human alternative splicingevents and predicted cis regulation in 48 tissues and celllines. Nat Genet 2008, 40:1416-1425.
61. Spellman R, Smith CW: Novel modes of splicing repression byPTB. Trends Biochem Sci 2006, 31:73-76.
62. Pozzoli U, Sironi M: Silencers regulate both constitutive andalternative splicing events in mammals. Cell Mol Life Sci 2005,62:1579-1604.
63. Buckanovich RJ, Darnell RB: The neuronal RNA binding protein
Nova-1 recognizes specific RNA targets in vitro and in vivo.Mol Cell Biol 1997, 17:3194-3201.
64. Liu HX, Chew SL, Cartegni L, Zhang MQ, Krainer AR: Exonic splic-ing enhancer motif recognized by human SC35 under splic-ing conditions. Mol Cell Biol 2000, 20:1063-1071.
65. Lareau LF, Brooks AN, Soergel DA, Meng Q, Brenner SE: The cou-pling of alternative splicing and nonsense-mediated mRNAdecay. Adv Exp Med Biol 2007, 623:190-211.
66. Ni JZ, Grate L, Donohue JP, Preston C, Nobida N, O'Brien G, ShiueL, Clark TA, Blume JE, Ares M Jr: Ultraconserved elements areassociated with homeostatic control of splicing regulators byalternative splicing and nonsense-mediated decay. Genes Dev2007, 21:708-718.
67. Yeo GW, Van Nostrand EL, Liang TY: Discovery and analysis ofevolutionarily conserved intronic splicing regulatory ele-ments. PLoS Genet 2007, 3:e85.
68. Erdrs P, Rényi A: On random graphs. I. Publ Math (Debrecen) 1959,6:290.
69. Deplancke B, Mukhopadhyay A, Ao W, Elewa AM, Grove CA, Mar-tinez NJ, Sequerra R, Doucette-Stamm L, Reece-Hoyes JS, Hope IA,Tissenbaum HA, Mango SE, Walhout AJ: A gene-centered C. ele-gans protein-DNA interaction network. Cell 2006,125:1193-1205.
70. Michlewski G, Sanford JR, Caceres JF: The splicing factor SF2/ASFregulates translation initiation by enhancing phosphoryla-tion of 4E-BP1. Mol Cell 2008, 30:179-189.
71. Karni R, de Stanchina E, Lowe SW, Sinha R, Mu D, Krainer AR: Thegene encoding the splicing factor SF2/ASF is a proto-onco-gene. Nat Struct Mol Biol 2007, 14:185-193.
72. Yanai I, Benjamin H, Shmoish M, Chalifa-Caspi V, Shklar M, Ophir R,Bar-Even A, Horn-Saban S, Safran M, Domany E, Lancet D, Shmueli O:Genome-wide midrange transcription profiles revealexpression level relationships in human tissue specification.Bioinformatics 2005, 21:650-659.
73. AEdb - Alternative Exon Database [http://www.ebi.ac.uk/asd/aedb/]
74. Westfall PH, Young SS: On adjusting P -values for multiplicity.Biometrics 1993, 49:941-944.
75. RefSeq [http://www.ncbi.nlm.nih.gov/RefSeq]76. H-DBAS - Human-transcriptome DataBase for Alternative
Splicing [http://www.h-invitational.jp/h-dbas/]77. dbCASE [http://rulai.cshl.edu/cgi-bin/dbCASE/dbcase.cgi]78. R Project [http://www.r-project.org]79. GEO (Gene Expression Omnibus) platform GPL96
[http:www.ncbi.nlm.nih.gov/sites/entrez?db=gds&term=GPL96%5BGEO%20Accession%5D]
80. Cytoscape [http://www.cytoscape.org]
Genome Biology 2009, 10:R30
http://www.ncbi.nlm.nih.gov/entrez/query.fcgi?cmd=Retrieve&db=PubMed&dopt=Abstract&list_uids=9858550
http://www.ncbi.nlm.nih.gov/entrez/query.fcgi?cmd=Retrieve&db=PubMed&dopt=Abstract&list_uids=9858550
http://www.ncbi.nlm.nih.gov/entrez/query.fcgi?cmd=Retrieve&db=PubMed&dopt=Abstract&list_uids=9858550
http://www.ncbi.nlm.nih.gov/entrez/query.fcgi?cmd=Retrieve&db=PubMed&dopt=Abstract&list_uids=9546399
http://www.ncbi.nlm.nih.gov/entrez/query.fcgi?cmd=Retrieve&db=PubMed&dopt=Abstract&list_uids=9546399
http://www.ncbi.nlm.nih.gov/entrez/query.fcgi?cmd=Retrieve&db=PubMed&dopt=Abstract&list_uids=9154818
Related Documents


![Splicing Factor RBM20 Regulates Transcriptional Network of ...by RNA-binding splicing factors to produce protein isoforms in a tissue-specific and developmental- regulated manner [2].](https://static.cupdf.com/doc/110x72/5f0254687e708231d403bc67/splicing-factor-rbm20-regulates-transcriptional-network-of-by-rna-binding-splicing.jpg)