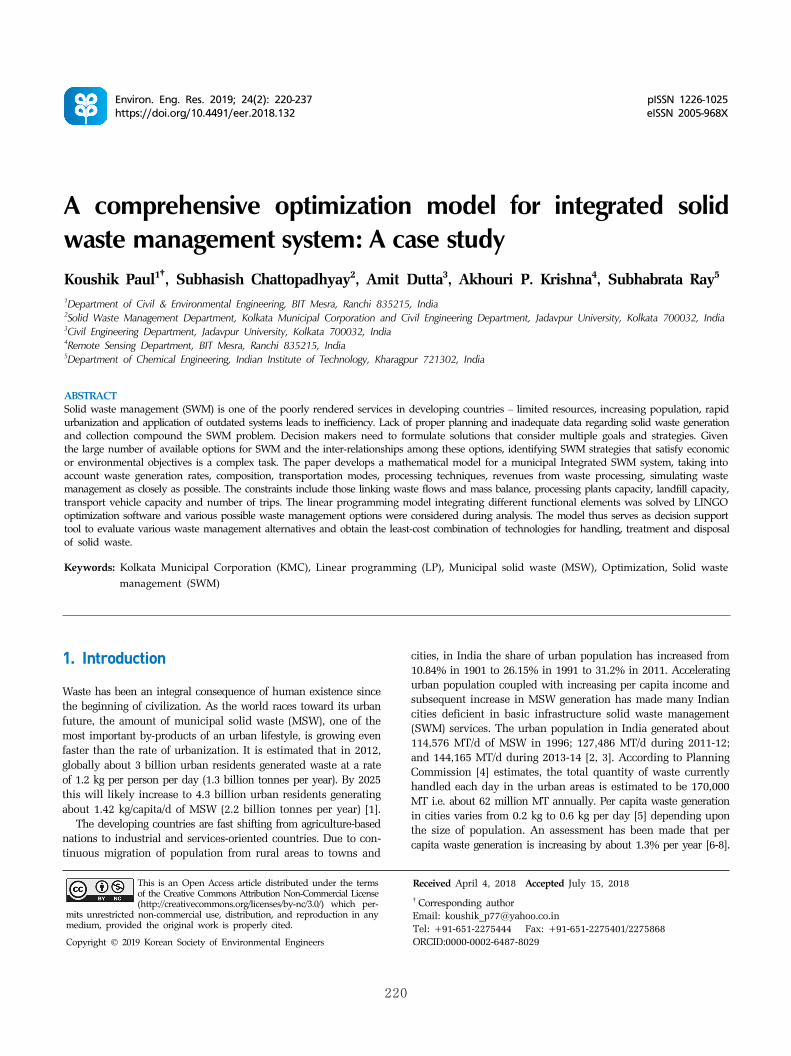
220 1. Introduction Waste has been an integral consequence of human existence since the beginning of civilization. As the world races toward its urban future, the amount of municipal solid waste (MSW), one of the most important by-products of an urban lifestyle, is growing even faster than the rate of urbanization. It is estimated that in 2012, globally about 3 billion urban residents generated waste at a rate of 1.2 kg per person per day (1.3 billion tonnes per year). By 2025 this will likely increase to 4.3 billion urban residents generating about 1.42 kg/capita/d of MSW (2.2 billion tonnes per year) [1]. The developing countries are fast shifting from agriculture-based nations to industrial and services-oriented countries. Due to con- tinuous migration of population from rural areas to towns and cities, in India the share of urban population has increased from 10.84% in 1901 to 26.15% in 1991 to 31.2% in 2011. Accelerating urban population coupled with increasing per capita income and subsequent increase in MSW generation has made many Indian cities deficient in basic infrastructure solid waste management (SWM) services. The urban population in India generated about 114,576 MT/d of MSW in 1996; 127,486 MT/d during 2011-12; and 144,165 MT/d during 2013-14 [2, 3]. According to Planning Commission [4] estimates, the total quantity of waste currently handled each day in the urban areas is estimated to be 170,000 MT i.e. about 62 million MT annually. Per capita waste generation in cities varies from 0.2 kg to 0.6 kg per day [5] depending upon the size of population. An assessment has been made that per capita waste generation is increasing by about 1.3% per year [6-8]. Environ. Eng. Res. 2019; 24(2): 220-237 pISSN 1226-1025 https://doi.org/10.4491/eer.2018.132 eISSN 2005-968X A comprehensive optimization model for integrated solid waste management system: A case study Koushik Paul 1† , Subhasish Chattopadhyay 2 , Amit Dutta 3 , Akhouri P. Krishna 4 , Subhabrata Ray 5 1 Department of Civil & Environmental Engineering, BIT Mesra, Ranchi 835215, India 2 Solid Waste Management Department, Kolkata Municipal Corporation and Civil Engineering Department, Jadavpur University, Kolkata 700032, India 3 Civil Engineering Department, Jadavpur University, Kolkata 700032, India 4 Remote Sensing Department, BIT Mesra, Ranchi 835215, India 5 Department of Chemical Engineering, Indian Institute of Technology, Kharagpur 721302, India ABSTRACT Solid waste management (SWM) is one of the poorly rendered services in developing countries – limited resources, increasing population, rapid urbanization and application of outdated systems leads to inefficiency. Lack of proper planning and inadequate data regarding solid waste generation and collection compound the SWM problem. Decision makers need to formulate solutions that consider multiple goals and strategies. Given the large number of available options for SWM and the inter-relationships among these options, identifying SWM strategies that satisfy economic or environmental objectives is a complex task. The paper develops a mathematical model for a municipal Integrated SWM system, taking into account waste generation rates, composition, transportation modes, processing techniques, revenues from waste processing, simulating waste management as closely as possible. The constraints include those linking waste flows and mass balance, processing plants capacity, landfill capacity, transport vehicle capacity and number of trips. The linear programming model integrating different functional elements was solved by LINGO optimization software and various possible waste management options were considered during analysis. The model thus serves as decision support tool to evaluate various waste management alternatives and obtain the least-cost combination of technologies for handling, treatment and disposal of solid waste. Keywords: Kolkata Municipal Corporation (KMC), Linear programming (LP), Municipal solid waste (MSW), Optimization, Solid waste management (SWM) This is an Open Access article distributed under the terms of the Creative Commons Attribution Non-Commercial License (http://creativecommons.org/licenses/by-nc/3.0/) which per- mits unrestricted non-commercial use, distribution, and reproduction in any medium, provided the original work is properly cited. Copyright © 2019 Korean Society of Environmental Engineers Received April 4, 2018 Accepted July 15, 2018 † Corresponding author Email: [email protected] Tel: +91-651-2275444 Fax: +91-651-2275401/2275868 ORCID:0000-0002-6487-8029

Welcome message from author
This document is posted to help you gain knowledge. Please leave a comment to let me know what you think about it! Share it to your friends and learn new things together.
Transcript
220
1. Introduction
Waste has been an integral consequence of human existence since the beginning of civilization. As the world races toward its urban future, the amount of municipal solid waste (MSW), one of the most important by-products of an urban lifestyle, is growing even faster than the rate of urbanization. It is estimated that in 2012, globally about 3 billion urban residents generated waste at a rate of 1.2 kg per person per day (1.3 billion tonnes per year). By 2025 this will likely increase to 4.3 billion urban residents generating about 1.42 kg/capita/d of MSW (2.2 billion tonnes per year) [1].
The developing countries are fast shifting from agriculture-based nations to industrial and services-oriented countries. Due to con-tinuous migration of population from rural areas to towns and
cities, in India the share of urban population has increased from 10.84% in 1901 to 26.15% in 1991 to 31.2% in 2011. Accelerating urban population coupled with increasing per capita income and subsequent increase in MSW generation has made many Indian cities deficient in basic infrastructure solid waste management (SWM) services. The urban population in India generated about 114,576 MT/d of MSW in 1996; 127,486 MT/d during 2011-12; and 144,165 MT/d during 2013-14 [2, 3]. According to Planning Commission [4] estimates, the total quantity of waste currently handled each day in the urban areas is estimated to be 170,000 MT i.e. about 62 million MT annually. Per capita waste generation in cities varies from 0.2 kg to 0.6 kg per day [5] depending upon the size of population. An assessment has been made that per capita waste generation is increasing by about 1.3% per year [6-8].
Environ. Eng. Res. 2019; 24(2): 220-237 pISSN 1226-1025https://doi.org/10.4491/eer.2018.132 eISSN 2005-968X
A comprehensive optimization model for integrated solid waste management system: A case studyKoushik Paul1†, Subhasish Chattopadhyay2, Amit Dutta3, Akhouri P. Krishna4, Subhabrata Ray5
1Department of Civil & Environmental Engineering, BIT Mesra, Ranchi 835215, India2Solid Waste Management Department, Kolkata Municipal Corporation and Civil Engineering Department, Jadavpur University, Kolkata 700032, India3Civil Engineering Department, Jadavpur University, Kolkata 700032, India4Remote Sensing Department, BIT Mesra, Ranchi 835215, India5Department of Chemical Engineering, Indian Institute of Technology, Kharagpur 721302, India
ABSTRACTSolid waste management (SWM) is one of the poorly rendered services in developing countries – limited resources, increasing population, rapid urbanization and application of outdated systems leads to inefficiency. Lack of proper planning and inadequate data regarding solid waste generation and collection compound the SWM problem. Decision makers need to formulate solutions that consider multiple goals and strategies. Given the large number of available options for SWM and the inter-relationships among these options, identifying SWM strategies that satisfy economic or environmental objectives is a complex task. The paper develops a mathematical model for a municipal Integrated SWM system, taking into account waste generation rates, composition, transportation modes, processing techniques, revenues from waste processing, simulating waste management as closely as possible. The constraints include those linking waste flows and mass balance, processing plants capacity, landfill capacity, transport vehicle capacity and number of trips. The linear programming model integrating different functional elements was solved by LINGO optimization software and various possible waste management options were considered during analysis. The model thus serves as decision support tool to evaluate various waste management alternatives and obtain the least-cost combination of technologies for handling, treatment and disposal of solid waste.
Keywords: Kolkata Municipal Corporation (KMC), Linear programming (LP), Municipal solid waste (MSW), Optimization, Solid waste management (SWM)
This is an Open Access article distributed under the terms of the Creative Commons Attribution Non-Commercial License (http://creativecommons.org/licenses/by-nc/3.0/) which per-
mits unrestricted non-commercial use, distribution, and reproduction in any medium, provided the original work is properly cited.
Copyright © 2019 Korean Society of Environmental Engineers
Received April 4, 2018 Accepted July 15, 2018
† Corresponding authorEmail: [email protected]: +91-651-2275444 Fax: +91-651-2275401/2275868ORCID:0000-0002-6487-8029

Environmental Engineering Research 24(2) 220-237
221
Economical and infrastructural constraints, limited availability of land for disposal, lack of awareness and technical manpower, results in inefficient urban SWM. Although municipalities in India devote 75-95% of their financial resources towards collection and trans-portation of waste, yet, MSW collection efficiency ranges between 70-90% in major metro cities while it is around 50% in smaller towns – the remaining waste remains unattended in streets, dumps and low-lying areas and pollute the urban environment [9, 10]. In many cases, waste bins overflow and invite pests, rodents, birds and animals and cause vector-borne diseases to the residents.
More than 90% of MSW collected is disposed off without any treatment in open dumps without following the principles of sani-tary landfilling. Leachate produced by these open dumps con-taminates ground and surface water resources [11] while methane, a greenhouse gas, generated from these landfills increase global warming effect [12-14]. Besides these, landfill fires at these sites emit huge amounts of carbon monoxide, SO2, NOx, hydrocarbons, dioxins and furans to the lower atmosphere causing air pollution hazards.
It is estimated that if the waste is disposed off without treatment, more than 1,400 sq. km of land would be required in the country by the end of 2047 for its disposal of waste generated from 1997-2047 [5]. According to Planning Commission [4] data, if the current 62 million tonnes annual generation of MSW continues to be dump-ed without treatment, it will need 340,000 cubic meter of landfill space everyday (1,240 hectare per year). Considering a projected waste generation of 165 million tonnes by 2031, the requirement of land for setting up landfill for 20 y (considering 10 meter high waste pile) could be as high as 66,000 hectares of precious land, which our country cannot afford to waste.
Although segregation at source is a pre-requisite for successful processing/treatment of waste, yet there is no organized and scientifi-cally planned segregation of MSW either at household level or at community bins. Sorting and recycling of waste is mostly accom-plished by unorganized sector i.e. ragpickers.
Most of the transportation vehicles employed by municipal-ities/urban local bodies are old and require proper repair and maintenance. Running old vehicles without any scientific vehicle routing and planning, decreases waste collection and transportation efficiency and add pollutants to the air.
Waste disposed off in an unhygienic manner without any treat-ment not only deteriorates public health and degrades environment but also deprives the community of potential material and energy that could have been recovered prior to ultimate disposal. The untapped 62 million tons of waste generated annually in urban areas in India has a potential of generating 439 MW of power from 32,890 tons per day (TPD) of combustible wastes including Refused Derived Fuel (RDF), 1.3 million cubic meter of biogas per day or 72 MW of electricity from biogas and 5.4 million metric tonnes of compost annually to support agriculture [4].
2. Literature Review
Proper municipal solid waste management (MSWM) involves the application of the principle of integrated solid waste management (ISWM) [15-17]. ISWM is the application of suitable techniques,
technologies and management systems covering all types of solid wastes from all sources to achieve the twin objectives of (a) waste reduction and (b) effective management of waste still produced after waste reduction. It is a comprehensive waste prevention, re-cycling, processing and disposal program. With increasing pop-ulation and changing lifestyles, there is continuous escalation in solid waste generation worldwide and the existing techniques and facilities are ineffective in managing the solid wastes especially in developing countries – an easily-implementable and econom-ically feasible ISWM system that can effectively address and manage solid wastes is the need of the hour.
SWM is a multidisciplinary field requiring information about the physical, environmental, social, and economic implications of a SWM system. SWM planning should consider specific econom-ic, social and environmental impact – solid waste planning and policymaking are influenced by the availability of information about these impacts as well as societal values. The ISWM approach is designed to minimize the initial generation of waste through source reduction, then through reusing and recycling to further reduce the volume of materials being sent to processing and landfills, compared to the conventional approach of simply focusing on dis-posal of solid waste. Thus, the strategic approaches for ISWM involve the integration of available data with constraints, guidelines and framework.
Anderson [18] was the first to propose a mathematical model to optimise the waste management system. Since then, several researchers have developed SWM models as decision-support tools for technology selection, siting and sizing of waste processing facilities.
Rawal et al. [19] had divided the study area into zones - each zone has a ward which is the ‘waste centre’ or ‘waste source’. They proposed a VRP method that first minimized MSW collection vehicle routes. The optimized collection points were further utilized in the development of optimized model formulations. They com-pared two models – one, integer-linear (IL) programming program, where variables are the number of trucks and the other, mixed integer linear (MIL) program where variables are the amount of waste actually transported.
Rathi [20] had developed a linear programming model to integrate different options and stakeholders involved in MSW management in Mumbai. Different economic and environmental costs associated with MSW management were considered. In the model, she had taken into account community compost plants, mechanical aerobic compost plants and sanitary landfills as waste processing/disposal options while environmental costs were primarily taken from CIWMB (California Integrated Waste Management Board) literature [21].
Najm et al. [22] had introduced optimization techniques to design least cost SWM systems, considering variety of management processes. Their simplified model accounts for solid waste gen-eration rates, composition, collection, treatment, disposal as well as potential environmental impacts of various MSW management techniques.
Daskalopoulos et al. [23] had proposed a linear programming (LP) model considering both economic and environmental costs. In this model, the optimal MSW flows to different types of treatment alternatives are determined by minimizing a linear cost function. Environmental costs were calculated based on greenhouse gas emis-

Koushik Paul et al.
222
sions and their global warming potentials. As Najm et al. [22] had pointed out, ISWM is a critical managerial
topic, owing to its “complexity, uncertainty, multi-objectivity and subjectivity”. Decision makers have to consider several conflicting issues in mind at a time – while constituents of ISWM like waste generation, economic estimates are full of uncertainties. Similarly, depending on perspectives and methodology adopted, environ-mental valuation can be very subjective.
Najm and El-Fadel [24] had developed an ISWM model and subsequently a computer based interface using an Excel-Visual Basic environment. The interface was designed to request the re-quired data input from user through Excel worksheets.
Costi et al. [25] had proposed a constrained, non-linear decision model to plan the MSWM, defining the refuse flows that have to be sent to recycling /processing/ disposal units, suggesting the optimal number, the types and the siting of the plants. The objective function takes into account all possible economic costs, whereas constraints arise from minimum requirements for recycling, in-cineration process requirements, sanitary landfill conservation and mass balance. A very similar type of model was proposed by Fiorucci et al. [26], except that Costi et al. [25] had incorporated the environ-mental impacts of SWM system in their model.
Thus, for proper implementation of an ISWM system, there is a need to formulate a mathematical model for the SWM of a munici-pality, taking into account waste generation rates, composition, transportation modes, recycling, processing techniques, revenues from waste processing – simulating actual waste management as closely as possible – this will help as a decision support tool to select the best-suited, optimized system from various sets of solutions.
The aim of this research is to provide solutions for a better management of MSW in general, with special emphasis in the context of the scenario in a developing country. However, not much research has been done in this field – despite the fact that the SWM system in developing countries (like India) needs immedi-ate attention. Models proposed by Rawal et al. [19] and Rathi [20] have failed to accommodate all the parameters required to simulate the actual prevailing SWM collection, transportation and treatment systems. The model presented below, is quite generic in nature, and can be applied to any city in a developing country after accom-modating their datasets with small alternations and modification. It is readily applicable to any metro city in India, considering the fact that the pattern of MSW management system is almost similar throughout India. However, for validating and running the model and performing sensitivity analysis, Kolkata Municipal Corporation (KMC) datasets are being used.
3. Model Description
Planning a MSW management is a complex task, because it is necessary to simultaneously consider conflicting objectives; in addi-tion, such problems are generally characterized by an intrinsic uncertainty regarding costs and estimates [25]. To consider all conflicting objectives, the modeling of an SWM system demands multi-objective decision concepts and techniques. However, the multi-objective nature of the decision problem can be simplified by considering a single optimization objective of minimizing total
cost, and transforming all other objectives into constraints. The general problem that will be addressed in the model can be described as follows: given the quantities of waste generated at the sources (borough centers are taken as waste sources); the number, types, capacities and operating cost of conservancy vehicles; the location, operating cost and capacities of existing and proposed facilities; evaluate how the waste should be collected, transported, processed and disposed off, so as to minimize the overall cost. The model can be further used to explore the sensitivity of the proposed waste management system to various operational parameters, and predict the outcome of policy changes.
ISWM is considered for a city with proper segregation and treat-ment along with the following basic assumptions:
• Borough (administrative divisions of municipality) centers have been assumed as the waste generation points.
• Proper segregation done at source by providing two bins – one for biodegradable waste and the other for non-biodegradable waste.
• Intermediate/Central sorting (ICS) facility to be provided from where recyclable material will be sent for recycling. Revenue can be earned by selling the recyclables from recycling facility.
• Garbage enters central/intermediate sorter and subsequently to the different processing plants, while silt/rubbish goes straight to landfill without sorting or processing.
• Treatment and disposal of garbage will be done as per its charac-teristics – like high calorific value of waste may go for in-cineration and biodegradable organic waste for composting. In all treatment techniques, pre-sorting facilities will be there for further segregating the inert and recyclable from the waste coming from central sorter. Inert, process rejects and residues from treatment plant will go to engineered landfill.
• The municipality uses departmental and hired vehicles to trans-port wastes. Departmental vehicle takes garbage only while hired vehicles transport both garbage and silt/rubbish (silt and garbage are not mixed, but collected separately).
• There are different types of departmental vehicles but only one type of hired vehicle.
• The city is divided into zones for each dumpsite.• Minimum and maximum number of trips of departmental ve-hicles as well as for hired vehicles is fixed for each zone.
• The departmental vehicles will have to undertake certain mini-mum number of trips for each zone.
• The drivers and helpers of departmental vehicles will be paid incentives if they carry out more than minimum number of trips. Hired vehicles will be paid on the basis of tonnage of waste they transport to the dumpsites.
• For running the model, average waste generation data of the boroughs of the concerned municipality needs to be considered.
• Based on average waste actually carried by different types of vehicles from different boroughs, borough-wise minimum and maximum garbage carrying range (in fraction) for both de-partmental and hired vehicles need to be fixed. This makes the model flexible and more realistic.
• Environmental costs of the processing plants and landfilling has not been taken into account.
Based on the above assumptions, a material flow chart (Fig. 1) for every 100 MT of garbage generated at source has been developed.

Environmental Engineering Research 24(2) 220-237
223
Out of this 100 MT MSW generated, 5 MT of waste components is segregated and recycled at household level; the rest 95 MT enters the central sorting facility of a dumpsite and is subjected to different processing techniques present within that dumpsite. The silt/rub-bish fraction collected separately by the hired vehicles will head straightway to the landfill site located within each dumpsite, with-
out passing through sorter/incinerator/composting plant.Let us assume the general case where the city has D numbers
of dumpsites at D locations. Each dumpsite d has one central sorting station, one incinerator, one composting facility, one landfill and one recycling facility. From the central sorting facility, one stream is recycled to recycling facility, while other streams may go to
Fig. 1. Materials flow chart for garbage.

Koushik Paul et al.
224
incinerator, composting plant, or landfill as per the material flow chart illustrated in the Fig. 1. The incinerator and composting unit has pre-sorting units attached to them, so as to increase the efficiency of these processes. From these pre-sorting units, a small recyclable fraction may be dispatched to recycling facility while the inert fraction may be taken directly to landfill.
We need to minimize the total cost of SWM. The objective func-tion, taken as the total cost of SWM, may be expressed as:
Objective function (1)
CTRANSP CINCENT CTCX CTCS CTCI CTCCCTREVR CTREVC CTREVI
where CTCX, CTCS, CTCI, CTCC are the total land-filling cost, sorting cost, incineration cost and composting cost for all dumpsites d. The interpretations of the different parameters used in the sub-sequent equations have been elaborated in the Nomenclature section.
10
D
d dd
CTCX lfc xf
(2)
1
_D
d dd
CTCS sgf ics sortcost
(3)
1
_ _ 0D
d d d dd
sr ics rc sad ics adc
1
_ _D
d d d dd
CTCI sif ip opcost ir ip rc
(4)
_ _ 0d d d diar ip ac iir ip irc
1
_ _D
d d d dd
CTCC scf cp opcost cr cp rc
(5)
_ _ 0d d d dcir cp irc cpr cp prc
1
_ _D
d d d dd
CTREVR sr ics rr ir ip rr
(6)
_ 0d dcr cp rr
1_ 0
D
d dd
CTREVC cpd cp prdc (7)
1
_ 0D
d dd
CTREVI ip ip rev
(8)
10
DD
dddd
CTRANSP ctchh ctcdd
(9)
Total cost of collection and transportation of solid waste to the dumpsites includes the transportation cost for hired vehicles hh as well as the cost of transportation incurred by departmental ve-hicles dd. Incidentally, hired vehicles collect and transport both
garbage and silt, while departmental vehicles transport garbage only. Rates for garbage and silt collections are different. Also, garbage and silt transportation charges by hired vehicles are paid to them on the basis of different municipality zones from which the wastes are being transported. All liabilities of hired vehicles are the respon-sibility of the respective private agencies.
Total cost of waste transportation by hired vehicles from borough centers to dumpsites:
0ctchh ctcghh ctcshh (10)
Total cost of garbage transportation by hired vehicles from bor-ough centers to dumpsites:
, ,1 1
_ 0BB D
bb d bb dbb d
ctcghh qhhg bb hcg
(11)
Total cost of silt transportation by hired vehicles from borough centers to dumpsites:
, ,1 1
_ 0BB D
bb d bb dbb d
ctcshh qhhs bb hcs
(12)
Total cost of garbage transportation by dd type departmental vehicles is the summation of fuel cost, fixed cost of running vehicles and fixed cost of idle vehicles.
Waste transportation cost by dd type departmental vehicle from borough centre to dumpsite:
0dd dd dd ddctcdd cfueldd cfxdrdd cfxdidd (13)
1,2,...,dd DD
The fixed costs (cfxdrdddd and cfxdidddd) include annualized capital cost of departmental vehicles, maintenance cost and driv-er/helper cost. Everyday approximately 50 to 80% of the de-partmental vehicles run; other remain in idle/standby condition.
The cost of fuel incurred by dd type departmental vehicle:
, ,dd , ,1 1
_ 0D BB
dd bb d bb d ddd bb
cfueldd qg bb fc
(14)
1,2,...,dd DD
Total fixed cost for running dd type departmental vehicle:
_ _ 0dd dd ddcfxdrdd dd na dd fc (15)
1,2,...,dd DD
Total fixed cost for idle dd type departmental vehicle:
0( _ _ ) _dd dd dd ddcfxdidd dd no dd na dd ic (16)
1,2,...,dd DD
It is assumed that the municipality adheres to certain estimates regarding borough-wise minimum and maximum garbage carrying

Environmental Engineering Research 24(2) 220-237
225
quantity range for departmental and hired vehicles. The data is being used to set the following waste transportation constraints.
Garbage balance at a particular borough bb:
, , ,1 1 1
_D DD D
bb d dd bb d bbd dd d
qg qhhg bb wg
(17)
1,2,...,bb BB
Silt/Rubbish balance at a particular borough bb:
,1
_D
bb d bbd
qhhs bb ws
(18)
1,2,...,bb DD
Maximum amount of garbage dispatched from borough bb centre by dd type vehicle:
, , ,1
_ _D
bb d dd bb bb ddd
qg bb wg bb fgddmax
(19)
1,2,..., , 1,2,...,bb BB dd DD
Maximum amount of garbage dispatched from borough bb by hired vehicles hh:
,1
_ _D
bb d bb bbd
qhhg bb wg bb fghhmax
(20)
1,2,...,bb BB
Minimum amount of garbage dispatched from borough bb by dd type departmental vehicles:
, , ,1
_ _D
bb d dd bb bb ddd
qg bb wg bb fgddmin
(21)
1,2,..., , 1,2,...,bb BB dd DD
Minimum amount of garbage dispatched from borough bb by hired vehicles hh:
,1
_ _D
bb d bb bbd
qhhg bb wg bb fghhmin
(22)
1,2,...,bb BB
Equating feed to central sorter located at a dumpsite d:
, , ,1 1 1
0BB DD BB
d bb d dd bb dbb dd bb
sgf qg qhhg
(23)
1,2,...,d D
Balancing input and output streams for the central sorting facility located at dumpsite d:
0d d d d d dsgf sr sdd sad sif scf (24)
1,2,...,d D
Maximum amount recycled from sorter at dumpsite d:
_ 0d d dsr sgf ics ry (25)
1,2,...,d D
Maximum amount sorted for direct dumpable at dumpsite d:
_ 0d d dsdd sgf ics ddy (26)
1,2,...,d D
Maximum amount of sorted feed to incinerator plant:
_ 0d d dsif sgf ics maxinci (27)
1,2,...,d D
Maximum amount of sorted feed to composting plant:
_ 0d d dscf sgf ics maxcomp (28)
1,2,...,d D
Balance of incinerator recyclables at dumpsite d:
_ 0d d dir sif ip ry (29)
1,2,...,d D
Balance of incinerator inorganic rejects at dumpsite d:
_ 0d d diir sif ip iry (30)
1,2,...,d D
Balance of incinerator process ash rejects at dumpsite d:
_ 0d d diar sif ip ay (31)
1,2,...,d D
Electricity / power generated from incinerator at dumpsite d:
0d d dip sif f (32)
1,2,...,d D
Balance of composting plant recyclables at dumpsite d:
_ 0d d dcr scf cp ry (33)
1,2,...,d D
Balance of composting inorganic rejects at dumpsite d:

Koushik Paul et al.
226
_ 0d d dcir scf cp iry (34)
1,2,...,d D
Balance of composting process rejects at dumpsite d:
_ 0d d dcpr scf cp pry (35)
1,2,...,d D
Balance of composting plant product at dumpsite d:
_ 0d d dcpd scf cp prdy (36)
1,2,...,d D
Balancing landfill amount at dumpsite d:
0d d d dxf xsilt xfg xfrj (37)
1,2,...,d D
Balance of silt in landfill at dumpsite d:
,1
0BB
d bb dbb
xsilt qhhs
(38)
1,2,...,d D
Balance of direct dumpable + additional dumpable amount at landfill at dumpsite d:
0d d dxfg sdd sad (39)
1,2,...,d D
Balancing all process rejects to landfill at dumpsite d:
0d d d d dxfrj iir cir iar cpr (40)
1,2,...,d D
Maximum and minimum capacity limits of central sorter at dumpsite d:
_d dsgf ics capmax (41)
1,2,...,d D
_d dsgf ics capmin (42)
1,2,...,d D
Maximum and minimum capacity limits of incinerator at dump-site d:
_d dsif ip capmax (43)
1,2,...,d D
_d dsif ip capmin (44)
1,2,...,d D
Constraints for capacity of landfill at dumpsite d:
d dxf lfcapmax (45)
1,2,...,d D
Constraints for capacity of composting plant at dumpsite d:
_d dscf cp capmax (46)
1,2,...,d D
_d dscf cp capmin (47)
1,2,...,d D
We assume that the municipal area is divided into z number of zones for each dumpsite d. The zone divisions are made based on their proximity to the dumpsite d e.g. Zone 1 is nearer to the dumpsite d while Zone 2 is far from d. The municipality has fixed maximum and minimum trip limits for each zone z of a dumpsite d for a dd-type departmental vehicle. The drivers and the helpers are paid incentives if they undertake trips beyond the minimum trip limits stipulated for a particular zone. Similarly, the hired vehicles hh are paid according to the zone z (of a dumpsite d) from where they are transferring waste. Constraints based on the number of trips made by departmental vehicles in a zone z of a dumpsite d:
, , , ,1
_ 0
1,2,..., , 1,2,..., , 1,2,..,
BB
dd d z dd bb d ddbb
at dd cap qg
dd DD d D z Z
(48)
In calculating ∑qgbb,d,dd, only those bb boroughs are considered which belong to the zone z of the dumpsite d.
Actual number of trips made by hired vehicle hh in a zone z of a dumpsite d for collection of garbage:
, ,1
_ 0BB
d z bb dbb
athhg hhg cap qhhg
(49)
1,2,..., , 1,2,...,d D z Z
In calculating ∑qhhgbb,d, only those bb boroughs are considered which belong to the zone z of the dumpsite d.
Actual number of trips made by hired vehicle hh in a zone z of a dumpsite d for collection of silt:
, ,1
_ 0BB
d z bb dbb
athhs hhs cap qhhs
(50)
1,2,..., , 1,2,...,d D z Z
In calculating ∑qhhsbb,d, only those bb boroughs are considered

Environmental Engineering Research 24(2) 220-237
227
which belong to the zone z of the dumpsite d.Considering maximum trips of dd type departmental vehicle
in zone z of d:
, , , ,_ _1,2,..., , 1,2,..., , 1,2,...,
dd d z dd dd d zat dd na zz maxtrip
d D dd DD z Z
(51)
Maximum possible trip limit by dd type vehicle in all dumpsite d, all zone z:
, ,1 1
_D Z
dd d z dd ddd z
at dd na maxzz_maxtrip
(52)
1,2,...,dd DD
Minimum possible trip limit by dd type vehicle in all dumpsite d, all zone z:
, ,1 1
_D Z
dd d z dd ddd z
at dd na minzz_mintrip
(53)
1,2,...,dd DD
Balancing amount of garbage transported by dd type departmental vehicle to dumpsite d from zone z of d:
, , , ,1
0BB
dd d z bb d ddbb
Dg qg
(54)
1,2,..., , 1,2,..., , 1,2,...,z Z d D dd DD
∑qgbb,d,dd is the total amount of garbage taken by dd type vehicle to dumpsite d from all those bb boroughs which belong to zone z of d.
Balancing amount of garbage transported by hired vehicle hh to dumpsite d from zone z of d:
, ,1
0BB
d z bb dbb
Dghh qhhg
(55)
1,2,..., , 1,2,...,z Z d D
∑qhhgbb,d is the total amount of garbage taken by hired vehicle hh to dumpsite d from all those bb boroughs which belong to zone z of d.
Balancing amount of silt transported by hired vehicle hh to dumpsite d from zone z of d:
, ,1
0BB
d z bb dbb
Dshh qhhs
(56)
1,2,..., , 1,2,...,z Z d D
∑qhhsbb,d is the total amount of silt taken by hired vehicle hh to dumpsite d from all those bb boroughs which belong to zone z of d.
Calculation of incentives to be paid to dd-type departmental vehicle drivers and helpers can be approximated by:
1
0DD
dddd
CINCENT cinc
(57)
, ,1 1
_
D z
dd dd d z incdd ddd z
cinc Dg r dd na
(58)
_
1,2,...,
dd dd incddminzz_mintrip dd cap r
dd DD
4. Applying the Model for Kolkata City: A
Case Study
The city of Kolkata (formerly Calcutta) is more than 300 years old and it served as the capital of India during the British governance until 1911. Kolkata (Fig. 2) is the capital of the Indian state of West Bengal; and is the main business, commercial, and financial hub of eastern India and the north-eastern states. Kolkata (latitude 22° 33´ North and longitude 88° 30´ East) has an area of about 187.33 sq. km and a population of about 10 million (including floating population).
In Kolkata, the major disposal ground is Dhapa (21.47 ha) located in the eastern side of the city. It receives about 3,000-3,200 MT of solid waste per day. Another site at Garden Reach (3.52 ha) receives only about 100-150 MT of solid waste per day [2, 27]. Considering putrescible nature of waste, collection and disposal has to be done on a daily basis. Collection, transportation and
Fig. 2. Location of Kolkata city, West Bengal, India.

Koushik Paul et al.
228
disposal of MSW in Kolkata encompass an extremely complex set of operations. In the early morning hours, conservancy staffs arrive at their assigned areas with handcarts and blow their whistles requesting residents to deposit wastes in their handcarts. The hand-carts are then taken to the nearby vat/container locations and MSW is transferred to the vats/container locations. Total collection points in the city is around 650 with 365 mild-steel MS skips/containers, 20 direct loading, and 265 open vat points [27].
Currently, waste transport system utilizes private-owned lorries to transport 40% of the daily generated garbage and entire amount of the silt/rubbish. Haulage capacity of these vehicles is currently 7 MT for garbage and 9 MT for silt, assuming waste is being loaded onto these lorries using payloaders. Each lorry visits open vat loca-tion(s) and after their haulage capacity is exceeded, the vehicles proceed to the dumping ground.
The remaining 60% of MSW (garbage only) is transported by six categories of KMC-owned vehicles. Of late, KMC has embarked on modernizing its waste transportation fleet by purchasing compac-tors and the transportation system has undergone remarkable change over the last few years.
• Container carrying vehicles (Dumper-Placers): One Dumper- Placer (DP) can hoist and transport only one skip/container at a time to the disposal ground. KMC currently uses two types on skips – 4.5 m3 size (1.75 MT haulage capacity DP) and 7 m3 size (2 MT haulage capacity DP). DD1 and DD2 refer to 1.75 MT and 2 MT Dumper Placer, respectively.
• Payloader loaded Tipper Trucks (11 m3), DD3: These trucks haul around 7.0 MT of MSW in one single trip to Dhapa.
• Stationary compactor-cum-hook loader combination (10.5 m3/9 MT), DD4: KMC is purchasing 198 stationary compactors to be placed at 85 compactor stations. These compactors reduce 30% waste volume by applying 140 bar pressure. KMC is also acquiring 54 hook loaders, to haul these stationary compactors to Dhapa. Each hook loader can haul one stationary compactor at a time.
• Movable compactors (14 m3/10 MT), DD5: KMC is purchasing 64 numbers of 14 m3 capacity movable compactors. It takes waste from six 4.5 m3 skips (or from handcarts), compact it at 140 bar pressure, and hauls waste to the landfill site.
• Movable compactors (8 m3/7 MT), DD6: KMC is purchasing 4 numbers of 8 m3 capacity movable compactors. These smaller sized compactors can manoeuvre narrow streets and lanes.
Waste is simply dumped and spread at the landfilling sites by the dumpers without any sorting, treatment and/or compaction. Only a minor fraction of waste is segregated and recycled at house-hold level and by ragpickers at vats and landfills. KMC spends 70 to 75% of its total SWM budgetary allocation on collection
of solid waste, 25 to 30% on transportation, thus leaving a meager 5% for final disposal. On an average, 305 vehicles collect and transport waste to disposal ground daily, out of which 105 are KMC-owned and 200 are private hired vehicles. There are six main vehicle garages and four subsidiary garages from where KMC ve-hicles operate daily to transport wastes from vat/container locations to the disposal ground. 30-35% of KMC vehicles are more than 7 years old while 80% of the hired vehicles are more than 20 years old [27].
Currently, there is no incinerator/RDF plant in Kolkata. Neither waste segregation/sorting exist nor is sanitary landfilling practiced. A 700 MT/d compost plant running on PPP (public-private partner-ship) model at Dhapa disposal ground processes only 150 MT/d during most of the times. However, with the Ministry of Urban Development, Govt. of India promoting and funding “Swachh Bharat Mission” in a big way, one expects SWM will be managed in a more modern and scientific way in very near future. “Swachh Bharat Mission” envisages capacity augmentation of urban local bodies (ULBs), 100% collection, transportation and processing of solid waste and private-public partnership (PPP) in setting up and operation of waste processing units. This will require re-organizing and overhauling the entire SWM system for Kolkata. The paper thus proposes an ideal ISWM system model for Kolkata having two-bin system at household level, sorting stations (ICS), processing plants (incinerators, composting plants) and sanitary landfills but with the same waste characteristics and waste transportation infra-structure as currently exist – with the ultimate goal to optimize the overall cost of such an SWM system.
Considering the fact that landfill space for Dhapa has already got exhausted, our model proposes setting up of three dumpsites at North (near Akandaberia, Haroa), South (near Kalicharanpur village, Nepalgunj) and East (near Noara, Bodura) of Kolkata. The logic behind the choice of these three disposal sites is presented in an earlier literature of the corresponding author [28]. A borough may find it economic to divert its waste to any of the North, South or East dumpsites as dictated by our model. Each dumpsite has a central sorting station, an incinerator, a composting plant and a sanitary landfill facility. The shortest path distance between each borough center (assumed to be waste source) and dumpsite has been calculated using Geographic Information System (GIS). Based on these shortest path distances, the waste transportation costs for departmental and hired vehicles have been computed. Fig. 3 shows the borough divisions of KMC area, their centers and the three proposed dumpsites.
Present physical composition of Kolkata waste (garbage portion only) and the recyclable portion at sources/vat points/landfills are illustrated below in Table 1 and 2.
Table 1. Average Physical Composition of Municipal Solid Waste (Considering Garbage Fraction Only) [27, 29]
Total compos-tables
Recyclables Others including inerts
TotalPaper Plastic Glass Metal
Inert in garbage
Rubber and leather
RagsWooden matter
Coconut Bones
50.56 6.07 4.88 0.34 0.19 29.60 0.68 1.87 1.15 4.50 0.16 100
50.56 11.48 37.96 100
All values are expressed in percentage on wet weight basis

Environmental Engineering Research 24(2) 220-237
229
Table 2. Proportion of Recyclable Materials in Garbage in Kolkata at Present [30, 31]
MaterialsOriginal
compositionRecyclable portion at
source and at landfill site
Paper 6.07 5.00 (82%)
Plastic 4.88 3.38 (70%)
Glass 0.34 0.27 (80%)
Metal 0.19 0.15 (80%)
From others:
Rubber & leather 0.68 0.41 (60%)
Total 12.16 9.21*
*Out of this 9.21%, about 5% is recycled at household level and 4.21% is recycled by ragpickers in the existing system.
Table 3. Quantity of Garbage Entering Different Processing Plants for Each 100 MT Garbage Generation [31]
OperationsQuantity
(T)
Sorter (ICS) 95
Total recyclable (including recyclables from pre-sorters) 10.75
Input for thermal processing 16
Input for composting processing 65
Total inerts 29.6
From data presented in Table 1 and Table 2, we have calculated the amount of total recyclable materials, total input material for the incinerator and total input for composting plant located at each of the proposed dumpsites, considering a total garbage gen-eration of 100 MT (depicted in Table 3).
5. Model Validation
Validation of the model was done with 2007 actual KMC data. Although KMC SWM system was not model-optimized, yet over the years with experience, the municipality officials had generated their own optimal system. For our model validation, total cost, waste transportation quantity and costs by different vehicles, fuel costs and other parameters of actual MSW management system are compared with the model results simulating 2007 KMC situation. To simulate SWM system prevailing in KMC area in 2007, following modifications were made in our model.
• Borough-wise garbage and silt generations were modified to that of 2007 waste generation data.
• Departmental vehicles were of 4 types at that time – DD1, DD2, DD3 and DD4. DD1, DD2, DD3 are the same as exists now. However DD4 were the manually loaded 8 m3 tipper trucks, which has been abolished now. Fixed and idle costs, incentive rate, fuel costs, minimum and maximum number of trips of all these vehicle were calculated as per 2007 values.
• The East dumpsite has been taken as the existing dumpsite
Fig. 3. Figure showing KMC borough divisions with their centers, the three proposed dumpsites and road network. 1, 2 and 3 are the dumpsitesat East, North and South, respectively.

Koushik Paul et al.
230
at Dhapa and per ton fuel cost for departmental vehicle waste transportation from borough centers to Dhapa were calculated using 2007 diesel rate. The North and South dumpsites were not taken into consideration by fixing the sorter capacity and landfill capacity at these two sites to zero – thus effectively blocking any waste transportation to these sites. Similarly per ton waste transportation costs from borough-centers to East (Dhapa) dumpsite for hired vehicles were re-calculated using 2007 diesel rates.
• Incinerator capacities for all sites was kept zero; composting plant capacity for East (Dhapa), North and South dumpsites was fixed at 150 MT/d and 0 MT/d and 0 MT/d, respectively. The 150 MT/d composting plant attaching to Dhapa was running on PPP model – we assumed that KMC received Rs. 87.5 / MT of waste processed as royalty.
• Cost of open dumping (without liner, leachate/gas collection mechanism) at Dhapa was taken as Rs. 95/MT.
The LP optimization problem was solved on a computer (Intel Pentium Dual-Core processor having 1.86 GHz processor speed, Windows XP OS) using LINGO v 9.0 optimization software package. On running the model, the amount of waste (silt + garbage) disposal for different boroughs by different vehicle types came out as depicted in Fig. 4.
As per 2007 KMC records, ratio of total quantity of waste (i.e. garbage + silt/rubbish) transported by departmental and hired ve-hicles is 33:67. But model provides a ratio of 37:63. If garbage disposal only is considered, then model prefers a ratio of 42:58 as against KMC record of 37:63. The model, thus, prefers 5% excess waste transportation by departmental vehicles as their variable
Fig. 4. Quantity of waste transferred by individual vehicle types from different boroughs to East (Dhapa) dumpsite.
portion (fuel + incentive costs) of transportation cost is less than the transportation cost of hired vehicles.
Total transportation cost (including incentive) for departmental and hired vehicles for actual MSW management system by KMC was Rs. 815,225.07/d in 2007, while validation model gave Rs. 735,928.75/d. Model analysis provides the optimized value for 2007 scenario; so there was an opportunity to minimize transportation costs by about 10%. Total actual fuel cost incurred for departmental vehicles was around Rs. 120,000/d (KMC 2007 data) which is more than twice the value provided by the model (Rs. 55,000/d). This is expected, since the model optimizes vehicle routing and schedul-ing while fuel pilferage is suspected for departmental vehicles in real-life.
Model predicts a garbage transportation cost of Rs. 223,864.7/d by hired vehicles, which is about 5% lower than actual cost (Rs. 236,000/d). The higher value of garbage transportation by hired vehicle is mainly due to higher amount of garbage transportation on regular basis and sometimes accidental services rendered for urgent removal of solid waste.
Model generates total incentive cost of Rs. 4,673.46 for de-partmental vehicles which is less than the actual cost (Rs. 6,600; KMC 2007 data). The difference may be due to mismanagement of the monitoring system, and due to emergency night services rendered in certain cases by departmental staff.
Actual revenue earned by KMC in 2007 as royalty from sale of compost is same as predicted by the model (Rs. 3,510.561/d). Cost comparison of model analysis for MSW management for year 2007 and actual cost incurred in 2007 by KMC for SWM system is shown in Table 4.
The above validation of the existing model shows very good results and also indicates ~7.5% total cost minimization was possible during 2007. So, the basic model can be used for further analysis.
6. Solving the Model for a Futuristic Scenario
Data on MSW management in India is not easily available; also costs of the various functional elements of MSW tend to vary across municipalities over the country. We have assumed values of cost-related decisions variables and parameters (Table 5) taking into account our experience of present day (2015) costs in KMC, literature pertaining to other municipalities in India, government reports, DPR (detailed project reports) of proposed SWM projects, etc.
Table 4. Table Showing Comparison between Actual Cost in 2007 and Model-predicted Cost
Individual itemsCost (as given by optimization model)
(in Rs./d)Cost (in practical situation)
(in Rs./d)Cost variation (%) in model compared to actual situation
Cost of transportation including incentives
735,928.75/- 815,225.07/- 9.73% decrease
Revenue from compost 3,510.56/- 3,510.56/- 0%
Cost of landfill 253,498.80/- 255,153.42/- 0.64% decrease
Total expenditure 986,836.1/- 1,066,867.93/- 7.5% decrease

Environmental Engineering Research 24(2) 220-237
231
Case 1:
In this case, we have considered all the six types of vehicles run by KMC at present, and considered all the three dumpsites open. We have fixed minimum capacity of all sorters, incinerators, composting plants, landfill as zero, while assuming sufficient high values for their maximum capacity – thus encouraging the model to run without any constraint. Under such circumstances, the total cost of model-optimized SWM system came out as Rs. 2,288,205/d.
Fig. 5. Figure illustrates quantity of waste transported by different vehicle types from different boroughs (Case 1).
The quantity of waste transported by individual vehicle types from different boroughs to East, North and South dumpsites is depicted in Fig. 5.
Analysis results of waste quantity (garbage + silt) transported to different dumpsites and subsequently subjected to different proc-essing techniques (garbage) is shown in Fig. 6. The model favours waste to be transferred to the South dumpsite, since it is nearer and reduces transport cost.
Fig. 6. Waste quantity entering different dumpsites and processing plants (Case 1).
Table 5. Values of Cost-related Variables in Rs./MT [31] (In 2015, 1 USD = Rs. 65)
Cost-related input data Notations Values assumed
Cost of sanitary landfilling, including cost of land lfcRs. 197.50/MT (East),
Rs. 204.14/MT (North), Rs. 193.58/MT (South)
Operational cost of incinerators (including annualized capital cost, transportation cost from sorter to incinerator)
ip_opcost Rs. 1,435/MT
Transportation cost of recyclables from incineration to recycling facility ip_rc Rs. 50/MT
Transportation cost of incineration ash reject to landfill ip_ac Rs. 30/MT
Transportation cost of incineration inorganic reject to landfill ip_irc Rs. 30/MT
Selling price of compost cp_prdc Rs. 2,500/MT
Revenue from recyclables from sorter ics_rr Rs. 367.85/MT
Revenue from recyclables from incineration plant ip_rr Rs. 50/MT
Revenue from recyclables from composting plant cp_rr Rs. 50/MT
Revenue earned by selling power from Waste-to-Energy incinerators ip_rev Rs. 4.09 /kWh unit
kWh units of electricity generated from unit MT of solid waste undergoing incineration f 170 kWh
Operational cost of sorter in each dumpsite ics_sortcost Rs. 100/MT
Cost of transporting recyclable material from sorter to recycling facility ics_rc Rs. 50/MT
Per ton additional dumping cost of waste from sorter to landfill ics_adc Rs. 30/MT
Operational cost of composting facility (including annualized capital cost, transportation cost from sorter to composting plant)
cp_opcost Rs. 269/MT
Operational cost of incinerator (including annualized capital cost, transportation cost from sorter to composting plant)
ip_opcost Rs. 689/MT
Transportation cost of recyclable materials from composting plant to recycling facility cp_rc Rs. 50/MT
Transportation cost of inorganic rejects from composting plant to landfill cp_irc Rs. 30/MT
Transportation cost of process rejects from composting plant to landfill cp_prc Rs. 30/MT

Koushik Paul et al.
232
Total transportation cost and incentive cost incurred by different vehicle types is illustrated in Fig. 7.
Fig. 7. Figure showing transportation cost and incentive cost for different vehicle types (Case 1).
Case 2:
In this case also, we have considered all the six types of vehicles run by KMC at present, and assumed all the three dumpsites open. However, we have restricted entry to the three dumpsites by fixing each sorter capacity to 1,100 MT/d. We have also considered RDF-based incinerator plants at the three dumpsites. Table 5, thus, has been modified with the following values:
• Revenue earned by selling power from RDF-based Waste-to-Energy incinerators: Rs. 6.50/kWh (considering a lev-elized unit cost of electricity (LUCE) generation of Rs. 7.55/kWh unit).
• kWh units of electricity generated from unit MT of solid waste undergoing incineration in RDF plant: 200.
• Operational cost of RDF plant (including annualized capital cost, transportation cost from sorter to composting plant): Rs. 1,435/MT.
Under such circumstances, the total cost of model-optimized SWM system came out as Rs. 2,517,281/d. The quantity of waste transported by individual vehicle types from different boroughs to East, North and South dumpsites is depicted in Fig. 8.
Fig. 8. Figure illustrates quantity of waste transported by different vehicle types from different boroughs (Case 2).
Optimization results of waste quantity (garbage + silt) trans-ported to different dumpsites and subsequently subjected to differ-ent processing methods (garbage) at those dumpsites are detailed in Fig. 9.
Total transportation cost and incentive cost incurred by different vehicle types is depicted in Fig. 10.
Fig. 9. Waste quantity entering different dumpsites and processing plants (Case 2).
Fig. 10. Figure showing transportation cost and incentive cost for different vehicle types (Case 2).
7. Discussion
The model was first validated using 2007 KMC datasets. During 2007, there was only one dumpsite in Dhapa, while there were no sorting/incineration/engineered landfill facility; a composting plant occasionally processed 150 MT/d of waste. Overall SWM cost in 2007 as predicted by the model is Rs. 986,836.10/d while the actual cost was Rs. 1,066,867.93/d (7.5% deviation).
The overall SWM cost is Rs. 2,288,205/d and the total cost of O & M (including land cost, construction cost) of the waste treatment plants (viz. sorter, composting plant, incinerator) is Rs. 1,168,935.4/d for Case 1. Although the cost of waste treatment is high yet, it is to be appreciated that the treatment plants are responsible for 66% of waste reduction. Such a huge amount of waste reduction increases lifespan of landfills and saves land re-

Environmental Engineering Research 24(2) 220-237
233
sources; additionally the treatment processes along with recycling earns a revenue of Rs. 1,684,376.99 per day. Since only process rejects, inert, incineration ash and silt are transported to the en-gineered landfill sites, chances of methane generation and leachate contamination will be less. Considering methane’s global warming potential and leachate’s polluting effect on water resources, the environmental cost benefit of proposed ISWM model added to the revenues earned will surpass the O & M costs of these treatment plants.
In Case 1, the minimum capacity of sorter, incinerator (mass-burn type), composting plant and landfill at each of the three disposal sites is kept zero, while maximum capacity is kept sufficiently high (unlimited) – thus encouraging the model to run without any capacity constraint. Almost the entire waste is transported to the South disposal site, since it is the nearest and per MT waste transportation cost is the least. 1,960 MT (61.76%) of waste under-goes composting compared to 482 MT (15.2%) of waste which goes to the incinerator.
It has been observed in Case 1 that, 97.79% waste is directed to the South disposal site, and the rest 2.2% to the North disposal site – this happens because the South disposal site is the nearest. Without any restriction, South landfill site will exhaust early, while infrastructure built at East and North will remain idle. Thus, in Case 2, sorter capacity has been restricted to 1,100 MT/d; also an RDF-based incinerator plant has been proposed instead of a mass-burn incinerator. Case 2 shows a 107% jump in incineration cost, while overall SWM cost and total transportation cost have increased by 10% and 6.13%, respectively. Results show that 44.39% of waste has entered South disposal site, 34.66% to the East and 20.95% to the North.
There is, however, not much difference in the waste quantity collected by different vehicle types from the boroughs between Case 1 and Case 2.
8. Conclusions
With MSW Rules, 2000 [17] and the recently notified SWM Rules, 2016 [32] focusing on source segregation, treatment, sanitary land-filling (with landfilling at the bottom of hierarchy) and government formulating policies in favour of composting and waste-to-energy plants including incentivizing them – urban local bodies in India are currently getting overhauled in terms of capacity building and infrastructure augmentation. Meanwhile, changes in socio-econom-ic conditions since the 1990s have brought dramatic changes in MSW composition over the last two decades [4, 32]. Such changes in MSW composition has been documented for KMC waste also [27, 33]. Planning Commission Report [4] thus includes in-cineration/pyrolysis/gasification waste to energy plants as techno-logical options to manage MSW for cities having population greater than 1 million. No doubt the waste composition in big Indian metropolitan cities has reached such a stage where incineration can be considered as a viable waste treatment option and several waste-to-energy incineration/RDF plants are under construction in Indian megacities. Although KMC does not have an in-cinerator/RDF/sorter facility at present, yet, no doubt in very near
future, these facilities will to be set up so as to abide by the SWM Rules, 2016. This is precisely where the model can be used as a decision support system to examine the financial viability of a treatment facility (like sorter, incineration, RDF, composting, etc.)/collection system and optimize total SWM cost. Using the model, further optimization can be attempted by reducing (and hence optimizing) the number of different types of KMC de-partmental vehicles (keeping the amount of waste transported by each vehicle type constant). Simulating, analyzing and optimizing the system after introduction of transfer stations in the model will be another interesting topic. Decision makers need to consider different waste management alternatives and select the least-cost combination of technologies for handling, treatment and disposal of MSW.
The aim is to assist decision makers by providing an optimum waste management system given the available data and constraints. The model presented is quite flexible and generic in nature and is applicable for any city in a developing country with minor modifications. For example, a municipality may employ de-partmental fleet only and may not have hired vehicles; under such circumstances the user may not consider hired vehicles in the equations. The research underlines how ISWM planning with opti-mization models not only reduces SWM cost, but also conserves environment (minimizes land for landfilling, reduces leachate con-tamination, decreases methane generation, etc.) – thus promoting a development which is both environmentally and economically sustainable.
Nomenclature
• Indices:
BB Total number of boroughs. For KMC’s case, BB = 15bb Index for boroughs (1..BB)D Total number of dumpsites. For KMC’s case, we assume
D = 3.d Index for dumpsite site (1..D)DD Total number of departmental vehicles types. For KMC’s
case, DD = 6.dd Index for departmental vehicle (1..DD)HH Total number of hired vehicles types. There is only one
type of hired vehicle in KMC i.e. HH = 1.hh Index for hired vehicleZ Total number of zones associated with each dump site
d. In KMC’s case, we assume Z = 2.z Index for zones associated with a particular dumpsite d
(1..Z)
• Input data in the form of matrices:
bb_fcbb,d,dd Average fuel cost for transporting per ton waste from borough bb to dumpsite d by a dd type vehicle, Rs/MT. (BB × D × DD) matrix.
bb_fgddmaxbb,dd Maximum fraction of garbage transported by dd type departmental vehicles from borough bb. (BB × DD) matrix.

Koushik Paul et al.
234
bb_fgddminbb,dd Minimum fraction of garbage transported by dd type departmental vehicles from borough bb. (BB × DD) matrix.
bb_fghhmaxbb Maximum fraction of garbage transported by hired vehicles hh from borough bb. (BB × HH) matrix.
bb_fghhminbb Minimum fraction of garbage transported by hired vehicles hh from borough bb. (BB × HH) matrix.
bb_hcgbb,d Per ton transportation cost of garbage from borough bb center to dumpsite d for a hired vehicle, Rs./MT. (BB × D) matrix.
bb_hcsbb,d Per ton transportation cost of silt from bor-ough bb center to dumpsite d for a hired vehicle, Rs./MT. (BB × D) matrix.
bb_wgbb Amount of garbage generated in borough bb, MT. (BB × 1) matrix.
bb_wsbb Amount of silt generated in borough bb, MT. (BB × 1) matrix.
cp_capmaxd Maximum capacity of the composting plant at a dumpsite d, MT. (D × 1) matrix.
cp_capmind Minimum capacity of the composting plant at a dumpsite d, MT. (D × 1) matrix.
cp_ircd Transportation cost of inorganic rejects from composting pre-sorter to landfill at d on a per ton basis, Rs/MT. (D × 1) matrix.
cp_iryd Composting inorganic reject fraction coming out from the composting plant pre-sorter, at dumpsite d. (D × 1) matrix.
cp_opcostd Per ton operational cost of the composting plant including cost of construction and op-eration of composting plant and trans-portation cost from the central sorting facility to composting plant, Rs/MT. (D × 1) matrix.
cp_prcd Transportation cost of composting process rejects from composting plant pre-sorter to the landfill at dumpsite d, Rs/MT. (D × 1) matrix.
cp_prdcd Selling price of the compost, Rs/ ton for a dumpsite d. (D × 1) matrix.
cp_prdyd Composting product (compost) to compost-ing plant feed ratio at a dumpsite d. (D × 1) matrix.
cp_pryd Compost plant process rejects fraction com-ing out from the composting plant at dump-site d. (D × 1) matrix.
cp_rcd Per ton transportation cost of recyclables from composting plant pre-sorter for a partic-ular dumpsite d to recycling facility at d, Rs/MT. (D × 1) matrix.
cp_rrd Revenues earned from selling recyclable ma-terials sorted out from composting pre-sorter at a dumpsite d, Rs/MT. (D × 1) matrix.
cp_ryd Recyclable fraction of waste coming out from composting plant pre-sorter at d. (D × 1) matrix.
dd_capdd Average waste carrying capacity of a dd type of vehicle, MT. (DD × 1) matrix.
dd_fcdd Fixed running cost for each dd type de-partmental vehicle, Rs. (DD × 1) matrix.
dd_icdd Fixed idle cost for each dd type departmental vehicle, Rs. (DD × 1) matrix.
dd_nadd Total number of dd type departmental ve-hicles running. (DD × 1) matrix.
dd_nodd Total number of dd type departmental vehicles. (DD × 1) matrix.
fd kWh units of electricity generated by proc-essing unit MT of MSW in incinerator at dumpsite d. (D × 1) matrix.
hhg_cap Average garbage carrying capacity for hired vehicle hh, MT. (HH × 1) matrix.
hhs_cap Average silt carrying capacity for hired ve-hicle hh, MT. (HH × 1) matrix.
ics_adcd Per ton cost of additional dumping from sort-er to landfill at d, Rs/MT. (D × 1) matrix.
ics_capmaxd Maximum capacity of the central sorting fa-cility at a dumpsite d, MT. (D × 1) matrix.
ics_capmind Minimum capacity of the central sorting fa-cility at a dumpsite d, MT. (D × 1) matrix.
ics_ddyd Direct dumpable fraction of solid waste com-ing out from sorter at dumpsite d. (D × 1) matrix.
ics_maxcompd Compostable fraction of solid waste coming out from sorter at dumpsite d. (D × 1) matrix.
ics_maxincid Incinerable fraction of solid waste coming out from sorter at dumpsite d. (D × 1) matrix.
ics_rcd Cost of transporting recyclable material seg-regated from the sorter at dumpsite d to re-cycling facility, Rs/MT. (D × 1) matrix.
ics_rrd Revenue earned by selling per ton of re-cyclable materials generated from the sorting station attached to dumpsite d, Rs/MT. (D × 1) matrix.
ics_ryd Recyclable fraction of solid waste coming out from sorter at dumpsite d. (D × 1) matrix.
ics_sortcostd Operational cost of sorting per ton of solid waste for the central sorting station asso-ciated with the dumpsite d, Rs/MT. (D × 1) matrix.
ip_acd Per ton cost of transporting incinerator ash reject portion from pre-sorter to landfill for a particular dumpsite d, Rs/MT. (D × 1) matrix.
ip_ayd Incineration ash reject (incineration prod-uct) fraction coming out from the incinerator at dumpsite d. (D × 1) matrix.
ip_capmaxd Maximum capacity of the incinerator at a dumpsite d, MT. (D × 1) matrix.
ip_capmind Minimum capacity of the incinerator at a dumpsite d, MT. (D × 1) matrix.
ip_ircd Transportation cost of transferring inorganic rejects from incinerator pre-sorter to landfill

Environmental Engineering Research 24(2) 220-237
235
attached to dumpsite d, Rs/MT. (D × 1) matrix.
ip_iryd Incineration inorganic reject fraction coming out from incinerator pre-sorter at dumpsite d. (D × 1) matrix.
ip_opcostd Operational cost of the incinerator at dump site d, Rs/MT. It includes the construction and operational cost of incinerator and the transportation cost of incinerable waste from the sorting facility to the incinerator. (D × 1) matrix.
ip_rcd Per ton transportation cost of the recyclables from the incinerator pre-sorter attached to the dumpsite d, to the recycling facility at d, in Rs/MT. (D × 1) matrix.
ip_revd Revenue that can be earned in selling one kWh unit of electricity generated from the incinerator associated with dumpsite d, Rs/kWh. (D × 1) matrix.
ip_rrd Revenues earned from selling recyclable ma-terials sorted out from incinerator pre-sorter at a dumpsite d, Rs/MT. (D × 1) matrix.
ip_ryd Recyclable fraction of waste coming out from incinerator pre-sorter at d. (D × 1) matrix.
lfcapmaxd Maximum capacity of the landfill at dump-site d, MT. (D × 1) matrix.
lfcd Landfilling cost in Rs/MT of solid waste for the landfilling site associated with a dump site d. It includes cost of land, liner, cover material, leachate collection and treatment cost. (D × 1) matrix.
maxzz_maxtripdd Maximum value of zz_maxtripdd,d,z for a par-ticular dd type vehicle, considering all dumpsites d. (DD × 1) matrix.
minzz_mintripdd Minimum value of zz_mintripdd,d,z for a par-ticular dd type vehicle, considering all dumpsites d. (DD × 1) matrix.
rinc dd Rate of incentive (per extra ton basis) to be paid to the driver and helper of a dd type vehicle for transporting waste over and above the minimum trips, Rs/MT. (DD × 1) matrix.
zz_maxtripdd,d,z Maximum number of trips that a dd type departmental vehicle is allowed to undertake in zone z of dumpsite d. (DD × D × Z) matrix.
zz_mintripdd,d,z Minimum number of trips that a dd type departmental vehicle has to undertake in zone z of dumpsite d. (DD × D × Z) matrix.
• Variables:
atdd,d,z Actual number of trips made by dd type de-partmental vehicle to a zone z of a dumpsite d.
athhgd,z Actual number of trips made by hired vehicles hh in a zone z of a dumpsite d for collection of garbage.
athhsd,z Actual number of trips made by hired vehicles hh in a zone z of a dumpsite d for collection of
silt.cfueldddd Cost of fuel incurred by dd type departmental ve-
hicles for waste transportation, Rs.cfxdidddd Total fixed cost for idle dd type departmental ve-
hicles, Rs.cfxdrdddd Total fixed cost for running dd type departmental
vehicles, Rs.cincdd Amount of incentive (in Rs.) to be paid to a dd-type
vehicle for transporting waste more than the mini-mum stipulated number of trips.
CINCENT Total incentive payable to departmental vehicle drivers and helpers in case they run trips more than their minimum requisite number of trips, Rs.
cird Inorganic reject amount transported from compost-ing plant pre-sorter to the landfill for a particular dumpsite d, MT.
cpdd Compost produced in the composting plant at the dumpsite d, MT.
cprd Composting process reject amount at a dumpsite d, MT.
crd Amount of waste recycled from the composting plant pre-sorter to the recycling facility related to dumpsite d, MT.
CTCC Total cost of composting, in Rs.ctcdddd Waste (garbage only) transportation cost by dd type
departmental vehicles, Rs.ctcghh Total garbage transportation cost by hired vehicles
from borough centers to dumpsites, Rs.ctchh Total cost of transportation of solid waste (garbage
and silt/rubbish) by hired vehicles, Rs.CTCI Total cost of incineration, in Rs.CTCS Total cost for sorting operation at central sorter,
in Rs.ctcshh Total silt transportation cost by hired vehicles from
borough centers to dumpsites, Rs.CTCX Total landfilling cost, in Rs.CTRANSP Total cost of transportation of waste to all the dump-
sites, in Rs.CTREVC Total revenue generated by selling compost, in Rs.CTREVI Total revenue generated by selling electricity gen-
erated from incinerator, in Rs.CTREVR Total revenue generated by selling recyclable mate-
rials from recycling facility, in Rs.dgdd,d,z Amount of garbage transported by dd type de-
partmental vehicle to a dumpsite d from zone z of d, MT.
dghhd,z Amount of garbage transported by hired vehicle hh to dumpsite d from zone z of d, MT.
dshhd,z Amount of silt transported by hired vehicle hh to dumpsite d from zone z of d, MT.
iard Amount of incinerator ash products being trans-ported from the incinerator to the landfill site, MT.
iird Inorganic reject portion separated from the in-cinerator pre-sorter and sent directly to landfill at a dumpsite d, MT.
ipd Total kWh units of electricity generated by in-

Koushik Paul et al.
236
cinerator at d.ird Recyclable portion sorted out from incinerator
pre-sorter and dispatched to the recycling facility, MT.
qgbb,d,dd Quantity of garbage transported from borough bb centre to dumpsite d by dd type departmental ve-hicle, MT.
qhhgbb,d Quantity of garbage transported from a particular borough bb center to a dumpsite d by a hired vehicle hh, MT.
qhhsbb,d Quantity of silt transported from a particular bor-ough center bb to a dumpsite d by a hired vehicle hh, MT.
sadd Additional amount of waste to be transferred di-rectly from the sorting facility (after sorting but without any processing) to the landfill in case of emergency, MT. This value was equated to zero under normal circumstances.
scfd Feed entering the composting plant from sorter at a dumpsite d, MT.
sddd Direct dumpable portion of waste stream (consisting of inert) that is directly taken to landfill bypassing sorter, for a dumpsite d, MT.
sgfd Feed to sorting station associated with dumpsite d, MT.
sifd Feed from sorter to incinerator associated with dumpsite d, MT.
srd Amount of recyclable material segregated from the solid waste feed at the central sorting station asso-ciated with dumpsite d, MT.
xfd Amount of waste being disposed off in the landfill associated with dumpsite d, MT.
xfgd Total amounts of garbage transported to landfill at a dumpsite d, MT.
xfrjd Quantity of rejects from different processing meth-ods like incineration inorganic reject, incineration ash, composting inorganic reject and composting process reject transferred to landfill at d, MT.
xsiltd Total amounts of silt transported to landfill at a dumpsite d, MT.
References
1. Hoornweg D, Bhada-Tata. What a waste: A global review of Solid Waste Management (Urban Development Series Knowledge Papers March 2012 No 15). Washington: World Bank; 2012.
2. Central Pollution Control Board (CPCB). Status report on Municipal Solid Waste Management. New Delhi: CPCB, Govt. of India; 2012.
3. Central Pollution Control Board (CPCB). Consolidated annual review report on implementation of Municipal Solid Waste (Management & Handling) Rules, 2000. New Delhi: CPCB, Govt. of India; 2015.
4. Planning Commission. Report of the task force on waste to energy (Volume I). New Delhi: Govt. of India; 2014.
5. Department of Economic Affairs. Position paper on the solid waste management sector in India. New Delhi: Ministry of Finance, Govt. of India; 2009.
6. Bhide AD, Shekdar AV. Solid waste management in Indian urban centers. Int. Solid Waste Assoc. (ISWA) Times 1998;1:26-28.
7. Shekdar AV. Municipal solid waste management – The Indian perspective. J. Indian Assoc. Environ. Manage. 1999;26:100-108.
8. Imura H, Yedla S, Shinirakawa H, Memon AM. Urban environ-mental issues and trends in Asia – An overview. Int. Rev. Environ. Strat. 2005;5:357-382.
9. Sharholy M, Ahmad K, Mahmood G, Trivedi RC. Municipal solid waste management in Indian cities – A review. Waste Manage. 2008;28:459-467.
10. Annepu RK. Sustainable solid waste management in India [dissertation]. New York: Columbia University Earth Engineering Center; 2012.
11. Tchobanoglous G, Theisen H, Vigil SA. Integrated solid waste management: Engineering principles and management issues. New York: McGraw-Hill; 1993.
12. USEPA website. Overview of greenhouse gases [Internet]. [cited on 15 June 2016]. Available from: https://www3.epa.gov/clima-techange /ghgemissions/gases/ch4.html.
13. El-Fadel M, Angelos NF, Leckie JO. Environmental impacts of solid waste landfilling. J. Environ. Manage. 1997;50:1-25.
14. Talyan V, Dahiya RP, Anand S, Sreekrishnan TR. Quantification of methane emission from municipal solid waste disposal in Delhi. Resour. Conserv. Recy. 2007;50:240-259.
15. UNEP (United Nations Environment Programme). Developing integrated solid waste management plan – Training manual. Volume 4: ISWM plan; Osaka/Shiga, Japan: UNEP; 2009.
16. ISWA. Solid waste: Guidelines for successful planning. Vienna: ISWA; 2012.
17. Central Public Health and Environmental Engineering Organisation (CPHEEO). Manual on municipal solid waste management. New Delhi: Ministry of Urban Development, Govt. of India; 2000.
18. Anderson LE. A mathematical model for the optimization of a waste management system SERPL Rep. No. 68-1. Berkeley, C.A.: Sanitary Engineering Research Laboratory, University of California; 1968.
19. Rawal N, Singh RM, Vaishya RC. Optimal management method-ology for solid wastes in urban areas. J. Hazard. Toxic Radioact. Waste 2012;16:26-38.
20. Rathi S. Optimisation model for integrated municipal solid waste management in Mumbai, India. Environ. Dev. Econ. 2007;12:105-121.
21. CIWMB (California Integrated Waste Management Board). Disposal cost fee study: Final report. Boston, M.A.: Tellus Institute; 1991.
22. Najm AM, El-Fadel M, Ayoub G, El-Taha M, Al-Awar F. An optimisation model for regional integrated solid waste manage-ment I. Model formulation. Waste Manage. Res. 2002;20:37-45.
23. Daskalopoulos E, Badr O, Probert SD. An integrated approach to municipal solid waste management. Resour. Conserv. Recycl. 1998;24:33-50.
24. Najm AM, El-Fadel M. Computer-based interface for an in-tegrated solid waste management optimization model. Environ.

Environmental Engineering Research 24(2) 220-237
237
Modell. Softw. 2004;19:1151-1164.25. Costi P, Minciardi R, Robba M, Rovatti M, Sacile R. An environ-
mentally sustainable decision model for urban solid waste management. Waste Manage. 2004;24:277-295.
26. Fiorucci P, Minciardi R, Robba M, Sacile R. Solid waste manage-ment in urban areas Development and application of a decision support system. Resour. Conserv. Recycl. 2003;37:301-328.
27. Chattopadhyay S, Dutta A, Ray S. Municipal solid waste manage-ment in Kolkata, India – A review. Waste Manage. 2009;29: 1449-1458.
28. Paul K, Dutta A, Krishna AP. A comprehensive study on landfill site selection for Kolkata City, India. J. Air Waste Manage. Assoc. 2014;64:846-861.
29. NEERI (National Environmental Engineering Research Institute). Comprehensive characterization of municipal solid waste at Calcutta, India. Nagpur: NEERI; 2005.
30. Chattopadhyay S, Dutta A, Ray S. Sustainable municipal solid waste management for the city of Kolkata. In: International Conference on Civil Engineering in the New Millenium: Opportunities and Challenges (CENeM-2007); 11-14 January, 2007, Bengal Engineering and Science University, Shibpur, India.
31. Paul K. Development of geographic information system based management information system (MIS) for solid waste manage-ment in Indian cities [dissertation]. Kolkata: Jadavpur University Civil Engineering Department; 2018.
32. Central Public Health and Environmental Engineering Organisation (CPHEEO). Municipal solid waste management manual. New Delhi: Ministry of Urban Development, Govt. of India; 2016.
33. Hazra T, Goel S. Solid waste management in Kolkata, India: Practices and challenges. Waste Manage. 2009;29:470-478.
Related Documents