A Comprehensive Insight into Binding of Hippuric Acid to Human Serum Albumin: A Study to Uncover Its Impaired Elimination through Hemodialysis Nida Zaidi, Mohammad Rehan Ajmal, Gulam Rabbani, Ejaz Ahmad, Rizwan Hasan Khan* Interdisciplinary Biotechnology Unit, Aligarh Muslim University, Aligarh, Uttar Pradesh, India Abstract Binding of hippuric acid (HA), a uremic toxin, with human serum albumin (HSA) has been examined by isothermal titration calorimetry (ITC), differential scanning calorimetry (DSC), molecular docking, circular dichroism (CD) and fluorescence spectroscopy to understand the reason that govern its impaired elimination through hemodialysis. ITC results shows that the HA binds with HSA at high (K b ,10 4 ) and low affinity (K b ,10 3 ) sites whereas spectroscopic results predict binding at a single site (K b ,10 3 ). The HA form complex with HSA that involves electrostatic, hydrogen and hydrophobic binding forces as illustrated by calculated thermodynamic parameters. Molecular docking and displacement studies collectively revealed that HA bound to both site I and site II; however, relatively strongly to the later. Esterase-like activity of HSA confirms the involvement of Arg410 and Tyr411 of Sudlow site II in binding of HA. CD results show slight conformational changes occurs in the protein upon ligation that may be responsible for the discrepancy in van’t Hoff and calorimetric enthalpy change. Furthermore, an increase in T 1 m and T 2 m is observed from DSC results that indicate increase in stability of HSA upon binding to HA. The combined results provide that HA binds to HSA and thus its elimination is hindered. Citation: Zaidi N, Ajmal MR, Rabbani G, Ahmad E, Khan RH (2013) A Comprehensive Insight into Binding of Hippuric Acid to Human Serum Albumin: A Study to Uncover Its Impaired Elimination through Hemodialysis. PLoS ONE 8(8): e71422. doi:10.1371/journal.pone.0071422 Editor: Rajagopal Subramanyam, University of Hyderabad, India Received March 30, 2013; Accepted July 1, 2013; Published August 9, 2013 Copyright: ß 2013 Zaidi et al. This is an open-access article distributed under the terms of the Creative Commons Attribution License, which permits unrestricted use, distribution, and reproduction in any medium, provided the original author and source are credited. Funding: Financial assistance to NZ in the form of a Senior Research Fellowship was supported by the Council of Scientific and Industrial Research (CSIR), New Delhi, India. The funders had no role in study design, data collection and analysis, decision to publish, or preparation of the manuscript. Competing Interests: RK is a PLOS ONE Editorial Board member. This does not alter the authors’ adherence to all the PLOS ONE policies on sharing data and materials. * E-mail: [email protected] Introduction Uremic toxins are the compounds which retained in the blood during kidney failure and interact negatively with the normal biological functions of the body [1]. Hippuric acid (HA) is one of these compounds that accumulates in the blood, and cause stimulation of ammoniagenesis. It is involved in development of muscular weakness in uremia as it also inhibits glucose utilization in muscles [2–4]. It has also been related to inhibition of organic anion secretion by the kidney [5] and transport at the blood-brain barrier [6]. Consequently, HA is a compound of pharmacological interest. It is a glycine conjugate of benzoate, which is formed primarily from aromatic amino acids by gastrointestinal flora or may be directly taken as preservatives from food and beverages [7]. In a healthy individual, concentration of HA is less than 5 mg/L but increases to values higher than 2476112 mg/L in patients with end-stage renal disease [8]. Human serum albumin (HSA) is the most abundant plasma protein, single chain, nonglycosylated polypeptide of 66.5 kDa. It is composed of three homologous, predominantly helical domains I–III, each of which contains two subdomains A and B [9]. HSA has one tryptophan residue, Trp214, located in subdomain IIA [10,11]. The principal regions of ligand binding to HSA are located in hydrophobic cavities in subdomains IIA and IIIA, which are consistent with Sudlow sites I and II, respectively [12]. These binding sites underline the exceptional ability of HSA to interact with many organic and inorganic molecules, thereby making this protein an important regulator of the pharmacokinetic behavior of many drugs as well as intercellular fluxes [13]. In body, it also binds to HA [2] and thus elimination of HA through hemodialysis is only 64% [14,15]. However, there is paucity of information on its binding mechanism to HSA. Consequently, it is necessary to investigate the binding energetic, amino acid involved in binding of HA to HSA to explore its binding mechanism in the body. So, the scope of this work is to evaluate these in details by studying the binding energetic using steady state fluorescence spectroscopy and isothermal titration calorimetry. Binding sites is determined by displacement studies whereas estimation of amino acid involved in binding, by molecular docking and esterase-like activity of HSA toward p-NPA. Thermal stability in presence of HA is determined using differential scanning calorimetry. Materials and Methods Materials and Sample Preparation Human serum albumin (A1887; .96%), warfarin (A2250; .98%), phenylbutazone (P8386; .99%), and p-nitrophenyl acetate (N8137; .99%) were procured from Sigma Aldrich. Hippuric acid (free acid, crystalline; .99%) was from Himedia. The number in the parenthesis corresponds to the purity of the compounds. All other reagents were of analytical grade. HSA and drug solutions were prepared in 20 mM sodium phosphate buffer (pH 7.4). HSA was passed through Sephacryl-S200 gel filtration column, dialyzed, and its concentration was estimated spectro- PLOS ONE | www.plosone.org 1 August 2013 | Volume 8 | Issue 8 | e71422

Welcome message from author
This document is posted to help you gain knowledge. Please leave a comment to let me know what you think about it! Share it to your friends and learn new things together.
Transcript
A Comprehensive Insight into Binding of Hippuric Acidto Human Serum Albumin: A Study to Uncover ItsImpaired Elimination through HemodialysisNida Zaidi, Mohammad Rehan Ajmal, Gulam Rabbani, Ejaz Ahmad, Rizwan Hasan Khan*
Interdisciplinary Biotechnology Unit, Aligarh Muslim University, Aligarh, Uttar Pradesh, India
Abstract
Binding of hippuric acid (HA), a uremic toxin, with human serum albumin (HSA) has been examined by isothermal titrationcalorimetry (ITC), differential scanning calorimetry (DSC), molecular docking, circular dichroism (CD) and fluorescencespectroscopy to understand the reason that govern its impaired elimination through hemodialysis. ITC results shows thatthe HA binds with HSA at high (Kb ,104) and low affinity (Kb ,103) sites whereas spectroscopic results predict binding at asingle site (Kb,103). The HA form complex with HSA that involves electrostatic, hydrogen and hydrophobic binding forcesas illustrated by calculated thermodynamic parameters. Molecular docking and displacement studies collectively revealedthat HA bound to both site I and site II; however, relatively strongly to the later. Esterase-like activity of HSA confirms theinvolvement of Arg410 and Tyr411 of Sudlow site II in binding of HA. CD results show slight conformational changes occursin the protein upon ligation that may be responsible for the discrepancy in van’t Hoff and calorimetric enthalpy change.Furthermore, an increase in T1
mand T2mis observed from DSC results that indicate increase in stability of HSA upon binding to
HA. The combined results provide that HA binds to HSA and thus its elimination is hindered.
Citation: Zaidi N, Ajmal MR, Rabbani G, Ahmad E, Khan RH (2013) A Comprehensive Insight into Binding of Hippuric Acid to Human Serum Albumin: A Study toUncover Its Impaired Elimination through Hemodialysis. PLoS ONE 8(8): e71422. doi:10.1371/journal.pone.0071422
Editor: Rajagopal Subramanyam, University of Hyderabad, India
Received March 30, 2013; Accepted July 1, 2013; Published August 9, 2013
Copyright: � 2013 Zaidi et al. This is an open-access article distributed under the terms of the Creative Commons Attribution License, which permitsunrestricted use, distribution, and reproduction in any medium, provided the original author and source are credited.
Funding: Financial assistance to NZ in the form of a Senior Research Fellowship was supported by the Council of Scientific and Industrial Research (CSIR), NewDelhi, India. The funders had no role in study design, data collection and analysis, decision to publish, or preparation of the manuscript.
Competing Interests: RK is a PLOS ONE Editorial Board member. This does not alter the authors’ adherence to all the PLOS ONE policies on sharing data andmaterials.
* E-mail: [email protected]
Introduction
Uremic toxins are the compounds which retained in the blood
during kidney failure and interact negatively with the normal
biological functions of the body [1]. Hippuric acid (HA) is one of
these compounds that accumulates in the blood, and cause
stimulation of ammoniagenesis. It is involved in development of
muscular weakness in uremia as it also inhibits glucose utilization
in muscles [2–4]. It has also been related to inhibition of organic
anion secretion by the kidney [5] and transport at the blood-brain
barrier [6]. Consequently, HA is a compound of pharmacological
interest. It is a glycine conjugate of benzoate, which is formed
primarily from aromatic amino acids by gastrointestinal flora or
may be directly taken as preservatives from food and beverages
[7]. In a healthy individual, concentration of HA is less than
5 mg/L but increases to values higher than 2476112 mg/L in
patients with end-stage renal disease [8].
Human serum albumin (HSA) is the most abundant plasma
protein, single chain, nonglycosylated polypeptide of 66.5 kDa. It
is composed of three homologous, predominantly helical domains
I–III, each of which contains two subdomains A and B [9]. HSA
has one tryptophan residue, Trp214, located in subdomain IIA
[10,11]. The principal regions of ligand binding to HSA are
located in hydrophobic cavities in subdomains IIA and IIIA,
which are consistent with Sudlow sites I and II, respectively [12].
These binding sites underline the exceptional ability of HSA to
interact with many organic and inorganic molecules, thereby
making this protein an important regulator of the pharmacokinetic
behavior of many drugs as well as intercellular fluxes [13]. In
body, it also binds to HA [2] and thus elimination of HA through
hemodialysis is only 64% [14,15]. However, there is paucity of
information on its binding mechanism to HSA. Consequently, it is
necessary to investigate the binding energetic, amino acid involved
in binding of HA to HSA to explore its binding mechanism in the
body. So, the scope of this work is to evaluate these in details by
studying the binding energetic using steady state fluorescence
spectroscopy and isothermal titration calorimetry. Binding sites is
determined by displacement studies whereas estimation of amino
acid involved in binding, by molecular docking and esterase-like
activity of HSA toward p-NPA. Thermal stability in presence of
HA is determined using differential scanning calorimetry.
Materials and Methods
Materials and Sample PreparationHuman serum albumin (A1887; .96%), warfarin (A2250;
.98%), phenylbutazone (P8386; .99%), and p-nitrophenyl
acetate (N8137; .99%) were procured from Sigma Aldrich.
Hippuric acid (free acid, crystalline; .99%) was from Himedia.
The number in the parenthesis corresponds to the purity of the
compounds. All other reagents were of analytical grade. HSA and
drug solutions were prepared in 20 mM sodium phosphate buffer
(pH 7.4). HSA was passed through Sephacryl-S200 gel filtration
column, dialyzed, and its concentration was estimated spectro-
PLOS ONE | www.plosone.org 1 August 2013 | Volume 8 | Issue 8 | e71422
photometrically using E1%280nm = 5.3. All drug solutions were
prepared by weight/volume (w/v).
Steady State Fluorescence Quenching MeasurementsFluorescence emission spectra were recorded in range of 300–
400 nm on a Shimadzu 5301PC fluorescence spectrophotometer
equipped with water circulator (Julabo Eyela) at excitation
wavelength of 295 nm. Both the excitation and emission slits
were set at 3 nm. The titration of the HA (0–10 mM) to HSA
(5 mM) solution was carried out at 25, 30, and 37uC. Respective
blanks were subtracted. The fluorescence data were analyzed
according to the Stern–Volmer equation to obtain Stern–Volmer
quenching (Ksv) and bimolecular rate constant (kq) [16]:
F0
F~Ksv½Q�z1~kqt0z1 ð1Þ
where, Fo and F are the fluorescence intensities in the absence and
presence of quencher (HA), and to, is the average integral
fluorescence life time of tryptophan (, 5.7161029 s) [17].
Furthermore if a quencher, Q, form complex, QnB, with protein
B and have ‘n’ multiple (equivalent and independent) binding sites
then quenching reaction is often represented as:
nQzB?QnB ð2Þ
and its binding constant (Kb ) is given by equation 3:[18]
Kb~½QnB�½Qn�½B� ð3Þ
If the total amount of protein (with and without bound Q) is [Bo],
then
½B0�~½QnB�z½B�, ð4Þ
Kb~½B0�{½B�½Qn�½B� ð5Þ
where [B] is the concentration of the unbound protein. The
fluorescence intensity is proportional to the protein concentration
as described below:
½B�½B0�
!½F �½F 0�
ð6Þ
then, relationship between the fluorescence intensity and unbound
protein is expressed as:
logFo
F{1
� �~ log Kbzn log½Q� ð7Þ
So, if the formation of a nonfluorescent fluorophore–quencher
complex occurs, then, the value of Kb can be obtained by using
equation 7.
Furthermore, change in standard Gibbs free energy (DGu) was
obtained using Gibbs-Helmholtz equation:
DG0~{RT lnKb ð8Þ
whereas, change in standard enthalpy (DHo) and entropy (DSo)
were determined from the van’t Hoff equation, if DHo do not vary
significantly over the temperature range studied.
lnKb~{DH0
RTz
DS0
Rð9Þ
where R (1.987 cal mol21K21) is gas constant and T is the
absolute temperature (K)
Binding Displacement Measurement Using Site MarkersDifferent site markers warfarin (WAR) for site I and diazepam
(DIA) for site II [19,20] were used for performing displacement
experiments. The titration of HA were carried out to the solution
having protein and site marker in the ratio of 1:1. The
fluorescence emission spectra were recorded as mentioned in
fluorescence measurements and the binding constant values of
drug–protein–marker were evaluated using Stern–Volmer equa-
tion.
Isothermal Titration Calorimetric Measurements (ITC)The VP-ITC titration microcalorimeter (MicroCal Inc., North-
ampton, MA) were used to gain insight into the energetics of the
binding of HA to HSA at 25, 30, and 37uC. Prior to the titration
experiment, all solutions were degassed properly on a thermovac.
The 1.44 mL sample and reference cell of the calorimeter were
loaded with HSA and 20 mM sodium phosphate buffer (pH 7.4),
respectively. The HSA (25 mM) was titrated with HA (1.928 mM)
using a 288 mL injection syringe stirring at 307 rpm. Equal
volumes of HA solutions (10 mL) were injected into the sample cell
containing HSA over 20 s with an interval of 180 s between
injections. The reference power was set at 16 mcal s21. The heat
associated with each injection was observed as a peak that
corresponds to the power required to keep the sample and
reference cells at identical temperatures and the data were plotted
as integrated quantities. Control experiments were performed by
titrating HA into the same buffer to obtain the heats of ligand
dilution. Heats of dilution for the ligand and protein were
subtracted from the integrated data before curve fitting. The data
were fitted and analyzed with a sequential model of two binding
sites using Origin 7.0 provided with the MicroCal instrument.
Association constant (Kb) and standard enthalpy change (DHu)were directly obtained after fitting while DGu was calculated from
equation 8. The DSo was calculated using the equation:
DG0~DH0{TDS0 ð10Þ
and change in specific heat capacity can be calculated from the
equation:
DCexpP ~
dDH0
dT: ð11Þ
Further the standard van’t Hoff enthalpy DH0vH at each
temperature was calculated using equation:
Biophysical Study of Hippuric Acid Binding to HSA
PLOS ONE | www.plosone.org 2 August 2013 | Volume 8 | Issue 8 | e71422
DH0vH~
lnK(T2)
K(T1){
DCPR
lnT2T1
zDCPT1
R1
T1{ 1
T2
� �n o|R
1T1
{ 1T2
� �24
35: ð12Þ
here, K(T1) and K(T2) are the values of binding constant at
temperatures T1 and T2 respectively.
Circular Dichroism Spectroscopic MeasurementsTo monitor the secondary and tertiary structural change of
protein upon interaction with HA, CD spectra of HSA were
collected in far (2002250 nm) and near-UV (250–320 nm) at
molar ratio of 1:0, 1:5, 1:10 and 1:15 in a JASCO-J815
spectropolarimeter equipped with a Peltier-type temperature
controller at 25uC. The CD spectra were collected with 20 nm/
min scan speed and a response time of 2 s. The HSA
concentration and pathlength were 5 mM and 0.1 cm, respective-
ly, for far UV CD measurement whereas 15 mM and 1 cm,
respectively, for near UV CD measurement. Respective blanks
were subtracted. The results were expressed as MRE (mean
residue ellipticity) in deg cm2 dmol21, which is given by:
MRE~Hobs(mdeg)
10|n|C|lð13Þ
where Hobs is the observed ellipticity in millidegrees, C is the
concentration of protein in mol/l, l is the length of the light path in
centimeters and n is the number of peptide bonds.
Differential Scanning Calorimetric Measurements (DSC)The differential scanning calorimetric measurements were
carried out using VP-DSC microcalorimeter (MicroCal, North-
ampton, MA). The buffer and protein solutions were degassed
under mild vacuum prior to the experiment. Samples were
prepared in 20 mM sodium phosphate buffer, pH 7.4. The DSC
measurements of HSA (18 mM) in the presence of different ratios
of HA viz. 1:0, 1:5, and 1:10 were performed from 25 to 90uC at a
scan rate of 0.5uC/min. Data were analyzed using Origin software
provided with the instrument to obtain the temperature at the
midpoint of the unfolding transition (Tm) and calorimetric
enthalpy (DHu).
Effect of HA Binding on Esterase-Like Activity of HSADrug site II (Subdomain III A) of HSA possessed esterase-like
activity toward p-nitrophenyl acetate (p-NPA) [21]. Thus, the
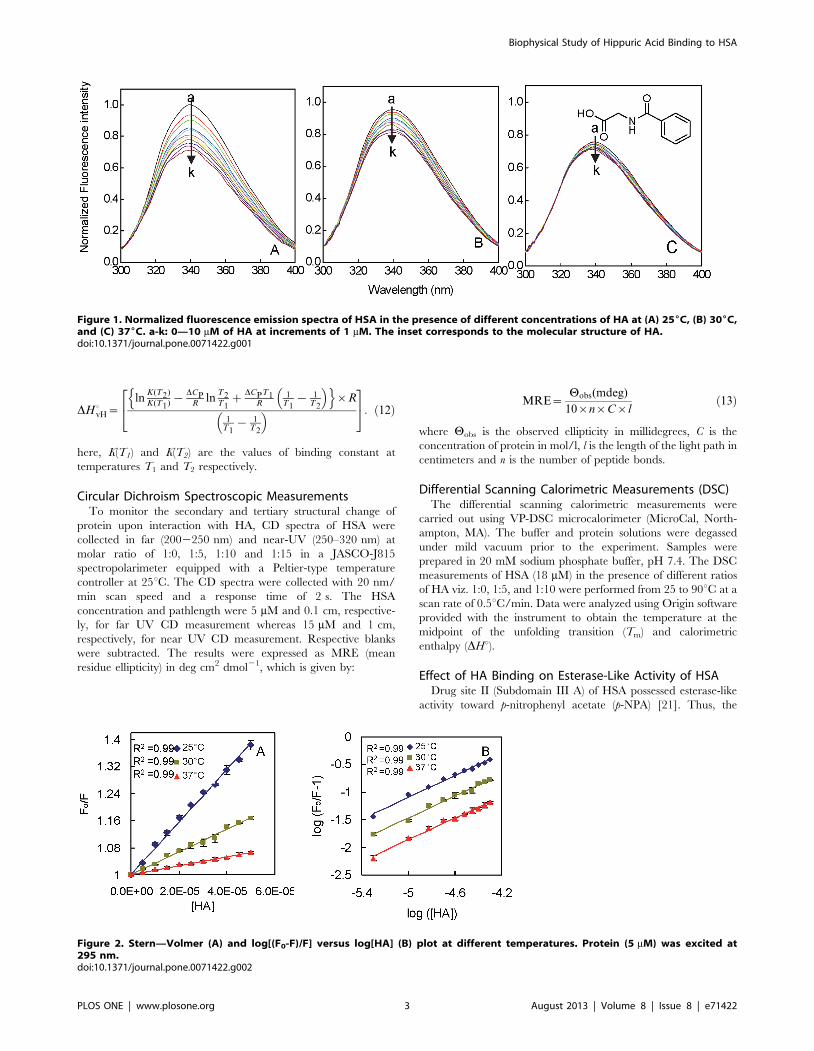
Figure 1. Normalized fluorescence emission spectra of HSA in the presence of different concentrations of HA at (A) 256C, (B) 306C,and (C) 376C. a-k: 0—10 mM of HA at increments of 1 mM. The inset corresponds to the molecular structure of HA.doi:10.1371/journal.pone.0071422.g001
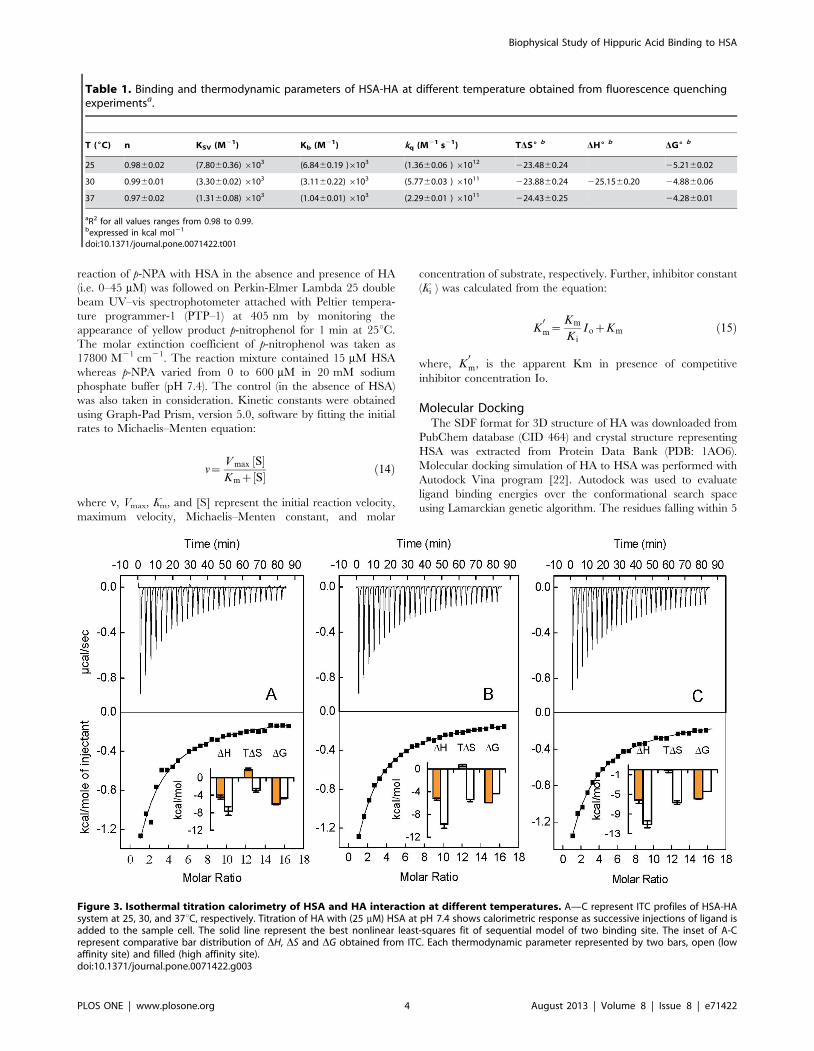
Figure 2. Stern—Volmer (A) and log[(F0-F)/F] versus log[HA] (B) plot at different temperatures. Protein (5 mM) was excited at295 nm.doi:10.1371/journal.pone.0071422.g002
Biophysical Study of Hippuric Acid Binding to HSA
PLOS ONE | www.plosone.org 3 August 2013 | Volume 8 | Issue 8 | e71422
reaction of p-NPA with HSA in the absence and presence of HA
(i.e. 0–45 mM) was followed on Perkin-Elmer Lambda 25 double
beam UV–vis spectrophotometer attached with Peltier tempera-
ture programmer-1 (PTP–1) at 405 nm by monitoring the
appearance of yellow product p-nitrophenol for 1 min at 25uC.
The molar extinction coefficient of p-nitrophenol was taken as
17800 M21 cm21. The reaction mixture contained 15 mM HSA
whereas p-NPA varied from 0 to 600 mM in 20 mM sodium
phosphate buffer (pH 7.4). The control (in the absence of HSA)
was also taken in consideration. Kinetic constants were obtained
using Graph-Pad Prism, version 5.0, software by fitting the initial
rates to Michaelis–Menten equation:
v~Vmax ½S�Kmz½S� ð14Þ
where n, Vmax, Km, and [S] represent the initial reaction velocity,
maximum velocity, Michaelis–Menten constant, and molar
concentration of substrate, respectively. Further, inhibitor constant
(Ki ) was calculated from the equation:
K0m~
Km
K i
IozKm ð15Þ
where, K0m, is the apparent Km in presence of competitive
inhibitor concentration Io.
Molecular DockingThe SDF format for 3D structure of HA was downloaded from
PubChem database (CID 464) and crystal structure representing
HSA was extracted from Protein Data Bank (PDB: 1AO6).
Molecular docking simulation of HA to HSA was performed with
Autodock Vina program [22]. Autodock was used to evaluate
ligand binding energies over the conformational search space
using Lamarckian genetic algorithm. The residues falling within 5
Table 1. Binding and thermodynamic parameters of HSA-HA at different temperature obtained from fluorescence quenchingexperimentsa.
T (6C) n KSV (M21) Kb (M21) kq (M21 s21) TDS6b DH6
b DG6b
25 0.9860.02 (7.8060.36) 6103 (6.8460.19 )6103 (1.3660.06 ) 61012 223.4860.24 25.2160.02
30 0.9960.01 (3.3060.02) 6103 (3.1160.22) 6103 (5.7760.03 ) 61011 223.8860.24 225.1560.20 24.8860.06
37 0.9760.02 (1.3160.08) 6103 (1.0460.01) 6103 (2.2960.01 ) 61011 224.4360.25 24.2860.01
aR2 for all values ranges from 0.98 to 0.99.bexpressed in kcal mol21
doi:10.1371/journal.pone.0071422.t001
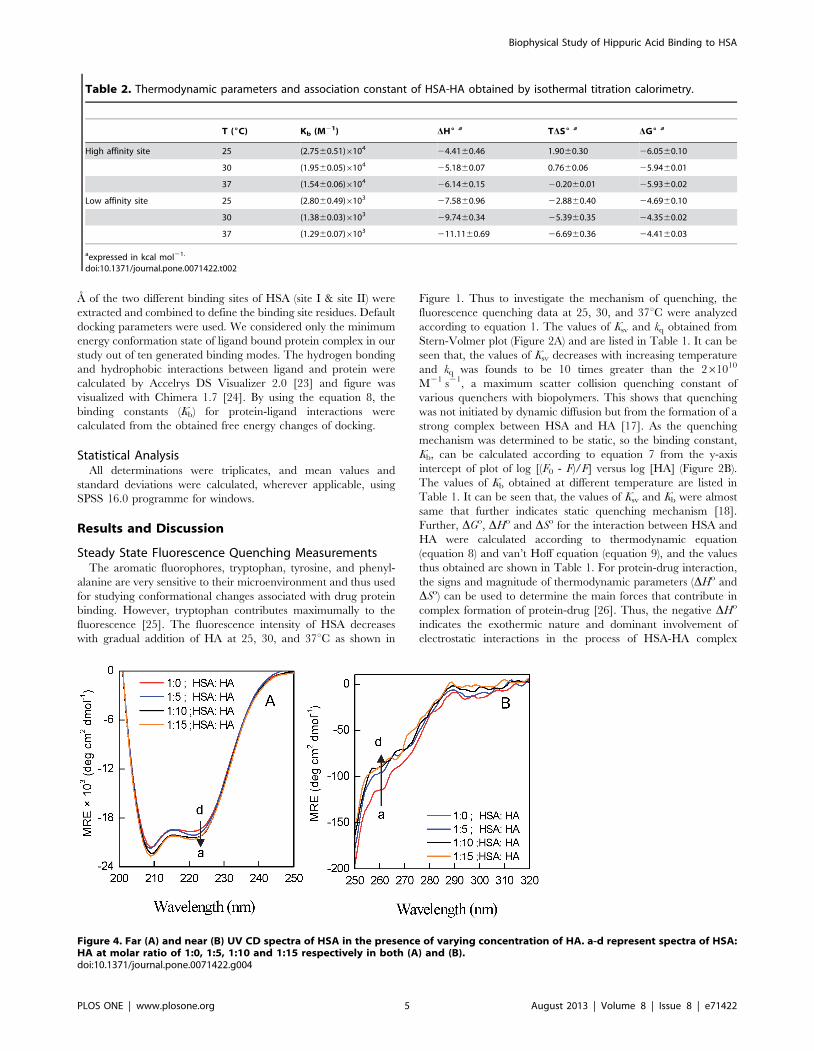
Figure 3. Isothermal titration calorimetry of HSA and HA interaction at different temperatures. A—C represent ITC profiles of HSA-HAsystem at 25, 30, and 37uC, respectively. Titration of HA with (25 mM) HSA at pH 7.4 shows calorimetric response as successive injections of ligand isadded to the sample cell. The solid line represent the best nonlinear least-squares fit of sequential model of two binding site. The inset of A-Crepresent comparative bar distribution of DH, DS and DG obtained from ITC. Each thermodynamic parameter represented by two bars, open (lowaffinity site) and filled (high affinity site).doi:10.1371/journal.pone.0071422.g003
Biophysical Study of Hippuric Acid Binding to HSA
PLOS ONE | www.plosone.org 4 August 2013 | Volume 8 | Issue 8 | e71422
A of the two different binding sites of HSA (site I & site II) were
extracted and combined to define the binding site residues. Default
docking parameters were used. We considered only the minimum
energy conformation state of ligand bound protein complex in our
study out of ten generated binding modes. The hydrogen bonding
and hydrophobic interactions between ligand and protein were
calculated by Accelrys DS Visualizer 2.0 [23] and figure was
visualized with Chimera 1.7 [24]. By using the equation 8, the
binding constants (Kb) for protein-ligand interactions were
calculated from the obtained free energy changes of docking.
Statistical AnalysisAll determinations were triplicates, and mean values and
standard deviations were calculated, wherever applicable, using
SPSS 16.0 programme for windows.
Results and Discussion
Steady State Fluorescence Quenching MeasurementsThe aromatic fluorophores, tryptophan, tyrosine, and phenyl-
alanine are very sensitive to their microenvironment and thus used
for studying conformational changes associated with drug protein
binding. However, tryptophan contributes maximumally to the
fluorescence [25]. The fluorescence intensity of HSA decreases
with gradual addition of HA at 25, 30, and 37uC as shown in
Figure 1. Thus to investigate the mechanism of quenching, the
fluorescence quenching data at 25, 30, and 37uC were analyzed
according to equation 1. The values of Ksv and kq obtained from
Stern-Volmer plot (Figure 2A) and are listed in Table 1. It can be
seen that, the values of Ksv decreases with increasing temperature
and kq was founds to be 10 times greater than the 261010
M21 s21, a maximum scatter collision quenching constant of
various quenchers with biopolymers. This shows that quenching
was not initiated by dynamic diffusion but from the formation of a
strong complex between HSA and HA [17]. As the quenching
mechanism was determined to be static, so the binding constant,
Kb, can be calculated according to equation 7 from the y-axis
intercept of plot of log [(F0 - F)/F] versus log [HA] (Figure 2B).
The values of Kb obtained at different temperature are listed in
Table 1. It can be seen that, the values of Ksv and Kb were almost
same that further indicates static quenching mechanism [18].
Further, DGo, DHo and DSo for the interaction between HSA and
HA were calculated according to thermodynamic equation
(equation 8) and van’t Hoff equation (equation 9), and the values
thus obtained are shown in Table 1. For protein-drug interaction,
the signs and magnitude of thermodynamic parameters (DHo and
DSo) can be used to determine the main forces that contribute in
complex formation of protein-drug [26]. Thus, the negative DHo
indicates the exothermic nature and dominant involvement of
electrostatic interactions in the process of HSA-HA complex
Table 2. Thermodynamic parameters and association constant of HSA-HA obtained by isothermal titration calorimetry.
T (6C) Kb (M21) DH6a TDS6
a DG6a
High affinity site 25 (2.7560.51)6104 24.4160.46 1.9060.30 26.0560.10
30 (1.9560.05)6104 25.1860.07 0.7660.06 25.9460.01
37 (1.5460.06)6104 26.1460.15 20.2060.01 25.9360.02
Low affinity site 25 (2.8060.49)6103 27.5860.96 22.8860.40 24.6960.10
30 (1.3860.03)6103 29.7460.34 25.3960.35 24.3560.02
37 (1.2960.07)6103 211.1160.69 26.6960.36 24.4160.03
aexpressed in kcal mol21.
doi:10.1371/journal.pone.0071422.t002
Figure 4. Far (A) and near (B) UV CD spectra of HSA in the presence of varying concentration of HA. a-d represent spectra of HSA:HA at molar ratio of 1:0, 1:5, 1:10 and 1:15 respectively in both (A) and (B).doi:10.1371/journal.pone.0071422.g004
Biophysical Study of Hippuric Acid Binding to HSA
PLOS ONE | www.plosone.org 5 August 2013 | Volume 8 | Issue 8 | e71422
formation [27]. However, hydrogen bonding also play role as
depicted from the negative signs of DHo and DSo according to
Ross and Subramanian [26]. Furthermore, DHo contributes
maximally rather than DSo to DGo that indicates the binding
process is enthalpy driven and the decrease in entropy is due to the
formation of hydrogen bonds between HA and HSA. In addition,
negative sign of DGo indicates that the binding of HA with HSA is
a spontaneous process. However, the obtained value of thermo-
dynamic parameters may not necessarily the actual values as, such
non–calorimetric approach to the thermodynamics has ruthless
shortcomings where usually DHu is assumed to be temperature–
independent. However, this is the only method to determine an
estimate of DHo and DSo from the fluorescence quenching data at
different temperature [28]. Furthermore, the binding affinity
observed by fluorescence spectroscopy took in consideration the
location of quencher, fluorophore and so measures local changes
around the fluorophores associated with the optical transition [29].
Hence to overcome all these shortcomings, we have done ITC
measurements that consider overall global changes [30].
Binding Displacement Measurement using Site MarkersSudlow et al [12] proposed that the HSA has two major binding
regions namely Sudlow’s site I and site II. Site I and II have
affinity for WAR and DIA respectively. Thus these drugs were
used as site specific markers of HSA. To trace the binding site of
HA on HSA, the emitted fluorescence intensity data in the absence
and presence of markers were calculated using Stern–Volmer
equation. The Ksv value of HSA-HA was (7.8060.36)6103 M21
that decreases to (2.7460.04)6103 M21 and (2.0360.03)6103 M21 in presence of WAR and DIA, respectively. These
differences in Ksv values in absence and presence of site markers
are significant enough to deduce the binding sites location as
reported in literature [31,32]. As evident from above values, the
Ksv of HSA-HA decreased markedly in presence of WAR and DIA
both, however, relatively more in later. It indicates competition
between markers and HA for both site I and site II, however,
relatively more for later. Thus, HA binds relatively more to site II
as compared to site I.
Isothermal Titration Calorimetric MeasurementsITC was used to measure binding affinity and energetics of HA
to HSA. Figure 3 shows the ITC binding isotherm of HA to HSA
at 25, 30, and 37uC in which each peak in top panel represents a
single injection of the drug into protein solution. Bottom panel of
this figure shows an integrated plot of the amount of heat liberated
per injection as a function of the molar ratio of the drug to protein.
The best fits for the integrated heats was obtained using a two sites
sequential binding model with the lowest x2. The temperature
dependency of the thermodynamic binding parameters of HA to
HSA obtained after fitting is summarized in Table 2. These results
showed that the binding affinity is in the order of 104 and 103 for
high and low affinity binding site respectively which decrease with
increase in temperature indicating the formation of complex. The
enthalpic and entropic contributions to the Gibbs free energy of
binding were used to infer information regarding the mechanism
of binding. It can be seen from Figure 3 (insets), that all studied
temperature, the enthalpic changes for the binding of HA to both
classes of binding site of HSA are all negative, which indicate that
the binding process are all exothermic and involves electrostatic
interactions [27]. On contrary, the entropic contributions were
favourable for higher affinity binding site while unfavourable for
low affinity binding site. It suggests the involvement of hydrogen
bonding in binding of HA to low affinity site on HSA [26].
Whereas, negative value of DGo suggest that the formation of
complex was spontaneous in nature for both set of binding sites at
all three temperatures. Further, the slope of plot of DHo against
Figure 5. Excess heat capacity curves obtained by differential scanning calorimetry for HSA:HA in the molar ratio of (A) 1:0, (B) 1:5,and (C) 1:10.doi:10.1371/journal.pone.0071422.g005
Table 3. Thermodynamic parameters obtained by differential scanning calorimetry.
HSA:HA T1m(6C) T2
m(6C) T3m (6C) DH0
1a DH0
2a DH0
3a
1:0 56.9160.09 61.3760.07 73.6560.06 52.2160.69 55.3760.71 13.9660.08
1:5 57.2560.01 62.5160.09 73.8760.04 54.4160.10 56.1360.12 13.9260.07
1:10 58.3660.08 63.8360.02 73.9660.03 68.4760.80 57.3760.60 13.9060.09
aexpressed in kcal mol21.
doi:10.1371/journal.pone.0071422.t003
Biophysical Study of Hippuric Acid Binding to HSA
PLOS ONE | www.plosone.org 6 August 2013 | Volume 8 | Issue 8 | e71422
TDSo with was found to be approximately equal to unity which
indicates the enthalpy-entropy compensation effect, a common
phenomenon in protein ligand interaction [33]. Besides, it was also
observed that DHo varies almost linearly with examined range of
temperature and so the change in heat capacity (DCP) was
determined according to equation 11. The values of DCP obtained
were 20.1460.11 and 20.2860.24 kcal mol21uC21 for high and
low affinity site respectively. As can be seen from Table 1 and 2,
value of binding affinity obtained by ITC differ from fluorescence
spectroscopy that may be due to the consideration of the location
of quencher and fluorophore in the later [29,30,34]. Not only
binding affinity, but the values of DHo and TDSo also differ
whereas the values of DGo obtained from both methods are
comparable. It is due to the already discussed shortcoming of non–
calorimetric approach to the thermodynamics that in this
approach usually DHu is assumed to be temperature–independent
as can be seen in literature [27,31,32,35]. Moreover, it cannot be
neglected that the evaluation of the thermodynamic parameters
obtained from the spectroscopic measurements also based upon
the temperature dependence of the binding affinity that may be
influence by the location of quencher from the Trp214 as
discussed [30]. This leads to miscalculation of temperature–
dependent DHu and DSu. However, in literature non–calorimetric
determination of thermodynamic parameters from fluorescence
quenching data at different temperature has been exploited to get
an estimate [25,31,32,35]. Besides, temperature dependency of
binding affinity obtained from ITC, is used to calculate the van’t
Hoff enthalpy values, which do not agree well with the
calorimetric enthalpies at all studied temperatures. For example,
the value of van’t Hoff enthalpy obtained at 25uC obtained by
using equation 12 was 211.98 and 224.69 kcal mol21 at high and
low affinity site respectively which differ from calorimetric
enthalpies. Such difference is also reported in literature [34] and
may indicate that the conformational changes are associated with
the binding process which may be induced either by ligand
binding or by an increase in temperature. Hence to have better
understanding of conformational changes on ligand binding, we
have done circular dichroism measurements.
Circular Dichroism MeasurementsThe changes in secondary and tertiary structure of the HSA in
presence of HA were studied in far-UV CD and near UV CD
region at different molar ratio of protein to HA. Figure 4 A & B
shows the far-UV CD and near UV CD spectrum of HSA in
presence of [HSA]/[HA] ratio of 1:0, 1:5, 1:10 and 1:15. In the
presence of HA, slight increase occur in the secondary structure of
HSA as evident from the increase in two minima at 208 and
222 nm that are characterstic of a-helix [17]. However, the shape
of peaks and the position of peak maximum remained almost
unchanged in the presence of HA, indicating that HSA has
predominantly a-helix in nature even after binding to the HA.
Further as shown in Figure 4 B, near-UV CD spectra for the HSA
showed two minima at 262 and 268 nm and shoulders at 279 and
290 nm, characteristics of disulphide and aromatic chromophores,
which is in accordance with literature [36]. But, change in HSA
spectra in presence of HA was observed that indicates the
alteration of tertiary structure at different molar ratio of protein to
HA. This confirms that conformational changes occur in the
protein upon ligation and thus difference is observed in the values
of van’t Hoff and calorimetric enthalpies obtained from ITC.
Thermostability Measurement by Differential ScanningCalorimetry
Figure 5 A–C shows the typical excess heat capacity curves for
HSA:HA in the molar ratio of 1:0, 1:5, and 1:10 and
thermodynamic parameters obtained accompanying thermody-
namic denaturation of HSA under these conditions are reported in
Table 3. It is observed that the thermal unfolding of HSA is
irreversible process in absence and presence of HA by reheating
the samples after cooling just after the first run. Hence to minimize
the kinetic factors, slower scanning rate have been chosen. The
changes in the Tm and DHu of the protein in presence of ligand are
the most obvious manifestation of ligand binding effects that can
be estimated by DSC [37]. Thus, to confirm binding of HA to
HSA, changes in the Tm and DHu have been monitored by DSC.
The denaturation of HSA yielded more than one endothermic
peak that reflects the domain denaturation mechanism [38]. Thus,
it was deconvoluted with the assumption of three sub-transitions
and each of which might be related to the links between the three
structural domains of HSA. Further, it is also established that
domain III melts prior to domain II, so T1mmay corresponds to
domain III [12,39]. Table 3 shows T1m, T2
m and T3mand respective
DHu of native HSA that are in accordance with the literature [40].
Upon increasing molar ratio to 1:10, the T1m increases appreciably,
T2m changes slightly whereas, T3
m donot change at all. Besides, the
increases in T1m and T2
m are accompanied with an increase in the
value of enthalpy of unfolding, however, slightly in latter. This
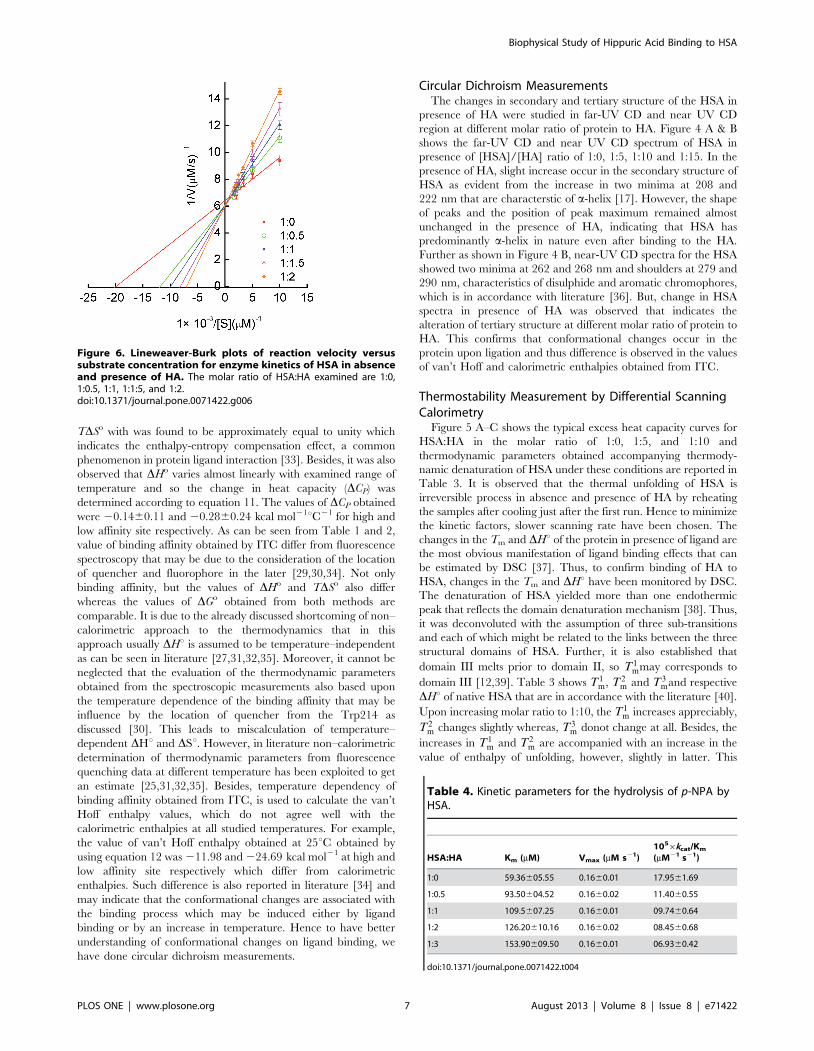
Figure 6. Lineweaver-Burk plots of reaction velocity versussubstrate concentration for enzyme kinetics of HSA in absenceand presence of HA. The molar ratio of HSA:HA examined are 1:0,1:0.5, 1:1, 1:1:5, and 1:2.doi:10.1371/journal.pone.0071422.g006
Table 4. Kinetic parameters for the hydrolysis of p-NPA byHSA.
HSA:HA Km (mM) Vmax (mM s21)1056kcat/Km
(mM21 s21)
1:0 59.36605.55 0.1660.01 17.9561.69
1:0.5 93.50604.52 0.1660.02 11.4060.55
1:1 109.5607.25 0.1660.01 09.7460.64
1:2 126.20610.16 0.1660.02 08.4560.68
1:3 153.90609.50 0.1660.01 06.9360.42
doi:10.1371/journal.pone.0071422.t004
Biophysical Study of Hippuric Acid Binding to HSA
PLOS ONE | www.plosone.org 7 August 2013 | Volume 8 | Issue 8 | e71422
indicates that, binding of HA to domain III is stronger as compare
to domain II whereas, negligible to domain I as higher energy is
required to change from the liganded native state into the free
unfolded state in case of domain III followed by domain II. Thus,
HA preferential binds to the folded or native form of the HSA
which causes stabilization of the folded state and hence unfolding
of HSA become progressively less favorable as HA concentration
increases [41,42].
Measurement of Esterase-Like Activity of HSA in Presenceof HA
The Arg410 and Tyr411, crucial amino acid residue present in
the centre of drug binding site II of HSA are involved in its
esterase-like activity [21]. Catalytic activity of HSA toward p-NPA
was investigated to know the involvement of these residues in the
binding of HA to HSA. The kinetic constants (Km and Vmax) were
obtained by fitting the initial rates to Michaelis–Menten equation
using Graph-Pad Prism, version 5.0, software as shown in Figure
S1. Further, the reciprocal of substrate concentration against
reciprocal of respective product formation rate are plotted as
Lineweaver-Burk plot (Figure 6). The obtained values for all the
kinetic parameters are listed in Table 4. The activity of HSA
toward p-NPA gives Km and Vmax equal to 59.36605.55 mM and
0.1660.01 mMs21 respectively whereas in presence of HA, Vmax
remain same while Km increases. This indicates that the HA
inhibits the esterase-like activity of HSA competitively with Ki
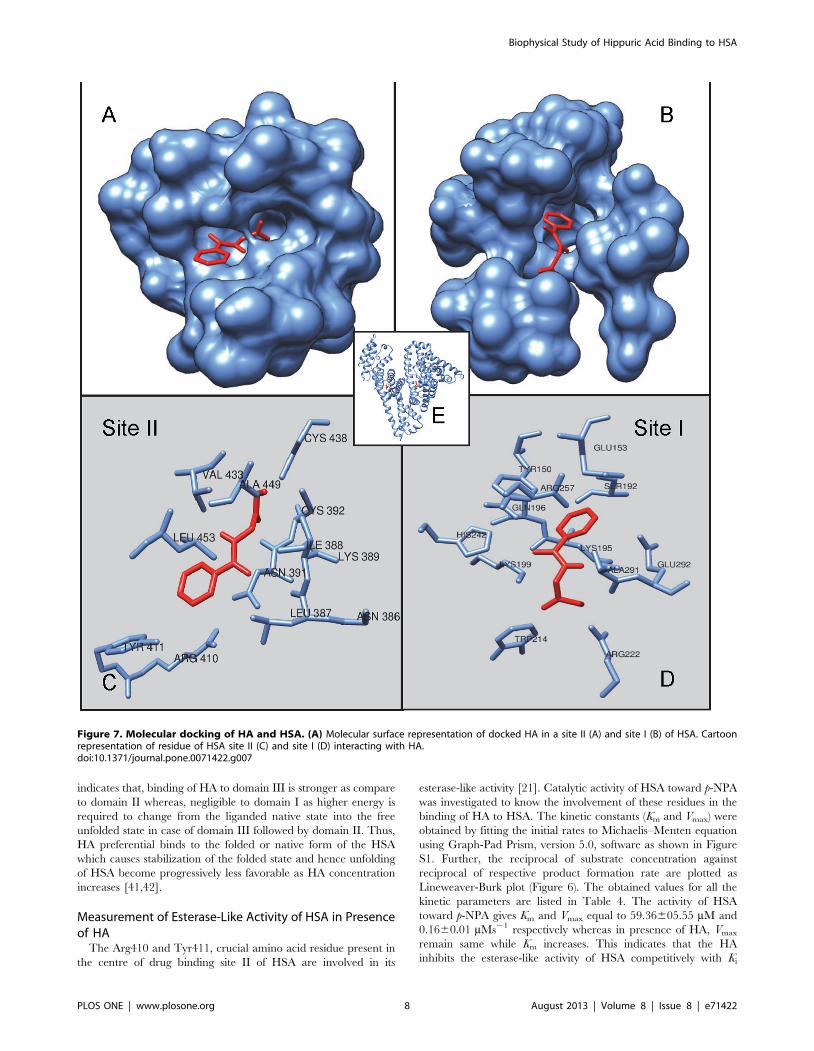
Figure 7. Molecular docking of HA and HSA. (A) Molecular surface representation of docked HA in a site II (A) and site I (B) of HSA. Cartoonrepresentation of residue of HSA site II (C) and site I (D) interacting with HA.doi:10.1371/journal.pone.0071422.g007
Biophysical Study of Hippuric Acid Binding to HSA
PLOS ONE | www.plosone.org 8 August 2013 | Volume 8 | Issue 8 | e71422
equals to 21.68 mM and hence Arg410 and Tyr411, of drug
binding site II of HSA are involved in binding of HA.
Molecular DockingThe molecular docking has been employed to further under-
stand the interaction of HA and HSA. The HSA comprises of
three homologous domains (I–III): I (residues 1–195), II (196–383),
III (384–585), each domain comprises subdomains that posses
common structural motifs. The principal regions of ligand binding
to HSA are located in hydrophobic cavities in subdomains IIA and
IIIA, which are consistent with Sudlow sites I and II, respectively
[12]. In the present study, Autodock Vina program is applied to
calculate the possible conformation of the HA that binds to the
protein. The best energy ranked results are summarized in Table 5
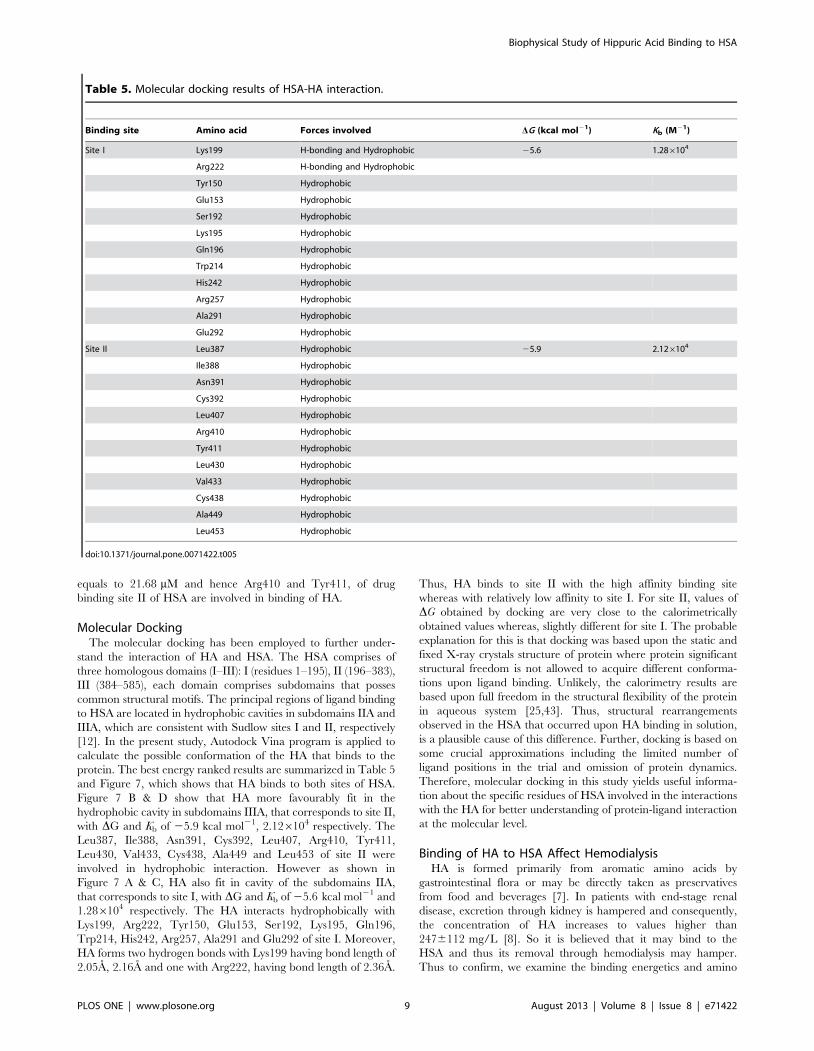
and Figure 7, which shows that HA binds to both sites of HSA.
Figure 7 B & D show that HA more favourably fit in the
hydrophobic cavity in subdomains IIIA, that corresponds to site II,
with DG and Kb of 25.9 kcal mol21, 2.126104 respectively. The
Leu387, Ile388, Asn391, Cys392, Leu407, Arg410, Tyr411,
Leu430, Val433, Cys438, Ala449 and Leu453 of site II were
involved in hydrophobic interaction. However as shown in
Figure 7 A & C, HA also fit in cavity of the subdomains IIA,
that corresponds to site I, with DG and Kb of 25.6 kcal mol21 and
1.286104 respectively. The HA interacts hydrophobically with
Lys199, Arg222, Tyr150, Glu153, Ser192, Lys195, Gln196,
Trp214, His242, Arg257, Ala291 and Glu292 of site I. Moreover,
HA forms two hydrogen bonds with Lys199 having bond length of
2.05A, 2.16A and one with Arg222, having bond length of 2.36A.
Thus, HA binds to site II with the high affinity binding site
whereas with relatively low affinity to site I. For site II, values of
DG obtained by docking are very close to the calorimetrically
obtained values whereas, slightly different for site I. The probable
explanation for this is that docking was based upon the static and
fixed X-ray crystals structure of protein where protein significant
structural freedom is not allowed to acquire different conforma-
tions upon ligand binding. Unlikely, the calorimetry results are
based upon full freedom in the structural flexibility of the protein
in aqueous system [25,43]. Thus, structural rearrangements
observed in the HSA that occurred upon HA binding in solution,
is a plausible cause of this difference. Further, docking is based on
some crucial approximations including the limited number of
ligand positions in the trial and omission of protein dynamics.
Therefore, molecular docking in this study yields useful informa-
tion about the specific residues of HSA involved in the interactions
with the HA for better understanding of protein-ligand interaction
at the molecular level.
Binding of HA to HSA Affect HemodialysisHA is formed primarily from aromatic amino acids by
gastrointestinal flora or may be directly taken as preservatives
from food and beverages [7]. In patients with end-stage renal
disease, excretion through kidney is hampered and consequently,
the concentration of HA increases to values higher than
2476112 mg/L [8]. So it is believed that it may bind to the
HSA and thus its removal through hemodialysis may hamper.
Thus to confirm, we examine the binding energetics and amino
Table 5. Molecular docking results of HSA-HA interaction.
Binding site Amino acid Forces involved DG (kcal mol21) Kb (M21)
Site I Lys199 H-bonding and Hydrophobic 25.6 1.286104
Arg222 H-bonding and Hydrophobic
Tyr150 Hydrophobic
Glu153 Hydrophobic
Ser192 Hydrophobic
Lys195 Hydrophobic
Gln196 Hydrophobic
Trp214 Hydrophobic
His242 Hydrophobic
Arg257 Hydrophobic
Ala291 Hydrophobic
Glu292 Hydrophobic
Site II Leu387 Hydrophobic 25.9 2.126104
Ile388 Hydrophobic
Asn391 Hydrophobic
Cys392 Hydrophobic
Leu407 Hydrophobic
Arg410 Hydrophobic
Tyr411 Hydrophobic
Leu430 Hydrophobic
Val433 Hydrophobic
Cys438 Hydrophobic
Ala449 Hydrophobic
Leu453 Hydrophobic
doi:10.1371/journal.pone.0071422.t005
Biophysical Study of Hippuric Acid Binding to HSA
PLOS ONE | www.plosone.org 9 August 2013 | Volume 8 | Issue 8 | e71422
acid involved in binding of HA to HSA. From above studies, it is
found that, HA binds with high affinity to site II while with
relatively low affinity to site I of HSA via hydrogen bonding,
electrostatic and hydrophobic interaction. Therefore it is con-
firmed that it bounds to HSA and thus it elimination may be
hampered through hemodialysis. Moreover, Arg410 and Tyr411
are involved in binding of HA to site II of HSA, that are also
crucial for esterase-like activity of HSA. Thus, HA also impinges
esterase-like activity of HSA.
ConclusionsThe present work reports the interaction of HA, a uremic toxin,
to HSA. Results indicated that it markedly binds to both drug
binding sites of HSA; however binding at site II is relatively more.
Further, the quenching mechanism of fluorescence of HSA by HA
is a static procedure and their binding is a spontaneous,
enthalpically driven, entropically opposed process that involves
hydrogen bonding, electrostatic, and hydrophobic interaction.
Since it binds to HSA, so its elimination through hemodialysis may
hinder. Moreover, it increases the thermostabilty of HSA on
binding and inhibits the esterase-like activity of HSA in a
competitive manner.
Supporting Information
Figure S1 Michalies-Menten plot of HSA for p-NPA atHSA: HA ratio of 1:0, 1:0.5 1:1, 1:1.5, and 1:2.
(TIF)
Acknowledgments
Facilities provided by Interdisciplinary Biotechnology Unit, Aligarh
Muslim University are gratefully acknowledged.
Author Contributions
Conceived and designed the experiments: NZ RHK. Performed the
experiments: NZ MRA GR EA. Analyzed the data: NZ RHK.
Contributed reagents/materials/analysis tools: NZ MRA GR EA RHK.
Wrote the paper: NZ RHK.
References
1. Miyamoto Y, Iwao Y, Tasaki Y, Sato K, Ishima Y, et al. (2010) The uremic
solute indoxyl sulfate acts as an antioxidant against superoxide anion radicals
under normal-physiological conditions. FEBS Letters 584: 2816–2820.
2. Duranton F, Cohen G, De Smet R, Rodriguez M, Jankowski J, et al. (2012)
Normal and Pathologic Concentrations of Uremic Toxins. J Am Soc Nephrol
23: 1258–1270.
3. Dzurik R, Spustova V, Krivosıkova Z, Gazdıkova K (2001) Hippurate
participates in the correction of metabolic acidosis. Kidney Int Suppl
78:S278–81.
4. Spustova V, Gajdos M, Opatrny K Jr, Stefıkova K, Dzurik R (1991) Serum
hippurate and its excretion in conservatively treated and dialyzed patients with
chronic renal failure. Physiol Res 40: 599–606.
5. Boumendil-Podevin EF, Podevin RA, Richet G (1975) Uricosuric agents in
uremic sera. Identification of indoxyl sulfate and hippuric acid. J Clin Invest 55 :
1142–1152.
6. Ohtsuki S, Asaba H, Takanaga H, Deguchi T, Hosoya K, et al. (2002 ) Role of
blood-brain barrier organic anion transporter 3 (OAT3) in the efflux of indoxyl
sulfate, a uremic toxin: its involvement in neurotransmitter metabolite clearance
from the brain. J Neurochem 3: 57–66.
7. Niwa T (1996) Organic acids and the uremic syndrome: protein metabolite
hypothesis in the progression of chronic renal failure. Semin Nephrol 16: 167–
182.
8. Vanholder R, Smet RD, Glorieux G, Argile A, Baurmeister U, et al. (2003)
Review on uremic toxins: Classification, concentration, and interindividual
variability. Kidney International 63: 1934–1943.
9. Sugio S, Kashima A, Mochizuki S, Noda M, Kobayashi K (1999) Crystal
structure of human serum albumin at 2.5 A resolution. Protein Eng 12: 439–446.
10. Peters T (1996) All about Albumin. Biochemistry, Genetics and Medical
Applications. Academic Press, San Diego.
11. He XM, Carter DC (1992) Atomic structure and chemistry of human serum
albumin. Nature 358: 209–215.
12. Sudlow G, Birkett DJ, Wade DN (1975) The characterization of two specific
drug binding sites on human serum albumin. Mol Pharmacol 11: 824–832.
13. Varshney A, Rehan M, Subbarao N, Rabbani G, Khan RH (2011) Elimination
of endogenous toxin, creatinine from blood plasma depends on albumin
conformation: site specific uremic toxicity & impaired drug binding. PLoS ONE
6: e17230.
14. Vanholder RC, De Smet RV, Ringoir SM (1992) Assessment of urea and other
uremic markers for quantification of dialysis efficacy. Clin Chem 38: 1429–1436.
15. Hung HC, Chang GG (2001) Multiple unfolding intermediates of human
placental alkaline phosphatase in equilibrium urea denaturation. Biophys J 81:
3456–3471.
16. Lakowicz JR (1999) Principles of Fluorescence Spectroscopy. 2nd ed. Plenum:
NY, USA. 277–283.
17. Zaidi N, Ahmad E, Rehan M, Rabbani G, Ajmal MR, et al. (2013) Biophysical
insight into furosemide binding to human serum albumin: a study to unveil its
impaired albumin binding in uremia. J Phys Chem B 117: 2595–2604.
18. Lakowicz JR (2006) Principles of Fluorescence Spectroscopy. 3rd ed. Plenum:
NY, USA. 282.
19. Petitpas I, Bhattacharya AA, Twine S, East M, Curry S (2001) Crystal structure
analysis of warfarin binding to human serum albumin: anatomy of drug site I. J
Biol Chem 276: 22804–22809.
20. Ghuman J, Zunszain PA, Petitpas I, Bhattacharya AA, Otagiri M, et al. (2005)
Structural basis of the drug-binding specificity of human serum albumin. J MolBiol 353: 38–52.
21. Watanabe H, Tanase S, Nakajou K, Maruyama T, Kragh-Hansen U, et al.
(2000) Role of Arg-410 and Tyr-411 in human serum albumin for ligand bindingand esterase-like activity Biochem J 349: 813–819.
22. Trott O, Olson AJ (2010) AutoDock Vina: improving the speed and accuracy of
docking with a new scoring function, efficient optimization and multithreading.
Journal of Comput Chem 31: 455–461.
23. Accelrys Software Inc., Discovery Studio Modeling Environment, Release 3.5,San Diego: Accelrys Software Inc., 2012.
24. Pettersen EF, Goddard TD, Huang CC, Couch GS, Greenblatt DM, et al.
(2004) UCSF Chimera- a visualization sysytem for exploratory research and
analysis. J Comput Chem 25: 1605–1612.
25. Ahmad E, Rabbani G, Zaidi N, Singh S, Rehan M, et al. (2011) Stereo-selectivity of human serum albumin to enantiomeric and isoelectronic pollutants
dissected by spectroscopy, calorimetry and bioinformatics. PLoS ONE 6: e 26186.
26. Ross PD, Subramanian S (1981) Thermodynamics of protein association
reactions: forces contributing to stability. Biochemistry 20: 3096–3102.
27. Thoppil AA, Sharma R, Kishore N (2008) Complexation of b-lactam antibioticdrug carbenicillin to bovine serum albumin: energetics and conformational
studies. Biopolymers 89: 831–840.
28. Tian J, Liu J, He W, Hu Z, Yao X et al. (2004) Probing the Binding ofScutellarin to Human Serum Albumin by Circular Dichroism, Fluorescence
Spectroscopy, FTIR, and Molecular Modeling Method. Biomacromolecules 5:
1956–1961.
29. Nada T, Terazima M (2003) A novel method for study of protein folding kineticsby monitoring diffusion coefficient in time domain. Biophys J. 85: 1876–1881.
30. Faergeman NJ, Sigurskjold BW, Kragelund BB, Anderson KV, Knudsen J
(1996) Thermodynamics of ligand binding to acyl-coenzyme A binding protein
studied by titration calorimetry. Biochemistry 35: 14118–14126.
31. Chi Z, Liu R (2011) Phenotypic characterization of the binding of tetracycline tohuman serum albumin. Biomacromolecules 12: 203–209.
32. Hu YJ, Liu Y, Xiao XH (2009) Investigation of the interaction between
berberine and human serum albumin. Biomacromolecules 10: 517–521.
33. Zolotnitsky G, Cogan U, Adir N, Solomon V, Shoham G, et al. (2004) Mapping
glycoside hydrolase substrate subsites by isothermal titration calorimetry. Proc.Natl. Acad. Sci. U S A 101: 11275–11280.
34. Keswani N, Choudhary S, Kishore N (2010) Interaction of weakly bound
antibiotics neomycin and lincomycin with bovine and human serum albumin:biophysical approach. J Biochem 148: 71–84.
35. Anand U, Jash C, Mukherjee S (2010) Spectroscopic probing of the
microenvironment in a protein-surfactant assembly J Phys Chem B 114:
15839–15845.
36. Ahmad B, Parveen S, Khan RH (2006) Effect of albumin conformation on thebinding of ciprofloxacin to human serum albumin: a novel approach directly
assigning binding site Biomacromolecules 7: 1350–1356.
37. Celej MS, Dassie SA, Gonzalez M, Bianconi ML, Fidelio GD (2006) Differential
scanning calorimetry as a tool to estimate binding parameters in multiligandbinding proteins. Anal Biochem 350: 277–284.
38. Privalov PL (1982) Stability of proteins. Proteins which do not present a single
cooperative system. Adv Protein Chem 35: 1–104.
39. Rezaei Tavirani M, Moghaddamnia SH, Ranjbar B, Amani M, Marashi SA(2006)Conformational study of human serumalbumin in predenaturation
Biophysical Study of Hippuric Acid Binding to HSA
PLOS ONE | www.plosone.org 10 August 2013 | Volume 8 | Issue 8 | e71422
temperatures by differential scanning calorimetry, circular dichroism and UV
spectroscopy. J Biochem Mol Biol 39: 530–536.40. Uversky VN, Narizhneva NV, Ivanova TV, Tomashevski AY (1997) Rigidity of
human alpha fetoprotein tertiary structure is under ligand control. Biochemistry
36: 13638–13645.41. Celej MS, Dassie SA, Freire E, Bianconi ML, Fidelio GD (2006) Ligand-induced
thermostability in proteins: thermodynamic analysis of ANS-albumin interac-tion. Biochim Biophys Acta 1750: 122–133.
42. Sharma R, Choudhary S, Kishore N (2012) Insights into the binding of the drugs
diclofenac sodium and cefotaxime sodium to serum albumin: Calorimetry and
spectroscopy. Eur J Pharma Sci 46: 435–445.
43. Neelam S, Gokara M, Sudhamalla B, Amooru DG, Subramanyam R (2010)
Interaction studies of coumaroyltyramine with human serum albumin and its
biological importance. J Phys Chem B 114: 3005–3012.
Biophysical Study of Hippuric Acid Binding to HSA
PLOS ONE | www.plosone.org 11 August 2013 | Volume 8 | Issue 8 | e71422
Related Documents