Early Adopters of the Protected Bicycle Lane in United States: What Have We Learned? NITC Webinar March 19, 2015 1 Photo credit: Nathan McNeil, PSU Christopher M. Monsere @CMonsere Portland State University Project co-PIs Jennifer Dill, Kelly Clifton, Nathan McNeil Lead GRAs: Tara Goddard and Nick Foster http://bit.ly/nitc_583

A Comprehensive Evaluation of Protected Cycling Facilities: Lessons from Five Cities
Jul 15, 2015
Welcome message from author
This document is posted to help you gain knowledge. Please leave a comment to let me know what you think about it! Share it to your friends and learn new things together.
Transcript

Early Adopters of
the Protected
Bicycle Lane in
United States: What
Have We Learned?
NITC Webinar
March 19, 20151
Photo credit: Nathan McNeil, PSU
Christopher M. Monsere @CMonserePortland State University
Project co-PIsJennifer Dill, Kelly Clifton, Nathan McNeilLead GRAs: Tara Goddard and Nick Foster
http://bit.ly/nitc_583

Webinar Overview
1. Introduction and Background
2. Methodology
3. Change in Ridership
4. Design
5. Community Support
6. Conclusions
2
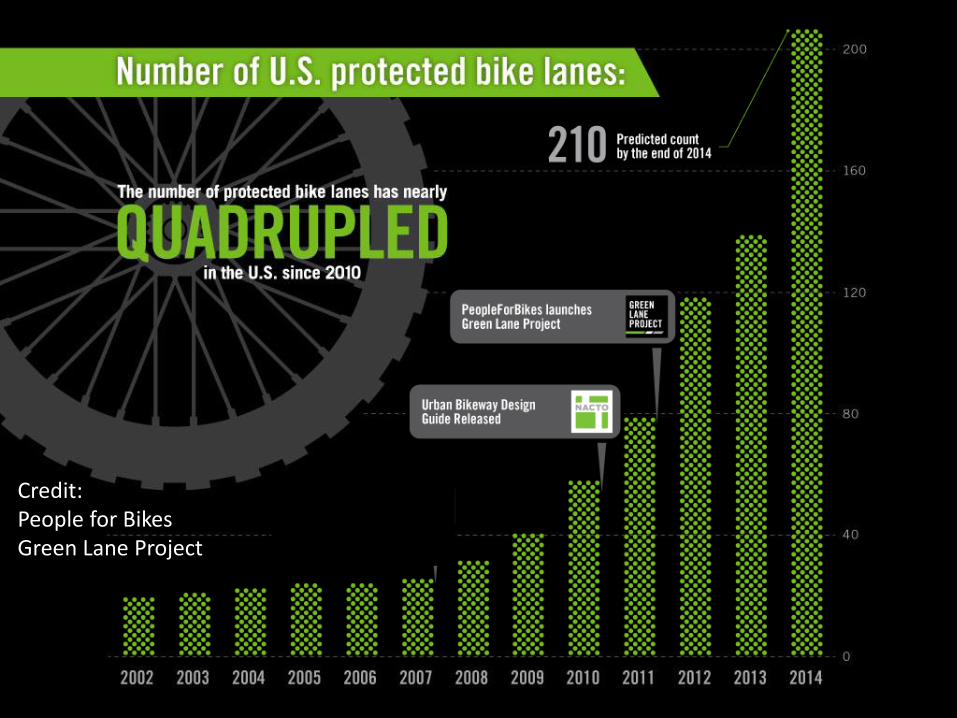
Credit:People for BikesGreen Lane Project
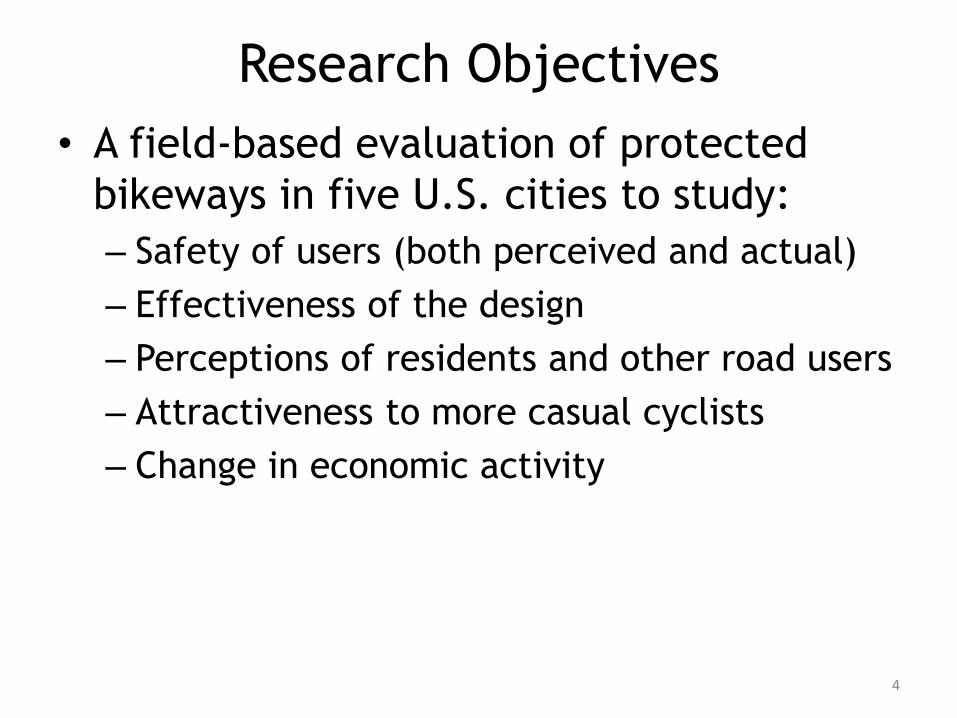
Research Objectives
• A field-based evaluation of protected
bikeways in five U.S. cities to study:
– Safety of users (both perceived and actual)
– Effectiveness of the design
– Perceptions of residents and other road users
– Attractiveness to more casual cyclists
– Change in economic activity
4
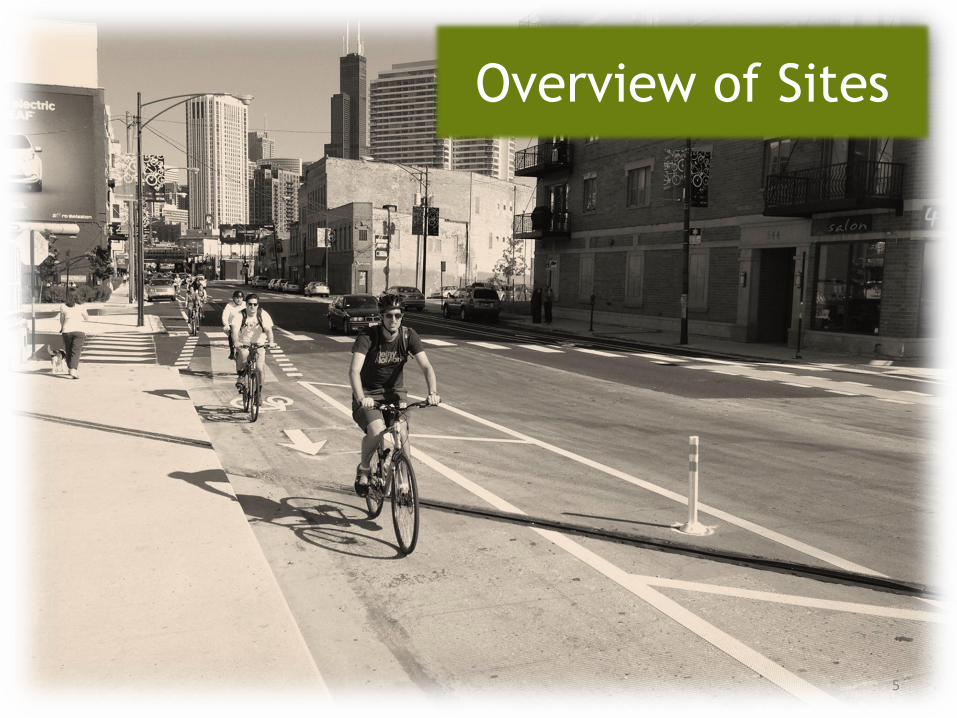
Overview of Sites
5

Green Lane Cities Studied
6

7
Austin: Rio Grande StreetTwo-way protected bike lane on one-way street
Two-way bikeway
One-way vehicle lane

8
Austin: Bluebonnet Lane
Two-way bikeway
Two-way vehicles
Two-way protected bike lane on a two-way street

9
Austin: Barton Springs RoadOne-way protected bike lane on the south side of the road
One-way bikeway
Two-way vehicles4 lanes
Shared-Use Path
10
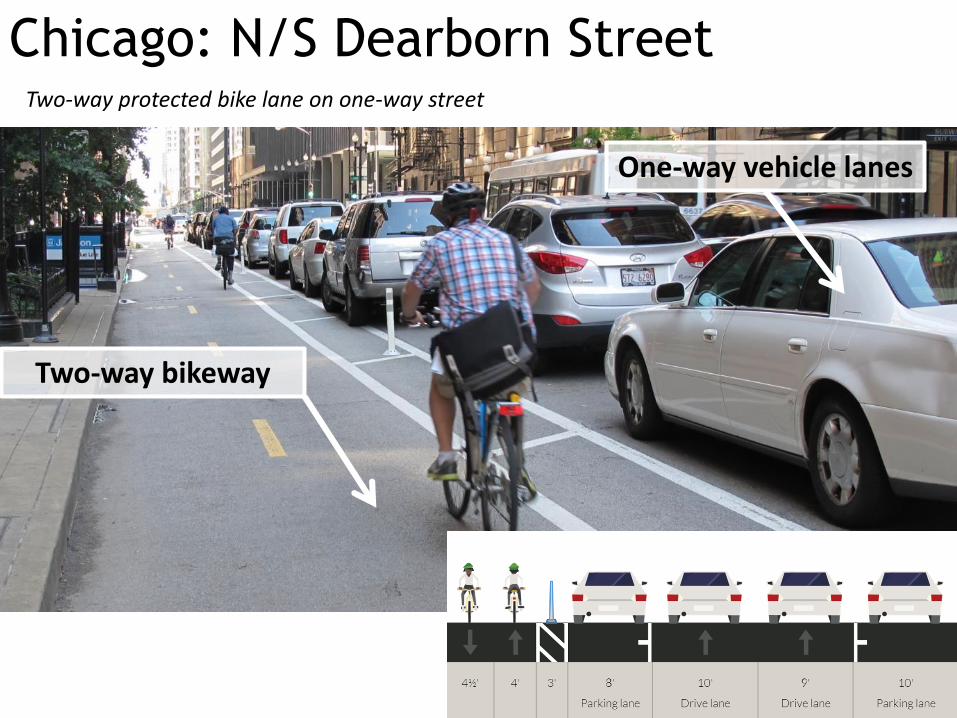
Chicago: N/S Dearborn StreetTwo-way protected bike lane on one-way street
Two-way bikeway
One-way vehicle lanes
11
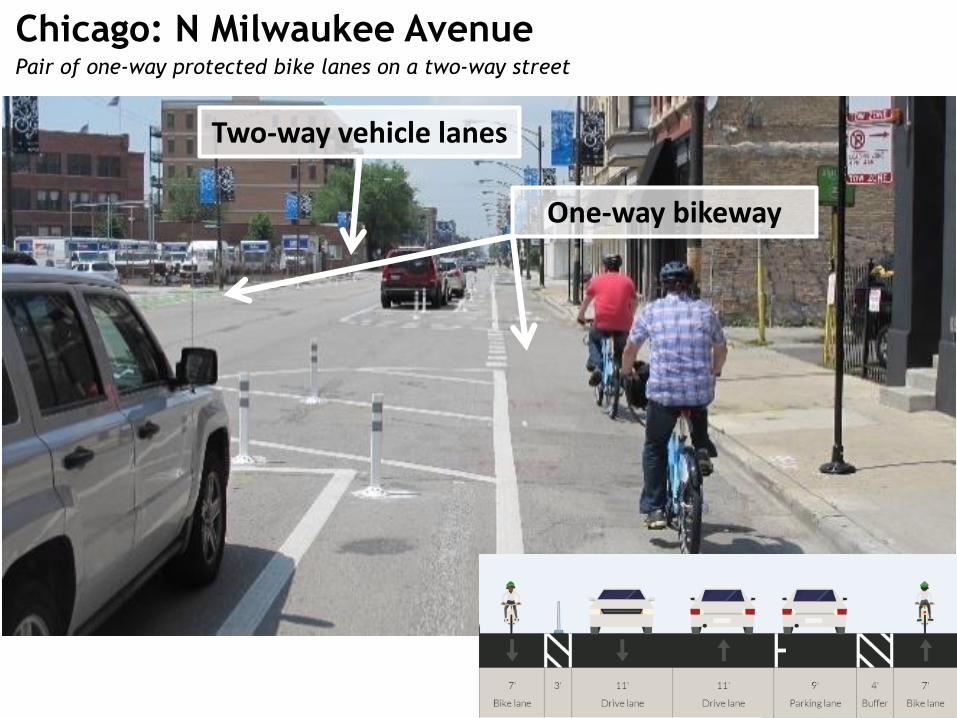
Chicago: N Milwaukee AvenuePair of one-way protected bike lanes on a two-way street
One-way bikeway
Two-way vehicle lanes

12
Portland: NE Multnomah StreetPair of one-way protected bike lanes on a two-way street
One-way bikewayTwo-way vehicle lanes with center turn lane

13
San Francisco: Fell StreetOne-way left-side protected lane on a one-way street
One-way bikeway
One-way vehicle lanes

14
San Francisco: Oak StreetOne-way right-side lane on a one-way street
One-way bikewayOne-way vehicle lanes

15
Washington DC: L StreetOne-way protected bike lane on a one-way street
One-way bikeway
One-way vehicle lanes

Methodology
16
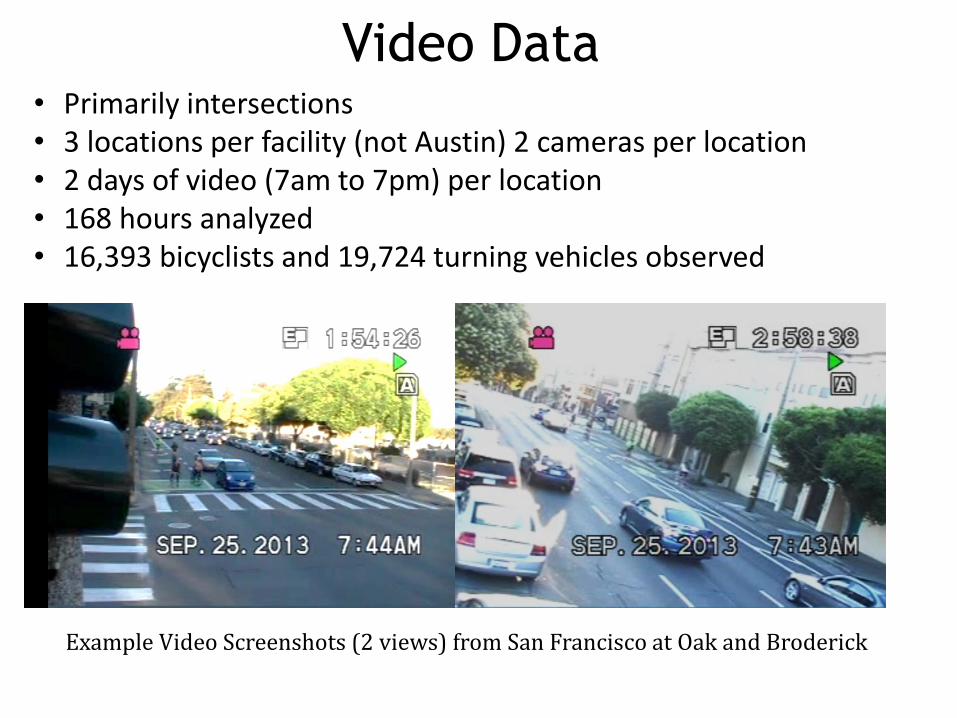
Video Data• Primarily intersections• 3 locations per facility (not Austin) 2 cameras per location • 2 days of video (7am to 7pm) per location• 168 hours analyzed • 16,393 bicyclists and 19,724 turning vehicles observed
Example Video Screenshots (2 views) from San Francisco at Oak and Broderick
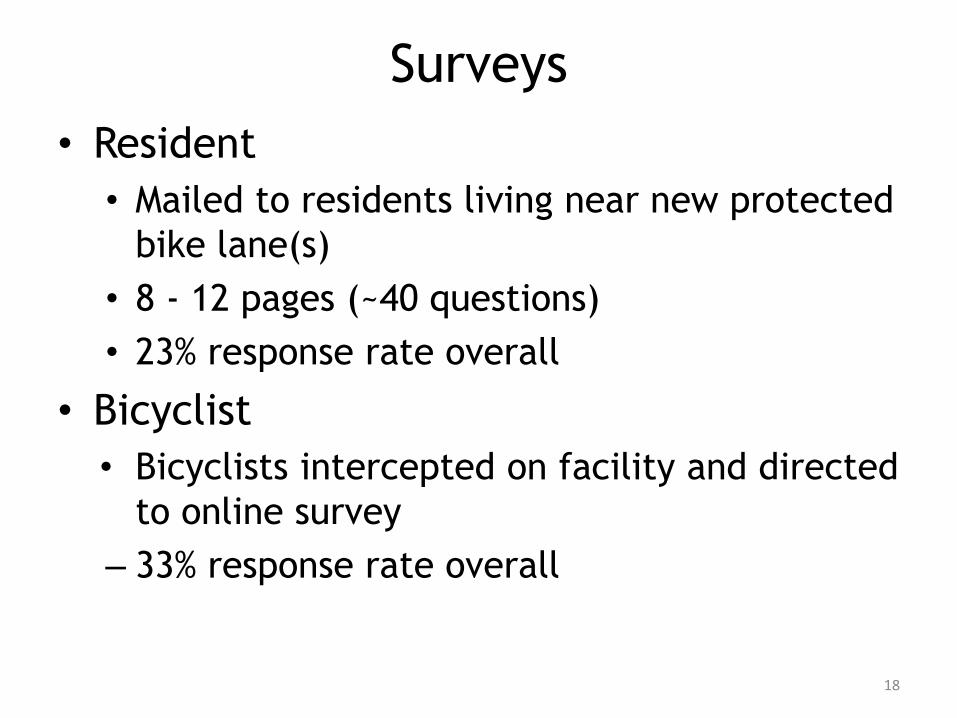
Surveys
• Resident
• Mailed to residents living near new protected
bike lane(s)
• 8 - 12 pages (~40 questions)
• 23% response rate overall
• Bicyclist
• Bicyclists intercepted on facility and directed
to online survey
– 33% response rate overall
18

Data Used in Analysis
Research Element Video DataBicyclist
Survey
Resident
SurveyCount Data
Change in Ridership
Design/Safety
Evaluation
Barrier Types &
Comfort
Community Support
19
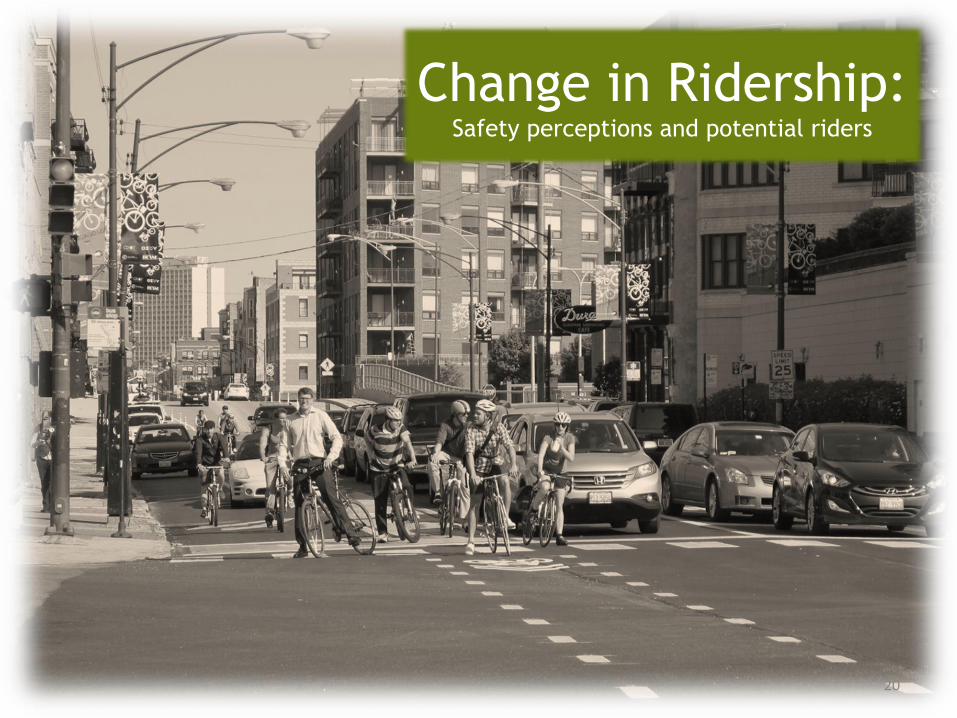
Change in Ridership:Safety perceptions and potential riders
20
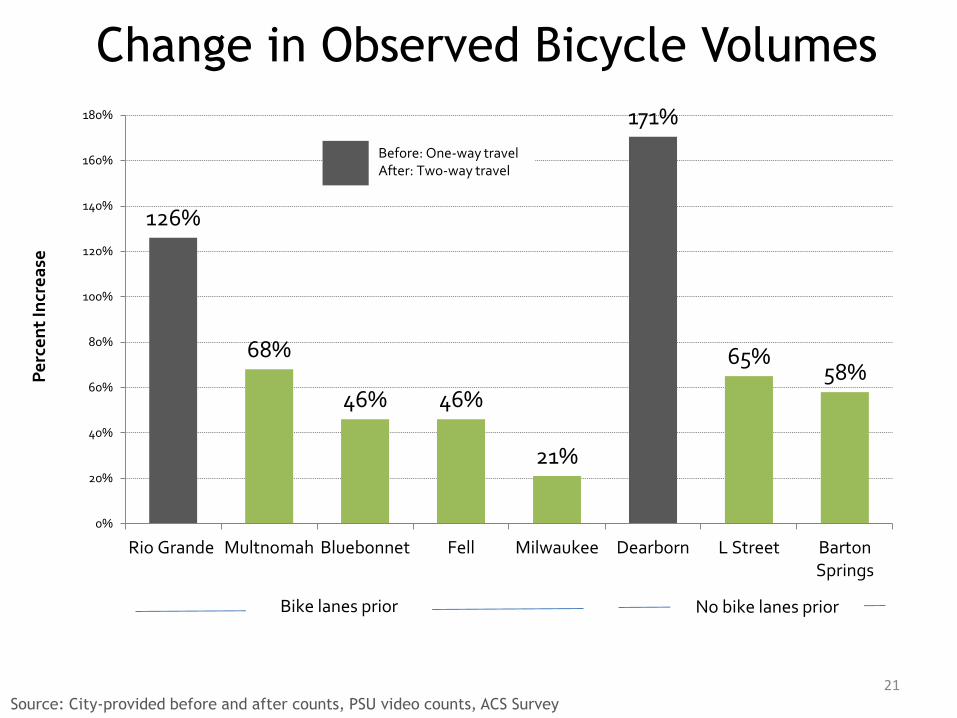
Change in Observed Bicycle Volumes
Source: City-provided before and after counts, PSU video counts, ACS Survey
21
126%
68%
46% 46%
21%
171%
65%58%
0%
20%
40%
60%
80%
100%
120%
140%
160%
180%
Rio Grande Multnomah Bluebonnet Fell Milwaukee Dearborn L Street BartonSprings
Pe
rce
nt
Incr
ea
se
Before: One-way travelAfter: Two-way travel
Bike lanes prior No bike lanes prior
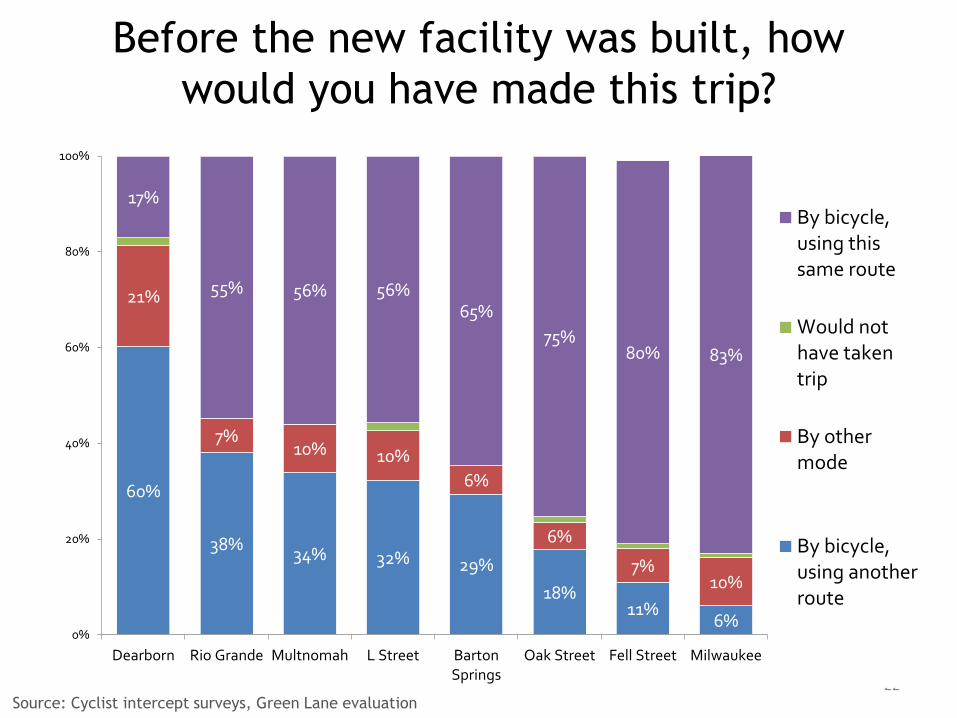
Before the new facility was built, how
would you have made this trip?
22Source: Cyclist intercept surveys, Green Lane evaluation
60%
38%34% 32% 29%
18%11%
6%
21%
7%10% 10%
6%
6%
7%10%
17%
55% 56% 56%65%
75%80% 83%
0%
20%
40%
60%
80%
100%
Dearborn Rio Grande Multnomah L Street BartonSprings
Oak Street Fell Street Milwaukee
By bicycle,using thissame route
Would nothave takentrip
By othermode
By bicycle,using anotherroute

One likely reason: Improved perception of safety
33%
18%
29%
31%
33%
18%
27%
56%
82%
66%
65%
59%
81%
66%
0% 20% 40% 60% 80% 100%
Austin Barton Springs
Chicago Dearborn
DC L Street
Chicago Milwuakie
Portland Multnomah
SF Oak / Fell
Austin Rio Grande
Increased Somewhat Increased a Lot
23Source: Cyclist intercept surveys, Green Lane evaluation
I feel the safety of bicycling on ______ has . .
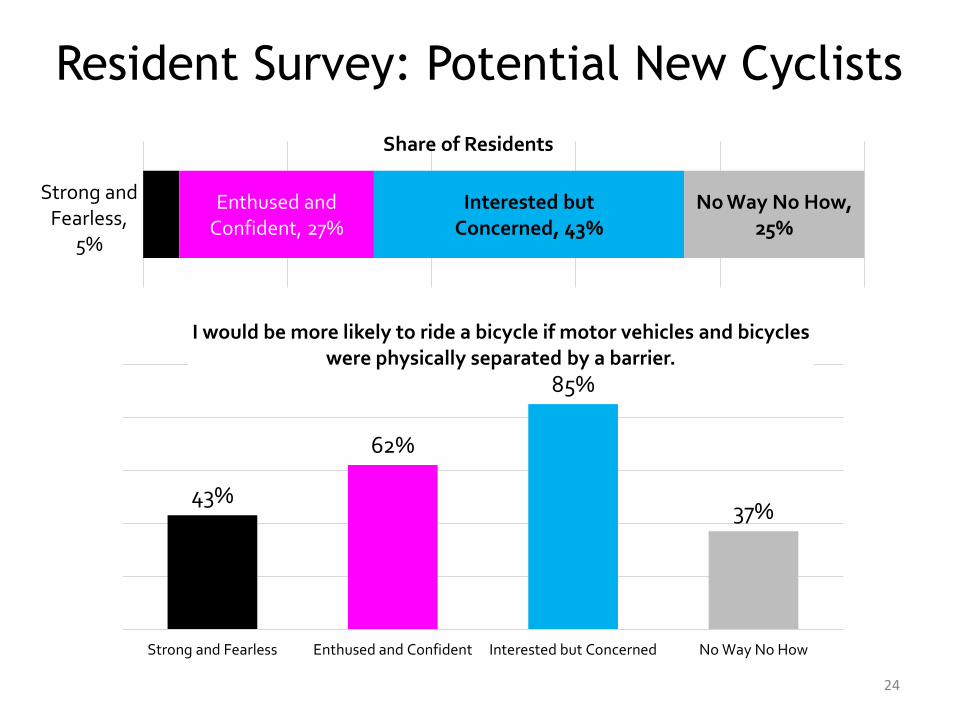
Resident Survey: Potential New Cyclists
24
Strong and Fearless,
5%
Enthused and Confident, 27%
Interested but Concerned, 43%
No Way No How, 25%
Share of Residents
43%
62%
85%
37%
Strong and Fearless Enthused and Confident Interested but Concerned No Way No How
I would be more likely to ride a bicycle if motor vehicles and bicycles were physically separated by a barrier.
0%
10%
20%
30%
40%
50%
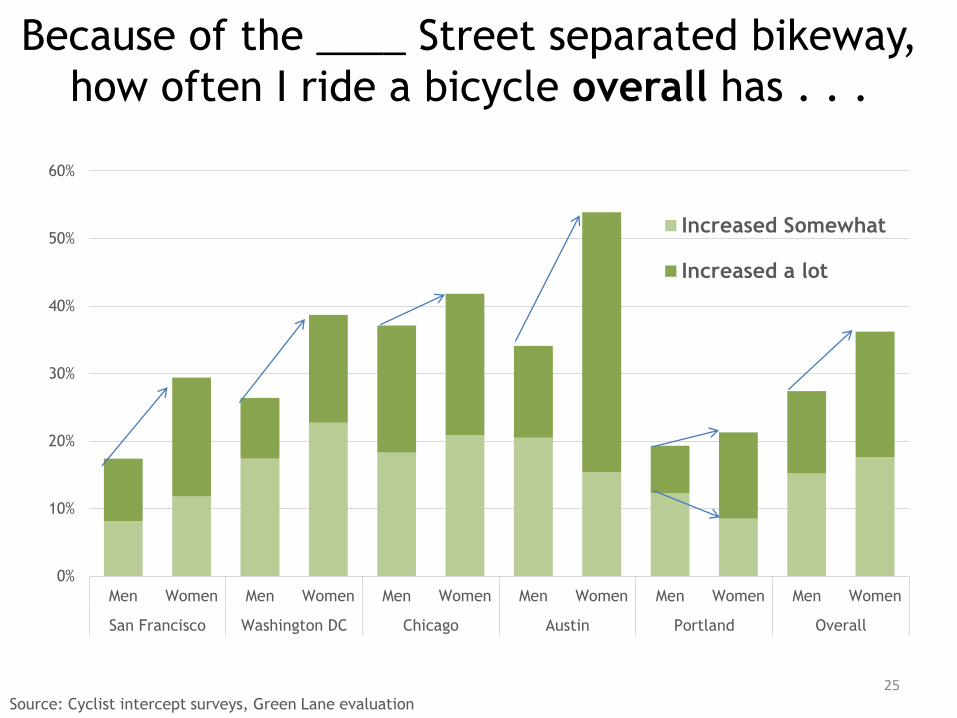
60%
Men Women Men Women Men Women Men Women Men Women Men Women
San Francisco Washington DC Chicago Austin Portland Overall
Increased Somewhat
Increased a lot
Because of the ____ Street separated bikeway,
how often I ride a bicycle overall has . . .
Source: Cyclist intercept surveys, Green Lane evaluation
25

Design:Intersections, Signals, Buffers
26
Design Elements
• Intersections
– Turning and mixing zones
– Fully signalized
• Buffers
– Type and widths
27
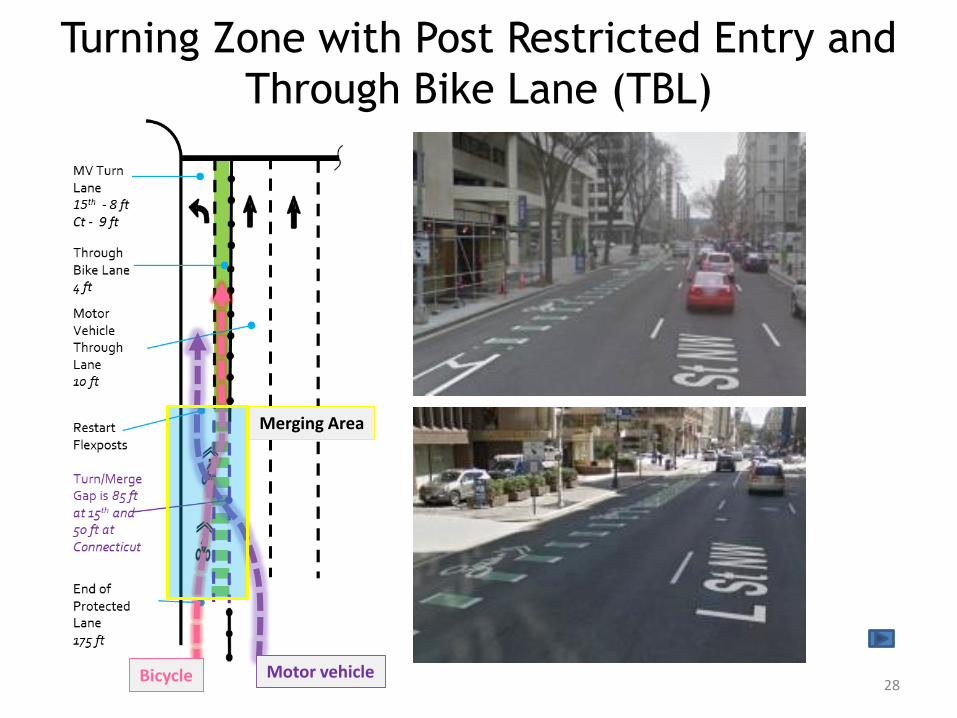
Turning Zone with Post Restricted Entry and
Through Bike Lane (TBL)
28Motor vehicleBicycle
Merging Area

Turning Zone with Unrestricted
Entry and TBL
29
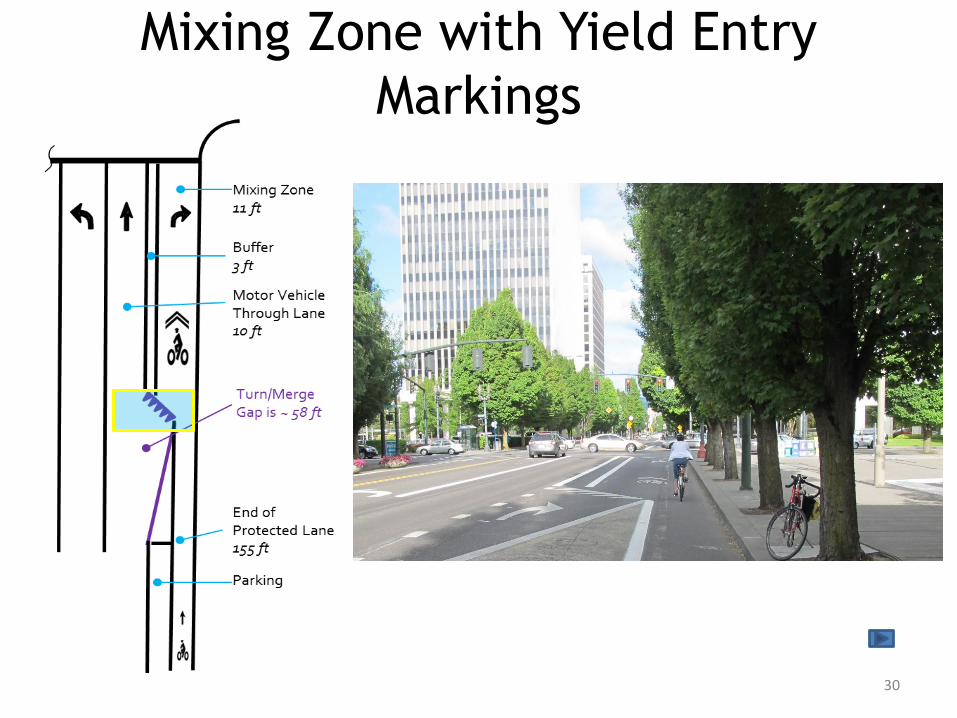
Mixing Zone with Yield Entry
Markings
30

Mixing Zone with Sharrow Marking
31

Mixing Zone with Green Skip
Coloring
32

Intersection and Type of DesignDirection of Turning
Traffic
Through Bikes Per
Hour
Turning Vehicles Per Hour
Observed Correct Turning
Motorist
Observed Correct Through Bicycle
% of Bicyclists Agreeing
They Feel Safe
Turning Zone with Post Restricted Entry and
Through Bike Lane (TBL)
L Street / 15th
Left 110 173 86% 93% 64%
Turning Zone with Post Restricted Entry and TBL
L Street / ConnecticutLeft 116 125 88% 89% 64%
Turning Zone with Unrestricted Entry and
TBL
Oak / Divisadero
Right 201 126 66% 81% 74%
Mixing Zone with Yield Entry Markings
NE Multnomah / 9thRight 31 94 93% 63% 73%
Mixing Zone with Sharrow Marking
Oak / BroderickRight 188 24 48% 30% 79%
Mixing Zone with Green Skip Coloring
Fell / BakerLeft 226 48 49% - 84%

DC Design
on M
Street
(new)
34Photo from @JenniferDillPSU

Observed Precautionary and Minor Conflicts
35
0
20
40
60
80
100
120
0 200 400 600 800 1,000
Tota
l Co
nfl
icts
Turning Vehicles When Bike Is Present * Bicycles Thousands
Multnomah and 9th
Oak Divisadero
Oak and Broderick
Fell and Baker
L and 15th St
L and Connecticut

36
Dearborn and Madison, Chicago, IL
Photo: C. Monsere
Left-turn signal for cars
Bicycle signals
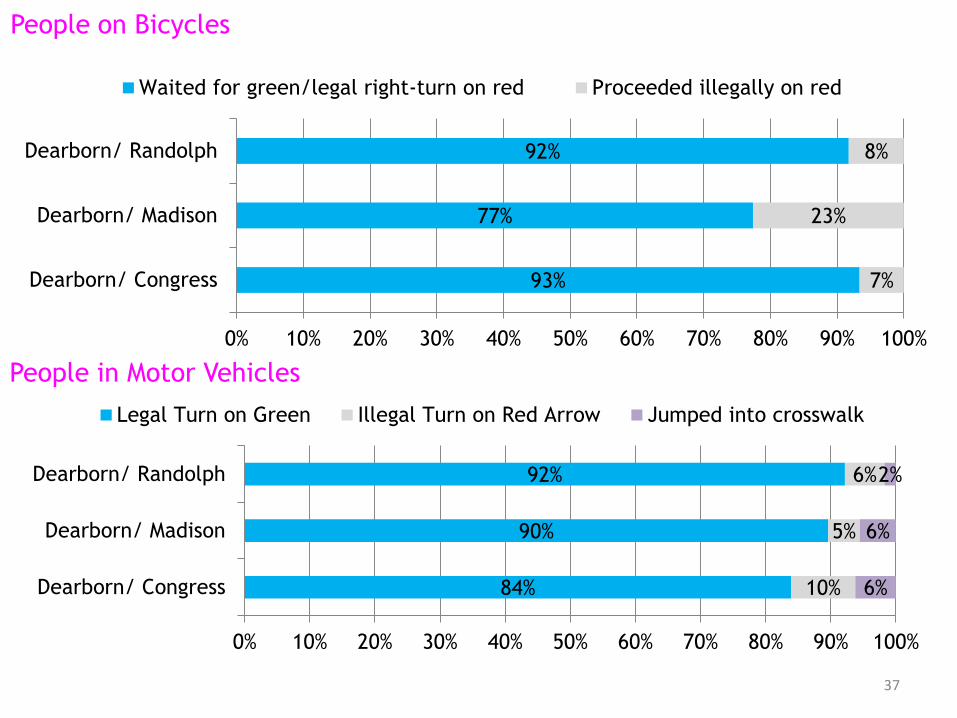
37
93%
77%
92%
7%
23%
8%
0% 10% 20% 30% 40% 50% 60% 70% 80% 90% 100%
Dearborn/ Congress
Dearborn/ Madison
Dearborn/ Randolph
Waited for green/legal right-turn on red Proceeded illegally on red
84%
90%
92%
10%
5%
6%
6%
6%
2%
0% 10% 20% 30% 40% 50% 60% 70% 80% 90% 100%
Dearborn/ Congress
Dearborn/ Madison
Dearborn/ Randolph
Legal Turn on Green Illegal Turn on Red Arrow Jumped into crosswalk
People on Bicycles
People in Motor Vehicles

Perceived Safety at Intersections
38
0 20 40 60 80 100
L Street/ 15th Street
L Street/ Connecticut
Oak/ Divisadero
NE Multnomah/9th
Oak/Broderick
Fell/Baker
Chicago - Signalized
Percent Feeling Safe
Percent Respondents Somewhat or Strongly Agreeing "Feel Safe"

Change in Stated Comfort (from a bike lane), by bicyclist type
1%
-1%-5%
-2%
7% 6%
-1% -1%-4%
1%
10% 9%
24% 24%
31%
50% 48%
60%
-10%
0%
10%
20%
30%
40%
50%
60%
70%
A painted 2-3foot buffer
A solid paintedbuffer
A paintedbuffer andparked cars
A raisedconcrete curb
A 2-3 footbuffer and
plasticflexposts
Plantersseparating the
bikeway
Perc
ent
Incre
ase
of
Norm
alized S
core
(wit
h a
sta
ndard
bic
cyle
lane a
s base
)
Strong and Fearless Enthused and Confident Interested But Concerned
39

Community Support:Motorists, Pedestrians, General
40
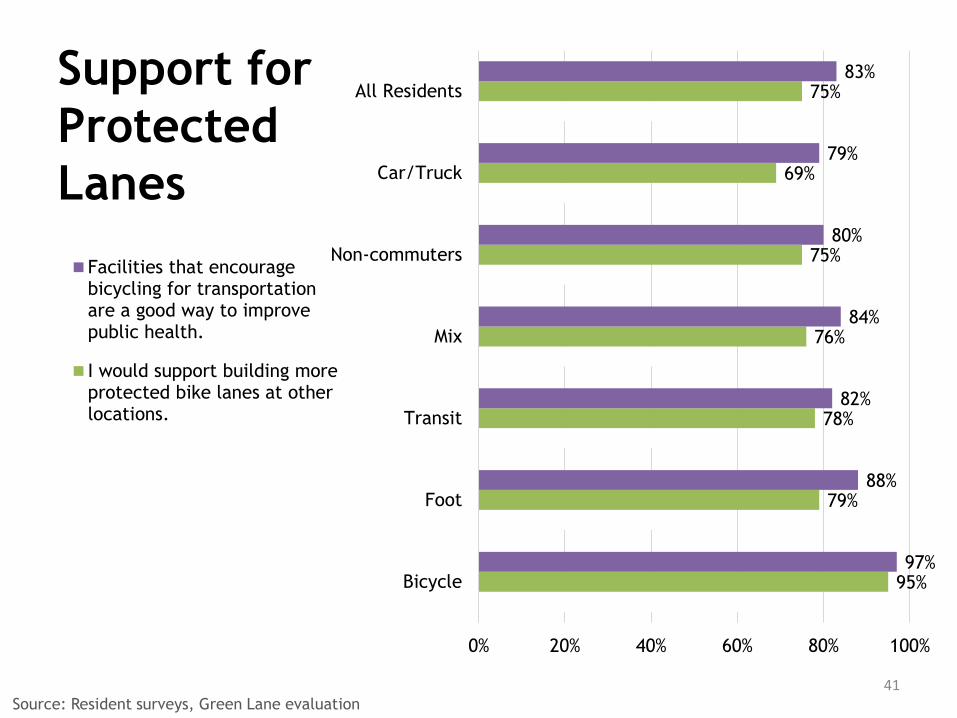
Support for
Protected
Lanes
41Source: Resident surveys, Green Lane evaluation
95%
79%
78%
76%
75%
69%
75%
97%
88%
82%
84%
80%
79%
83%
0% 20% 40% 60% 80% 100%
Bicycle
Foot
Transit
Mix
Non-commuters
Car/Truck
All Residents
Facilities that encouragebicycling for transportationare a good way to improvepublic health.
I would support building moreprotected bike lanes at otherlocations.
Because of the protected bikelanes, the desirability of livingin my neighborhood hasincreased

Support for
Protected
Lanes
42Source: Resident surveys, Green Lane evaluation
66%
45%
43%
47%
36%
39%
43%
95%
79%
78%
76%
75%
69%
75%
97%
88%
82%
84%
80%
79%
83%
0% 20% 40% 60% 80% 100%
Bicycle
Foot
Transit
Mix
Non-commuters
Car/Truck
All Residents
Facilities that encouragebicycling for transportationare a good way to improvepublic health.
I would support building moreprotected bike lanes at otherlocations.
Because of the protected bikelanes, the desirability of livingin my neighborhood hasincreased

Because of the protected bike lanes, the
safety of _____ on the street has . .
30%
23%
28%
43%
38%
38%
45%
27%
15%
19%
44%
52%
21%
37%
0% 20% 40% 60% 80% 100%
Washington DC - L St.
Chicago, Dearborn
Chicago, Milwaukee
Austin, Barton Springs
Austin, Bluebonnet
San Francisco, Oak
Portland, Multnomah
Percent of Residents Stating “Safety Increased"
Walking
Driving
Bicycling
Source: Resident Surveys, Green Lane evaluation
43

Because of the protected bike lanes, the
safety of _____ on the street has . .
80%
76%
74%
82%
85%
80%
74%
30%
23%
28%
43%
38%
38%
45%
27%
15%
19%
44%
52%
21%
37%
0% 20% 40% 60% 80% 100%
Washington DC - L St.
Chicago, Dearborn
Chicago, Milwaukee
Austin, Barton Springs
Austin, Bluebonnet
San Francisco, Oak
Portland, Multnomah
Percent of Residents Stating “Safety Increased"
Walking
Driving
Bicycling
Source: Resident Surveys, Green Lane evaluation
44
Conclusions
• Evidence of increased bicycle volumes
– Within one year, mostly due to shifting routes
• Strong improved perception of safety for
people riding on the facilities
– May be improving experience for women
more than men
– Surveys of residents indicate that separation
may encourage more cycling
45

Conclusions
• Designs choices affect safety and comfort,
some worked better than others
– Clear demarcation of the merge entry point for
vehicles and the use of the “through bicycle
lane” performed best
– Use of signals effective (highest perception of
safety)
– Green markings good for communicating paths
– Designs with buffers with highest physical
separation preferred, though flexpost scored
high too
46
Conclusions
• Generally positive perceptions for other
road users
– More negative perceptions are specific to
certain streets
• Support for the protected lane concept
– Road users appear to recognize larger
benefits
47
Christopher M. MonserePortland State University
Questions?http://bit.ly/nitc_583
Thanks to support from:
National Institute for Transportation and Communities (NITC), a U.S.
Department of Transportation university transportation center, People for
Bikes (formerly Bikes Belong) and the Summit Foundation.
Thanks to City partners:
Mike Amsden (CDOT), David Smith (CDOT), Jim Sebastian (DDOT), Mike
Goodno (DDOT), Roger Geller (PBOT), Rob Burchfield (PBOT), Ross Swanson
(PBOT), Wendy Cawley (PBOT), Lindsay Walker (Lloyd District TMA), Seleta
Reynolds (SFMTA), Miriam Sorell (SFMTA), Annick Beaudet (Austin), Nathan
Wilkes (Austin), Aleksiina Chapman (Austin).
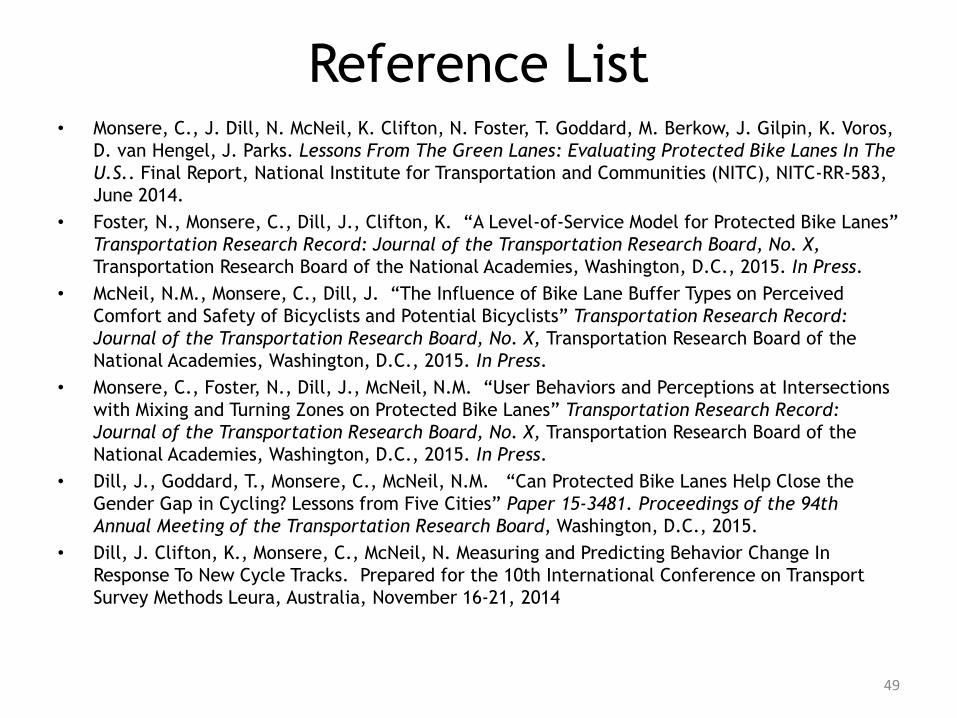
Reference List• Monsere, C., J. Dill, N. McNeil, K. Clifton, N. Foster, T. Goddard, M. Berkow, J. Gilpin, K. Voros,
D. van Hengel, J. Parks. Lessons From The Green Lanes: Evaluating Protected Bike Lanes In The
U.S.. Final Report, National Institute for Transportation and Communities (NITC), NITC-RR-583,
June 2014.
• Foster, N., Monsere, C., Dill, J., Clifton, K. “A Level-of-Service Model for Protected Bike Lanes”
Transportation Research Record: Journal of the Transportation Research Board, No. X,
Transportation Research Board of the National Academies, Washington, D.C., 2015. In Press.
• McNeil, N.M., Monsere, C., Dill, J. “The Influence of Bike Lane Buffer Types on Perceived
Comfort and Safety of Bicyclists and Potential Bicyclists” Transportation Research Record:
Journal of the Transportation Research Board, No. X, Transportation Research Board of the
National Academies, Washington, D.C., 2015. In Press.
• Monsere, C., Foster, N., Dill, J., McNeil, N.M. “User Behaviors and Perceptions at Intersections
with Mixing and Turning Zones on Protected Bike Lanes” Transportation Research Record:
Journal of the Transportation Research Board, No. X, Transportation Research Board of the
National Academies, Washington, D.C., 2015. In Press.
• Dill, J., Goddard, T., Monsere, C., McNeil, N.M. “Can Protected Bike Lanes Help Close the
Gender Gap in Cycling? Lessons from Five Cities” Paper 15-3481. Proceedings of the 94th
Annual Meeting of the Transportation Research Board, Washington, D.C., 2015.
• Dill, J. Clifton, K., Monsere, C., McNeil, N. Measuring and Predicting Behavior Change In
Response To New Cycle Tracks. Prepared for the 10th International Conference on Transport
Survey Methods Leura, Australia, November 16-21, 2014
49

BONUS SLIDES
50
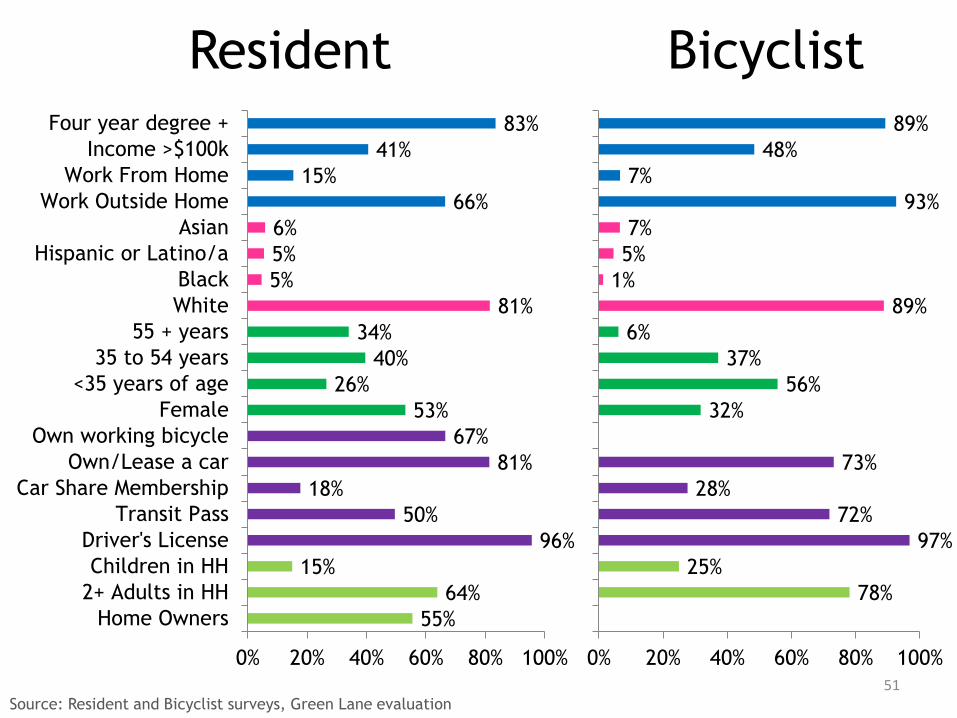
78%
25%
97%
72%
28%
73%
32%
56%
37%
6%
89%
1%
5%
7%
93%
7%
48%
89%
0% 20% 40% 60% 80% 100%
Home Owners
2+ Adults in HH
Children in HH
Driver's License
Transit Pass
Car Share Membership
Own/Lease a car
Own working bicycle
Female
<35 years of age
35 to 54 years
55 + years
White
Black
Hispanic or Latino/a
Asian
Work Outside Home
Work From Home
Income >$100k
Four year degree +
Resident Bicyclist
55%
64%
15%
96%
50%
18%
81%
67%
53%
26%
40%
34%
81%
5%
5%
6%
66%
15%
41%
83%
0% 20% 40% 60% 80% 100%
Home Owners
2+ Adults in HH
Children in HH
Driver's License
Transit Pass
Car Share Membership
Own/Lease a car
Own working bicycle
Female
<35 years of age
35 to 54 years
55 + years
White
Black
Hispanic or Latino/a
Asian
Work Outside Home
Work From Home
Income >$100k
Four year degree +
51Source: Resident and Bicyclist surveys, Green Lane evaluation
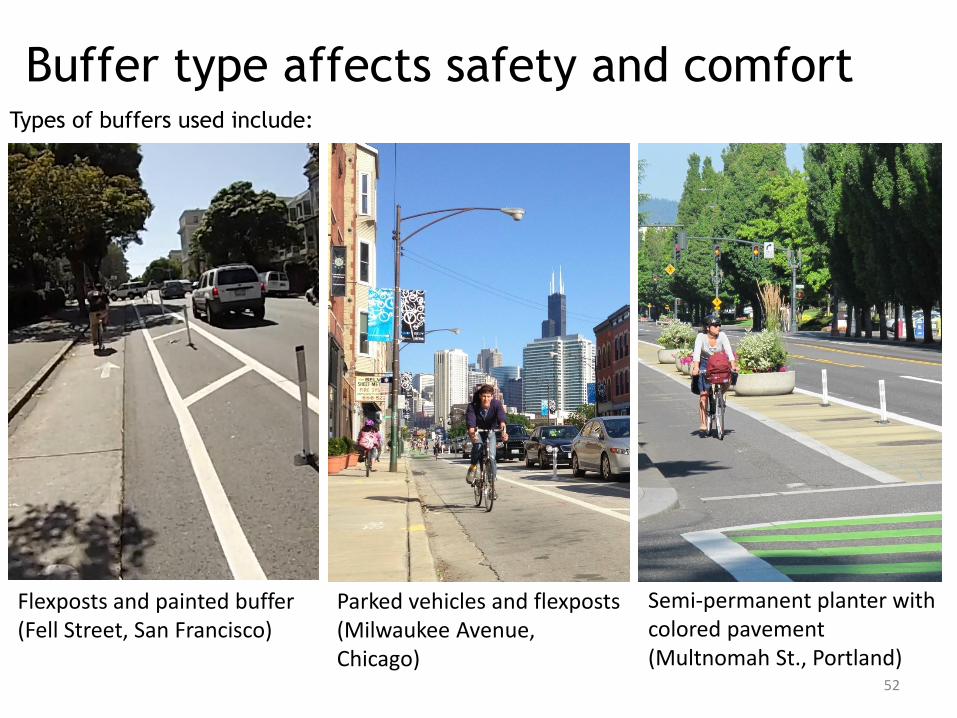
Types of buffers used include:
Buffer type affects safety and comfort
Semi-permanent planter with colored pavement(Multnomah St., Portland)
Parked vehicles and flexposts(Milwaukee Avenue, Chicago)
Flexposts and painted buffer(Fell Street, San Francisco)
52

53
Bicyclists: Mean Stated Comfort with Hypothetical Buffers
1
2
3
4
5
6
Solid painted buffer (5) Painted 2-3 foot buffer(3)
Painted buffer andparked cars (1)
Raised concrete curb(6)
2-3 foot buffer andplastic flexposts (2)
Planters separating thebikeway (4)
Austin Barton Springs Austin Rio Grande Chicago Dear. Chicago Milw.
Portland Mult. SF Oak / Fell Streets D.C. L Street

The buffer effectively separates bikes
from cars
54
Disagree, 14%
Somewhat Agree, 38%
Strongly Agree, 49%
Disagree, 5%
Somewhat Agree, 32%
Strongly Agree,
63%
Disagree, 12%
Somewhat Agree, 41%
Strongly Agree, 47%
Disagree, 29%
Somewhat Agree, 41%
Strongly Agree, 30%
"Strong and Fearless""Enthused and
Confident""Interested But
Concerned""No Way No How"
% Disagree
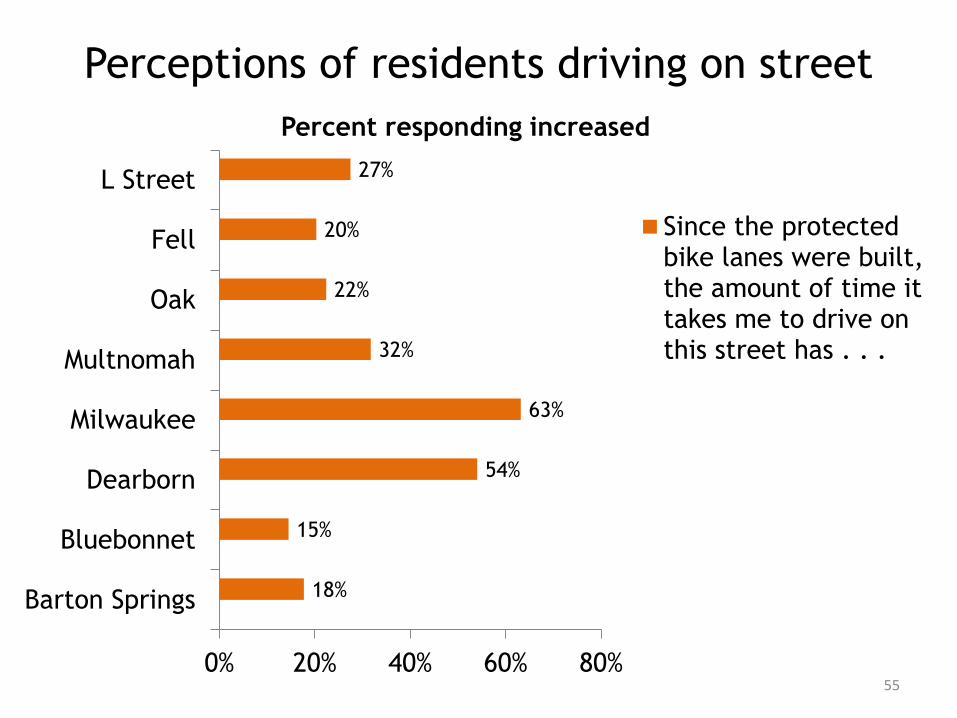
Perceptions of residents driving on street
Percent responding increased
55
18%
15%
54%
63%
32%
22%
20%
27%
0% 20% 40% 60% 80%
Barton Springs
Bluebonnet
Dearborn
Milwaukee
Multnomah
Oak
Fell
L Street
Since the protectedbike lanes were built,the amount of time ittakes me to drive onthis street has . . .
Since the protectedbike lanes were built,how safe andpredictable bicyclistsare acting has . . .
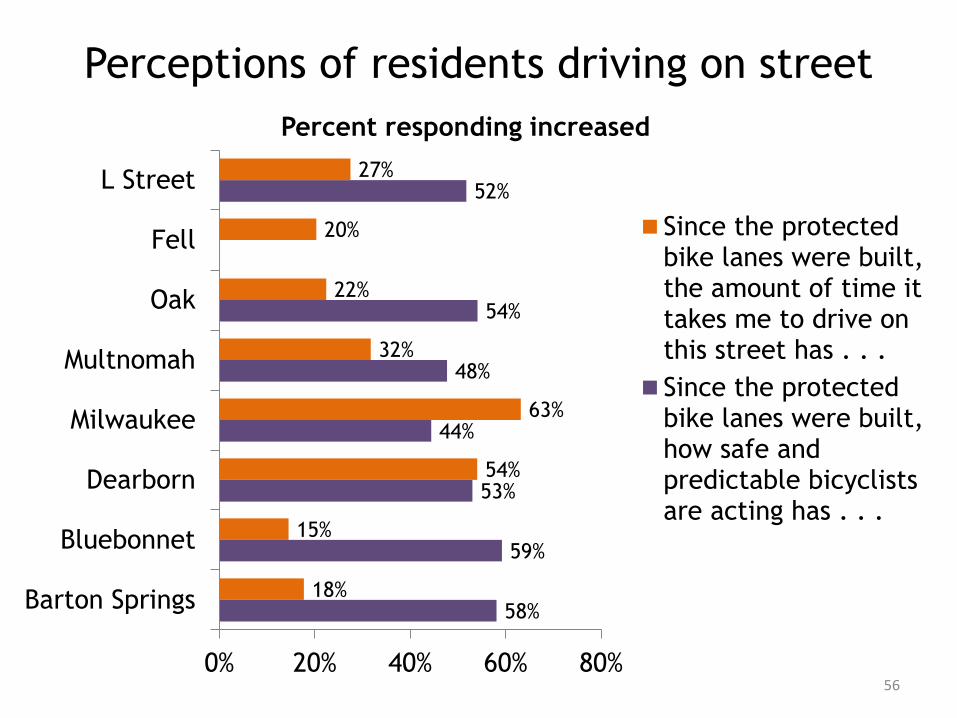
Perceptions of residents driving on street
Percent responding increased
56
58%
59%
53%
44%
48%
54%
52%
18%
15%
54%
63%
32%
22%
20%
27%
0% 20% 40% 60% 80%
Barton Springs
Bluebonnet
Dearborn
Milwaukee
Multnomah
Oak
Fell
L Street
Since the protectedbike lanes were built,the amount of time ittakes me to drive onthis street has . . .
Since the protectedbike lanes were built,how safe andpredictable bicyclistsare acting has . . .
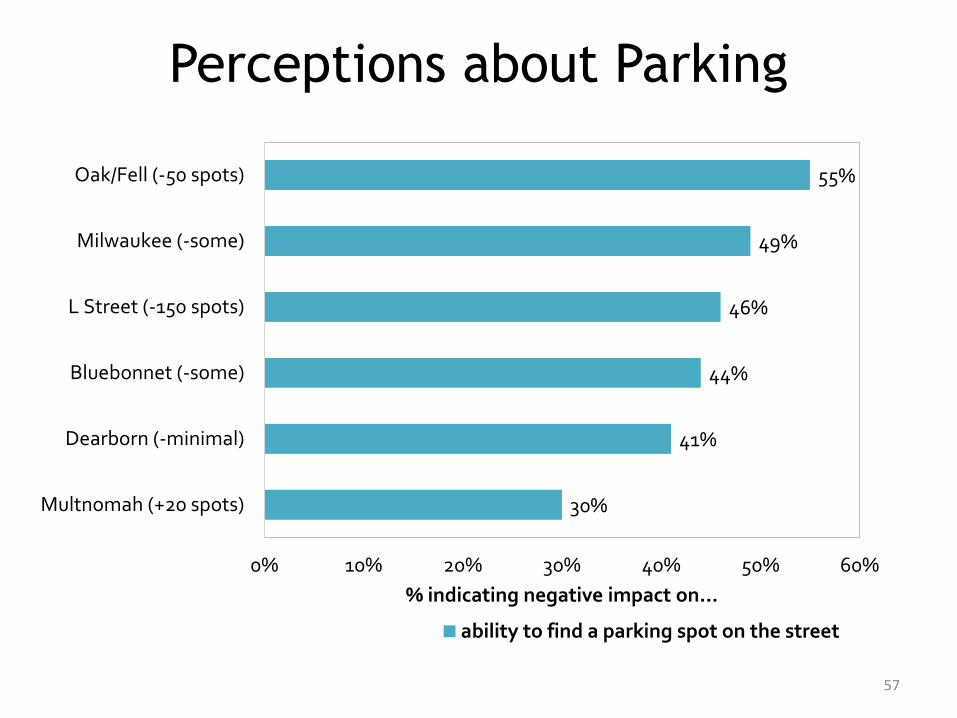
Perceptions about Parking
57
30%
41%
44%
46%
49%
55%
0% 10% 20% 30% 40% 50% 60%
Multnomah (+20 spots)
Dearborn (-minimal)
Bluebonnet (-some)
L Street (-150 spots)
Milwaukee (-some)
Oak/Fell (-50 spots)
% indicating negative impact on...
ability to find a parking spot on the street
Related Documents