EE 622 Term Paper A COMPETITIVE MARKET INTEGRATION MODEL FOR DISTRIBUTED GENERATION Prepared for Dr. Ibrahim El-Amin By Mohammad H. Al-Mubarak ID # 875328 26 January 2008

Welcome message from author
This document is posted to help you gain knowledge. Please leave a comment to let me know what you think about it! Share it to your friends and learn new things together.
Transcript

EE 622
Term Paper
A COMPETITIVE MARKET INTEGRATION MODEL
FOR DISTRIBUTED GENERATION
Prepared for
Dr. Ibrahim El-Amin
By
Mohammad H. Al-Mubarak ID # 875328
26 January 2008

2
Table of Contents
1 INTRODUCTION 4
2 WHAT IS DISTRIBUTED GENERATION (DG)? 4
3 PRESENT APPLICATIONS OF HVDC 5
4 TYPES AND APPLICATIONS OF DG 7
4.1 Present Power Production Situation . . . . . . . . . . . . . . . . . . . . . . . . . . . . . . . 7
4.2 Issues/Difficulties Associated with DG Integration . . . . . . . . . . . . . . . . . . . 10
4.2.1 Power Quality . . . . . . . . . . . . . . . . . . . . . . . . . . . . . . . . . . . . . . . . . . 11
4.2.2 Reactive Power Coordination . . . . . . . . . . . . . . . . . . . . . . . . . . . . . . 11
4.2.3 Reliability and Reserve Margin . . . . . . . . . . . . . . . . . . . . . . . . . . . . 12
4.2.4 Reliability and Network Redundancy . . . . . . . . . . . . . . . . . . . . . . . . 12
4.2.5 Safety . . . . . . . . . . . . . . . . . . . . . . . . . . . . . . . . . . . . . . . . . . . . . . . . 12
4.2.6 Accountability . . . . . . . . . . . . . . . . . . . . . . . . . . . . . . . . . . . . . . . . . . 12
4.2.7 Standards . . . . . . . . . . . . . . . . . . . . . . . . . . . . . . . . . . . . . . . . . . . . . . 13
5 PROPOSED MARKET INTEGRATION MODEL 13
5.1 Energy Market . . . . . . . . . . . . . . . . . . . . . . . . . . . . . . . . . . . . . . . . . . . . . . . . 13
5.2 Capacity Payments . . . . . . . . . . . . . . . . . . . . . . . . . . . . . . . . . . . . . . . . . . . . 17
5.2.1 Initial Power Calculation . . . . . . . . . . . . . . . . . . . . . . . . . . . . . . . . . 18
5.2.2 Preliminary Adequacy Power Calculation . . . . . . . . . . . . . . . . . . . . 18
5.2.3 Applicable Power Price . . . . . . . . . . . . . . . . . . . . . . . . . . . . . . . . . . 18
5.3 Energy Price Stabilization Mechanism . . . . . . . . . . . . . . . . . . . . . . . . . . . . . 19
3
6 APPLICATION EXAMPLE 19
6.1 Case Without DG . . . . . . . . . . . . . . . . . . . . . . . . . . . . . . . . . . . . . . . . . . . . . 20
6.2 Case With DG . . . . . . . . . . . . . . . . . . . . . . . . . . . . . . . . . . . . . . . . . . . . . . . . 21
6.3 Multiple DisCo Feeding Busbars . . . . . . . . . . . . . . . . . . . . . . . . . . . . . . . . . 24
7 CONCLUSION AND FUTURE WORK 24
REFERENCES 26
4
1. INTRODUCTION
High penetration of distributed generation (DG) resources into the distribution
networks is increasingly observed worldwide. The evolution of this penetration in
each country depends on the cost of traditional technologies, market design, and
promotion programs and subsidies. Nevertheless, with the acceleration of this trend,
higher levels of penetration will be achieved and, in turn, a competitive market
integration of DG will be needed for an adequate development of the power sector [1].
Distributed generation is suited for the integration of renewable energy sources.
Unfortunately, the additional integration of distributed generation has some negative
consequences for the organization of the electricity market in addition to some other
technical obstacles, such as dispatchability and reliability issues associated with the
integration of DG systems using renewable energy [2, 3].
This report discusses issues related to DG and presents the details of a proposed for
the competitive market integration of DG in a pool-based electrical system.
2. WHAT IS DISTRIBUTED GENERATION (DG)?
Due to variations in government regulations, different definitions for DC are used in
different countries, for example [4]:
• DG in Sweden is often defined as generation with up to 1,500 kW. But under
Swedish law, a wind farm with one hundred 1,500 kW wind turbines is still
considered DG, as the rating of each wind energy unit, and not the total wind
farm rating, is relevant for the Swedish law.
• In the English and Welsh power market, the term DG is mainly used for power
units with less than 100 MW capacity.

5
• In Australia, DG is often defined as power generation with a capacity of less
than 30MW.
• In New Zealand, DG is often considered generation of up to 5 MW.
For the purpose of this report, distributed generation may be defined as [4]:
“Distributed generation is an electric power source connected directly to
the distribution network or on the customer site of the meter”.
Alternatively, DG may be defined as [5]:
“Distributed generation, sometimes called embedded generation, is
electricity generation, which is connected to the distribution network
rather than the high voltage transmission network. It is typically smaller
generation such as renewable generation, including small hydro, wind
and solar power and smaller Combined Heat and Power”.
Figures 1 and 2 below illustrate the differences between a conventional distribution
network and a distribution network with DG [5].
3. TYPES AND APPLICATIONS OF DG
DG technologies may be categorized as renewable and nonrenewable. Renewable
technologies include [6]:
• solar, photovoltaic or thermal
• wind
• geothermal
• ocean.

6
Figure 1: Conventional Distribution Network
Figure 1: Distribution Network with Distributed Generation
7
Nonrenewable technologies include [6]:
• internal combustion engine, ice
• combined cycle
• combustion turbine
• microturbines
• fuel cell.
Distributed generation should not to be confused with renewable generation.
Distributed generation technologies may be renewable or not; in fact, some distributed
generation technologies could, if fully deployed, significantly contribute to present air
pollution problems [6].
Presently, there are three major application groups feasible for utility operated DG's.
First, it can avoid or defer distribution upgrades. Second, they can avoid or defer
substation upgrades. Third, they can avoid and defer major transmission upgrades [7].
4. EVOLUTION OF DG SYSTEMS
4.1 Present Power Production Situation
Since the beginning of the twentieth century, the backbone of the electric power
industry structure has been large utilities operating within well-defined geographical
territories and within local market monopolies under the scrutiny of various regulatory
bodies. Traditionally, these utilities own the generation, transmission, and distribution
facilities within their assigned service territories; they finance the construction of
these facilities and then incorporate the related capital costs in their rate structure
which is subsequently approved by the relevant regulatory bodies [6].
8
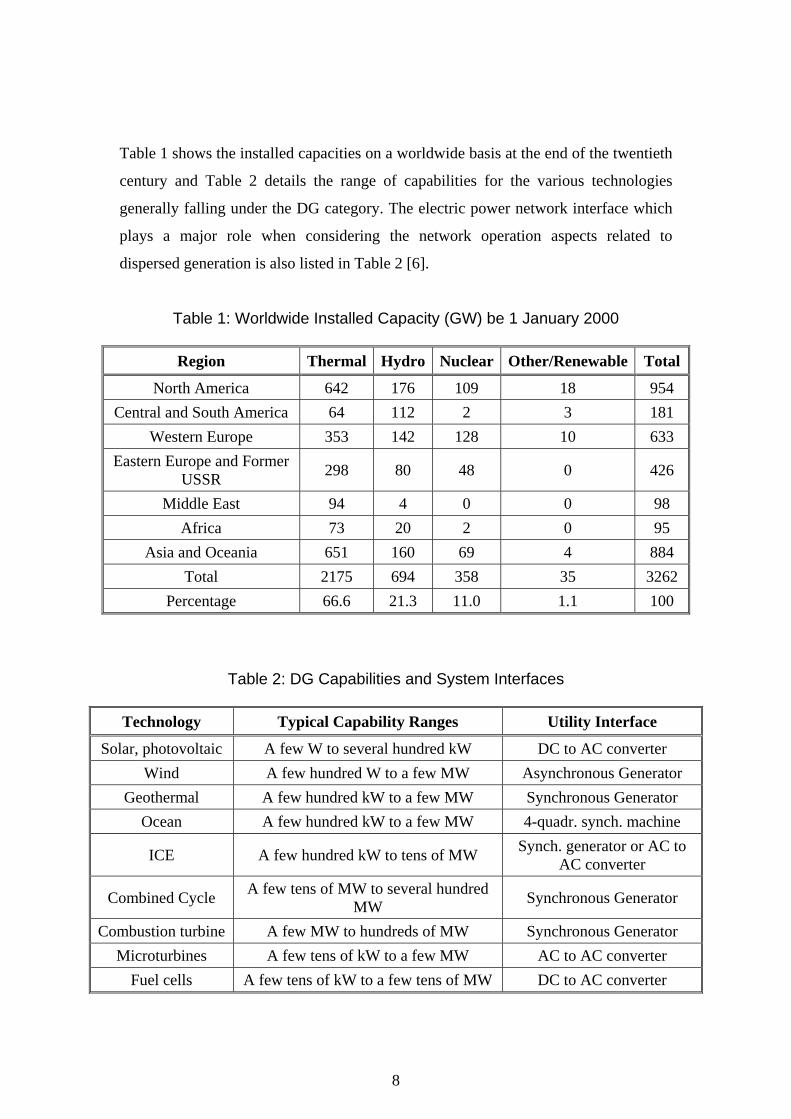
Table 1 shows the installed capacities on a worldwide basis at the end of the twentieth
century and Table 2 details the range of capabilities for the various technologies
generally falling under the DG category. The electric power network interface which
plays a major role when considering the network operation aspects related to
dispersed generation is also listed in Table 2 [6].
Table 1: Worldwide Installed Capacity (GW) be 1 January 2000
Region Thermal Hydro Nuclear Other/Renewable Total
North America 642 176 109 18 954 Central and South America 64 112 2 3 181
Western Europe 353 142 128 10 633 Eastern Europe and Former
USSR 298 80 48 0 426
Middle East 94 4 0 0 98 Africa 73 20 2 0 95
Asia and Oceania 651 160 69 4 884 Total 2175 694 358 35 3262
Percentage 66.6 21.3 11.0 1.1 100
Table 2: DG Capabilities and System Interfaces
Technology Typical Capability Ranges Utility Interface
Solar, photovoltaic A few W to several hundred kW DC to AC converter Wind A few hundred W to a few MW Asynchronous Generator
Geothermal A few hundred kW to a few MW Synchronous Generator Ocean A few hundred kW to a few MW 4-quadr. synch. machine
ICE A few hundred kW to tens of MW Synch. generator or AC to AC converter
Combined Cycle A few tens of MW to several hundred MW Synchronous Generator
Combustion turbine A few MW to hundreds of MW Synchronous Generator Microturbines A few tens of kW to a few MW AC to AC converter
Fuel cells A few tens of kW to a few tens of MW DC to AC converter

9
The installed wind power capacity in 2005 reached 59.1 GW at the global level, with
18.4 GW in Germany, 10 GW in Spain, and 9.1 GW in the USA [1].
Recently, DG is attracting a lot of attention and might become more important in the
future power generation system. For example, a study by the Electric Power Research
Institute (EPRI) indicates that by 2010, 25 % of the new generation will be
distributed. Also, a study by the Natural Gas Foundation concluded that this figure
could be as high as 30 % [4].
DG presently contributes about 3% of new generation capacity. It is estimated that in
the next few years distributed generation will make about 6% of the newly installed
generation capacity. DGs can not only compete for regional electricity market, as they
are at present, but also have potential to export its energy to other networks [3]. It is
expected that the DG share of worldwide annual capacity additions would be 40% by
2008 [1].
The evolution of DG systems in each country highly depends on the cost of traditional
technologies (diesel engines, coal fired, combined cycle, hydraulic, and nuclear power
plants) and market design concepts (pool, power exchange or physical bilateral-based
systems). A key aspect explaining this fast evolution is the development of promotion
programs, subsidies, and compensation mechanisms [1].
In the meantime, the power industry is experiencing major restructuring from a
traditional vertically-integrated structure to a horizontally-operated and competitive
wholesale market. Accordingly, the average cost based electricity price is
transforming into marginal cost or locational marginal pricing (LMP) based scheme.
Power deregulation has led to open transmission and DG systems; the latter has made
a strong impact on power system operation [3].
Growing DG technologies and improvements are providing cheaper generation to
customers of choice. Regulatory incentives and evolving environmental requirements

10
will enhance the use of DGs. DG will become a more common arbitrage tool
between local fuel (mostly natural gas) and electricity retail prices [7].
Future applications of DGs are expected to include [7]:
• Power firming
• Pool support
• Total energy systems power quality
• Peak shaving
• Others
DG technology will continue to improve and the costs of DG should reduce in the
future as a result of increased demand, improved technology, and better
manufacturing practices [7].
In recent years, wholesale power markets have shown extreme price swings and this
illustrates that much of the marketplace is functioning on market-based rather than
cost-based rates. DG controlled and dispatch for wholesale supply can show added
benefits above that of conventional central station units. DG can provide local
reliability for distribution outages, heat or steam for process use, reduced losses,
reduced distribution loads and power inside of transmission constraints. Thus,
customers can retain the benefits of their on-site DG and this DG can also be reflected
as regional supply [8].
DG's strategic value derives from flexibility. DG can be sized appropriately to match
the needs of specific customers. They can operate flexibly to capture the hour-to-hour
variation in energy prices. They can be sited almost anywhere to capture the market
value at key locations [7].
4.2 Issues/Difficulties Associated with DG Integration
DG technologies are most often connected to existing electric power delivery systems
at the distribution level. One of their significant benefits is that they are modular

11
enough to be conveniently integrated within electric distribution systems, thereby
relieving some of the necessity to invest in transmission system expansion. However,
significant penetration within existing electric distribution systems is not without a
new set of problems [6]. The following four key strategic issues relating to DG shall
be taken into account by any distribution company [9]:
1. How much distributed generation will appear in the distribution network?
2. What effect will the distributed generation have on the technical performance of
the network?
3. What effect will the distributed generation have on the financial performance of
the utility?
4. What changes in technical design or commercial practice will be effective within
a distribution utility distributed generation strategy?
Other key issues that must be addressed are detailed below [6].
4.2.1 Power Quality
Several of the DG technologies rely on some form of power electronic device in
conjunction with the distribution network interface, be it AC-to-AC or DC-to-DC
converters. All of these devices inject currents that are not perfectly sinusoidal. The
resulting harmonic distortion, if not properly contained and filtered, can bring serious
operational difficulties to the loads connected on the same distribution system [6].
4.2.2 Reactive Power Coordination
DG, implemented at the distribution level, i.e. close to the load, can bring significant
relief to the reactive coordination by providing close proximity reactive power support
at the distribution level, provided the proper network interface technology is used and
that proper system configuration has taken place. However, wind generation actually
contributes to worsen the reactive coordination problem. Most wind generators feature
asynchronous induction generators that are ideally suited to the variable speed

12
characteristics of wind machines but that must rely on the network to which they are
connected for reactive power support [6].
4.2.3 Reliability and Reserve Margin
Several DG technologies are such that their production levels depend on Mother
Nature (wind and solar) or are such that their availability is subject to the operational
priorities of their owners. Under a highly DG ownership scenario, assignment of
reserve margin maintenance increasingly will become a problem unless a market-
driven solution is put forward [6].
4.2.4 Reliability and Network Redundancy
Most electric distribution systems feature a radial network configuration as opposed to
the meshed structure adopted at transmission levels. As a result, network redundancy
becomes an issue when significant DG is connected directly to distribution system,
since single line outages could completely curtail the availability of generation
facilities [6].
4.2.5 Safety
Distribution system protection schemes typically are designed to rapidly isolate faults
occurring either at load locations or on the line itself. The assumption is that, if the
distribution line is disconnected somewhere between the fault and the feeding
substation, then repair work can safely proceed. Clearly, if DG is connected on the
same distribution feeder, then significantly more sophisticated protective relaying
schemes must be designed and implemented to properly protect not only the personnel
working on the lines but also the loads connected to them [6].
4.2.6 Accountability
A daunting problem is looming over the “brave new electric utility industry” in its
restructured configuration: Who will the customer call when the lights go out? The

13
local “wire company” might arguably answer, “my wires are just fine, thank you.”
The existence of local transmission company may not even be known by the end-user.
The power producer might arguably respond, “please refer your inquiry to your local
wire company, with which we have a service contract.” The resolution of this all-
important question is still very much open for debate [6].
4.2.7 Standards
Many utilities have very structured standards that make it difficult and expensive to
interconnect DG units [8]. The approval of IEEE Standard 1547 for Interconnecting
Distributed Resources with Electric Power Systems represents a major milestone in
the development of DG [10].
5. PROPOSED MARKET INTEGRATION MODEL
To design a proper market integration model for DG, it is necessary to consider its
participation in the energy and capacity exchanges among the power producers (PPs)
as an equivalent power producer (EPP) in the wholesale market [1].
5.1 Energy Market
A mechanism to establish an energy price for the DG injection could be based on an
extended model incorporating the DisCo network into the spot price computation. In
this approach, by using an economic dispatch model with network constraints, a spot
price at the distribution level (SPDG) can be calculated for the specific injection point
of the DG. Nevertheless, the implementation of such a methodology is not practical,
mainly because of the size of the network and the difficulties in accessing the
necessary data set from the DisCos [1].
A methodology to overcome these difficulties is proposed in this report, which is
based on approximations of the system modeling [1].
14
The computation of a SPDG implies the incorporation of a new delivery and injection
point into the wholesale market. Consequently, the DG sells energy at SPDG, while the
DisCo supplier buys the same amount of energy at the same price [1].
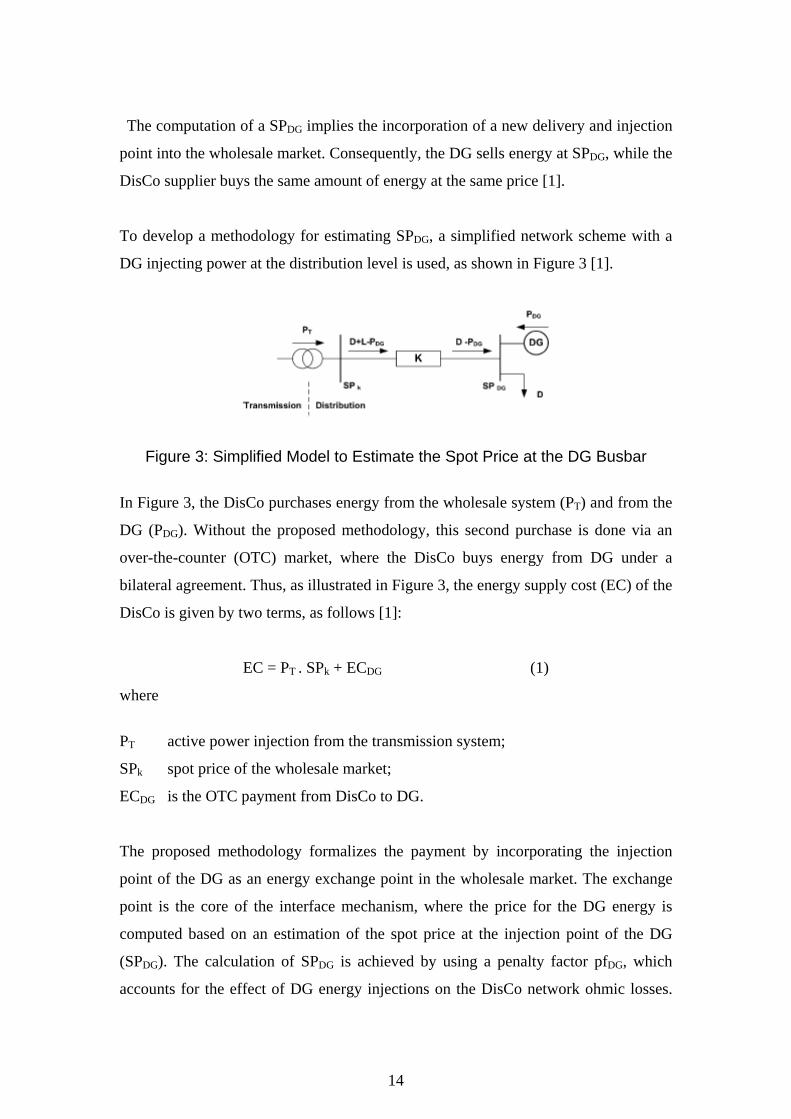
To develop a methodology for estimating SPDG, a simplified network scheme with a
DG injecting power at the distribution level is used, as shown in Figure 3 [1].
Figure 3: Simplified Model to Estimate the Spot Price at the DG Busbar
In Figure 3, the DisCo purchases energy from the wholesale system (PT) and from the
DG (PDG). Without the proposed methodology, this second purchase is done via an
over-the-counter (OTC) market, where the DisCo buys energy from DG under a
bilateral agreement. Thus, as illustrated in Figure 3, the energy supply cost (EC) of the
DisCo is given by two terms, as follows [1]:
EC = PT . SPk + ECDG (1)
where
PT active power injection from the transmission system;
SPk spot price of the wholesale market;
ECDG is the OTC payment from DisCo to DG.
The proposed methodology formalizes the payment by incorporating the injection
point of the DG as an energy exchange point in the wholesale market. The exchange
point is the core of the interface mechanism, where the price for the DG energy is
computed based on an estimation of the spot price at the injection point of the DG
(SPDG). The calculation of SPDG is achieved by using a penalty factor pfDG, which
accounts for the effect of DG energy injections on the DisCo network ohmic losses.

15
Consequently, under this interface concept, the energy cost for supplying the DisCo
is given by [1]
EC = PT + PDG . SPDG
EC = (D + L) . SPk + PDG . SPk (pfDG - 1) (2)
where D total net active power demand in the DisCo;
L total ohmic losses in the DisCo network;
PDG active power generated by the DG units inside the DisCo.
Under the interface concept, the DG busbar is directly incorporated into the wholesale
market. This approach allows the formal integration of DG into the wholesale market.
Also, when the interface is compared with the traditional OTC-based market, DG
injections and the penalty factor (pfDG) are the only additional information required.
The proposed interface concept can be extended to any distribution system with
multiple DG injections and multiple busbars connected to the transmission system. In
this general case, the energy balance in the DisCo system can be calculated from [1]
LDNN
PPPP DGT1k
kDG
1i
iT
DGT
+=+=+ ∑∑==
(3)
where NT total number of energy delivery points of the distribution system from the
transmission system;
NDG total number of DGs in the distribution system.
The DisCo losses, L, can be estimated with the following expression [1]:
2DG
2
1k
kDG )PD.(K
N.KL
DG
P −=⎟⎟
⎠
⎞
⎜⎜
⎝
⎛= ∑
=
(4)

16
The K factor used in (4) (see Figure 3) approximates an equivalent resistance of the
distribution network at medium voltage level. This factor can be estimated using the
average values ( )DGP,D,L of the involved variables at the same voltage level, based
on measurements or validated information used in tariff processes. Consequently, a
set of different K factors should be used, considering diverse load and supply
conditions. Thus, a specific factor can be calculated as [1]
2DG )PD(
LK−
≈ (5)
The estimation of the SP at the DG busbar, for a specific selected K factor, involves
the construction of the penalty factor (pfDG) as follows: replacing (4) in (3), yields
PT + PDG = D + K . (D - PDG)2 (6)
PT and PDG are known values, measured and registered by the market/system operator,
for example, in hourly steps. From (6) and (4), L can be calculated as a function of PT,
PDG and K. This can be achieved by solving the quadratic equation for the auxiliary
variable x = D - PDG in (6) and replacing the result in (4). Using (7), the associated
penalty factor pfDG is calculated as shown in (8)
)P.K.41P.K.21(K.21L TT +−+= (7)
T
T
DGP.K.41
PL1
1pf +=
∂∂
−= (8)
The resulting pfDG for each period can be used to calculate the SPDG using the SPk
defined at the wholesale level. Therefore, for a specific DGi, the spot price at the
injection point SPDGi is
SPDGi = SPk . pfDG (9)
17
The proposed market integration interface behaves in accordance with a marginal
cost pricing scheme, representing a compromise between accuracy and operability in
a real system. From (8), it can be observed that, in the normal case where PT > 0,
SPDGi is greater than SPk, reflecting the effect of DG injection on the system ohmic
loss reduction. On the other hand, for the counterflow (PT < 0), as expected, SPDGi <
SPk . Moreover, the calculated DG spot prices imply price signals for optimum
operation at both system and local levels [1].
5.2 Capacity Payments
In pool-based markets, a wide range of different schemes for capacity payment (CP)
was developed. The recognition of a CP for a DG must be consistent with the CP
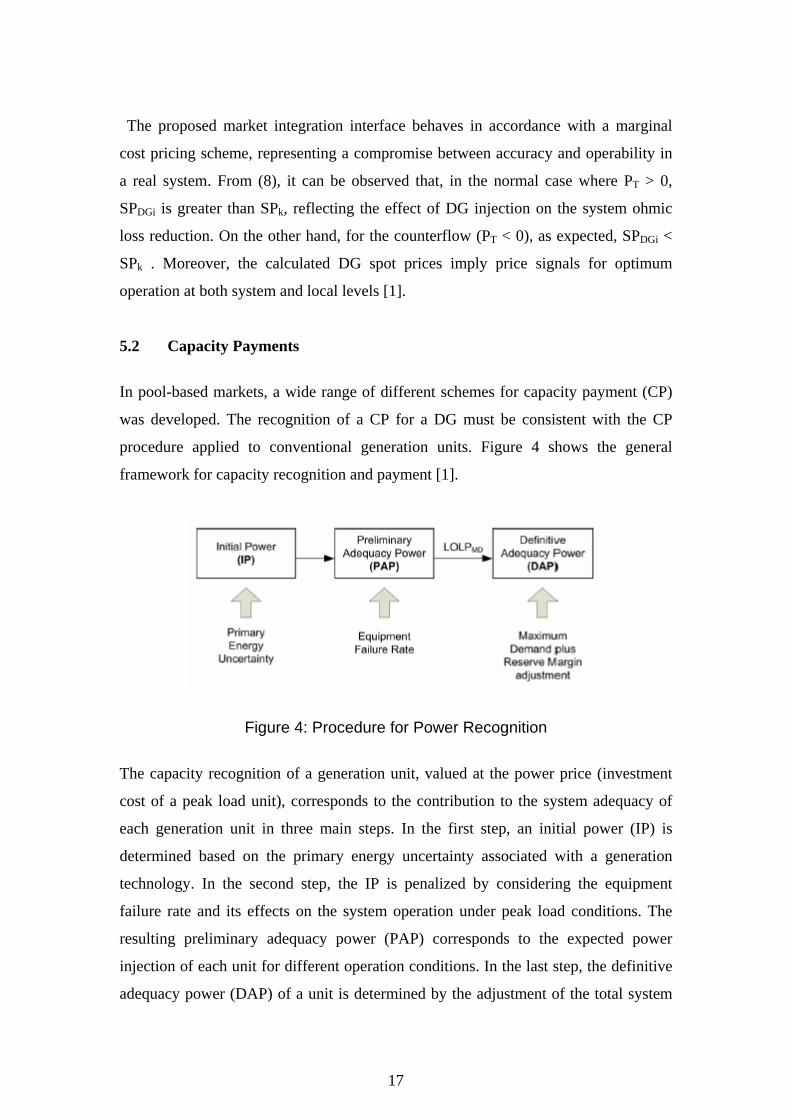
procedure applied to conventional generation units. Figure 4 shows the general
framework for capacity recognition and payment [1].
Figure 4: Procedure for Power Recognition
The capacity recognition of a generation unit, valued at the power price (investment
cost of a peak load unit), corresponds to the contribution to the system adequacy of
each generation unit in three main steps. In the first step, an initial power (IP) is
determined based on the primary energy uncertainty associated with a generation
technology. In the second step, the IP is penalized by considering the equipment
failure rate and its effects on the system operation under peak load conditions. The
resulting preliminary adequacy power (PAP) corresponds to the expected power
injection of each unit for different operation conditions. In the last step, the definitive
adequacy power (DAP) of a unit is determined by the adjustment of the total system
18
PAP with the system peak load, including a reserve margin defined by the regulator.
Some specific implementation aspects for DG are briefly discussed below [1].
5.2.1 Initial Power Calculation
The DG IP does not differ from its installed capacity for power plants with full
availability of primary energy. However, this is not the case of DG based on
renewable resources such as wind, sun radiation, and water. As mentioned before, for
DG units operating in a system with high hydro regulation capability, the uncertainty
of primary energy is modeled in the same way as conventional plants, such as run of
river hydro units. Thus, IP is determined as the average power injection, considering
the historical scarcity of the associated natural resource [1].
5.2.2 Preliminary Adequacy Power Calculation
The calculation of a DG PAP requires an estimation of the generation equipment
failure rate, which could be obtained using the following criteria [1].
• The forced outage rate (FOR) is calculated by the ISO every 2 years in
accordance with the DG operational statistics.
• International statistics or failure rates guaranteed by the equipment manufacturer
are used when the operational information is not available.
• In the case of DG arrays connected to the grid through one connection point, an
equivalent state distribution model based on each individual FOR must be
calculated.
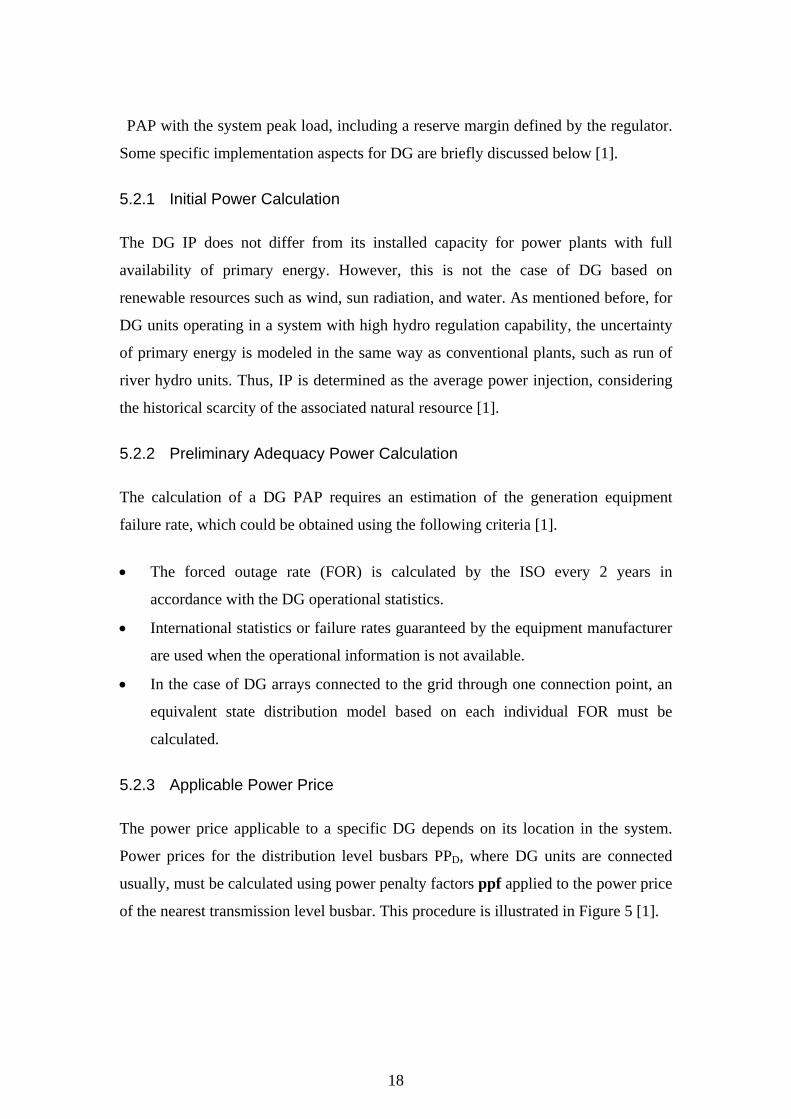
5.2.3 Applicable Power Price
The power price applicable to a specific DG depends on its location in the system.
Power prices for the distribution level busbars PPD, where DG units are connected
usually, must be calculated using power penalty factors ppf applied to the power price
of the nearest transmission level busbar. This procedure is illustrated in Figure 5 [1].
19
Figure 5: Power Price Formulation to DG Located in Distribution Networks
5.3 Energy Price Stabilization Mechanism
To promote the entry of a new generation of investors into the market, it is necessary
to reduce the risk perception of the projects. Usually, financial entities evaluate this
kind of project as a high-risk venture. To deal with this issue, the proposed market
integration model incorporates an energy price stabilization mechanism [1].
The proposed energy price stabilization mechanism is formulated as a time-based
average of the locational SP over a fixed time frame. This average price is known as
the energy nodal price [1].
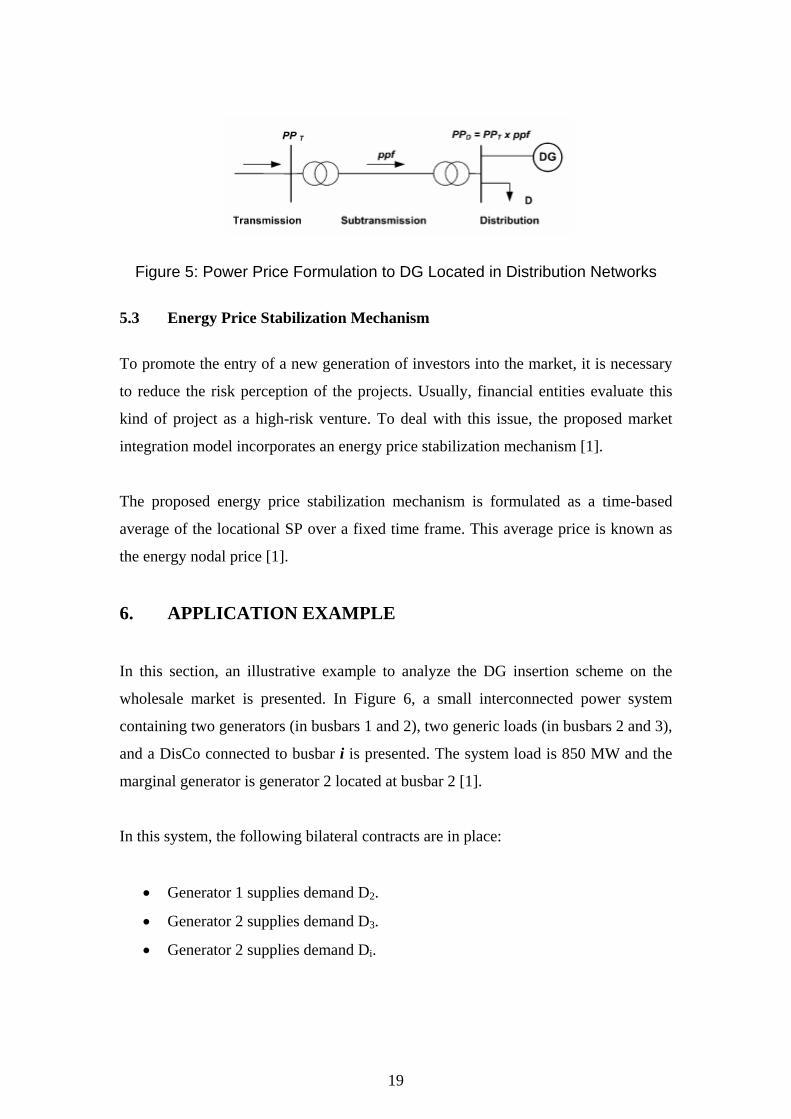
6. APPLICATION EXAMPLE
In this section, an illustrative example to analyze the DG insertion scheme on the
wholesale market is presented. In Figure 6, a small interconnected power system
containing two generators (in busbars 1 and 2), two generic loads (in busbars 2 and 3),
and a DisCo connected to busbar i is presented. The system load is 850 MW and the
marginal generator is generator 2 located at busbar 2 [1].
In this system, the following bilateral contracts are in place:
• Generator 1 supplies demand D2.
• Generator 2 supplies demand D3.
• Generator 2 supplies demand Di.
20
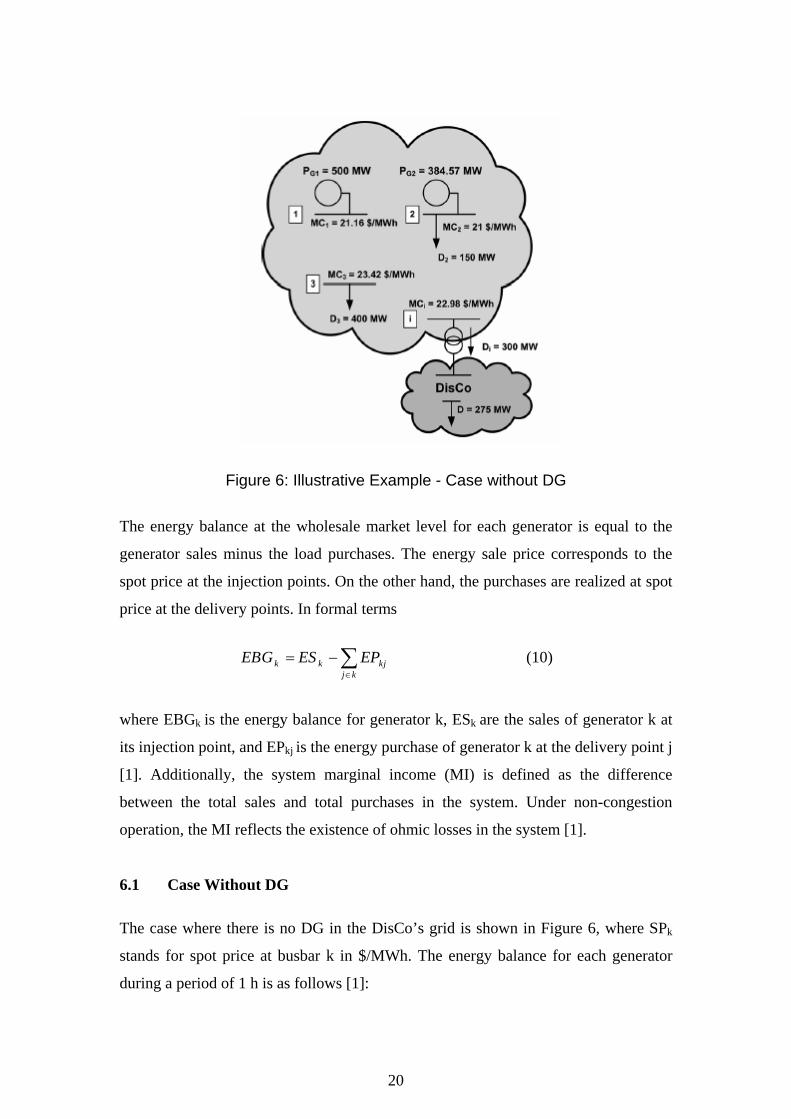
Figure 6: Illustrative Example - Case without DG
The energy balance at the wholesale market level for each generator is equal to the
generator sales minus the load purchases. The energy sale price corresponds to the
spot price at the injection points. On the other hand, the purchases are realized at spot
price at the delivery points. In formal terms
k k kj
j k
EBG ES EP∈
= −∑ (10)
where EBGk is the energy balance for generator k, ESk are the sales of generator k at
its injection point, and EPkj is the energy purchase of generator k at the delivery point j
[1]. Additionally, the system marginal income (MI) is defined as the difference
between the total sales and total purchases in the system. Under non-congestion
operation, the MI reflects the existence of ohmic losses in the system [1].
6.1 Case Without DG
The case where there is no DG in the DisCo’s grid is shown in Figure 6, where SPk
stands for spot price at busbar k in $/MWh. The energy balance for each generator
during a period of 1 h is as follows [1]:

21
Energy balance for generator 1
EBG1 = 500 * 21.16 – 400 * 23.42 = $1212
Energy balance for generator 2
EBG2 = 384.57 * 21 – 150 * 22.89 = $ - 1968
Marginal income
MI = $756
Total system losses without considering the DisCo
Losses = 34.57 MW (4.07% of system demand at wholesale level).
6.2 Case With DG
In this example, the effects of market integration of new DG units with a total
capacity of 10 MW inside the DisCo are analyzed. The analysis can be extended
directly to more than one DG unit. Thus, the demand Di is reduced to 288.16 MW,
while the net DisCo demand at the distribution level remains at 275 MW (Figure 7).
In the proposed market interface, the DG and its injection point are considered as part
of the wholesale market (expansion with dashed lines in Figure 7). It is also shown
that most busbar spot prices experience changes as compared with those in Figure 6
(case without DG). Also, G2 varies its dispatch to 371.64 MW, which represents a
decrease in generation of 2.93MW from the wholesale market point of view [1].
Considering the DisCo as a one-node system with a general loss function, for this
scenario, the K factor for the DisCo is calculated as follows [1]
422
23.16 3.3 10(275 10)( )DG
LK XD P
−≈ ≈ ≈−−
22
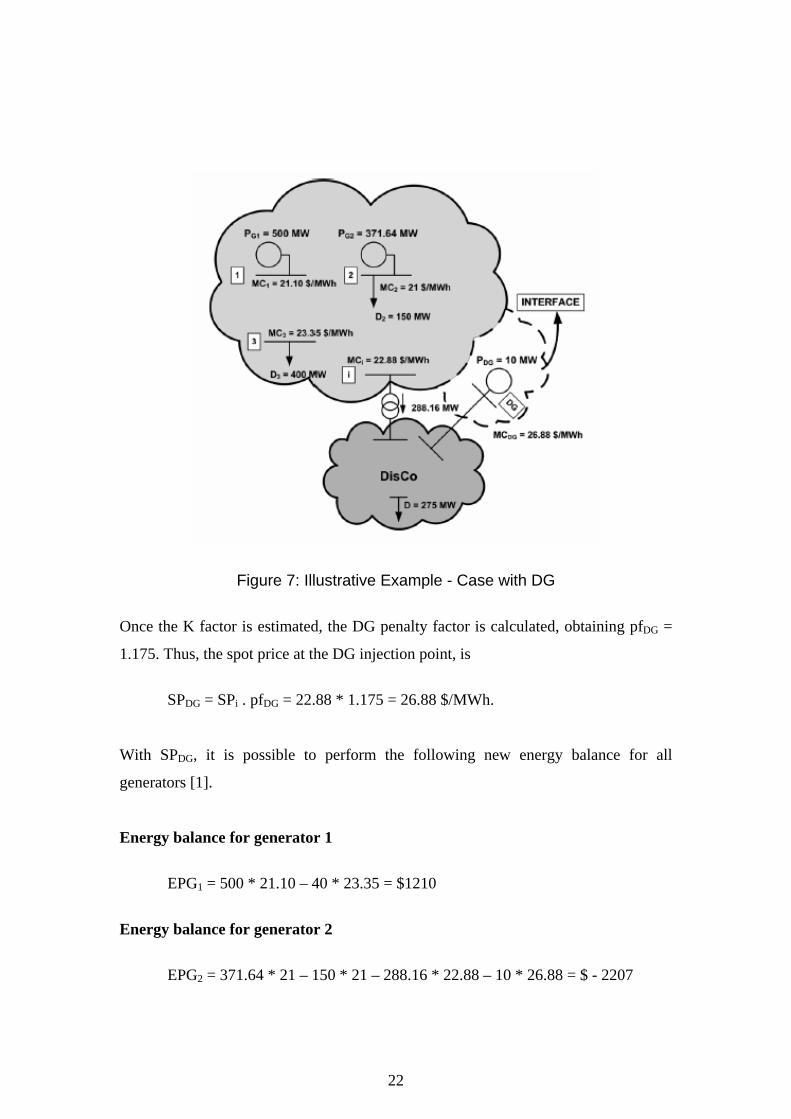
Figure 7: Illustrative Example - Case with DG
Once the K factor is estimated, the DG penalty factor is calculated, obtaining pfDG =
1.175. Thus, the spot price at the DG injection point, is
SPDG = SPi . pfDG = 22.88 * 1.175 = 26.88 $/MWh.
With SPDG, it is possible to perform the following new energy balance for all
generators [1].
Energy balance for generator 1
EPG1 = 500 * 21.10 – 40 * 23.35 = $1210
Energy balance for generator 2
EPG2 = 371.64 * 21 – 150 * 21 – 288.16 * 22.88 – 10 * 26.88 = $ - 2207
23
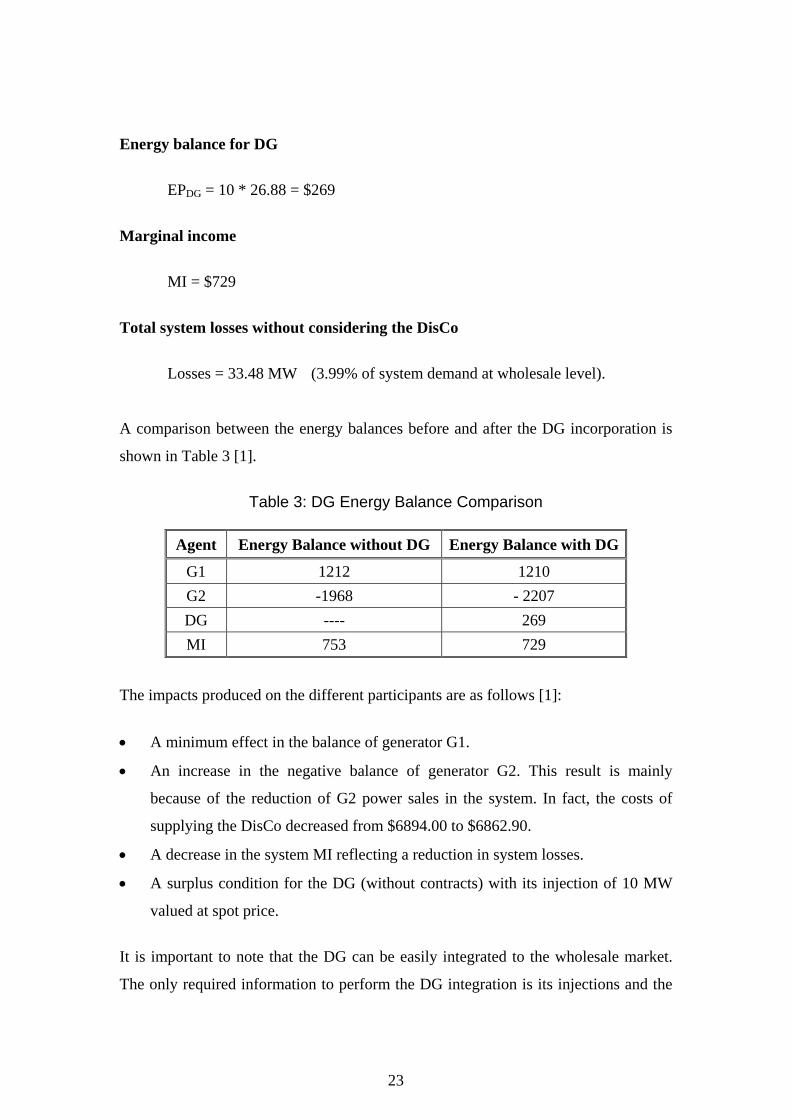
Energy balance for DG
EPDG = 10 * 26.88 = $269
Marginal income
MI = $729
Total system losses without considering the DisCo
Losses = 33.48 MW (3.99% of system demand at wholesale level).
A comparison between the energy balances before and after the DG incorporation is
shown in Table 3 [1].
Table 3: DG Energy Balance Comparison
Agent Energy Balance without DG Energy Balance with DG
G1 1212 1210 G2 -1968 - 2207 DG ---- 269 MI 753 729
The impacts produced on the different participants are as follows [1]:
• A minimum effect in the balance of generator G1.
• An increase in the negative balance of generator G2. This result is mainly
because of the reduction of G2 power sales in the system. In fact, the costs of
supplying the DisCo decreased from $6894.00 to $6862.90.
• A decrease in the system MI reflecting a reduction in system losses.
• A surplus condition for the DG (without contracts) with its injection of 10 MW
valued at spot price.
It is important to note that the DG can be easily integrated to the wholesale market.
The only required information to perform the DG integration is its injections and the

24
associated penalty factor (pfDG). This makes possible the treatment of the DG as an
EPP [1].
6.3 Multiple DisCo Feeding Busbars
In most cases, DisCos are supplied through multiple busbars. For instance, in Figure
8, three different busbars feeding the DisCo example under analysis are shown.
Figure 8: Multiple Supply Busbars
In this example, busbar i has been broken down into three busbars (iA, iB and iC). As
these busbars belong to the transmission system, each one of them has a different spot
price; there is a need to find a criterion to select the appropriate busbar for the DG
under study. The proposed criterion to identify SPik for a specific DG is based on the
minimal electrical distance under normal feeder operation of the DisCo network. It is
important to note that the proposed methodology refers each DGi to a unique SPk at
the wholesale level [1].
7. CONCLUSION AND FUTURE WORK
The use of DG can be a significant benefit to the competitive wholesale marketplace
which is prone to wide price swings due to limited supply and other factors. DG can
provide the price response needed - that of appearing to reduce load at high price
signals. This response will only be seen if the high wholesale price values can be

25
reflected to customers with DG. Sharing the benefits and revenues of these high
wholesale prices with DG will reduce the peak and volatility of prices and will
provide a more balanced response than today’s current supply only option [8].
The methodology proposed in this report is focused on OTC markets embedded in a
pool-based wholesale market structure. Nevertheless, based on the previous analysis,
its main concepts can be extended to markets based on physical bilateral contracts and
power exchanges (PBC/PE), similar to those in North America and Europe [1].
Future work in this field will be focused on the evaluation of calculation alternatives
of penalty factors at the distribution level and the development of specific market
interfaces for other market structures.
26
References
1. Jimenez-Estevez, G. A., Palma-Behnke, R., Torres-Avila, R. and Vargas, L. S., “A Competitive Market Integration Model for Distributed Generation”, IEEE Transactions on Power Systems, Volume 22, Issue 4, Nov. 2007, pp. 2161 – 2169.
2. Frunt, J., Kling, W.L., Myrzik, J. M. A., Nobel, F. A. and Klaar, D. A. M., “Effects of Further Integration of Distributed Generation on the Electricity Market”, Proceedings of the 41st International Universities Power Engineering Conference, 2006. UPEC '06, Volume 1, 6-8 Sept. 2006, pp. 1 – 5.
3. Xue Yaosuo, Chang Liuchen, and Meng Julian, “Dispatchable Distributed Generation Network - A New Concept to Advance DG Technologies”, IEEE Power Engineering Society General Meeting, 2007, 24-28 June 2007, pp. 1 – 5.
4. Ackermann, T., Andersson, G. and Soder, L., “Electricity Market Regulations and Their Impact on Distributed Generation”, Proceedings of the International Conference on Electric Utility Deregulation and Restructuring and Power Technologies, DRPT 2000, April 2000, pp. 608 – 613.
5. OFGEM Fact Sheet 15, “Distributed Generation: The Way Forward”, OFGEM webpage, www.ofgem.gov.uk, March 26, 2002.
6. Puttgen, H.B., MacGregor, P. R. and Lambert, F. C., “Distributed Generation: Semantic Hype or the Dawn of a New Era?”, IEEE Power and Energy Magazine, Volume 1, Issue 1, Jan-Feb 2003, pp. 22 – 29.
7. Engel, M. V., “Markets for Distributed Generation”, IEEE Power Engineering Society Summer Meeting, 2000, Volume 1, 16-20 July 2000, pp. 52 – 53.
8. Coles, L. and Beck, R.W., “Distributed Generation Can Provide an Appropriate Customer Price Response to Help Fix Wholesale Price Volatility”, IEEE Power Engineering Society Winter Meeting, 2001, Volume 1, 28 Jan.-1 Feb. 2001, pp. 141 - 143.
9. Ault, G. W., McDonald, J. R. and Burt, G. M., “Strategic Analysis Framework for Evaluating Distributed Generation and Utility Strategies”, IEE Proceedings - Generation, Transmission and Distribution, Volume 150, Issue 4, 14 July 2003, pp. 475 – 481.
10. IEEE 1547, “IEEE Standard for Interconnecting Distributed Resources with Electric Power Systems”, July 2003.
Related Documents