A Series of Reports on Quality Growth Investing jenseninvestment.com WHITE PAPER RETURN ON EQUITY: A COMPELLING CASE FOR INVESTORS Introduction At Jensen Investment Management, we believe that Return on Equity (ROE) is a very useful criterion for identifying companies that have the potential to provide attractive returns over long periods of time. Our experience and research suggest that our requirement of consistently high Return on Equity results in a universe of high-quality, profitable companies that are able to generate returns above their costs of capital in a variety of circumstances and economic environments. Further, we believe that this universe produces companies with sustainable competitive advantages, strong growth potential and stocks with a lower beta relative to broad market indices. This paper serves to illustrate the reasons why we use Return on Equity the way we do, and why we use it for the first step of our fundamental investment process. From the beginning, now more than twenty-five years ago, Return on Equity has been a key component of Jensen’s investment process. We start by annually selecting only those U.S. companies that have earned a Return on Equity of 15% or greater for the last ten consecutive years, as determined by Jensen’s Investment Committee. 1 From there, we narrow down this universe of high Return on Equity companies through fundamental research based on their growth potential, financial strength, competitive advantages and their lines of business. Finally, we seek to identify the undervalued securities – those that are the ‘best deals’ of the companies that we follow. We seek to invest only in quality growth businesses that we can reasonably understand, whose outlooks are favorable and that can be acquired at sensible prices. Our investments remain unless business fundamentals deteriorate below our strict standards, we identify a more compelling opportunity or the stocks become overpriced based on our metrics. This paper, however, is about Return on Equity, how we use it in the first step of our investment process and why we believe that it can be a very useful criterion for by Adam Calamar, CFA, Porfolio Manager 1 For example, this “universe” of companies developed by the Investment Committee may include companies with negative equity that have engaged in large debt-financed share repurchases. selecting stocks that can provide attractive returns over long periods of time. We will cover the basics of the calculation, why we use a time period of ten consecutive years, and why we use a threshold of 15% per year. Finally, we will examine the persistence of Return on Equity, as well as a few interesting characteristics of high-ROE companies. An Overview of Return on Equity Return on Equity effectively measures how much profit a company can generate on the equity capital investors have deployed in the business, and can be used over time to evaluate changes in a company’s financial situation. At Jensen, we calculate ROE as the company’s annual net income after taxes (excluding non-recurring items), divided by the average shareholder equity. Net Income is the amount of profit that a company has made after all expenses and taxes are deducted from revenues. Shareholder equity is the value that the owners of the company have invested that has not been paid out in dividends.

Welcome message from author
This document is posted to help you gain knowledge. Please leave a comment to let me know what you think about it! Share it to your friends and learn new things together.
Transcript

A Series of Reports on Quality Growth Investing jenseninvestment.comWHITE PAPER
RETURN ON EQUITY:A COMPELLING CASE FOR INVESTORS
Introduction
At Jensen Investment Management, we believe that Return on Equity (ROE) is a very useful criterion for identifying companies that have the potential to provide attractive returns over long periods of time. Our experience and research suggest that our requirement of consistently high Return on Equity results in a universe of high-quality, profitable companies that are able to generate returns above their costs of capital in a variety of circumstances and economic environments. Further, we believe that this universe produces companies with sustainable competitive advantages, strong growth potential and stocks with a lower beta relative to broad market indices. This paper serves to illustrate the reasons why we use Return on Equity the way we do, and why we use it for the first step of our fundamental investment process.
From the beginning, now more than twenty-five years ago, Return on Equity has been a key component of Jensen’s investment process. We start by annually selecting only those U.S. companies that have earned a Return on Equity of 15% or greater for the last ten consecutive years, as determined by Jensen’s Investment Committee.1 From there, we narrow down this universe of high Return on Equity companies through fundamental research based on their growth potential, financial strength, competitive advantages and their lines of business. Finally, we seek to identify the undervalued securities – those that are the ‘best deals’ of the companies that we follow.
We seek to invest only in quality growth businesses that we can reasonably understand, whose outlooks are favorable and that can be acquired at sensible prices. Our investments remain unless business fundamentals deteriorate below our strict standards, we identify a more compelling opportunity or the stocks become overpriced based on our metrics.
This paper, however, is about Return on Equity, how we use it in the first step of our investment process and why we believe that it can be a very useful criterion for
by Adam Calamar, CFA, Porfolio Manager
1 For example, this “universe” of companies developed by the Investment Committee may include companies with negative equity that have engaged in large debt-financed share repurchases.
selecting stocks that can provide attractive returns over long periods of time. We will cover the basics of the calculation, why we use a time period of ten consecutive years, and why we use a threshold of 15% per year. Finally, we will examine the persistence of Return on Equity, as well as a few interesting characteristics of high-ROE companies.
An Overview of Return on Equity
Return on Equity effectively measures how much profit a company can generate on the equity capital investors have deployed in the business, and can be used over time to evaluate changes in a company’s financial situation. At Jensen, we calculate ROE as the company’s annual net income after taxes (excluding non-recurring items), divided by the average shareholder equity. Net Income is the amount of profit that a company has made after all expenses and taxes are deducted from revenues. Shareholder equity is the value that the owners of the company have invested that has not been paid out in dividends.

2 Return on Equity: A Compelling Case For Investors
Simply put:
ROE =Net Income
=Revenues-Expenses-Taxes
Average Shareholder Equity Average Total Assets - Average Total Liabilities
In other words, Return on Equity indicates the amount of earnings generated by each dollar of equity. It can be a valuable insight into a company’s operations. In general, the higher the ROE the better, as high ROE companies, all other things being equal, will produce more earnings and free cash flow that can be used to support a higher level of growth, keep the company financially strong, and provide cash returns to shareholders.
This concept is shown in the following table (Figure 1) wherein Company A has an ROE of 20% and Company B has an ROE of 10%. Each has a dividend payout ratio of 30%:
As shown by the ending equity values in Figure 1 above, all else being equal, the intrinsic equity value of high Return on Equity companies grows at a faster rate than low ROE companies. Assuming that markets are relatively efficient over the long term and the market price of a company’s equity approximates the intrinsic value of a company’s equity, it can be argued that the price of the stock of a high ROE company should increase at a faster rate than the price of the stock of a low ROE company. Furthermore, over long periods of time, the compounding effect of high ROE enables the company to sustain a higher level of growth without taking on debt or issuing additional stock and provides excess cash that can be used to reward shareholders through dividends and share repurchases.
Figure 2
Figure 1: The Link Between High ROE and Instrinsic Value*
Time Period (years) Item
Company A Value ($)
Company A Change (%)
Company B Value ($)
Company B Change (%)
0Initial equity investmentNet incomeAbsolute reinvestment**
$100.0020.0014.00
$100.0010.007.00
1Ending equity valueNet incomeAbsolute reinvestment
114.0022.8015.96
14% 107.0010.707.49
7%
2Ending equity valueNet incomeAbsolute reinvestment
129.9625.9918.19
14% 114.4911.458.01
7%
3 Ending equity value $148.15 14% $122.50 7%
* This is a hypothetical, simplified example (based on beginning of year equity) and is for illustration purposes only. These figures are not indicative of the actual returns likely to be achieved by an investor.** The absolute reinvestment is the hypothetical percentage of net income that is retained after the 30% dividend payout; in this example, 70% of net income is retained and reinvested.

3Return on Equity: A Compelling Case For Investors
The Components of Return on Equity
To understand what drives a company’s Return on Equity, it is possible to break down ROE into several parts, deconstructing the ratio of Net Income to Shareholder Equity into other ratios to evaluate how each affects the company’s total ROE. While this kind of analysis is not a specific part of the first stage of Jensen’s investment process, it illustrates how ROE works alongside some of the other measures that we study when performing further due diligence on a company.
As an example, Return on Equity can be broken into two fractions: Return on Assets and the Leverage Ratio. Those two fractions can then be multiplied together to calculate total ROE, as shown below:
ROE = Return on Equity = Return on Assets * Leverage Ratio
ROE =Net Income
=Net Income
*Average Total Assets
Average Shareholder Equity Average Total Assets Average Shareholder Equity
This simple analysis shows that a company can make an impact on its ROE by increasing its Return on Assets (ROA) or by increasing its Leverage Ratio.
However, this example is incomplete as Return on Assets can be further broken down into its own components. This segmentation of Return on Equity is often called DuPont Analysis because it was originally developed by the DuPont Corporation in the 1920s. We can view this analysis as a pyramid (Figure 2) where the fractions in each level are multiplied together to determine the company’s total ROE.
Figure 2: DuPont Analysis ROE Breakdown Diagram2
2 EBT = Earnings Before Tax (Net Income + Tax Expense), EBIT = Earnings Before Interest and Tax (Net Income + Interest Expense + Tax Expense).
Return on Equity
ROE= Net Income/Average Shareholder Equity
Leverage Ratio
Leverage = Average Total Assets/Average Shareholder Equity
Return on Assets
ROA = Net Income/Average Total Assets
Leverage Ratio (indebtedness)
Leverage = Average Total Assets/Average Shareholder Equity
Total Asset Turnover (efficiency)
NPM = Net Income/Revenues
Net Profit Margin (NPM) (profitability)
NPM = Net Income/Revenues
Leverage Ratio
Leverage = Average Total Assets/Average Shareholder Equity
Total Asset Turnover
NPM = Net Income/Revenues
EBIT Margin (EM)
EM = EBIT/Revenues
Interest Burden (IB)
IB = EBT/EBIT
Tax Burden (TB)
TB = Net Income/EBT

4 Return on Equity: A Compelling Case For Investors
Keeping in mind the DuPont Analysis pyramid in Figure 2 above, it becomes clear that there are many aspects of a company that can impact its Return on Equity. In general, investors would prefer a higher ROE to a lower one and a stable ROE to a volatile one, but it is also important to pay attention to the way a company’s business model, operations, and financial decisions can impact ROE. If a company’s ROE changes, the cause of this change must be examined in detail to determine the reason for the change. Examining ROE alone will not always answer the question.
Consequently, we recognize that there can be disadvantages to relying on Return on Equity alone. ROE may be volatile due to the business’s normal sales cycles, or ROE may be lower or higher depending on the general profitability of the industry in which the company operates. A company may have an inflated ROE because of a very small value of book equity on its balance sheet, perhaps due to rapid growth or because the company has made large share repurchases. Likewise, the company may have taken on a large debt burden, increasing its leverage and potentially increasing ROE without increasing profitability or efficiency.
At Jensen, we have generally found these types of companies to be less likely to pass our requirement of ten years of consecutive Return on Equity performance. Any that do manage this feat are carefully evaluated during the later stages of our investment process. Altogether, these issues further drive home the point that while ROE is valuable and plays in important role in the first step of our fundamental investment process, it should not be used as a standalone metric for investment decision-making.
The Importance of Consistency
Some of the early research on companies with consistent Return on Equity performance was conducted by Professor William E. Fruhan, Jr., of the Harvard University Graduate School of Business Administration. In 1979 he published Financial Strategy: Studies in the Creation, Transfer, and Destruction of Shareholder Value, where he focused on methods for identifying firms that continually enhanced shareholder wealth and how management decisions affected shareholders.
As Fruhan noted in his work, the main reason why a high Return on Equity is desirable is that if a company is truly generating profits at a rate that is in excess of its Cost of Equity capital, then it is creating value for its shareholders.3 A company’s Cost of Equity capital is an estimate of the return a shareholder expects from an equity security, similar to the way a company’s cost of debt is the return a bondholder expects from a debt security.
Unfortunately, a company with a volatile Return on Equity may be earning returns above its cost of capital in one year, but may not do so the next, effectively wiping out any gains it had made relative to its Cost of Equity (COE).
For example:
• If a company generates an ROE of 15% one year and then 5% the next, its compound ROE over the two years is (1.15)*(1.05)-1 =20.75%.
• If its COE is 12% per year, then the compounded COE is (1.12)* (1.12)-1=25.44%.
Using this template, it is easy to imagine a case where a company may be profitable (ROE greater than zero), but may
“In general, investors would prefer a higher ROE to a
lower one and a stable ROE to a volatile one, but it is also important to pay attention to
the way a company’s business model, operations, and financial
decisions can impact ROE.”
3 ROE is a useful measure of this profitability since, as equity shareholders, we are concerned with the amount of money the company is earning relative to the value of the equity that has been invested in the business. It is important to remember, of course, that we are buying shares in the secondary market, so the book value of equity used for the ROE calculation may have been skewed since the shares were issued, and that ROE is not a proxy for an investor’s actual return. This is one of the reasons why fundamental research and an examination of the factors that affect each company’s ROE is an important part of our investment process.

5Return on Equity: A Compelling Case For Investors
fail to meet shareholder expectations in the long run. Investors must distinguish those firms that have the potential to consistently generate ROE at rates that are higher than its Cost of Equity; otherwise investors may end up with the opposite case in the long run.
Fruhan highlighted the importance of consistency in his research, noting that the firms with the highest economic values are those that have successively increasing rates of Return on Equity, those that maintain the longest periods of high rates of ROE, and those that possess rapidly growing reinvestment prospects. As an example of the power of consistent ROE performance, he selected a period of ten consecutive years at 15% ROE for a screen that would allow him to easily identify firms that had, with some certainty, the strong, consistent profitability that he was searching for.
We believe Fruhan’s choice of ten consecutive years at 15% Return on Equity was insightful. After completing our own research, it became one of the cornerstones of our investment strategy at Jensen Investment Management. Over the years, Jensen has continually monitored and researched this high
ROE universe of companies and its characteristics, which we have written about many times in the past. In this paper, there are three aspects of our ROE requirement that we will revisit in turn: the requirement of ten years, the requirement that the years be consecutive, and the requirement that for each year the ROE be equal to or greater than 15%.
Our Requirement of Ten Years of Return on Equity Performance
From a conceptual standpoint, there is a simple tradeoff regarding the number of years that one requires of consistent Return on Equity performance. For example, three years of high ROE is going to be a relatively easy bar for many companies to meet. On the other hand a longer time period, such as twenty years, would require a longer track record of consistent business performance and would result in far fewer companies making the cut.
Besides simply affecting the number of companies that meet the screen, the number of years selected for the screen can
impact the results in many other ways. For example, if companies are selected that have achieved a particular minimum Return on Equity for five consecutive years, and those five years happen to be 2003 through 2007 (a period of solid U.S. economic growth), the results will show a very different group of companies than if the years are 2008 through 2012 (a period of sub-par U.S. economic growth, including a severe financial crisis and recession). As an example, Figure 3 details the differences in economic sector distribution of the companies in these two groups:
0%
5%
10%
15%
20%
25%
5 years of 15% ROE ended 2007 5 years of 15% ROE ended 2012
Figure 3: Market Cap-Weighted Sector Distribution of Companies That Meet a Screen for Five Consecutive Years of 15% ROE, Measured at the End of 2007 and the End of 2012
Source: Thomson-Reuters

6 Return on Equity: A Compelling Case For Investors
Naturally, if an investor adopted a strategy of selecting companies with five years of 15% Return on Equity each year, there could potentially be wide swings in the portfolio’s characteristics over time. This is a facet of the problem of sampling bias; in this case, the time period selected can have a significant impact upon the results of a study. The only effective way to mitigate this problem would be to increase the sample size – in this case, increase the number of years that we examine so as to include a wider variety of economic environments. This makes the case for requiring a very large number of years of consistent performance.
On the other hand, an exceptionally long time period would create its own issues. Such a lengthy period may test the limits of the financial databases used for screening securities and increase the likelihood that missing data or errors would artificially exclude a company from the results.
Furthermore, as the number of years of required ROE increases, companies that only recently became publicly traded must build a longer track record of audited financial data before they will meet the requirements of the screen.4
Finally, selecting too long of a period can also result in the time period encompassing shifts in the data set or macroeconomic environment that materially affect the results. For example, if there is a major change in accounting regulations halfway through a 20-year period, the companies that pass the test in the first decade may not pass it in the next (and vice versa).
Ultimately, a time period is needed that encompasses a variety of economic environments, but also balances the limitations that come with excessively long time periods. If the view is taken that a normal fixed investment cycle (or “business cycle”) tends to occur every seven to eleven years, then a 10-year period should typically include economic expansions and contractions, as well as the other economic fluctuations that are associated with such a cycle. That 10-year time frame would demonstrate a company’s ability to maintain a high level of performance throughout changes in the economic climate. Not all companies will be able to do this. An example of how the broader market’s median Return on Equity can fluctuate with economic cycles is graphed below in Figure 4. For this reason, as well as in consideration of the trade-offs noted above and the results of our own research, Jensen chose a 10-year period of ROE for our investment process.
4 While companies present audited financial data in their IPO documents, it typically comprises only the most recent three to five years.5 ROE is the trailing one-year median from a financial database that includes all securities listed on the New York Stock Exchange (NYSE), American Stock Exchange (AMEX), and NASDAQ Stock Market (NASDAQ), measured at quarterly intervals from 6/30/1984 through 12/31/2015. Gross Domestic Product year-over-year percent change data sourced from the U.S. Department of Commerce, Bureau of Economic Analysis.
0%
2%
4%
6%
8%
10%
12%
-15%
-10%
-5%
0%
5%
10%
15%
1985 1990 1995 2000 2005 2010 2015
Med
ian
Retu
rn o
n Eq
uity
Year
-ove
r-ye
ar p
erce
nt ch
ange
GDP y/y ROE %
Figure 4: The Normal Fixed Investment Cycle and Gross Domestic Product in the United States (Left Axis) Versus Broad Market Trailing Twelve Months Return on Equity (Right Axis)5
Source: Thomson-Reuters, U.S. Department of Commerce
7Return on Equity: A Compelling Case For Investors
Our Requirement of Consecutive Years of Return on Equity Performance
Another aspect of our requirement for high Return on Equity companies is that there must be 10 consecutive years of ROE above 15%. It is easy to imagine a screen that did not require consecutiveness -- for example, an ROE greater than 15% for five years out of the last 10, or an average ROE in excess of a particular number. Naturally, the side effect of this decision would be to include companies with more volatile profitability, perhaps due to economic factors or company-specific circumstances.
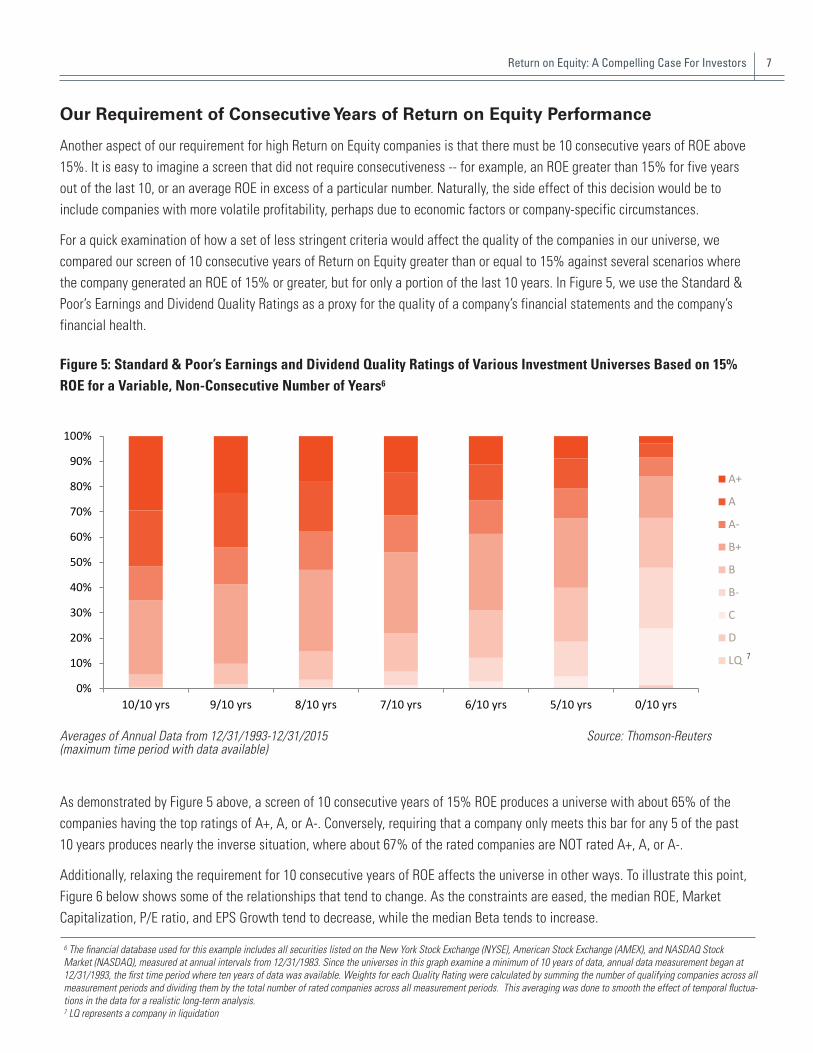
For a quick examination of how a set of less stringent criteria would affect the quality of the companies in our universe, we compared our screen of 10 consecutive years of Return on Equity greater than or equal to 15% against several scenarios where the company generated an ROE of 15% or greater, but for only a portion of the last 10 years. In Figure 5, we use the Standard & Poor’s Earnings and Dividend Quality Ratings as a proxy for the quality of a company’s financial statements and the company’s financial health.
Figure 5: Standard & Poor’s Earnings and Dividend Quality Ratings of Various Investment Universes Based on 15% ROE for a Variable, Non-Consecutive Number of Years6
Averages of Annual Data from 12/31/1993-12/31/2015 Source: Thomson-Reuters(maximum time period with data available)
As demonstrated by Figure 5 above, a screen of 10 consecutive years of 15% ROE produces a universe with about 65% of the companies having the top ratings of A+, A, or A-. Conversely, requiring that a company only meets this bar for any 5 of the past 10 years produces nearly the inverse situation, where about 67% of the rated companies are NOT rated A+, A, or A-.
Additionally, relaxing the requirement for 10 consecutive years of ROE affects the universe in other ways. To illustrate this point, Figure 6 below shows some of the relationships that tend to change. As the constraints are eased, the median ROE, Market Capitalization, P/E ratio, and EPS Growth tend to decrease, while the median Beta tends to increase.
6 The financial database used for this example includes all securities listed on the New York Stock Exchange (NYSE), American Stock Exchange (AMEX), and NASDAQ Stock Market (NASDAQ), measured at annual intervals from 12/31/1983. Since the universes in this graph examine a minimum of 10 years of data, annual data measurement began at 12/31/1993, the first time period where ten years of data was available. Weights for each Quality Rating were calculated by summing the number of qualifying companies across all measurement periods and dividing them by the total number of rated companies across all measurement periods. This averaging was done to smooth the effect of temporal fluctua-tions in the data for a realistic long-term analysis.7 LQ represents a company in liquidation
0%
10%
20%
30%
40%
50%
60%
70%
80%
90%
100%
10/10 yrs 9/10 yrs 8/10 yrs 7/10 yrs 6/10 yrs 5/10 yrs 0/10 yrs
A+
A
A-
B+
B
B-
C
D
LQ 7

8 Return on Equity: A Compelling Case For Investors
Overall, it appears that relaxing the consecutiveness requirement could lead to a lower-quality universe of companies from which to choose, in terms of S&P Quality Ratings, profitability (as measured by ROE) and volatility (as measured by Beta). Furthermore, such a decision could introduce new companies which may be profitable in most economic environments, but may have devastatingly poor results under certain circumstances, or management decision-making that leads to poor profitability. In consideration of these issues, and after performing our own research, Jensen chose this requirement of continuous, consistent business performance. We believe that it increases the likelihood that a company will continue to perform well in a variety of economic environments and situations and effectively disallows many companies with volatile earnings.
Our Requirement of Fifteen Percent Return on Equity Performance
Besides our requirement of 10 consecutive years, we also require a Return on Equity of 15% or greater for each of those
years, as determined by Jensen’s Investment Committee. As discussed earlier, to evaluate this threshold of 15% we must compare a company’s ROE to the company’s Cost of Equity.
As equity shareholders, we require a return on our investment and this return is typically received as a mix of dividend payments and capital appreciation. The total amount would be the return that a shareholder expects from the security.9 Basic financial theory tells us that if an investor is risk-averse and wishes to be compensated for taking risk, then that investor will demand a higher return from a more risky investment. Therefore, not all companies will have the same expected return (a.k.a. Cost of Equity) because they have varying levels of risk. But how do we know that a company is generating returns in excess of its Cost of Equity, since the Cost of Equity for each company may be different?
There are several different approaches to answering this question. One method is to attempt to determine each company’s Cost of Equity separately with one of the many versions of the Capital Asset Pricing Model, or with an alternative method, such as one of the various fundamental, economic or statistical multi-factor models. While these methods can be useful for a specific company, they become
8 The financial database and methodology used for this example is the same as that for the preceding graph shown in Figure 5, as described in footnote 6. Medians were taken of all qualifying companies in each screen for all measurement periods.9 Of course, actual returns (dividends + capital appreciation) may be higher or lower than hypothetical expected returns.
Figure 6: Example of Characteristics That Change as Consecutiveness Constraint is Eased8
Time PeriodMedian Return on
EquityMedian Market Cap
($-million)Median Adjusted Trailing P/E Ratio
Median Trailing 1-year EPS Growth
Median Beta vs. S&P 500 Index
10/10 years 25.58 5,158 18.68 11.47 0.65
9/10 years 23.15 4,353 18.45 11.67 0.70
8/10 years 21.69 3,479 18.26 11.49 0.75
7/10 years 20.25 2,661 18.00 11.23 0.78
6/10 years 19.14 1,959 17.66 11.23 0.81
5/10 years 18.17 1,355 17.35 11.21 0.84
0/10 years 7.84 79 16.70 9.08 0.81
Averages of Annual Data from 12/31/1993-12/31/2015(maximum time period with data available) Source: Thomson-Reuters

9Return on Equity: A Compelling Case For Investors
complex and difficult to implement when applying them to a large universe of companies. For example, if one was to screen a database of 10,000 companies, this would require 10,000 separate estimates of each company’s COE for each year, and then an examination of whether the company’s ROE had exceeded this COE in each given year. More importantly, with each method of discrete COE Equity analysis, certain assumptions must be made and many discrete data inputs must be used. Furthermore, there is a great amount of academic debate over what a particular COE model’s assumptions signify and what data inputs are the most useful and relevant.
Another approach to determining whether a company is earning Returns on Equity in excess of its Cost of Equity is to simply set a fixed level for each company’s COE that is the same for all companies. Often, an estimate for the long-term return of an equity market is used as an estimate of an investor’s required return and there have been numerous attempts to create such estimates.10 This approach is simple to implement and effective, but it does make the assumption that all companies’ Equity Costs are the same, which is not consistent with modern financial theory. That is, a fixed COE applied universally will disproportionately benefit riskier companies, whose true costs are likely higher than average, and disadvantage less risky companies, whose true costs are likely lower than average.
Despite this disadvantage, we believe that for the purposes of our initial screen for stable, profitable companies, a fixed approach (that is, 15%) is the most reasonable to take as the
benefits of doing so outweigh the drawbacks. The calculation is simpler and less dependent on a wide variety of input data and the fixed nature of the requirement demands a specific performance requirement that is immediately quantifiable. Furthermore, using a fixed hurdle rate does not prevent us from performing company-specific COE evaluations in the later stages of our investment process.
As a demonstration of the power of our 15% Return on Equity requirement, we examined a large financial database spanning
over 30 years, covering over 5,000 equity securities per year.11 Based on this database, on average only about five percent of the companies would have a Cost of Equity of 15% or higher (95th percentile), so a COE above 15% is rather uncommon.12
Therefore, in most cases, a company’s Cost of Equity is very likely to be lower than 15% per year. While this COE may fluctuate in different market environments, and may vary from
company to company, the high bar that we set provides a margin of safety above and beyond the COE assigned by most models. In fact, the companies in which we ultimately invest not only meet the 15% ROE requirement, but typically exceed it by a large margin. The weighted average ROE of our Quality Growth portfolio as of December 31, 2015 was 35%.
Additionally, the few companies with a very high Cost of Equity would be unlikely to pass our 10-year, 15% Return on Equity requirement for one simple reason: COE is inversely related to ROE.13 That is, the higher a company’s ROE, generally the lower its COE, as measured by this particular database’s COE and ROE data. The results of this study are shown in Figure 7.14
10 For an example, please see The Equity Premium by Eugene F. Fama and Kenneth R. French, University of Chicago School of Business, April 2001.11 The financial database used for this example is the same as that described in footnote 6.12 This database’s model for Cost of Equity is based on a modified Capital Asset Pricing Model (CAPM) that includes adjustments for company size and value/growth orientation. An analysis of this data generated a median COE of 11.90%, with a 25th percentile of 10.55% and a 75th percentile of 13.19%. The data generally followed a normal distribution, with a mean of 11.34%. This calculation is as follows: ERi = α + br (βi) + bs (log of sizei) + by (yieldi), where ERi = expected return for Security i; α = return for hypothetical security with zero beta and yield, and $1 million market capitalization; br = Slope of security beta line; βi = Beta of Security i; bs = Slope of security size line; sizei = Market capitalization of Security i by = Slope of security yield line; and yieldi = Dividend yield of Security i13 The correlation between Return on Equity and Cost of Equity was measured at -88% (r2 of 78%). R-Squared: r-squared measures how well the Capital Asset Pricing Model predicts the actual performance of an investment or portfolio. A Correlation is a statistical measurement of the relationship between two variables.14 It is important to remember that while Cost of Equity can be a proxy for risk, as a higher COE implies a higher return demanded by shareholders for taking on additional risk, Return on Equity is not necessarily a proxy for the actual return an investor may receive in terms of dividends and capital appreciation. The financial database used for this example is the same as that described in footnote 6.
“...the companies in which we ultimately
invest not only meet [our] 15% ROE requirement,
but typically exceed it by a large margin.”

10 Return on Equity: A Compelling Case For Investors
In terms of medians, the companies to the left of the intersection point in Figure 7 (above) are generating a Return on Equity in excess of their Cost of Equity, while the companies to the right – about 90% of them – are not creating as much shareholder value as investors may have hoped. So, when performing an initial screen of companies, we must select only those companies that have truly generated returns well in excess of their capital costs. At Jensen, we believe our 15% ROE requirement helps accomplish this goal. Furthermore, our long experience studying high ROE companies demonstrates to us that this requirement results in a robust universe of high-quality companies from which to select our investments.
The Persistence of Return on Equity over Time
A logical question that arises from our discussions in this paper is whether it is possible for a company to consistently maintain a return on capital above its cost of capital over long periods of time. On one hand, conventional economic theory would predict that return on capital and cost of capital converge over time as competitors enter market niches to extract economic profits. Conversely, our research indicates that a company with a high ROE for a number of consecutive years is likely to maintain a high ROE in subsequent years. We believe that this phenomenon can be explained by some of the common characteristics shared by the high ROE companies. Specifically, we have found that companies with consistently high Return on Equity typically have sustainable competitive advantages and do business in industries with strong barriers to entry. It follows that these
Figure 7: Return on Equity and Cost of Equity for a Large Securities Database, Showing Median Values of ROE and COE in Each Decile
Medians of Annual Data from 12/31/1984-12/31/2015(maximum time period with data available) Source: Thomson-Reuters
-
2
4
6
8
10
12
14
16
Cost
of E
quity
% /
Ret
urn
on E
quity
%
Cost of Equity Percentile Groups
ROE within group (median)
COE within group (median)

11Return on Equity: A Compelling Case For Investors
characteristics should allow these companies to stave off the impact of competition and continue to capture economic profits above their capital costs – that is, they can defend their “economic moats” by being able to consistently maintain returns above their capital costs.
Our ongoing research has consistently found that the persistence of a high Return on Equity is remarkably strong. For this paper, we analyzed a large securities database and found that the probability of a company obtaining a 15% ROE in any given year is approximately 19.9%.15 If a company’s ROE is not persistent, and each year’s ROE is a completely independent event from the previous year’s ROE, then the probability of obtaining a 15% ROE each year for 10 years is 19.9%10 = 0.0001%. Naturally, if this was the case, there would not be any companies in our investable universe at all. Rather, what we observe is that the probabilities are dependent events, as shown in Figure 8.
Using the results depicted in Figure 8 we can determine that, in general, for each year a company generates an Return on Equity of 15% or greater, it is increasingly likely to repeat that feat in the future, with the probability leveling off between 85% and 90%. Note also that this plateau occurs after nine to ten years of consistent performance, in line with the number of years that we require at Jensen.
To further study the stability of Return on Equity with different requirements for ROE performance, we can also look at the percentage of an investment universe that remains the same from year to year – that is, what percentage of companies from last year’s universe are still present in this year’s universe?
15 The financial database used for this example is the same as that described in footnote 6.
Source: Thomson-Reuters
Figure 8: Probabilities of a Company Repeating the Achievement of a Return on Equity Above 15%
0%
10%
20%
30%
40%
50%
60%
70%
80%
90%
100%
1 2 3 4 5 6 7 8 9 10 11 12 13 14 15
Prob
abili
ty
Number of Years
Dependent Probability (Observed)
Independent Probability (Estimated)

12 Return on Equity: A Compelling Case For Investors
Figure 9: Average Percentage of Companies Retained in Universe from Previous Year, for Various Combinations of Consecutive Years (5, 10, and 15 years) and Percentages of ROE (10%, 15%, 20%)16
(maximum time periods with data available) Source: Thomson-Reuters
As shown by Figure 9, even universes with relatively relaxed requirements (such as five consecutive years of Return on Equity above 10%) retain about three-quarters of their companies from year to year. As one increases the number of years of consecutive ROE required, the persistence of companies in the universe increases slightly, further suggesting that companies with longer records of high ROE are more likely to continue to achieve them in the future.
Naturally, if the persistence is too low, it becomes difficult to be a long-term investor because the list of investable companies is always changing. On the other hand, if the persistence is too high, then not enough new opportunities will be available for research and investment, and the universe may become stale. Overall, we believe that the combination of 10 years and 15% return on equity provides a reasonably stable, persistent universe while also providing new research opportunities.
The Shared Characteristics of High ROE Companies
Finally, we turn to a quick review of some of the characteristics of high Return on Equity companies. As we’ve discussed in past white papers, we believe that our ROE screen allows us to identify companies that possess sustainable competitive advantages, produce returns in excess of their capital costs, have the ability to sustainably grow at faster rates than lower-ROE businesses, and generate a great deal of excess cash that they can use to fund growth and reward shareholders. Our experience over the
16 The financial database used for this example is the same as that described in footnote 6. Simple averages were taken of the percentage of qualifying companies retained (from the prior year) in each screen.
0%
10%
20%
30%
40%
50%
60%
70%
80%
90%
100%
5y10% 5y15% 5y20% 10y10% 10y15% 10y20% 15y10% 15y15% 15y20%
Perc
ent o
f Uni
vers
e Re
tain
ed Y
/Y
5-Consecutive-Year Universes: Averages of Annual Data from 12/31/1988-12/31/2015
15-Consecutive-Year Universes: Averages of Annual Data from 12/31/1998-12/31/2015
10-Consecutive-Year Universes: Averages of Annual Data from 12/31/1993-12/31/2015

13Return on Equity: A Compelling Case For Investors
past two decades suggests that these characteristics translate into good long-term investment opportunities. We believe that overall, the stocks of these companies can outperform the broader market with relatively lower risk.
In addition to these characteristics, there are also some interesting relationships that appear as we examine the effect of different consecutive time periods and different hurdle rates for ROE. First, we compare a handful of descriptive characteristics, as shown in Figure 10 below.
As the tables in Figure 10 show, there can be a complex relationship between these characteristics and the parameters used to make the screen, but in general, they tend to change in a diagonal manner from the least-restrictive screen (upper left) to the most-restrictive screen (lower right). Some of the most significant relationships along this diagonal appear to be median Beta which drops significantly, and market capitalization which increases five-fold. This is to be expected, as larger, more stable companies are likely to be able to meet the requirements of high profitability over a number of years.
Finally, we return to the relationship between high Return on Equity companies and the Standard & Poor’s Earnings and Dividend Quality Ratings. As the data in Figure 11 indicate, increases in constraints tend to improve the overall quality of the universe, although not in a specifically linear fashion.
Figure 10: Comparisons of Various Subsets of Database Based on Required Return on Equity Per Year and the
Number of Consecutive Years Required for Various Characteristics
Median Return on Equity
Required ROE Median Cost of Equity (CAPM)
Required ROE Median Beta vs. S&P 500 Index
Required ROE
10% 15% 20% 10% 15% 20% 10% 15% 20%
5 years 17.4 23.5 32.0 5 years 10.8 10.8 10.7 5 years 0.72 0.77 0.75
10 years 18.8 25.9 39.6 10 years 10.2 10.1 9.9 10 years 0.62 0.63 0.59
15 years 20.7 27.9 49.0 15 years 9.9 9.7 9.5 15 years 0.55 0.56 0.51
Median Market Cap ($-million)
Required ROE Median Adjusted Trailing PE Ratio
Required ROE Median Trailing 1-year EPS
Growth
Required ROE
10% 15% 20% 10% 15% 20% 10% 15% 20%
5 years 1,720 2,623 2,812 5 years 16.2 17.4 17.8 5 years 10.4 12.7 12.6
10 years 3,634 5,536 6,569 10 years 17.4 19.0 19.3 10 years 9.3 10.3 8.8
15 years 6,543 9,397 8,662 15 years 18.2 20.1 19.4 15 years 9.0 9.1 7.1
5-Consecutive-Year Universes: Medians of Annual Data from 12/31/1988-12/31/2015
10-Consecutive-Year Universes: Medians of Annual Data from 12/31/1993-12/31/2015
15-Consecutive-Year Universes: Medians of Annual Data from 12/31/1998-12/31/2015
Color Key
Teal = more desirable
Orange = less desirable
(maximum time periods with data available) Source: Thomson-Reuters

14 Return on Equity: A Compelling Case For Investors
Figure 11: Standard & Poor’s Earnings and Dividend Quality Ratings for All Rated Stocks in the Investment Database Versus All Rated Stocks in Various Subset Universes
All Shares: Averages of Annual Data from 12/31/1988-12/31/2015 5-Consecutive-Year Universes: Averages of Annual Data from 12/31/1988-12/31/201510-Consecutive-Year Universes: Averages of Annual Data from 12/31/1993-12/31/201515-Consecutive-Year Universes: Averages of Annual Data from 12/31/1998-12/31/2015(maximum time periods with data available) Source: Thomson-Reuters
Conclusion
At Jensen Investment Management, we believe that Return on Equity is a very useful criterion for identifying companies that may provide attractive returns over long periods of time. Throughout this paper, we have discussed how and why we use ROE in the first stage of our investment process and why we believe that it results in an identifiable universe of high-quality, profitable companies that are able to generate returns above their costs of capital in a variety of circumstances and economic environments. While ROE by itself is not suitable as a standalone metric for investment decision-making, we believe that it provides valuable insight into companies’ business models and provides an effective and efficient means for screening out all but the very best companies, upon which we perform further research in the later stages of our investment process.
17 LQ represents a company in liquidation
0%10%20%30%40%50%60%70%80%90%
100%
AllShares
5y10% 5y15% 5y20% 10y10% 10y15% 10y20% 15y10% 15y15% 15y20%
A+
A
A-
B+
B
B-
C
D
LQ 17

15 Return on Equity: A Compelling Case For Investors
All factual information contained in this paper is derived from sources which Jensen believes are reliable, but Jensen cannot guarantee complete accuracy. Any charts, graphics, or formulas contained in this piece are only for the purpose of illustration and cannot by themselves be used to make investment decisions. The views of Jensen Investment Management expressed herein are not intended to be a forecast of future events, a guarantee of future results, nor investment advice. Holdings and sector weightings are subject to change without notice.Past performance does not guarantee future results.Because Jensen’s high ROE Quality Growth investment strategy involves the use of concentrated/non-diversified portfolios (normally approximately 25-30 holdings), accounts managed by Jensen (including the Jensen Quality Growth Fund (the “Fund”)) invest in only a small number of securities that qualify for Jensen’s “investable universe” each year (i.e., the group of companies (currently fewer than 250) that have earned a ROE of 15% of greater for the last 10 consecutive years, as determined by Jensen’s Investment Committee). In addition, a number of the securities that qualify each year exhibit valuations and other characteristics that Jensen considers to be more indicative of value rather than growth stocks, and as a result such securities are normally excluded from investment consideration for the accounts of the firm’s high ROE Quality Growth clients. Therefore, the portfolio of securities included in the high ROE universe are not representative of the current or past securities portfolios for any current or former investment advisory client of Jensen, including the Fund.EPS Growth is not a measure or forecast of an account’s (including the Fund’s) future performance.
Beta: A measure of the volatility of a security’s total return compared to the general market as represented by a corresponding benchmark index. A beta of more than 1.00 indicates volatility greater than the market, and a beta of less than 1.00 indicates volatility less than the market.Cost of Equity (COE): The theoretical return that stockholders would require in exchange for owning the stock and bearing the risks of ownership.Capital Asset Pricing Model (CAPM): Is a model that describes the relationship between risk and expected return and that is used in the pricing of risky securities.Margin of Safety: When market price is significantly below an investor’s estimation of the intrinsic value of a security, the difference is the margin of safety. Also, a principle of investing in which an investor only purchases securities when the market price is significantly below its intrinsic value.Dividend Payout Ratio: The percentage of earnings paid to shareholders as dividends, calculated as dividends per share divided by earnings per share.Economic Moat: A company’s theoretical ability to maintain competitive advantages over its competitors in order to protect its profits and market share.Price to Earnings (P/E) Ratio: Is a common tool for comparing the prices of different common stocks and is calculated by dividing the earnings per share into the current market price of a stock.Free Cash Flow: Is equal to the after-tax net income of a company plus depreciation and amortization less capital expenditures.Earnings Per Share (EPS): The net income of a company divided by the total number of shares it has outstanding.Return on Assets (ROA): The return on assets percentage shows how profitable a company’s assets are in generating revenue.Market Capitalization: The total value of the issued shares of a publicly traded company; it is equal to the share price times the number of shares outstanding.S&P 500 Index: Is a market value weighted index consisting of 500 stocks chosen for market size, liquidity and industry group representation. The Index is unmanaged, and one cannot invest directly in the Index.Standard and Poor’s Earnings and Dividend Quality Ratings: The Standard & Poor’s Earnings and Dividend Rankings (also known as “quality rankings”) score the financial quality of several thousand US stocks from A+ through D, and LQ for in liquidation, with data going back to 1956. The company rankings are based on the most recent 10 years (40 quarters) of earnings and dividend data. The better the growth and stability of earnings and dividends, the higher the ranking.
Mutual fund investing involves risk; loss of principal is possible. The high ROE Quality Growth accounts managed by Jensen (including the Fund) are non-diversified, meaning they may concentrate their assets in fewer individual holdings than a diversified product, and therefore are more exposed to individual stock volatility than a diversified product.
5300 Meadows Road, Suite 250 Lake Oswego, OR 97035 800.221.4384
The Fund’s investment objectives, risks, charges, and expenses must be considered carefully before investing. The prospectus contains this and other important information about the investment company, and it may be obtained by calling 1.800.992.4144, or by visiting jenseninvestment.com. Read it carefully before investing.
Quasar Distributors, LLC – Distributor jenseninvestment.com
© 2016 Jensen Investment Management. The Jensen Quality Universe is a trademark of Jensen Investment Management. All rights reserved.
Related Documents