MONITORING THE ECOLOGICAL INTEGRITY OF PINELANDS WETLANDS A COMPARISON OF WETLAND LANDSCAPES, HYDROLOGY, AND STREAM COMMUNITIES IN PINELANDS WATERSHEDS DRAINING ACTIVE-CRANBERRY BOGS, ABANDONED-CRANBERRY BOGS, AND FOREST LAND FINAL REPORT SUBMITTED TO THE U. S. ENVIRONMENTAL PROTECTION AGENCY FEBRUARY 2006

Welcome message from author
This document is posted to help you gain knowledge. Please leave a comment to let me know what you think about it! Share it to your friends and learn new things together.
Transcript
MONITORING THE ECOLOGICAL INTEGRITY OF PINELANDS WETLANDS
A COMPARISON OF WETLAND LANDSCAPES, HYDROLOGY, AND STREAM COMMUNITIES IN PINELANDS WATERSHEDS DRAINING
ACTIVE-CRANBERRY BOGS, ABANDONED-CRANBERRY BOGS, AND FOREST LAND
FINAL REPORT SUBMITTED TO THE U. S. ENVIRONMENTAL PROTECTION AGENCY
FEBRUARY 2006

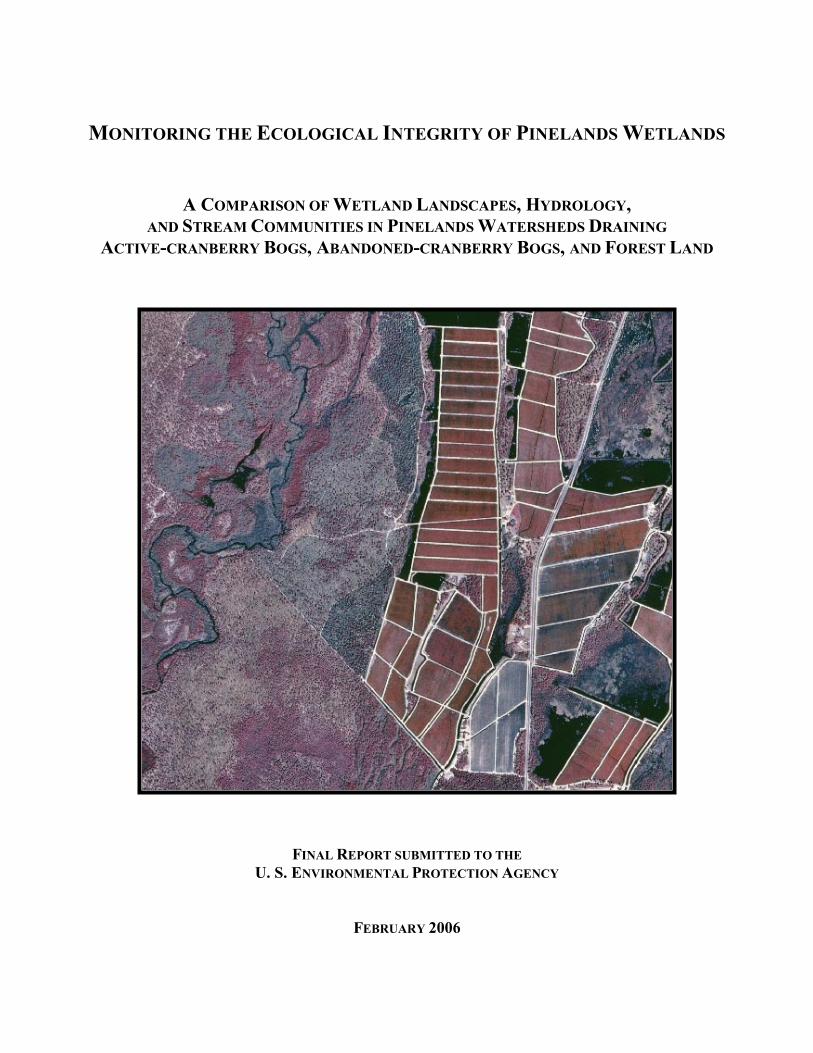
Cover image is from a 1995-97 color-infrared aerial photograph (National Aerial Photography Program by Photoscience for the United States Geological Survey) showing active-cranberry bogs in the Hospitality Brook watershed and forest land along the Wading River.
MONITORING THE ECOLOGICAL INTEGRITY OF PINELANDS WETLANDS
A COMPARISON OF WETLAND LANDSCAPES, HYDROLOGY, AND STREAM COMMUNITIES IN PINELANDS WATERSHEDS DRAINING
ACTIVE-CRANBERRY BOGS, ABANDONED-CRANBERRY BOGS, AND FOREST LAND
PREPARED BY
ROBERT A. ZAMPELLA, JOHN F. BUNNELL, KIM J. LAIDIG, AND NICHOLAS A. PROCOPIO
THE NEW JERSEY PINELANDS COMMISSION
Betty Wilson, Chairperson Candace McKee Ashmun Edward Lloyd
William J. Brown Robert W. McIntosh, Jr. Dr. Guy Campbell, Jr. Dr. Patrick T. Slavin
Leslie M. Ficcaglia Norman F. Tomasello John A. Haas Francis A. Witt
Hon. Robert Hagaman Edward A. Wuillermin, Jr. Stephen V. Lee III
John C. Stokes, Executive Director
FINAL REPORT SUBMITTED TO THE U. S. ENVIRONMENTAL PROTECTION AGENCY
FEBRUARY 2006

iii
CONTENTS
EXECUTIVE SUMMARY vii PART 1. A COMPARISON OF STREAM PATTERNS AND WETLAND LANDSCAPES IN
PINELANDS BASINS DRAINING ACTIVE-CRANBERRY BOGS, ABANDONED-CRANBERRY BOGS, AND FOREST LAND Nicholas A. Procopio and John F. Bunnell Abstract 1 Introduction 1 Methods 2
Study Basins 2 Stream-pattern and Wetland-landscape Data 2 Data Analysis 3
Results 5 Stream Patterns 5 Wetland Landscapes 5
Discussion 7 Acknowledgements 9 Literature Cited 9
PART 2. HYDROLOGIC AND MORPHOLOGIC VARIABILITY OF STREAMS DRAINING ACTIVE-CRANBERRY BOGS, ABANDONED-CRANBERRY BOGS, AND FOREST LAND Nicholas A. Procopio Abstract 19 Introduction 19 Methods 20
Data Analysis 22 Results and Discussion 22
Stream Discharge 22 Streamflow Variability 22 Flooding Frequency 23 Stream Morphology 24
Acknowledgements 24 Literature Cited 25
iv
PART 3. DISTRIBUTION OF DIATOMS IN RELATION TO LAND USE AND PH IN
BLACKWATER COASTAL PLAIN STREAMS Robert A. Zampella, Kim J. Laidig, and Rex L. Lowe Abstract 35 Introduction 35 Methods 36
Study Site Selection 36 Stream Habitats 37 Diatom Sampling 37 pH Categories 38 Data Analysis 38
Results 39 Stream Habitats 39 Species Inventory 40 Species Richness 40 Community Patterns 41 Environmental Relationships 42 pH Categories 42
Discussion 42 Acknowledgements 46 Literature Cited 46
PART 4. VEGETATION IN PINELANDS STREAMS DRAINING ACTIVE-CRANBERRY BOGS, ABANDONED-CRANBERRY BOGS, AND FOREST LAND Kim J. Laidig Abstract 59 Introduction 59 Methods 60
Land Use and Study Site Selection 60 Environmental Factors 61 Vegetation Sampling 61 Data Analysis 62
Results and Discussion 63 Environmental Factors 63 Stream-vegetation Inventory 63 Channel-vegetation Composition 64 Bank-vegetation Composition 65
Summary 66 Acknowledgents 67 Literature Cited 67
v
PART 5. MACROINVERTEBRATE ASSEMBLAGES IN PINELANDS STREAMS DRAINING
ACTIVE-CRANBERRY BOGS, ABANDONED-CRANBERRY BOGS, AND FOREST LAND Robert A. Zampella, John F. Bunnell, Nicholas A. Procopio, and Dean Bryson Abstract 81 Introduction 82 Methods 83
Land Use and Study Site Selection 83 Environmental Factors 83 Macroinvertebrate Sampling 84 Data Analysis 84
Results 85 Environmental Factors 85 Macroinvertebrate Inventory 86 Family-level Comparison of Stream Types 86 Genus-level Comparison of Stream Types 89
Discussion 91 Acknowledgements 93 Literature Cited 93
PART 6. FISH ASSEMBLAGES IN PINELANDS STREAMS DRAINING ACTIVE-CRANBERRY BOGS, ABANDONED-CRANBERRY BOGS, AND FOREST LAND John F. Bunnell Abstract 113 Introduction 113 Methods 114
Land Use and Study Site Selection 114 Fish Surveys 114 Environmental Factors 115 Data Analysis 116
Results 117 Environmental Factors 117 Fish Inventory 117 Species Composition 118 Biomass and Abundance 119
Discussion 120 Acknowledgements 122 Literature Cited 122

vii
Executive Summary Cranberry agriculture, which involves clearing land to construct bogs, damming streams
to establish reservoirs, channelizing stream segments, and creating extensive ditch networks, is a major land use in parts of the New Jersey Pinelands. The native cranberry was first cultivated in New Jersey in the mid-19th century. Since that time, the industry has been an important landscape-shaping factor. Harvested cranberry acreage, estimated to be about 3,100 acres in 2002, represents less than one-third of the 11,200 acres that existed at the peak of bog cultivation in 1919. Abandoned-cranberry bogs are now a common feature of the Pinelands landscape.
In 1999, the Pinelands Commission received a Wetlands Development Grant from the
United States Environmental Protection Agency (USEPA) to conduct a study of the potential effect of past and present cranberry agriculture on selected landscape features, stream flow, and aquatic communities in the Mullica River and Rancocas Creek basins. The Pinelands Commission and the National Park Service provided additional funding. The results of the study are presented in this report.
Study topics, which are covered in separate sections, include stream drainage patterns and
wetland-patch structure, streamflow regimes, diatoms, stream vegetation, macroinvertebrates, and fish. In each section, variations in the landscape, stream, or biological-community characteristic of interest are related to land use in the associated basins. Land uses include forest, active-cranberry bogs (cranberry), and abandoned-cranberry bogs (abandoned bogs). The diatom study also includes developed/agricultural land.
The studies include detailed statistical analyses. Because of sample-size limitations and
the many comparisons made in each study, relationships that appear fairly clear may not be statistically significant. Throughout each section, we identify statistically significant results as well as apparent trends that do not meet the strict statistical criteria that were applied.
Part 1 evaluates differences in stream-drainage patterns (drainage density, sinuosity, and ditching), wetland-patch structure (size, shape, and number of wetland patches), and wetland-vegetation cover-type composition between basins draining cranberry bogs, abandoned bogs, and forest. The results of the stream-pattern analysis indicated that the effect of past and present cranberry agriculture on stream-drainage patterns was limited primarily to the occurrence of ditches. The analysis of wetland-patch structure and wetland-vegetation cover-type composition was limited to areas outside cranberry bogs where the native vegetation was removed. There was no significant difference between the three basin types in the relative number, size, shape, and composition of the vegetation-cover types found. Although the differences were not significant, the median and total number of wetland patches and the number of patches for most dominant wetland-cover types were higher in cranberry and abandoned-bog basins compared to forest basins.
Part 2 relates streamflow regimes and stream morphology to land use. Strong
relationships exist between some of the flow-regime and channel-morphology metrics. Although no significant difference in these metrics was found between stream types, some general trends suggested that the relationship between channel morphology and flow regime is partly related to land use. In general, cranberry streams had steeper banks, greater bankfull depths, and lower
viii
bankfull width/depth ratios, whereas the gentlest slopes, shallowest channels, and highest width/depth ratios were associated with abandoned-bog streams. Higher bankfull widths and bankfull cross-sectional areas characterized forest streams. Discharge and the frequency of overbank flooding were highest, and spread, which is a measure of streamflow variability, was lowest for cranberry streams compared to the other two stream types.
Part 3 describes the relationship between the composition of diatom assemblages collected from streams draining four different land uses, including forest land, abandoned bogs, cranberry bogs, and developed/upland agriculture. This study focuses on variations in diatom assemblages associated with differences in pH. Neither species richness nor genus richness was significantly different between the four land-use types. A significant difference in species composition existed between the developed/upland agriculture sites and both cranberry and forest sites. Variations in diatom composition were associated with variations in pH and specific conductance. Although species composition varied between forest, abandoned-bog, and cranberry sites, all three stream types were dominated by diatoms associated with pH values below 7, whereas species associated with a pH around 7 dominated the developed/upland agriculture samples.
Part 4 compares channel and bank plant-species composition in forest, cranberry, and
abandoned-bog streams. Total channel-vegetation and bank-vegetation cover and channel and bank species richness did not differ significantly between stream types. Species presence-absence data revealed a difference in channel-vegetation and bank-vegetation composition between stream types and these differences appear to be most closely related to the type of canopy cover at a site. Whether canopy type is determined by land use is not known. Part 5 compares macroinvertebrate assemblages in cranberry, abandoned-bog, and forest streams and evaluates variations in community composition between muck, vegetated-muck, and woody-debris habitats. Both family-level and genus-level macroinvertebrate composition differed significantly between the cranberry streams and the other two stream classes, regardless of habitat type. Overall, the effect of stream type appears to overshadow that of habitat. Many of the taxa encountered are adapted to pond, lake, and slow-moving stream habitats and low-oxygen environments. Although not conclusive, the results suggest that variations in macroinvertebrate composition may be related to a complex environmental gradient involving dissolved oxygen, temperature, specific conductance, stream width, and woody debris.
Part 6 relates differences in fish-assemblage composition, fish abundance, and fish biomass to land use. There was no difference in species richness between forest, abandoned-bog, and cranberry stream types, although variations in species richness were related to several measures of stream size, including basin area, channel width, channel depth, and discharge. An increase in species richness with stream size was primarily due to the addition of new species, rather than species replacement. Cranberry and abandoned-bog streams generally supported greater fish abundance and biomass, which was primarily due to the higher abundance of banded sunfish and eastern mudminnows at streams in these two groups. Greater fish abundance and biomass for cranberry and abandoned-bog streams may be related to the lower pH and dissolved-oxygen levels at these sites, conditions that may favor the banded sunfish and eastern mudminnow.
1
PART 1. A COMPARISON OF STREAM PATTERNS AND WETLAND LANDSCAPES IN PINELANDS BASINS DRAINING ACTIVE-CRANBERRY BOGS, ABANDONED-CRANBERRY BOGS, AND
FOREST LAND
Nicholas A. Procopio and John F. Bunnell
Abstract
Stream and wetland-landscape patterns of watersheds that drain active-cranberry bogs, abandoned-cranberry bogs, and forest land with no history of cranberry agriculture were compared at three different levels of detail. Stream-pattern variables included drainage density, sinuosity, and the number, density, and length of ditches. Landscape-pattern measures included wetland-patch structure (the size, shape, number of wetland patches) and cover-type composition. The results of the stream-pattern analysis indicated that the effect of past and present cranberry agriculture on stream-drainage patterns was limited primarily to the occurrence of ditches. A greater number, density, median length, and total length of ditches were observed in cranberry and abandoned-bog basins compared to forest basins. Drainage density and sinuosity did not differ between basin types. The major Pinelands wetland-vegetation-cover types were represented in most of the 15 study basins. Excluding areas of active-cranberry bogs where the native vegetation was removed, there was no significant difference in the relative number, size, shape, and composition of the remaining vegetation-cover types between the three basin types. The vegetation types removed to establish bogs in the active and abandoned basins are not known. The median and total number of wetland patches and the number of patches for most dominant wetland-cover types were higher in cranberry and abandoned-bog basins compared to forest basins. Although the differences were not significant, these results suggest that past and present cranberry agriculture had some effect on overall wetland-patch structure. For cranberry basins, the greater number and percentage area for open-water and modified-wetland patches was most likely due to the reservoirs and ongoing agricultural activities associated with active cranberry farming.
Introduction
Channelizing and impounding streams can cause substantial changes in the structure and
function of aquatic and wetland communities by influencing channel morphology, stream-flow regimes, water-quality characteristics, habitat diversity, food availability, and species composition (Gordon et al. 1992, Allan 1995). Impacts from these activities may extend beyond the modified stream portions and potentially affect the vegetation composition of the wetland landscape (Shankman 1996).
Cranberry agriculture involves the clearing and leveling of land to create bogs. To control
the flow of water to and from bogs and to facilitate drainage, diversion canals are created, stream segments may be channelized, and extensive networks of ditches are established (Eck 1990). Dikes are constructed to establish reservoirs, partition bogs, and provide access throughout the farm. These landscape alterations are characteristic of both past and present cranberry agriculture. In New Jersey, cranberry farming is limited to the Pinelands region, where it is concentrated within several stream basins of the Mullica River and Rancocas Creek watersheds. Although cranberry agriculture can represent over one-third of the wetlands of some Pinelands stream
2
basins, the effect of this land use on aquatic and wetland resources has not been investigated in the region.
In this study, we compare stream patterns and wetland landscapes in basins draining active-
cranberry bogs, abandoned-cranberry bogs, and forest land with no history of cranberry agriculture. Specifically, we address two questions. First, do stream-drainage patterns, such as drainage density, sinuosity, and ditching, vary among the three basin types? Secondly, are there differences in the wetland-patch structure (i.e., size, shape, and number of wetland patches) and wetland-vegetation cover-type composition between the three basin types?
Methods
Study Basins
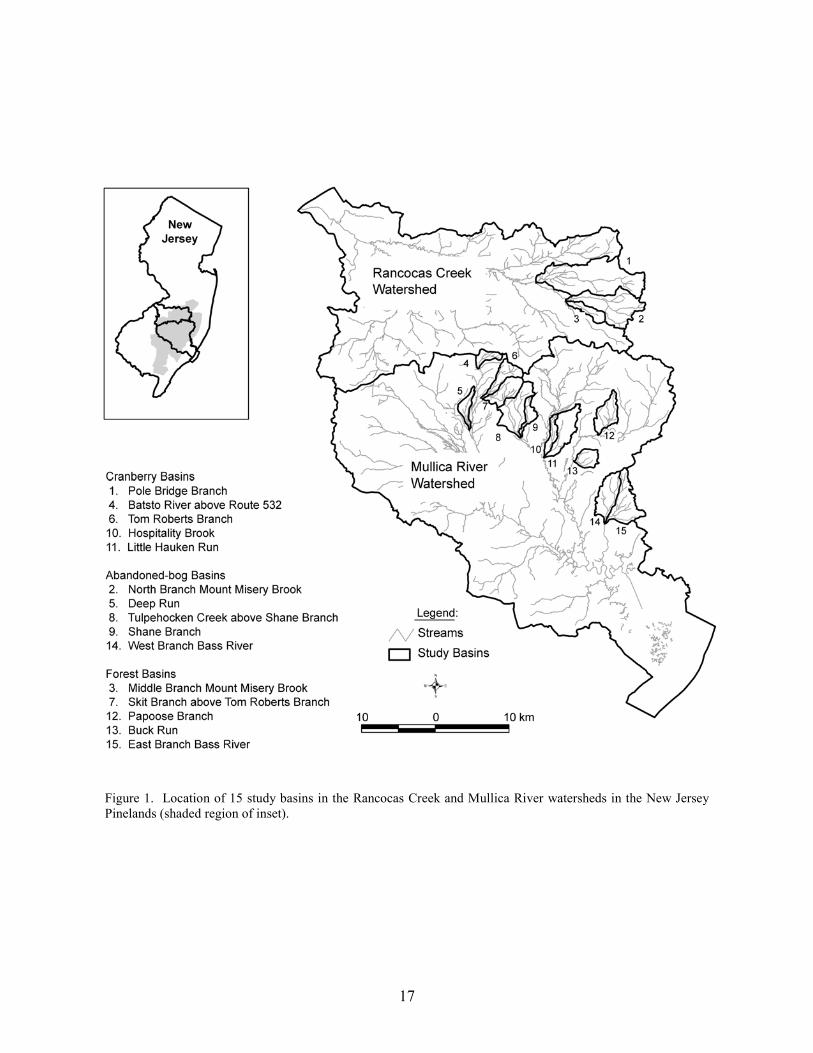
We selected 15 study basins in the Mullica River and Rancocas Creek watersheds (Figure 1, Table 1). Using methods described in Zampella et al. (2001, 2003), we delineated basin boundaries and generated land-use profiles for each basin. Land-use data were obtained from the New Jersey Department of Environmental Protection 1995/97 Land Use/Land Cover Update (2001). Land uses were classified using a modified Anderson et al. (1976) system. In this paper, we refer to the Anderson land-use classes of urban land, agriculture, and agricultural wetlands as developed land, upland agriculture, and wetland agriculture, respectively. Although wetland agriculture includes both blueberry and cranberry farming, most of the wetland agriculture in our study basins was related to cranberry.
The 15 study basins were divided equally among active-cranberry bog (cranberry),
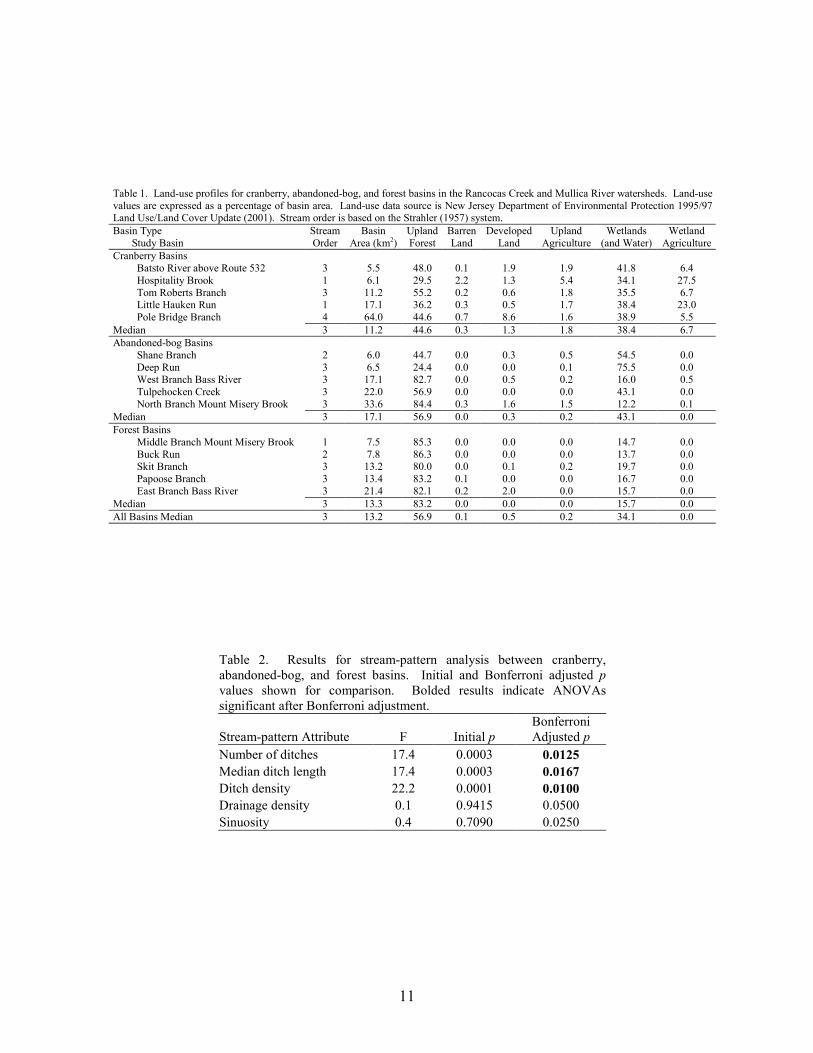
abandoned-cranberry bog (abandoned bog), and forest basin types. Cranberry basins drained lands with active-cranberry operations. Abandoned-bog basins drained lands with historical cranberry bogs that have succeeded to various wetland-habitat types. Forest basins had no apparent history of cranberry farming. In the cranberry basins, the percentage of basin area classified as wetland agriculture ranged from 5.5% to 27.5% (Table 1). The percentage of altered land (developed land and upland agriculture) was below ten percent in all study basins. The 15 study basins represented first through fourth order (Strahler 1957) streams and a range of basin sizes. There was no significant difference in basin area between the three basin types (ANOVA, F2,12 = 0.059, p = 0.943). Stream-pattern and Wetland-landscape Data
Stream-pattern data. We used digital hydrography data (NJDEP 1996) for the stream-drainage pattern analysis. Using ArcInfo 8.2 software (Environmental Systems Research Institute, ESRI Inc, Redlands, CA. 1999-2002), digital United States Geologic Survey 7.5 minute topographic quadrangles, and 1995 aerial photographs (NAPP by Photoscience, Inc. for USGS), we visually identified ditches from the hydrogaphy data. In this paper, we refer to each straight-line ditch segment identified from the hydrography data as an individual ditch. We included ditches associated with active or abandoned cranberry agriculture and the remaining streams from the study basins in our analysis.
3
Wetland-landscape data. Freshwater-wetland data were obtained from the New Jersey Department of Environmental Protection 1995/97 Land Use/Land Cover Update (2001). The New Jersey Department of Environmental Protection classifies wetlands using the Cowardin et al. (1979) system. The Cowardin et al. (1979) classification is hierarchical. Systems, which represent the highest level in the hierarchy, include marine, estuarine, riverine, lacustrine, and palustrine wetlands complexes. Most freshwater wetlands in New Jersey are classified as palustrine. Palustrine wetlands include marshes, swamps, bogs, fens, and ponds. Class represents the next level in the palustrine hierarchy. Palustrine classes include aquatic beds, emergent wetlands, scrub-shrub wetlands, and forest wetlands. Wetlands are further classified according to subclasses, which are based on the predominant life form. Forest wetland and scrub-shrub subclasses included broad-leaved deciduous, needle-leaved deciduous, broad-leaved evergreen, needle-leaved evergreen, and dead. For example, pitch pine lowlands are classified as palustrine forest needle-leaved evergreen wetlands (PFO4). New Jersey freshwater wetlands maps also include Atlantic white cedar as a special subclass (PFO8). The dominant and subordinate subclasses are described when wetland patches are composed of more than one subclass. Lacustrine, riverine, and palustrine open-water wetlands were included under an open-water (OW) cover-type class (Table 4). Throughout this paper, the term wetlands includes water. Data Analysis
Stream Patterns. To evaluate differences in stream patterns among cranberry, abandoned-bog, and forest basins, we compared five drainage variables between the three basin types. The variables were number of ditches, median ditch length, ditch density, drainage density, and sinuosity. The three ditch-related variables represent slightly different measures of human impact. Ditch density was calculated as the total ditch length/basin area. Drainage density and sinuosity were used to compare the remainder of the stream segments among the three basin types. Ditches were excluded from the calculation of these two variables. Drainage density was calculated as the total stream length/basin area (Gordon et al. 1992). Sinuosity, which indicates the curvature of a stream channel, is the ratio of total stream length to the straight-line length (Epstein 2002, Roper 2002). A sinuosity value of 1.0 represents a straight line and values increase with more stream curvature. We calculated a single sinuosity value for each study basin using ArcView software and the formula:
SB=LN/Σ(LS1+LS2+….LSn)
where SB represents sinuosity for an entire study basin, LN equals the length of all streams in the basin of interest, and Σ(LS1+LS2+….LSn) equals the sum of the straight-line distance of each contributing stream segment in the basin.
Wetland-landscape patterns. In our analyses, we used dominant/subordinate subclass data and data that we aggregated by the dominant-cover type. For the aggregated data, adjacent wetland patches with the same dominant-cover type were combined prior to analysis using ArcView software.
To determine if there were differences in the wetland-patch structure (i.e., size, shape, and
number of wetland patches) and wetland cover-type composition between cranberry, abandoned-
4
bog, and forest basins, we compared twelve attributes at coarse, intermediate, and fine scales. Wetland-agriculture patches were excluded from all analyses to evaluate differences in the patch structure and cover-type composition of the remaining wetland landscape.
The coarse-scale variables provided a measure of basic wetland-patch structure, and
included the percentage of wetlands in a basin and the number of patches, median patch size, and median patch fractal dimension for all wetland patches in a basin regardless of cover type. A fractal dimension is a measure of patch-shape complexity with values ranging from one (simple shape) to two (complex shape). To determine fractal dimension, we used ArcView software with Patch Analyst 3.1 and the formula for vector data (McGarigal and Marks 1994):
2 * lnPi / lnAi
where P is the perimeter of a patch and A is the area of a patch.
The intermediate-scale variables were the number of patches, median patch size, and
median fractal dimension for the aggregated cover types in a basin. Fine-scale variables provided the most detailed information regarding the patch structure, cover-type distribution, and cover-type composition of the wetland landscapes in the basins. The fine-scale variables were Shannon’s evenness index, cover-type richness, cover-type presence-absence, percentage of the wetland area per cover type, and percentage of the wetland patches per cover type. The fine-scale analysis was performed using the dominant/subordinate subclass data. Shannon’s evenness index (J) indicates how evenly the richness and abundance of cover types are distributed throughout a study basin. Shannon’s J ranges from zero to one, with a score of one indicating an even distribution of all cover types in a basin. Shannon’s J was calculated as: S J = -∑Pi * lnPi /lnS i=1 where S is the total number of cover types in a study basin (cover-type richness) and P is the proportion of each cover type in a basin (Begon et al. 1996).
Statistical Analysis. We completed separate multivariate analysis of variance (MANOVA) tests to determine if there was an overall difference among the three basin types for the five stream-pattern variables (median ditch length, number of ditches, ditch density, drainage density, and sinuosity), the four coarse-scale wetland variables (percentage of wetlands and the number of patches, median patch size, and median patch fractal dimension for all wetland patches), each of the three intermediate-scale wetland variables (the number of patches, median patch size, and median fractal dimension for the dominant wetland cover types), and two of the fine-scale wetland variables (cover-type richness and Shannon’s J). Except for cover-type richness and Shannon’s J, all MANOVAs were completed using ranked data because requirements of normality and homogeneity of variance could not be met by log transformations (Helsel and Hirsh 1992). Tied values were assigned ranks by giving each value the average of the rank each would have received had there not been a tie (Zar 1984). The analysis of variance (ANOVA) p values produced during the MANOVAs were corrected using the sequential Bonferroni significance-level adjustment (Rice 1989, 1990). For significant ANOVA results, the Tukey HSD multiple-
5
comparison test was used to identify differences between basin types. Statistical analyses were completed using Statistica 5.5 (Statsoft Inc., Tulsa, OK. 1995).
We used multi-response permutation procedures (MRPP, McCune and Mefford 1999) to
determine if there were differences in three fine-scale wetland variables, including cover-type presence-absence, percentage of wetland area per cover type, and percentage of wetland patches per cover type, between the three basin types. MRPP is a nonparametric procedure used to test for group differences in community data (McCune and Grace 2002). MRPP analyses were based on Euclidean distance and we report the p and A values for each analysis. The p value represents the probability that an observed difference is due to chance. The A statistic (chance-corrected within-group agreement statistic) describes homogeneity within the groups (i.e., basin types). A = 1 when all attributes (i.e., wetland cover types) within a group (i.e., cranberry, abandoned-bog, and forest) are identical, A = 0 when heterogeneity within groups equals that expected by chance, and A < 0 when heterogeneity within groups is greater than expected by chance. For significant MRPP results, post-hoc MRPP analyses were completed to identify differences between basin types. Post-hoc p values were corrected using the sequential Bonferroni adjustment (Rice 1989, 1990). MRPP analyses were completed using PC-ORD for Windows 4.27 (MjM Software, Gleneden Beach, OR 1999).
Results
Stream Patterns A total of 1,669 ditch segments were identified in the 15 study basins. About 80% of these ditches were associated with cranberry agriculture. The other 348 ditches were related to other land uses, such as blueberry agriculture. Results of the MANOVA on the five stream-pattern variables indicated a significant difference between basin types (MANOVA, Wilks’ lambda = 0.077, F10,16 = 4.17, p = 0.006). Individual ANOVA results revealed a significant difference between basin types for median ditch length, number of ditches, and ditch density, but not for drainage density and sinuosity (Table 2). For median ditch length, number of ditches, and ditch density, Tukey test results indicated that forest basins were significantly different than cranberry and abandoned-bog basins (Figure 2). All three ditch-related variables were lowest in forest basins. Except for a 40 m ditch composed of two segments that extended from active-cranberry bogs in an adjacent watershed to Papoose Branch, forest basins lacked ditches. Neither of these two ditches was visible on historic (1930) or recent (2002) aerial photographs. Although there were no significant differences in the ditch-related variables between cranberry and abandoned-bog basins, these variables were generally greater in cranberry basins compared to abandoned-bog basins. The total number of ditches and total length of ditches was about three times greater in cranberry basins (991 and 114 km) compared to abandoned-bog basins (328 and 29 km). Wetland Landscapes
For all 15 study basins, the median percentage basin area classified as wetlands (wetlands and water) outside of the footprint of the active-cranberry bogs was about one-third (Table 1). The overall median percentage of water was 1.2%. For the individual study basins, the percentage of
6
wetlands in a basin ranged from 12.2 % in the North Branch Mount Misery Brook basin to 75.5 % in the Deep Run basin. Although the median percentage of wetlands was generally lowest for forest basins, intermediate for cranberry basins, and highest for abandoned-bog basins, there was no significant difference in the percentage of wetlands between the three basin types (MANOVA, Wilks’ lambda = 0.325, F8,18 = 1.70, p = 0.167).
A total of 4,165 land-use patches were present in the 15 study basins. About 45% of these
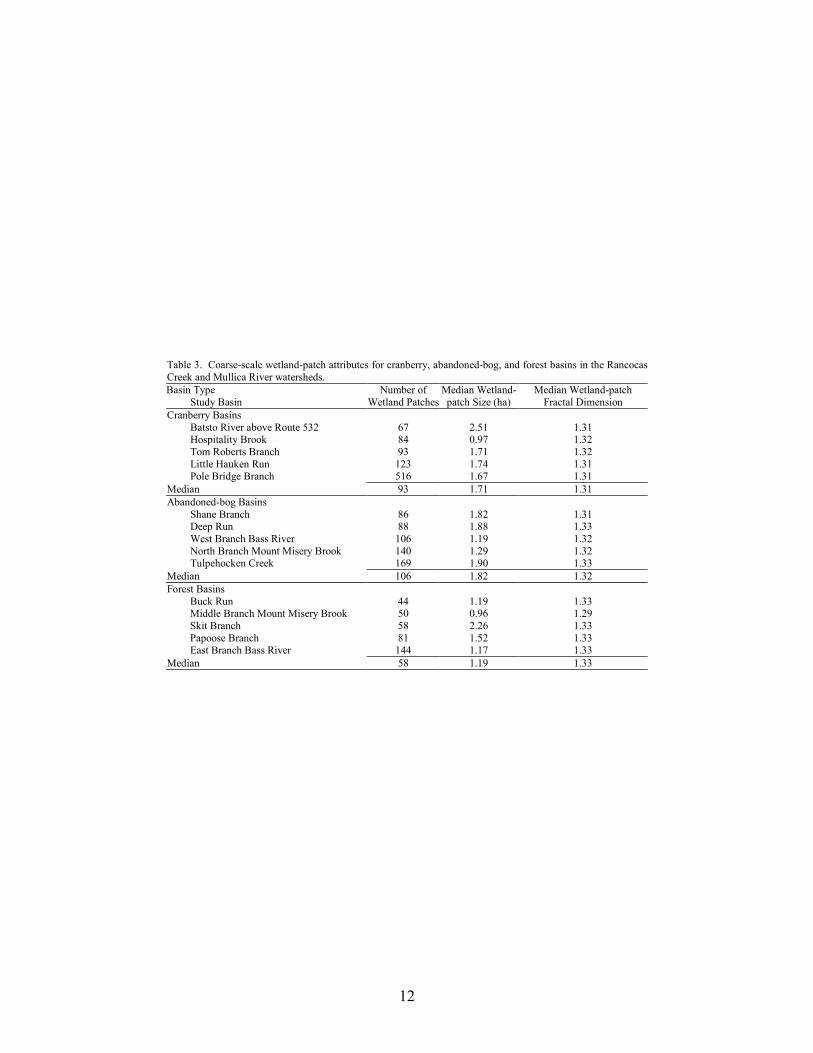
were wetland patches. Excluding wetland agriculture, the total number of wetland patches for cranberry, abandoned-bog, and forest basins was 883, 589, and 377, respectively. The number of wetland patches ranged from 44 patches in the Buck Run basin to 516 patches in the Pole Bridge basin (Table 3). Although the median and total number of wetland patches was lowest in forest basins compared to cranberry and abandoned-bog basins, we found no significant difference in the number of wetland patches between the three basin types (MANOVA, Wilks’ lambda = 0.325, F8,18 = 1.70, p = 0.167).
Wetland-patch size varied considerably among the 15 study basins, ranging from 0.1 ha to
> 250 ha. The median wetland-patch size for all 15 basins was 1.6 ha. For the individual basins, the median wetland-patch size ranged from 0.96 ha in the Middle Branch Mount Misery Brook basin to 2.5 ha in the Batsto River above Route 532 basin (Table 3). The median patch size was lowest in forest basins compared to cranberry and abandoned-bog basins, but we found no significant difference between the three basin types (MANOVA, Wilks’ lambda = 0.325, F8,18 = 1.70, p = 0.167).
Median wetland-patch fractal-dimension values were virtually identical for all 15 basins
(Table 3). There was no significant difference in median wetland-patch fractal-dimension values between the three basin types (MANOVA, Wilks’ lambda = 0.325, F8,18 = 1.70, p = 0.167).
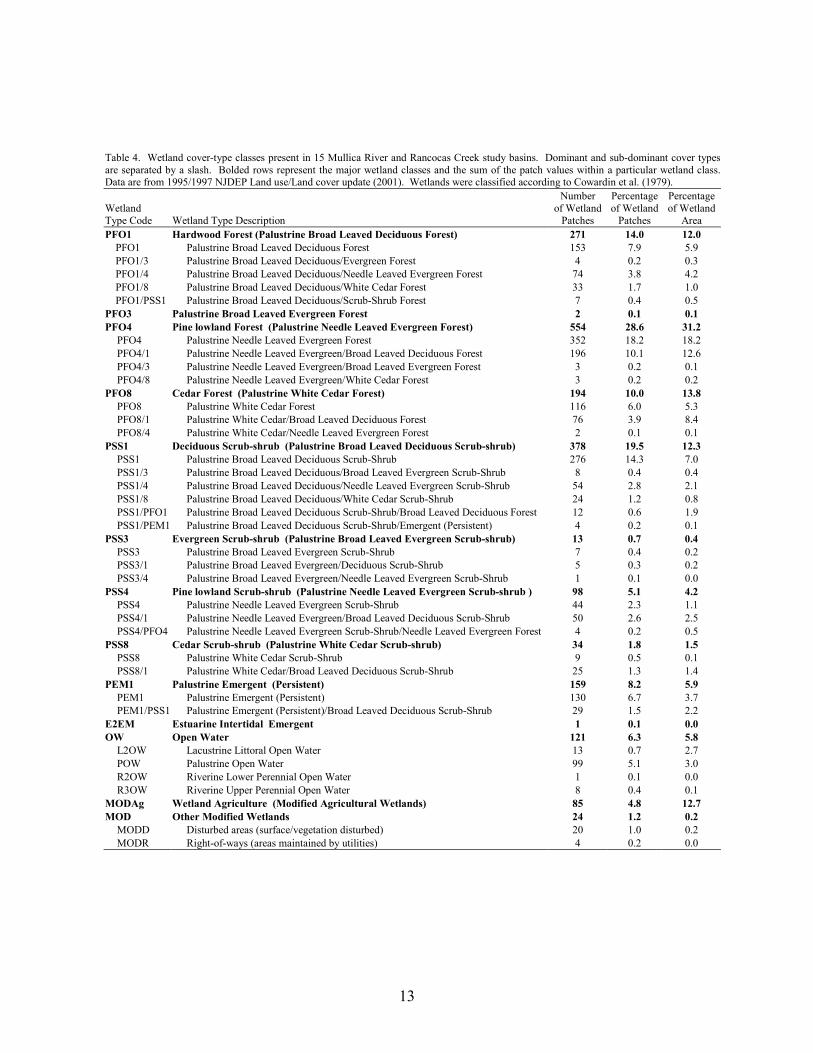
A total of 37 different wetland cover types occurred in the 15 study basins (Table 4). Forest patches, dominated by trees, represented over 50% of the wetland patches and total wetland area and scrub-shrub patches almost 30% of the wetland patches and 20% of the wetland area. The dominant wetland-forest cover type was PFO4 (pine lowland: primarily pine lowland and pine-hardwood forest patches), followed by PFO1 (hardwood: primarily hardwood and hardwood-pine forest patches), and PFO8 (cedar: primarily cedar and cedar-hardwood patches). The dominant scrub-shrub cover type was PSS1 (deciduous scrub-shrub).
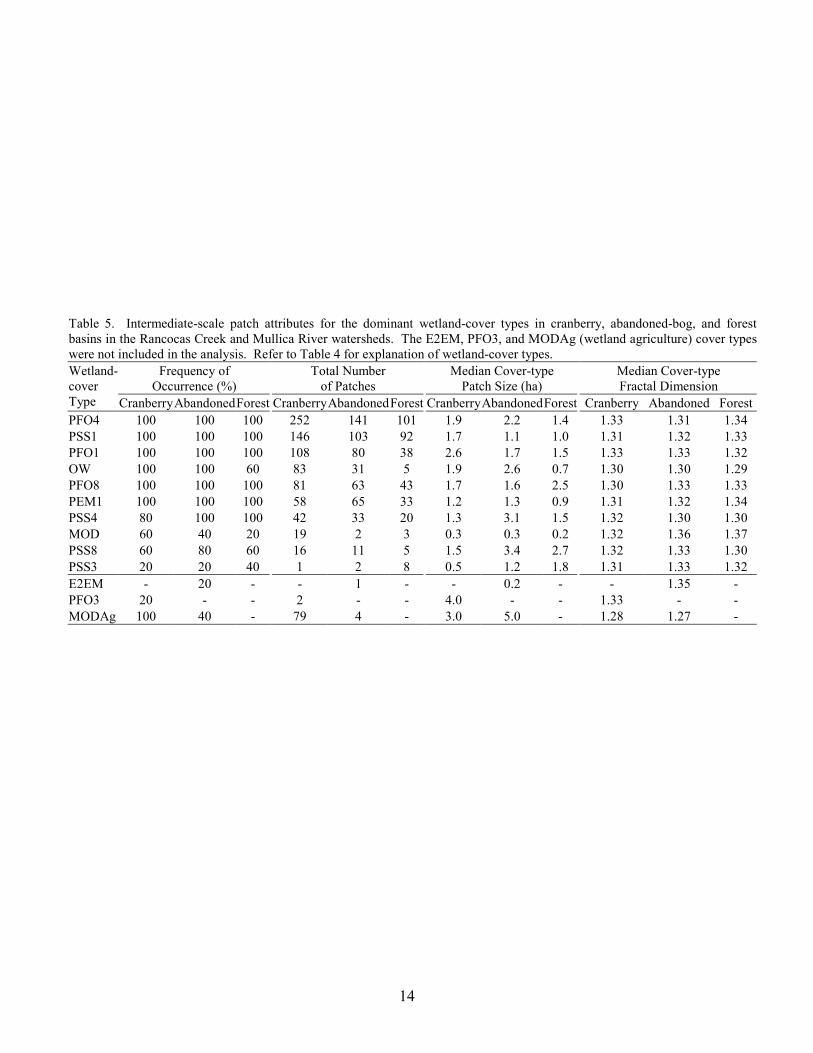
Excluding wetland agriculture, aggregating the wetland data by the dominant cover type and combining adjacent patches with the same classification resulted in 12 dominant cover types and a total of 1,688 wetland patches (Table 5). Similar to the trend for the total number of wetland patches, the number of patches for most of the dominant cover types was highest for the cranberry basins, intermediate for abandoned-bog basins, and lowest for forest basins. The greatest difference in the number of patches between the three basin types was the higher number of open-water (OW) and modified-wetland (MOD) patches in cranberry basins. For all study basins, the majority of the OW patches were palustrine open-water patches (Table 4). Most of the MOD patches were wetlands in which the vegetation was disturbed. These MOD patches were unrelated to those maintained as rights-of-way by utilities (Table 4). Cranberry basins contained 70% of all open-water patches and almost 80% of all modified wetlands patches in the 15 basins. However,
7
there was no significant difference in the number of patches for any cover type between the three basin types (MANOVA, Wilks’ lambda = 0.013, F20,6 = 2.33, p = 0.149). We also found no significant difference in median cover-type patch size (MANOVA, Wilks’ lambda = 0.033, F20,6 = 1.34, p = 0.378) or median cover-type fractal dimension (MANOVA, Wilks’ lambda = 0.033, F20,6 = 1.33, p = 0.383) between the three basin types. The E2EM and PFO3 cover types were excluded from the MANOVAs because the E2EM cover type was present only in one abandoned-bog basin and the PFO3 cover type was present in only two cranberry basins.
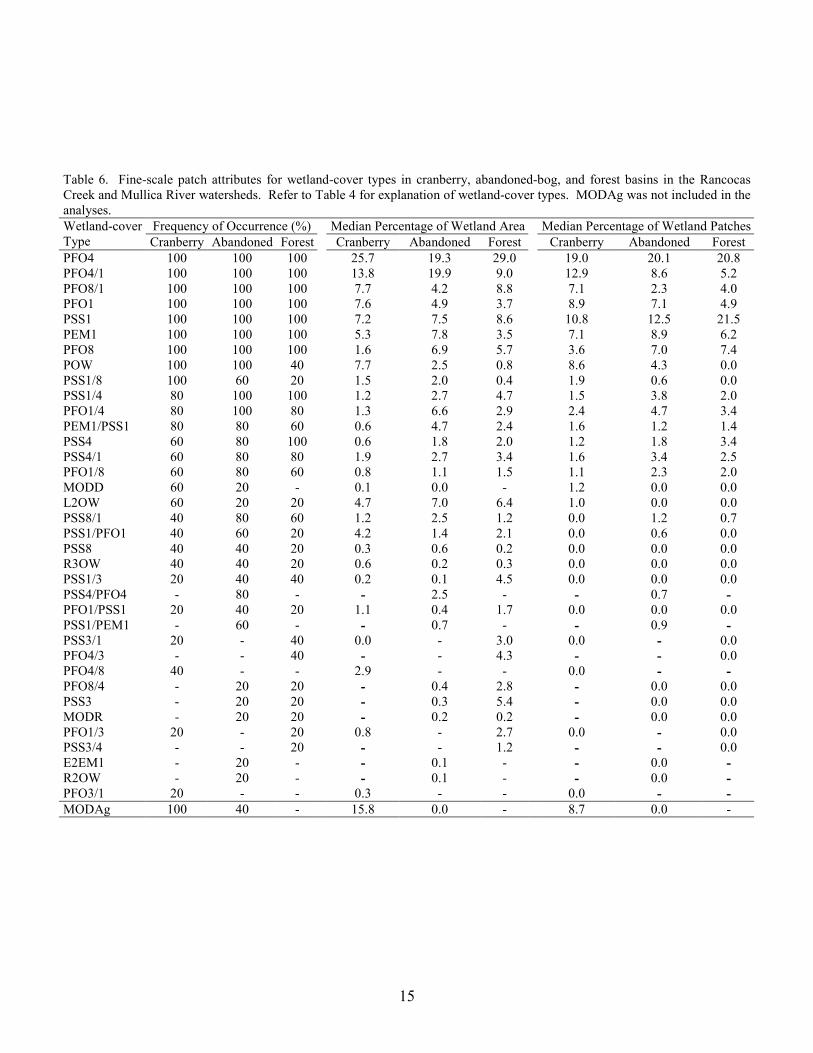
Of the 37 individual wetland-cover types, seven were present in all 15 study basins,
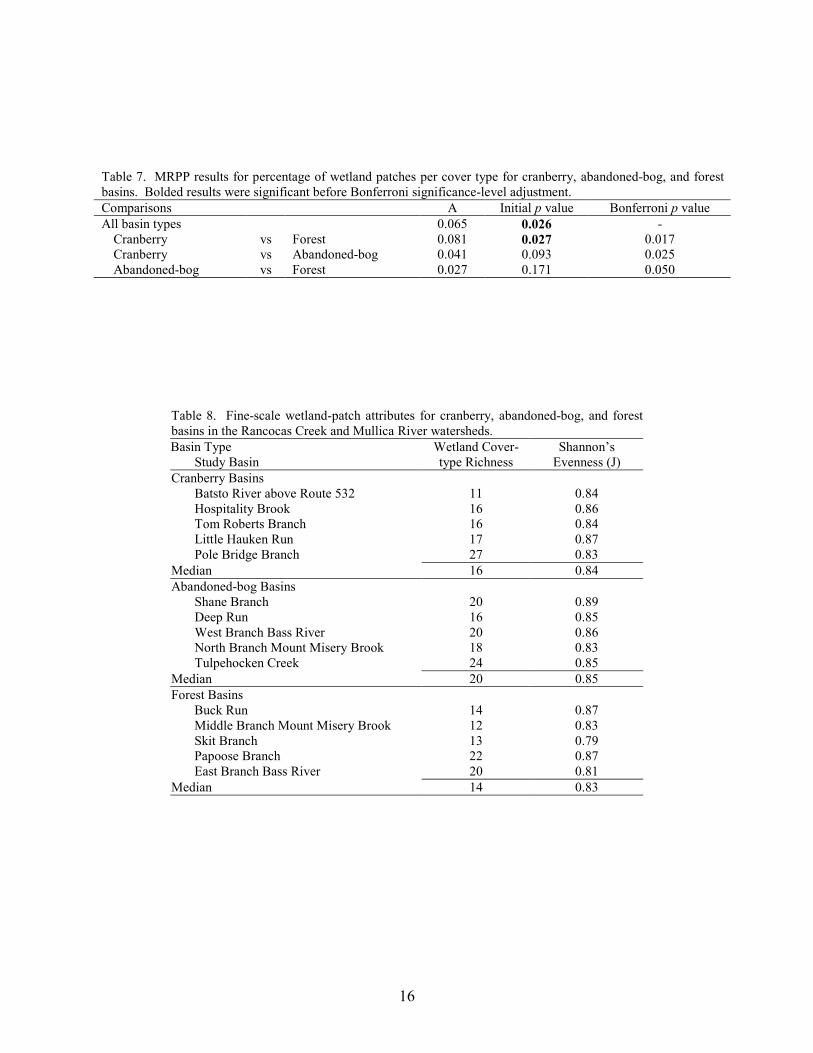
including PFO4, PFO4/1, PFO8/1, PFO1, PSS1, PEM1, and PFO8 (Table 6). Combined, these seven cover types represented the majority of the wetland area and wetland patches in each of the 15 basins. In contrast, eight wetland cover types were each present in only one of the three basin types. These eight cover types were PFO8/4, PSS3, MODR, PFO1/3, PSS3/4, E2EM1, R2OW, and PFO3/1. Although several wetland cover types varied in frequency of occurrence and percentage of wetland area between the three basin types, the results of the MRPP analyses indicated that there was no significant difference in either wetland cover-type presence/absence (MRPP, A = 0.021, p = 0.129) or percentage of wetland area per cover type (MRPP, A = 0.012, p = 0.307) among the basin types. There was a significant difference in the percentage of wetland patches per cover type (MRPP, A = 0.065, p = 0.026). The post-hoc comparison indicated that the difference was between cranberry and forest basins, but this difference was not significant after applying the Bonferroni significance-level adjustment (Table 7).
Shannon’s J values were similar and relatively high for all study basins (Table 8). Wetland
cover-type richness ranged from 11 in the Batsto River at Route 532 basin to 27 in the Pole Bridge Branch basin (Table 3). There was no significant difference in Shannon’s J or cover-type richness between the three basin types (MANOVA, Wilks’ lambda = 0.781, F4,22 = 0.723, p = 0.585).
A total of 83 wetland-agriculture patches occurred in the 15 study basins (Tables 4 and 5). Seventy-nine of these patches occurred in the five cranberry basins. The other four wetland-agriculture patches were present in abandoned-bog basins (three patches in North Branch Mount Misery Brook and one in West Branch Bass River). These four wetland-agriculture patches were abandoned. In the five cranberry basins, wetland-agriculture patches represented a relatively small percentage (7-10%) of the total number of wetland patches. In contrast, there was a wide range in the percentage of wetland area classified as wetland agriculture in these basins (Batsto River 13%, Pole Bridge Branch 15%, Tom Roberts Branch 16%, Little Hauken Run 36%, and Hospitality Brook 43%).
Discussion
The results of our study indicated that the impact of past and present cranberry agriculture
on stream-drainage patterns was limited primarily to the occurrence of ditches. We observed a much greater number, density, median length, and total length of ditches in cranberry and abandoned-bog basins compared to forest basins, but ditches were limited to the portion of the basins in the immediate vicinity of the cranberry operations. Ditches are a prominent feature of any cranberry farm because the ability to control water and drain bogs is crucial (Eck 1990).
8
In contrast, as indicated by the sinuosity and drainage-density results, we did not find differences among the basin types for the remainder of the stream segments in the basins. The low sinuosity values for all basins (1.08 - 1.27) indicated that the Pinelands stream channels that we studied were sinuous. Although somewhat arbitrary, sinuosity values > 1.0 represent sinuous streams, values > 1.5 meandering streams, and values > 2.1 highly convoluted streams (Gordon et al. 1992, Ward and Trimble 2004).
Although not statistically significant, the generally greater number, density, median length,
and total length of ditches in cranberry versus abandoned-bog basins may have been due to differences in the construction of bog complexes over time. Inspection of aerial photographs revealed that most historic cranberry bogs in abandoned basins appeared to be created from wetlands that bordered the stream channels. These bogs tended to reflect natural stream and topographic features. In contrast, bogs in cranberry basins often extended laterally well beyond the riparian corridor and into the surrounding landscape.
Although we don’t know what vegetation types were removed to establish bogs in the
cranberry and abandoned-bog basins, the results from our wetland-landscape analyses showed that, excluding wetland agriculture, the relative composition of the remaining vegetation cover types was similar among the three basin types. The dominance of forest cover-types in each study basin is consistent with the fact that nearly 70% of the total wetland area in the Pinelands is composed of forest cover types. Although the major Pinelands wetland-vegetation cover types were represented in most of the 15 study basins, the percentage of the total study basin wetland area that was hardwood forest was only 12% compared to the Pinelands-wide percentage of about 30%.
The lack of differences in the size, shape, number, and proportion of wetland patches at any of the three scales revealed that the wetland-patch structure outside the footprint of the cranberry bogs was similar among the basin types. The relatively high and comparable Shannon’s J values indicated that, regardless of cover type, the proportion of patches was distributed in a similar manner among the 15 basins. The results of the fractal-dimension analyses showed that basic wetland-patch shape and the patch shape of the dominant cover types did not vary significantly between basin types.
Although not statistically significant, the higher median and total number of wetland
patches regardless of cover type and higher number of patches for most dominant cover types for cranberry and abandoned-bog basins compared to forest basins suggested that past and present cranberry agriculture had some effect on overall wetland-patch structure. For cranberry basins, the much greater number and percentage area for open-water and modified-wetland patches indicated that these cover types were more typical of basins with active cranberry agriculture. Reservoirs are typically created to store water for irrigation, harvest flooding, frost protection, and winter flooding (Eck 1990). Since cranberry basins have ongoing agricultural operations that may include activities such as bog construction and vegetation maintenance, it makes sense that these basins also contained more modified-wetland patches.
In conclusion, the impact of past and present cranberry farming on basin-wide stream-
drainage patterns and wetland-landscape structure and cover-type composition appeared to be limited primarily to the footprint of the land use. Land was cleared to establish bogs and localized
9
networks of ditches were created for water control. Our study was primarily a landscape assessment of these wetland attributes using aerial photography and GIS data. More detailed, field-based research is needed to determine whether cranberry agriculture has an effect on stream-flow regimes and the structure and function of aquatic communities in the Pinelands.
Acknowledgments
Funding for this study was provided by the U. S. Environmental Protection Agency (State Wetlands Grant Program, Grant No. CD-99298001-1) and the Pinelands Commission.
Literature Cited
Allan, J. D. 1995. Stream ecology: structure and function of running waters. Chapman and Hall, London, England. Anderson, J. R., E. E. Hardy, J. T. Roach, and R. E. Witmer. 1976. A land use and land cover classification system for use with remote sensor data. U.S. Geological Survey Professional Paper 964. Begon, M, J. L. Harper, and C. R. Townsend. 1996. Ecology: individuals, populations, and communities, 3rd Edition. Blackwell Science, Inc. Cambridge, Massachusettes, USA. Cowardin, L. M., V. Carter, F. C. Golet, and E. T. LaRoe. 1979. Classification of wetlands and deepwater habitats of the United States. U.S. Fish and Wildlife Service, FWS/OBS-79-31. Eck, P. E. 1990. The American cranberry. Rutgers University Press, New Brunswick, New Jersey, USA. Epstein, C. M. 2002. Application of Rosgen analysis to the New Jersey Pine Barrens. Journal of the American Water Resources Association 38:69-78. Gordon, N. D., T. A. McMahon, and B. L. Finlayson. 1992. Stream hydrology: an introduction for hydrologists. John Wiley and Sons, Chichester, England. Helsel, D. R. and R. M. Hirsh. 1993. Statistical methods in water resources. Elsevier Science. Amsterdam, Netherlands. McCune, B. and J. B. Grace. 2002. Analysis of ecological communities. MjM Software Design, Gleneden Beach, Oregon, USA. McCune, B. and M. J. Mefford. 1999. Multivariate analysis of ecological data. MjM Software Design, Gleneden Beach, Oregon, USA. McGarigal, K. and B. J. Marks. 1994. Fragstats: spatial pattern analysis program for quantifying landscape structure, Version 2.0. Reference manual. Forestry Science Department, Oregon State University. Corvallis, Oregon, USA.
10
NJDEP (New Jersey Department of Environmental Protection) 1996. New Jersey Geographic Information System CD-ROM, Series 1, Volumes 1-4. Rice, W. R. 1989. Analyzing tables of statistical tests. Evolution 43:223-225. Rice, W. R. 1990. A consensus combined p-value test and the family wide significance of components tests. Biometrics 46:303-308. Roper, B. B., J. L. Kershner, E. Archer, R. Henderson, and N, Bouwes. 2002. An evaluation of physical stream habitat attributes used to monitor streams. Journal of the American Water Resources Association 38:1637-1646. Shankman, D. 1996. Stream channelization and changing vegetation patterns in the U.S. Coastal Plain. The Geographical Review 86:216-232. Strahler, A. N. 1957. A quantitative analysis of watershed geomorphology. Transactions of the American Geophysical Union. 38:913-920. Ward, A. D. and S. W. Trimble. 2004. Environmental hydrology, 2nd ed. Lewis Publishers, CRC Press LLC, Boca Raton, Florida, USA. Zampella, R. A., J. F. Bunnell, K. J. Laidig, and C. L. Dow. 2001. The Mullica River Basin: A report to the Pinelands Commission on the status of the landscape and selected aquatic and wetland resources. Pinelands Commission, New Lisbon, New Jersey, USA. Zampella, R. A., J. F. Bunnell, K. J. Laidig, and N. A. Procopio. 2003. The Rancocas Creek Basin: A report to the Pinelands Commission on the status of selected aquatic and wetland resources. Pinelands Commission, New Lisbon, New Jersey, USA. Zar, J. H. 1999. Biostatistical analysis, 4th Edition. Prentice Hall, Inc. Upper Saddle River, New Jersey, USA.
11
Table 1. Land-use profiles for cranberry, abandoned-bog, and forest basins in the Rancocas Creek and Mullica River watersheds. Land-use values are expressed as a percentage of basin area. Land-use data source is New Jersey Department of Environmental Protection 1995/97 Land Use/Land Cover Update (2001). Stream order is based on the Strahler (1957) system. Basin Type Study Basin
StreamOrder
Basin Area (km2)
UplandForest
BarrenLand
DevelopedLand
Upland Agriculture
Wetlands (and Water)
Wetland Agriculture
Cranberry Basins Batsto River above Route 532 3 5.5 48.0 0.1 1.9 1.9 41.8 6.4 Hospitality Brook 1 6.1 29.5 2.2 1.3 5.4 34.1 27.5 Tom Roberts Branch 3 11.2 55.2 0.2 0.6 1.8 35.5 6.7 Little Hauken Run 1 17.1 36.2 0.3 0.5 1.7 38.4 23.0 Pole Bridge Branch 4 64.0 44.6 0.7 8.6 1.6 38.9 5.5
Median 3 11.2 44.6 0.3 1.3 1.8 38.4 6.7 Abandoned-bog Basins
Shane Branch 2 6.0 44.7 0.0 0.3 0.5 54.5 0.0 Deep Run 3 6.5 24.4 0.0 0.0 0.1 75.5 0.0 West Branch Bass River 3 17.1 82.7 0.0 0.5 0.2 16.0 0.5 Tulpehocken Creek 3 22.0 56.9 0.0 0.0 0.0 43.1 0.0 North Branch Mount Misery Brook 3 33.6 84.4 0.3 1.6 1.5 12.2 0.1
Median 3 17.1 56.9 0.0 0.3 0.2 43.1 0.0 Forest Basins
Middle Branch Mount Misery Brook 1 7.5 85.3 0.0 0.0 0.0 14.7 0.0 Buck Run 2 7.8 86.3 0.0 0.0 0.0 13.7 0.0 Skit Branch 3 13.2 80.0 0.0 0.1 0.2 19.7 0.0 Papoose Branch 3 13.4 83.2 0.1 0.0 0.0 16.7 0.0 East Branch Bass River 3 21.4 82.1 0.2 2.0 0.0 15.7 0.0
Median 3 13.3 83.2 0.0 0.0 0.0 15.7 0.0 All Basins Median 3 13.2 56.9 0.1 0.5 0.2 34.1 0.0
Table 2. Results for stream-pattern analysis between cranberry, abandoned-bog, and forest basins. Initial and Bonferroni adjusted pvalues shown for comparison. Bolded results indicate ANOVAssignificant after Bonferroni adjustment.
Stream-pattern Attribute F Initial p Bonferroni Adjusted p
Number of ditches 17.4 0.0003 0.0125 Median ditch length 17.4 0.0003 0.0167 Ditch density 22.2 0.0001 0.0100 Drainage density 0.1 0.9415 0.0500 Sinuosity 0.4 0.7090 0.0250
12
Table 3. Coarse-scale wetland-patch attributes for cranberry, abandoned-bog, and forest basins in the Rancocas Creek and Mullica River watersheds. Basin Type
Study Basin Number of
Wetland PatchesMedian Wetland-patch Size (ha)
Median Wetland-patch Fractal Dimension
Cranberry Basins Batsto River above Route 532 67 2.51 1.31 Hospitality Brook 84 0.97 1.32 Tom Roberts Branch 93 1.71 1.32 Little Hauken Run 123 1.74 1.31 Pole Bridge Branch 516 1.67 1.31
Median 93 1.71 1.31 Abandoned-bog Basins
Shane Branch 86 1.82 1.31 Deep Run 88 1.88 1.33 West Branch Bass River 106 1.19 1.32 North Branch Mount Misery Brook 140 1.29 1.32 Tulpehocken Creek 169 1.90 1.33
Median 106 1.82 1.32 Forest Basins
Buck Run 44 1.19 1.33 Middle Branch Mount Misery Brook 50 0.96 1.29 Skit Branch 58 2.26 1.33 Papoose Branch 81 1.52 1.33 East Branch Bass River 144 1.17 1.33
Median 58 1.19 1.33
13
Table 4. Wetland cover-type classes present in 15 Mullica River and Rancocas Creek study basins. Dominant and sub-dominant cover types are separated by a slash. Bolded rows represent the major wetland classes and the sum of the patch values within a particular wetland class. Data are from 1995/1997 NJDEP Land use/Land cover update (2001). Wetlands were classified according to Cowardin et al. (1979).
Wetland Type Code Wetland Type Description
Number of Wetland
Patches
Percentageof Wetland
Patches
Percentage of Wetland
Area PFO1 Hardwood Forest (Palustrine Broad Leaved Deciduous Forest) 271 14.0 12.0
PFO1 Palustrine Broad Leaved Deciduous Forest 153 7.9 5.9 PFO1/3 Palustrine Broad Leaved Deciduous/Evergreen Forest 4 0.2 0.3 PFO1/4 Palustrine Broad Leaved Deciduous/Needle Leaved Evergreen Forest 74 3.8 4.2 PFO1/8 Palustrine Broad Leaved Deciduous/White Cedar Forest 33 1.7 1.0 PFO1/PSS1 Palustrine Broad Leaved Deciduous/Scrub-Shrub Forest 7 0.4 0.5
PFO3 Palustrine Broad Leaved Evergreen Forest 2 0.1 0.1 PFO4 Pine lowland Forest (Palustrine Needle Leaved Evergreen Forest) 554 28.6 31.2
PFO4 Palustrine Needle Leaved Evergreen Forest 352 18.2 18.2 PFO4/1 Palustrine Needle Leaved Evergreen/Broad Leaved Deciduous Forest 196 10.1 12.6 PFO4/3 Palustrine Needle Leaved Evergreen/Broad Leaved Evergreen Forest 3 0.2 0.1 PFO4/8 Palustrine Needle Leaved Evergreen/White Cedar Forest 3 0.2 0.2
PFO8 Cedar Forest (Palustrine White Cedar Forest) 194 10.0 13.8 PFO8 Palustrine White Cedar Forest 116 6.0 5.3 PFO8/1 Palustrine White Cedar/Broad Leaved Deciduous Forest 76 3.9 8.4 PFO8/4 Palustrine White Cedar/Needle Leaved Evergreen Forest 2 0.1 0.1
PSS1 Deciduous Scrub-shrub (Palustrine Broad Leaved Deciduous Scrub-shrub) 378 19.5 12.3 PSS1 Palustrine Broad Leaved Deciduous Scrub-Shrub 276 14.3 7.0 PSS1/3 Palustrine Broad Leaved Deciduous/Broad Leaved Evergreen Scrub-Shrub 8 0.4 0.4 PSS1/4 Palustrine Broad Leaved Deciduous/Needle Leaved Evergreen Scrub-Shrub 54 2.8 2.1 PSS1/8 Palustrine Broad Leaved Deciduous/White Cedar Scrub-Shrub 24 1.2 0.8 PSS1/PFO1 Palustrine Broad Leaved Deciduous Scrub-Shrub/Broad Leaved Deciduous Forest 12 0.6 1.9 PSS1/PEM1 Palustrine Broad Leaved Deciduous Scrub-Shrub/Emergent (Persistent) 4 0.2 0.1
PSS3 Evergreen Scrub-shrub (Palustrine Broad Leaved Evergreen Scrub-shrub) 13 0.7 0.4 PSS3 Palustrine Broad Leaved Evergreen Scrub-Shrub 7 0.4 0.2 PSS3/1 Palustrine Broad Leaved Evergreen/Deciduous Scrub-Shrub 5 0.3 0.2 PSS3/4 Palustrine Broad Leaved Evergreen/Needle Leaved Evergreen Scrub-Shrub 1 0.1 0.0
PSS4 Pine lowland Scrub-shrub (Palustrine Needle Leaved Evergreen Scrub-shrub ) 98 5.1 4.2 PSS4 Palustrine Needle Leaved Evergreen Scrub-Shrub 44 2.3 1.1 PSS4/1 Palustrine Needle Leaved Evergreen/Broad Leaved Deciduous Scrub-Shrub 50 2.6 2.5 PSS4/PFO4 Palustrine Needle Leaved Evergreen Scrub-Shrub/Needle Leaved Evergreen Forest 4 0.2 0.5
PSS8 Cedar Scrub-shrub (Palustrine White Cedar Scrub-shrub) 34 1.8 1.5 PSS8 Palustrine White Cedar Scrub-Shrub 9 0.5 0.1 PSS8/1 Palustrine White Cedar/Broad Leaved Deciduous Scrub-Shrub 25 1.3 1.4
PEM1 Palustrine Emergent (Persistent) 159 8.2 5.9 PEM1 Palustrine Emergent (Persistent) 130 6.7 3.7 PEM1/PSS1 Palustrine Emergent (Persistent)/Broad Leaved Deciduous Scrub-Shrub 29 1.5 2.2
E2EM Estuarine Intertidal Emergent 1 0.1 0.0 OW Open Water 121 6.3 5.8
L2OW Lacustrine Littoral Open Water 13 0.7 2.7 POW Palustrine Open Water 99 5.1 3.0 R2OW Riverine Lower Perennial Open Water 1 0.1 0.0 R3OW Riverine Upper Perennial Open Water 8 0.4 0.1
MODAg Wetland Agriculture (Modified Agricultural Wetlands) 85 4.8 12.7 MOD Other Modified Wetlands 24 1.2 0.2
MODD Disturbed areas (surface/vegetation disturbed) 20 1.0 0.2 MODR Right-of-ways (areas maintained by utilities) 4 0.2 0.0
14
Table 5. Intermediate-scale patch attributes for the dominant wetland-cover types in cranberry, abandoned-bog, and forest basins in the Rancocas Creek and Mullica River watersheds. The E2EM, PFO3, and MODAg (wetland agriculture) cover types were not included in the analysis. Refer to Table 4 for explanation of wetland-cover types.
Frequency of Occurrence (%)
Total Number of Patches
Median Cover-type Patch Size (ha)
Median Cover-type Fractal Dimension
Wetland- cover Type Cranberry AbandonedForest Cranberry AbandonedForest CranberryAbandonedForest Cranberry Abandoned ForestPFO4 100 100 100 252 141 101 1.9 2.2 1.4 1.33 1.31 1.34 PSS1 100 100 100 146 103 92 1.7 1.1 1.0 1.31 1.32 1.33 PFO1 100 100 100 108 80 38 2.6 1.7 1.5 1.33 1.33 1.32 OW 100 100 60 83 31 5 1.9 2.6 0.7 1.30 1.30 1.29 PFO8 100 100 100 81 63 43 1.7 1.6 2.5 1.30 1.33 1.33 PEM1 100 100 100 58 65 33 1.2 1.3 0.9 1.31 1.32 1.34 PSS4 80 100 100 42 33 20 1.3 3.1 1.5 1.32 1.30 1.30 MOD 60 40 20 19 2 3 0.3 0.3 0.2 1.32 1.36 1.37 PSS8 60 80 60 16 11 5 1.5 3.4 2.7 1.32 1.33 1.30 PSS3 20 20 40 1 2 8 0.5 1.2 1.8 1.31 1.33 1.32 E2EM - 20 - - 1 - - 0.2 - - 1.35 - PFO3 20 - - 2 - - 4.0 - - 1.33 - - MODAg 100 40 - 79 4 - 3.0 5.0 - 1.28 1.27 -
15
Table 6. Fine-scale patch attributes for wetland-cover types in cranberry, abandoned-bog, and forest basins in the Rancocas Creek and Mullica River watersheds. Refer to Table 4 for explanation of wetland-cover types. MODAg was not included in the analyses.
Frequency of Occurrence (%) Median Percentage of Wetland Area Median Percentage of Wetland PatchesWetland-cover Type Cranberry Abandoned Forest Cranberry Abandoned Forest Cranberry Abandoned Forest PFO4 100 100 100 25.7 19.3 29.0 19.0 20.1 20.8 PFO4/1 100 100 100 13.8 19.9 9.0 12.9 8.6 5.2 PFO8/1 100 100 100 7.7 4.2 8.8 7.1 2.3 4.0 PFO1 100 100 100 7.6 4.9 3.7 8.9 7.1 4.9 PSS1 100 100 100 7.2 7.5 8.6 10.8 12.5 21.5 PEM1 100 100 100 5.3 7.8 3.5 7.1 8.9 6.2 PFO8 100 100 100 1.6 6.9 5.7 3.6 7.0 7.4 POW 100 100 40 7.7 2.5 0.8 8.6 4.3 0.0 PSS1/8 100 60 20 1.5 2.0 0.4 1.9 0.6 0.0 PSS1/4 80 100 100 1.2 2.7 4.7 1.5 3.8 2.0 PFO1/4 80 100 80 1.3 6.6 2.9 2.4 4.7 3.4 PEM1/PSS1 80 80 60 0.6 4.7 2.4 1.6 1.2 1.4 PSS4 60 80 100 0.6 1.8 2.0 1.2 1.8 3.4 PSS4/1 60 80 80 1.9 2.7 3.4 1.6 3.4 2.5 PFO1/8 60 80 60 0.8 1.1 1.5 1.1 2.3 2.0 MODD 60 20 - 0.1 0.0 - 1.2 0.0 0.0 L2OW 60 20 20 4.7 7.0 6.4 1.0 0.0 0.0 PSS8/1 40 80 60 1.2 2.5 1.2 0.0 1.2 0.7 PSS1/PFO1 40 60 20 4.2 1.4 2.1 0.0 0.6 0.0 PSS8 40 40 20 0.3 0.6 0.2 0.0 0.0 0.0 R3OW 40 40 20 0.6 0.2 0.3 0.0 0.0 0.0 PSS1/3 20 40 40 0.2 0.1 4.5 0.0 0.0 0.0 PSS4/PFO4 - 80 - - 2.5 - - 0.7 - PFO1/PSS1 20 40 20 1.1 0.4 1.7 0.0 0.0 0.0 PSS1/PEM1 - 60 - - 0.7 - - 0.9 - PSS3/1 20 - 40 0.0 - 3.0 0.0 - 0.0 PFO4/3 - - 40 - - 4.3 - - 0.0 PFO4/8 40 - - 2.9 - - 0.0 - - PFO8/4 - 20 20 - 0.4 2.8 - 0.0 0.0 PSS3 - 20 20 - 0.3 5.4 - 0.0 0.0 MODR - 20 20 - 0.2 0.2 - 0.0 0.0 PFO1/3 20 - 20 0.8 - 2.7 0.0 - 0.0 PSS3/4 - - 20 - - 1.2 - - 0.0 E2EM1 - 20 - - 0.1 - - 0.0 - R2OW - 20 - - 0.1 - - 0.0 - PFO3/1 20 - - 0.3 - - 0.0 - - MODAg 100 40 - 15.8 0.0 - 8.7 0.0 -
16
Table 7. MRPP results for percentage of wetland patches per cover type for cranberry, abandoned-bog, and forest basins. Bolded results were significant before Bonferroni significance-level adjustment. Comparisons A Initial p value Bonferroni p value All basin types 0.065 0.026 -
Cranberry vs Forest 0.081 0.027 0.017 Cranberry vs Abandoned-bog 0.041 0.093 0.025 Abandoned-bog vs Forest 0.027 0.171 0.050
Table 8. Fine-scale wetland-patch attributes for cranberry, abandoned-bog, and forest
basins in the Rancocas Creek and Mullica River watersheds. Basin Type
Study Basin Wetland Cover- type Richness
Shannon’s Evenness (J)
Cranberry Basins Batsto River above Route 532 11 0.84 Hospitality Brook 16 0.86 Tom Roberts Branch 16 0.84 Little Hauken Run 17 0.87 Pole Bridge Branch 27 0.83
Median 16 0.84 Abandoned-bog Basins
Shane Branch 20 0.89 Deep Run 16 0.85 West Branch Bass River 20 0.86 North Branch Mount Misery Brook 18 0.83 Tulpehocken Creek 24 0.85
Median 20 0.85 Forest Basins
Buck Run 14 0.87 Middle Branch Mount Misery Brook 12 0.83 Skit Branch 13 0.79 Papoose Branch 22 0.87 East Branch Bass River 20 0.81
Median 14 0.83
17

18
Figure 2. Box plots showing the 10th, 25th, 50th (median), 75th and 90th percentiles for five stream-pattern variables in cranberry, abandoned-bog, and forest basins. Basin types with the same letters were not significantly different based on Tukey HSD.
1.00
1.05
1.10
1.15
1.20
1.25
1.30
Cranberry (a) Abandoned (a) Forest (a)
Sin
uosi
ty
0.0
0.5
1.0
1.5
2.0
2.5
Cranberry (a) Abandoned (a) Forest (a)
Dra
inag
e D
ensi
ty (k
m/k
m2 )
0
100
200
300
400
500
Cranberry (a) Abandoned (a) Forest (b)
Num
ber o
f Ditc
hes
0.0
0.5
1.0
1.5
2.0
2.5
Cranberry (a) Abandoned (a) Forest (b)
Ditc
h D
ensi
ty (k
m/k
m2 )
0.0
2.0
4.0
6.0
8.0
10.0
12.0
Cranberry (a) Abandoned (a) Forest (b)
Med
ian
Ditc
h Le
ngth
(m)
19
PART 2. HYDROLOGIC AND MORPHOLOGIC VARIABILITY OF STREAMS DRAINING ACTIVE-CRANBERRY BOGS, ABANDONED-CRANBERRY BOGS, AND FOREST LAND
Nicholas A. Procopio
Abstract
In the New Jersey Pinelands, the creation of reservoirs and modification of stream channels
are common practices used to facilitate the efficient production of cranberries. The potential impacts to hydrologic and geomorphic aspects of streamflow and channel structure have not been adequately addressed. In this study, the streamflow regimes of twelve sites and the stream-channel morphologies of eleven sites were compared for basins with upstream active-cranberry agriculture, upstream abandoned-cranberry bogs, and basins with no apparent history of agriculture. Measures of flow regime included median basin-area normalized discharge values, three measures of streamflow variability (interquartile range, spread, and a modified Richards-Baker Flashiness Index), and the frequency of overbank flooding. Measures of stream-channel morphology included bank slope, bankfull width, bankfull depth, bankfull width/depth ratio, and bankfull area. Strong relationships existed between some of the flow-regime and channel-morphology metrics. Although no significant difference in these metrics was found between stream types, some general trends suggested that the relationship between channel morphology and flow regime might be partly related to land use. In general, cranberry streams had steeper banks, greater bankfull depths, and lower bankfull width/depth ratios, whereas the gentlest slopes, shallowest channels, and highest width/depth ratios were associated with abandoned-bog streams. Higher values of bankfull-width and bankfull cross-sectional area characterized forest streams. Discharge and the frequency of overbank flooding were highest and spread was lowest for cranberry streams compared to the other two stream types.
Introduction The cranberry is a major agricultural resource in the New Jersey Pinelands. To facilitate
the cultivation and harvest of cranberries, large reservoirs are often created upstream of the bogs by damming stream segments (Eck 1990). The reservoirs accommodate the large amount of water needed for seasonal harvests, either in late summer or autumn, for winter and spring flooding to prevent against frost, and for irrigation and pest control. More commonly, spray irrigation technology is utilized for irrigation during the growing season and to prevent against frost damage. Ditching and channelizing stream channels is another common practice in modern and historic cranberry cultivation (Eck 1990, Procopio and Bunnell 2006). Ditches accommodate the need to move water from bog to bog during harvests or flooding events. Channelization allows for a quick and efficient way to draw water for irrigating, harvesting, or flooding and to rapidly remove water off bogs after flooding events (Eck 1990).
Upstream reservoirs and stream channelization may affect the natural flow dynamics of
streams. Reservoirs can decrease peak flows and reduce variability in unaltered stream reaches (Gordon et al. 1992, Allan 1995, Whiting 2002). Diversions of stream flow, if large enough, can alter morphologic characteristics of the stream channel by decreasing stream width and depth (Brinson et al. 1981, Whiting 2002). Channelization can lead to reduction of water, sediments and
20
nutrients to the flood plain as well as increase channel width, channel depth, and gradient while removing any natural meander pattern in the channelized section and increase peak flows downstream (Brinson et al. 1981, Gordon et al. 1992). These alterations, along with riparian vegetation removal associated with channelization, have the potential to impact aquatic communities (Keller 1978, Vannote et al. 1980, Poff and Ward 1989, Gordon et al. 1992, Poff and Allan 1995, Richter et al. 1996, Poff et al. 1997, Bunn and Arthington 2002, Olden and Poff 2003).
The hydrologic and geomorphic variability imposed by stream-channel alterations and water manipulation in drainages containing large areas of cranberry bogs, either active or abandoned, have not been adequately addressed in the Pinelands. I studied streams that drain three land uses, including those that drain active-cranberry agriculture, abandoned-cranberry agriculture, and forest basins with no apparent history of agriculture. I addressed two major questions. First, is stream discharge and discharge variability related to past or present land uses? Secondly, are there differences in stream morphology between land uses?
Methods
This study was limited to twelve acid-water streams in the Mullica River and Rancocas Creek basins in the outer-coastal plain province of southern New Jersey (Figure 1). The twelve study basins were located in the Wading River, Oswego River, Bass River, and Batsto River systems in the Mullica River Basin and Greenwood Branch in the Rancocas Creek basin. The study sites were located in basins with upstream active-cranberry agriculture (cranberry sites), upstream abandoned-cranberry agriculture (abandoned-bog sites), and forested basins with no apparent history of cranberry agriculture (forest sites). Drainage basin areas range from 4.6 to 56.7 square kilometers. The selected study basins contain minimal altered land (developed land and upland agriculture) (Figure 1, Table 1). The data set used to create the land-use profiles uses a modified Anderson et al. (1976) system. In this paper, I refer to the Anderson-type land-use classes of urban land, agriculture, and agricultural wetlands as developed land, upland agriculture, and wetland agriculture, respectively. Collectively, developed land and upland agriculture are referred to as altered land. Wetland agriculture includes cranberry bogs and blueberry fields. Most wetland agriculture in the study basins is cranberry agriculture.
A network of partial-record stream-discharge stations, consisting of staff gages and high-
flow crest gages, was established to gather discharge data at eleven of the twelve monitoring sites. High-flow crest gages were used to determine the maximum staff reading between site visits and the number of overbank flooding events. Average-daily discharge data for an additional site (McDonalds Branch) were obtained from the United States Geological Survey (USGS). All staff gages and high-flow crest gages were measured weekly to monthly on the same day between October 2000 and September 2003. Based on USGS convention, I refer to the three separate October to September monitoring periods as individual water years. Thirty-four readings were made in the first water year (October 2000 - September 2001), nineteen readings were made in the second water year (2001 – 2002), and thirteen readings were made in the third water year (2002 – 2003). Dates when a stream was dry were recorded as having zero flow. Bankfull discharge values were used for dates when overbank flooding occurred. After removing dates when a stream was frozen, the period of record included a total of 63 to 66 staff gage and high-flow crest gage measurements for each of the twelve study sites.
21
Instantaneous discharge measurements were made under a variety of flow conditions for
the eleven partial-record stream-discharge stations during the study period. Instantaneous discharge measurements were made using a Pygmy meter, a Price AA meter, or a portable Parshall flume depending on in-stream flow conditions (Carter and Davidian 1968, Rantz 1982).
Measured discharge values and staff-gage readings were used to create rating curves for
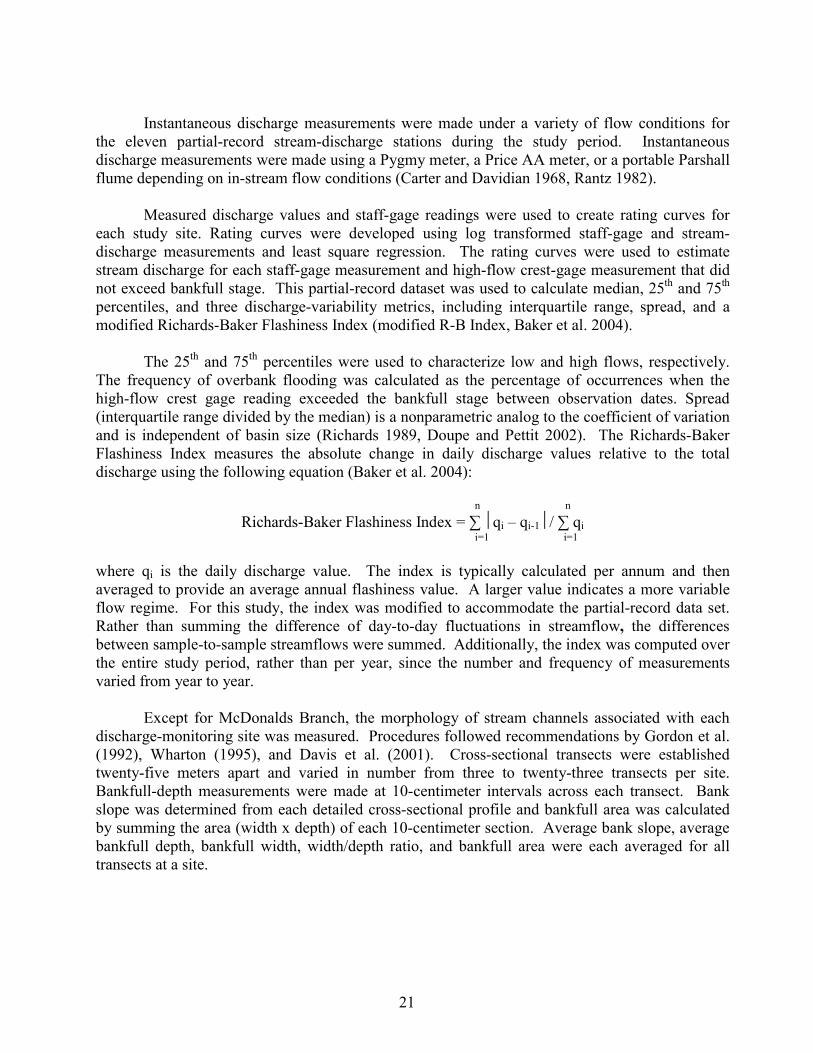
each study site. Rating curves were developed using log transformed staff-gage and stream-discharge measurements and least square regression. The rating curves were used to estimate stream discharge for each staff-gage measurement and high-flow crest-gage measurement that did not exceed bankfull stage. This partial-record dataset was used to calculate median, 25th and 75th percentiles, and three discharge-variability metrics, including interquartile range, spread, and a modified Richards-Baker Flashiness Index (modified R-B Index, Baker et al. 2004).
The 25th and 75th percentiles were used to characterize low and high flows, respectively.
The frequency of overbank flooding was calculated as the percentage of occurrences when the high-flow crest gage reading exceeded the bankfull stage between observation dates. Spread (interquartile range divided by the median) is a nonparametric analog to the coefficient of variation and is independent of basin size (Richards 1989, Doupe and Pettit 2002). The Richards-Baker Flashiness Index measures the absolute change in daily discharge values relative to the total discharge using the following equation (Baker et al. 2004):
n n
Richards-Baker Flashiness Index = ∑ qi – qi-1/ ∑ qi i=1 i=1
where qi is the daily discharge value. The index is typically calculated per annum and then averaged to provide an average annual flashiness value. A larger value indicates a more variable flow regime. For this study, the index was modified to accommodate the partial-record data set. Rather than summing the difference of day-to-day fluctuations in streamflow, the differences between sample-to-sample streamflows were summed. Additionally, the index was computed over the entire study period, rather than per year, since the number and frequency of measurements varied from year to year.
Except for McDonalds Branch, the morphology of stream channels associated with each
discharge-monitoring site was measured. Procedures followed recommendations by Gordon et al. (1992), Wharton (1995), and Davis et al. (2001). Cross-sectional transects were established twenty-five meters apart and varied in number from three to twenty-three transects per site. Bankfull-depth measurements were made at 10-centimeter intervals across each transect. Bank slope was determined from each detailed cross-sectional profile and bankfull area was calculated by summing the area (width x depth) of each 10-centimeter section. Average bank slope, average bankfull depth, bankfull width, width/depth ratio, and bankfull area were each averaged for all transects at a site.
22
Data Analysis
Ten variables, including median discharge, the frequency of overbank flooding, three discharge-variability measures (interquartile range, spread, and modified R-B index), and five stream morphology measures (bank slope, bankfull width, bankfull depth, bankfull area, and width/depth ratio), were compared between the three stream types. Median discharge and frequency of overbank flooding were each analyzed using Analysis of Variance (ANOVA) on ranked data. The three discharge-variability measures and the five stream morphology measures were analyzed using multivariate analysis of variance (MANOVA) on ranked data. Discharge measurements were normalized by drainage basin area to allow for comparison between sites. Spearman rank correlation was used to test the intercorrelation of each of the ten variables and study-basin characteristics, including basin area, stream order, percentage wetland agriculture, and percentage altered land. All MANOVAs and ANOVAs were completed using ranked data because requirements of normality and homogeneity of variance could not be met by log transformations (Helsel and Hirsch 1992).
Results and Discussion
Stream Discharge Streamflow varied greatly among the 12 monitoring sites. Over the three-year study period, the median basin-area normalized flow for the 12 sites ranged from 0.001 cubic meters per second/square kilometer (cms/km2) at North Branch Mount Misery Brook to 0.047 cms/km2 at Hospitality Brook (Table 2). Based on precipitation data from a nearby location (Office of the State Climatologist of New Jersey 2006), the October 2001 to September 2002 water year was the driest of the three periods and the October 2002 to September 2003 water year was the wettest (Table 3). Median annual discharge was lowest at all twelve sites during the second water year. Except for two monitoring sites, median annual discharge was greatest during the third water year. The two exceptions were Tom Roberts Branch, a cranberry stream, and Papoose Branch, a forest stream.
Overall, median discharge was greatest in cranberry streams and lowest in abandoned-bog streams (Figure 2, Table 2), but the difference between stream types was not significant (ANOVA, F2,9 = 0.930, p = 0.429). The two sites with the highest median discharge were Hospitality Brook and Little Hauken Run. Both are first order cranberry streams. Streamflow Variability
The interquartile range of all the monitoring sites ranged from 0.001 cms/km2 at Pole Bridge Branch to a maximum of 0.033 cms/km2 at Hospitality Brook. The median value for all twelve monitoring sites was 0.010 cms/km2. Median interquartile range was greatest in cranberry streams and lowest in forest streams, but the difference between them was minimal (Table 2).
Spread, which is a measure of streamflow variability, was greatest during the first year for
a majority of the study sites. The two sites with the highest spread values, North Branch Mount Misery Brook, an abandoned-bog site, and Middle Branch Mount Misery Brook, a forest site, are
23
neighboring streams in the eastern portion of the Rancocas Creek Basin (Figure 1). Middle Branch Mount Misery Brook was intermittent, a feature that can produce high spread values. Cranberry sites displayed the lowest spread values, indicating the least variable stream-flow conditions over the study period (Figure 3, Table 2). This may be due to the presence of upstream reservoirs, which can reduce streamflow variability downstream (Gordon et al 1992, Allan 1995, Whiting 2002). The modified Richards-Baker index ranged from 0.18 at Papoose Branch, a forest site, to a maximum of 0.59 at Tulpehocken Creek, a basin with extensive abandoned-bog complexes. The median R-B index value of all twelve sites was 0.38. Median R-B index values were highest for abandoned-bog sites, intermediate for cranberry sites, and lowest for forest sites (Figure 4, Table 2). This indicates that streamflow between observation dates was least variable for forest sites. Although some general differences in streamflow variability were observed, the results of the MANOVA indicated no significant overall difference in interquartile range, spread, or the modified R-B index between stream types (MANOVA, Wilks’ lambda = 0.408, F6,14 = 1.32, p = 0.312). There were strong correlations among several of the variables (Tables 4, 5). All three variability metrics (interquartile range, spread, and modified R-B index) were correlated to median streamflow. The interquartile range was positively correlated with median discharge, showing that, as median discharge at a site increased, so did the relative range of low and high flows. The spread and modified R-B index were both negatively correlated with the median discharge indicating that streams with higher median flows are less variable. Both spread and the modified R-B index showed a negative correlation with bankfull depth and bankfull area. Additionally, spread was negatively correlated with the bank slope and positively correlated with width to depth ratio. Study streams with deeper channels, a larger cross-sectional area, and steeper banks tend to be less variable. The interquartile range was not correlated with any of the stream morphology measures. Due to the large number of comparisons, conclusions regarding the statistical significance of these associations cannot be made. Flooding Frequency
Flooding occurred within each stream type (Figure 5). Although no significant difference in flooding frequency was found between stream types (ANOVA, F2,8 = 1.568, p = 0.266), over the entire study period, flooding occurred most frequently at cranberry sites and least frequently at forest sites (Figure 5). For each water year, average flooding frequency was greatest in cranberry sites and lowest in forest sites. The highest overall frequency of overbank flooding occurred at two cranberry sites, Hospitality Brook (34% of observation dates) and Little Hauken Run (62% of observation dates). The higher rates of flooding at the cranberry sites are most likely due to the need to drain water off the bogs rapidly and periodic water releases related to harvesting, frost protection and pest control (Eck 1990).
As mentioned previously, precipitation was highest in the third water year and lowest in the
second water year (Table 3). The highest average flooding frequencies for all three basin types occurred during the third water year, coinciding with the greatest annual precipitation. During the drier second water year, flooding occurred during nine of the twelve months at the cranberry sites,
24
whereas flooding occurred only in June at the abandoned-bog and forest sites. June coincided with the highest monthly precipitation for that water year.
Papoose Branch experienced a higher percentage of overbank flooding (26% of observation dates) compared to the other forest sites. Because forested basins in the Pinelands are predominately groundwater fed, the higher frequency of flooding at Papoose Branch was unexpected (Rhodehamel 1979, Poff and Ward 1989). Two sites, Middle Branch Mount Misery Brook, a forest site, and West Branch Bass River, an abandoned-bog site, did not experience overbank flooding during the study period. An impoundment upstream from the West Branch Bass River site may have reduced the potential for overbank flooding.
Stream Morphology
Results of the MANOVA did not indicate any significant overall difference in bank slope, bankfull width, bankfull depth, bankfull area, or width/depth ratio between stream types (MANOVA, Wilks’ lambda = 0.057, F10,8 = 2.553, p = 0.099). However, several general differences between stream types were apparent (Table 6). Based on median values, cranberry streams had steeper banks, greater bankfull depths, and lower bankfull width/depth ratios, whereas the gentlest slopes, shallowest channels, and highest width/depth ratios were associated with abandoned-bog streams. Higher bankfull widths and bankfull cross-sectional areas characterized forest streams. Many of the stream morphology metrics were intercorrelated (Table 5). Bankfull depth and width to depth ratios were negatively correlated. Bankfull depth was also strongly correlated with bankfull area. Additionally, bankfull area was negatively correlated with width to depth ratios. Bank slope was positively correlated with bankfull depth and bankfull area. These relationships indicate that larger and deeper streams have steeper banks. The negative association between bank slope and width to depth ratios lends support to the previous statement and suggests that bank slope tends to be greater in cranberry streams with deeper and narrower channels. Bankfull width was not correlated with any of the morphologic variables but it was the only variable associated with basin area. Although there were no statistical differences between groups, the width to depth ratio was negatively correlated with the percentage wetland-agriculture in a basin. This suggests that wetland agriculture (cranberry) is associated with relatively narrow and deep channels. Due to the large number of comparisons, conclusions regarding the statistical significance of these associations cannot be made.
Acknowledgements I thank Robert Zampella, John Bunnell, Kim Laidig, Jennifer Ciraolo, Christina Burns, and Jason Shvanda for assisting with various aspects of this study. The New Jersey Division of Parks and Forestry authorized the state-lands research permits. Funding for this study was provided by the U. S. Environmental Protection Agency (State Wetlands Grant Program, Grant No. CD-99298001-1), the Pinelands Commission, and the National Park Service.
25
Literature Cited Allan, J. D. 1995. Stream ecology: structure and function of running waters. Chapman and Hall, London, England. Anderson, J. R., E. E. Hardy, J. T. Roach, and R. E. Witmer. 1976. A land use and land cover classification system for use with remote sensor data. U.S. Geological Survey Professional Paper 964. Baker, D. B., R. P. Richards, T. T. Loftus, and J. W. Kramer. 2004. A new flashiness index: characteristics and applications to midwestern rivers and streams. Journal of the American Water Resources Association 40:503-522. Brinson, M. M., B. L. Swift, R. C. Plantico, and J. S. Barclay. 1981. Riparian Ecosystems: Their ecology and Status. U. S. Fish and Wildlife Service, FWS/OBS-81/17. Kearneysville, WV. 155 pp. Bunn, S. E., and A. H. Arthington. 2002. Basic principles and ecological consequences of altered flow regimes for aquatic biodiversity. Environmental Management 30:492-507. Carter, R. W., and J. Davidian. 1968. General procedure for gaging streams. Techniques of Water-Resources Investigations of the U. S. Geological Survery. Book 3. Chapter A6. 13 pp. Davis, J. C., W. G. Minshall, C. T. Robinson, and P. Landres. 2001. Monitoring Wilderness Stream Ecoysystems. United States Department of Agriculture, Forest Service, Rockey Mountain Research Station, General Technical Report RMRS-GTR-70. Ogden, Utah. 139 pp. Doupe, R. G., and N. E. Pettit. 2002. Ecological perspective on regulation and water allocation for the Ord River, Western Australia. River Research and Application 18:307-320. Eck, P. 1990. The American Cranberry. Rutgers University Press. New Brunswick, N.J. Gordon, N. D., T. A. McMahon, and B. L. Finlayson. 1992. Stream hydrology: an introduction for ecologists. John Wiley & Sons, West Sussex, England. Helsel, D. R., and R. M. Hirsch. 1992. Statistical methods in water resources. Elsevier Science Publishing Company Inc, New York. Keller, E. A. 1978. Pools, Riffles, and Channelization. Environmental Geology 2:119-127. New Jersey Department of Environmental Protection (NJDEP). 1996. New Jersey Geographic Information System CD-ROM, Series 1, Volumes 1 - 4. Office of the State Climatologist of New Jersey. 2006. Monthly Precipitation data for Indian Mills, New Jersey. http://climate.rutgers.edu/stateclim_v1/monthlydata/index.html.
26
Olden, J. D., and N. L. Poff. 2003. Redundancy and the choice of hydrologic indices for characterizing streamflow regimes. River Research and Applications 19:101-121. Poff, N. L., and J. D. Allan. 1995. Functional organization of stream fish assemblages in relation to hydrological variability. Ecology 76:606-627. Poff, N. L., J. D. Allan, M. B. Bain, J. R. Karr, K. L. Prestegaard, B. D. Richter, R. E. Sparks, and J. C. Stromberg. 1997. The natural flow regime: a paradigm for river conservation and restoration. Bioscience 47:769-784. Poff, N. L., and J. V. Ward. 1989. Implications of streamflow variability and predictability for lotic community structre: a regional analysis of streamflow patterns. Canadian Journal of Fisheries and Aquatic Science 46:1805-1818. Procopio, N. A. J. F. Bunnell. 2006. A comparison of stream patterns and wetland landscapes in Pinelands basins draining active-cranberry bogs, abandoned bogs, and forest land. Pages 1-18 in: R. A. Zampella et al. Monitoring the ecological integrity of Pinelands wetlands: A comparison of wetland landscapes, hydrology, and stream communities in Pinelands watersheds draining active-cranberry bogs, abandoned-cranberry bogs, and forest land. Pinelands Commission, New Lisbon, NJ. Pinelands Commission, New Lisbon, NJ. Rantz, S. E. 1982. Measurement and computation of streamflow: volume 1. Measurement of stage and discharge. U. S. Geological Survey Water-supply Paper 2175. Rhodehamel, E. C. 1979. Hydrology of the New Jersey Pine Barrens. Pages 147-167 in R. T. T. Forman, editor. Pine Barrens: ecosystems and landscape. Rutgers University Press, New Brunswick, N.J. Richards, R. P. 1989. Measures of flow variability for Great Lakes tributaries. Environmental Monitoring and Assessment 12:361-377. Richter, B. D., J. V. Baumgartner, J. Powell, and D. P. Braun. 1996. A method for assessing hydrologic alteration within ecosystems. Conservation Biology 10:1163-1174. Wharton, G. 1995. The channel geometry method: Guidelines and applications. Earth Surface Processes and Landforms 20:649-660. Whiting, P. J. 2002. Streamflow necessary for environmental maintenance. Annual Review of Earth and Planetary Science 30:181-206. Vannote, R. L., G. W. Minshall, K. W. Cummins, J. R. Sedell, and C. E. Cushing. 1980. The river continuum concept. Canadian Journal of Fisheries and Aquatic Science 37:130-137.
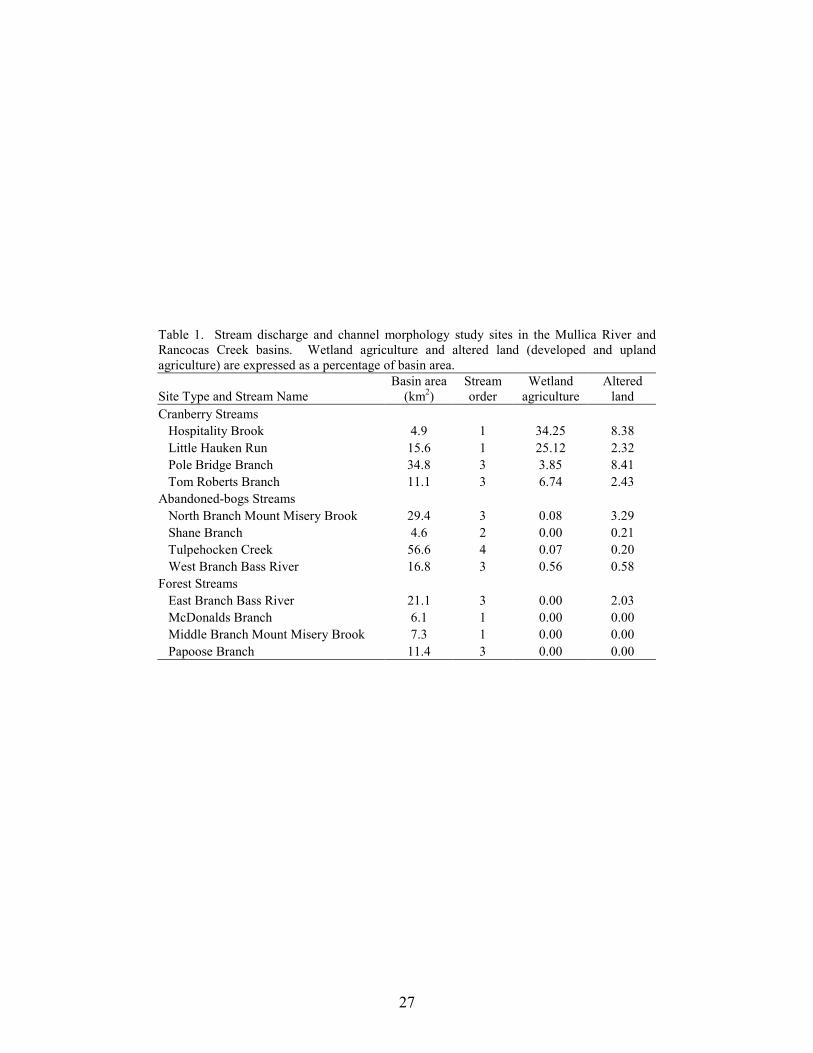
27
Table 1. Stream discharge and channel morphology study sites in the Mullica River and Rancocas Creek basins. Wetland agriculture and altered land (developed and upland agriculture) are expressed as a percentage of basin area.
Site Type and Stream Name Basin area
(km2) Stream order
Wetland agriculture
Altered land
Cranberry Streams Hospitality Brook 4.9 1 34.25 8.38 Little Hauken Run 15.6 1 25.12 2.32 Pole Bridge Branch 34.8 3 3.85 8.41 Tom Roberts Branch 11.1 3 6.74 2.43 Abandoned-bogs Streams North Branch Mount Misery Brook 29.4 3 0.08 3.29 Shane Branch 4.6 2 0.00 0.21 Tulpehocken Creek 56.6 4 0.07 0.20 West Branch Bass River 16.8 3 0.56 0.58 Forest Streams East Branch Bass River 21.1 3 0.00 2.03 McDonalds Branch 6.1 1 0.00 0.00 Middle Branch Mount Misery Brook 7.3 1 0.00 0.00 Papoose Branch 11.4 3 0.00 0.00
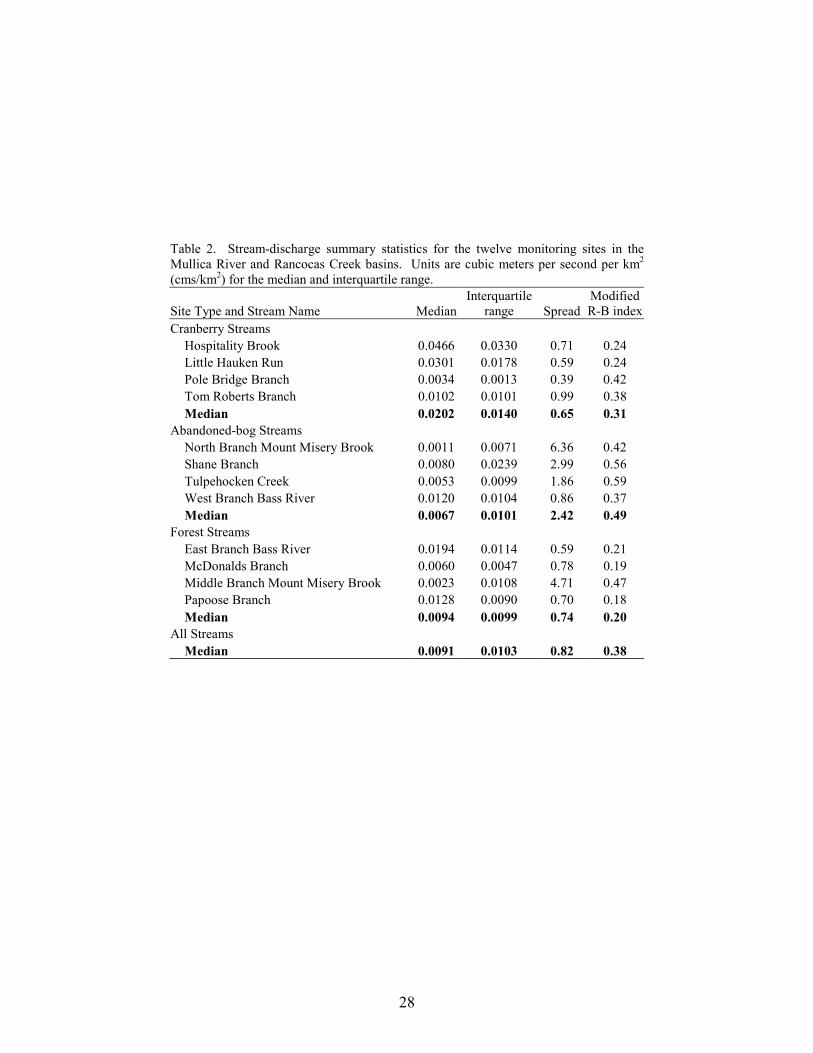
28
Table 2. Stream-discharge summary statistics for the twelve monitoring sites in the Mullica River and Rancocas Creek basins. Units are cubic meters per second per km2 (cms/km2) for the median and interquartile range.
Site Type and Stream Name MedianInterquartile
range Spread Modified R-B index
Cranberry Streams Hospitality Brook 0.0466 0.0330 0.71 0.24 Little Hauken Run 0.0301 0.0178 0.59 0.24 Pole Bridge Branch 0.0034 0.0013 0.39 0.42 Tom Roberts Branch 0.0102 0.0101 0.99 0.38 Median 0.0202 0.0140 0.65 0.31 Abandoned-bog Streams North Branch Mount Misery Brook 0.0011 0.0071 6.36 0.42 Shane Branch 0.0080 0.0239 2.99 0.56 Tulpehocken Creek 0.0053 0.0099 1.86 0.59 West Branch Bass River 0.0120 0.0104 0.86 0.37 Median 0.0067 0.0101 2.42 0.49 Forest Streams East Branch Bass River 0.0194 0.0114 0.59 0.21 McDonalds Branch 0.0060 0.0047 0.78 0.19 Middle Branch Mount Misery Brook 0.0023 0.0108 4.71 0.47 Papoose Branch 0.0128 0.0090 0.70 0.18 Median 0.0094 0.0099 0.74 0.20 All Streams Median 0.0091 0.0103 0.82 0.38
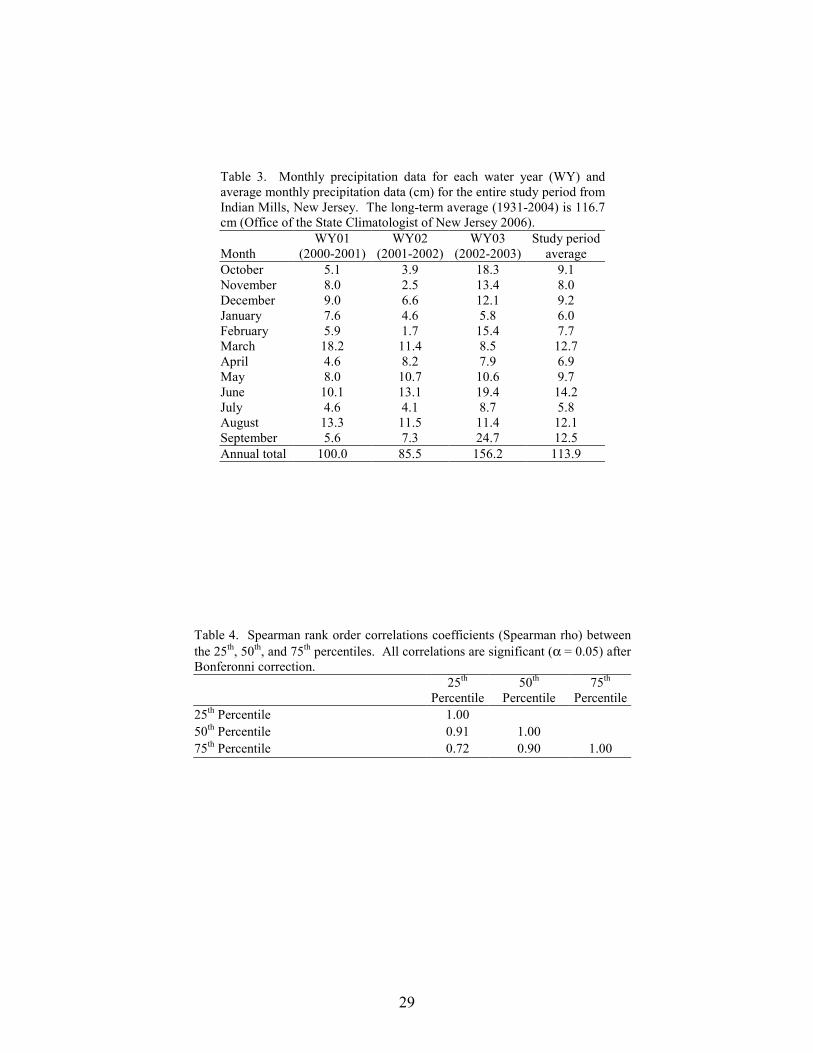
29
Table 3. Monthly precipitation data for each water year (WY) andaverage monthly precipitation data (cm) for the entire study period from Indian Mills, New Jersey. The long-term average (1931-2004) is 116.7 cm (Office of the State Climatologist of New Jersey 2006).
Month WY01
(2000-2001)WY02
(2001-2002)WY03
(2002-2003)Study period
average October 5.1 3.9 18.3 9.1 November 8.0 2.5 13.4 8.0 December 9.0 6.6 12.1 9.2 January 7.6 4.6 5.8 6.0 February 5.9 1.7 15.4 7.7 March 18.2 11.4 8.5 12.7 April 4.6 8.2 7.9 6.9 May 8.0 10.7 10.6 9.7 June 10.1 13.1 19.4 14.2 July 4.6 4.1 8.7 5.8 August 13.3 11.5 11.4 12.1 September 5.6 7.3 24.7 12.5 Annual total 100.0 85.5 156.2 113.9
Table 4. Spearman rank order correlations coefficients (Spearman rho) between the 25th, 50th, and 75th percentiles. All correlations are significant (α = 0.05) after Bonferonni correction.
25th
Percentile50th
Percentile 75th
Percentile 25th Percentile 1.00 50th Percentile 0.91 1.00 75th Percentile 0.72 0.90 1.00
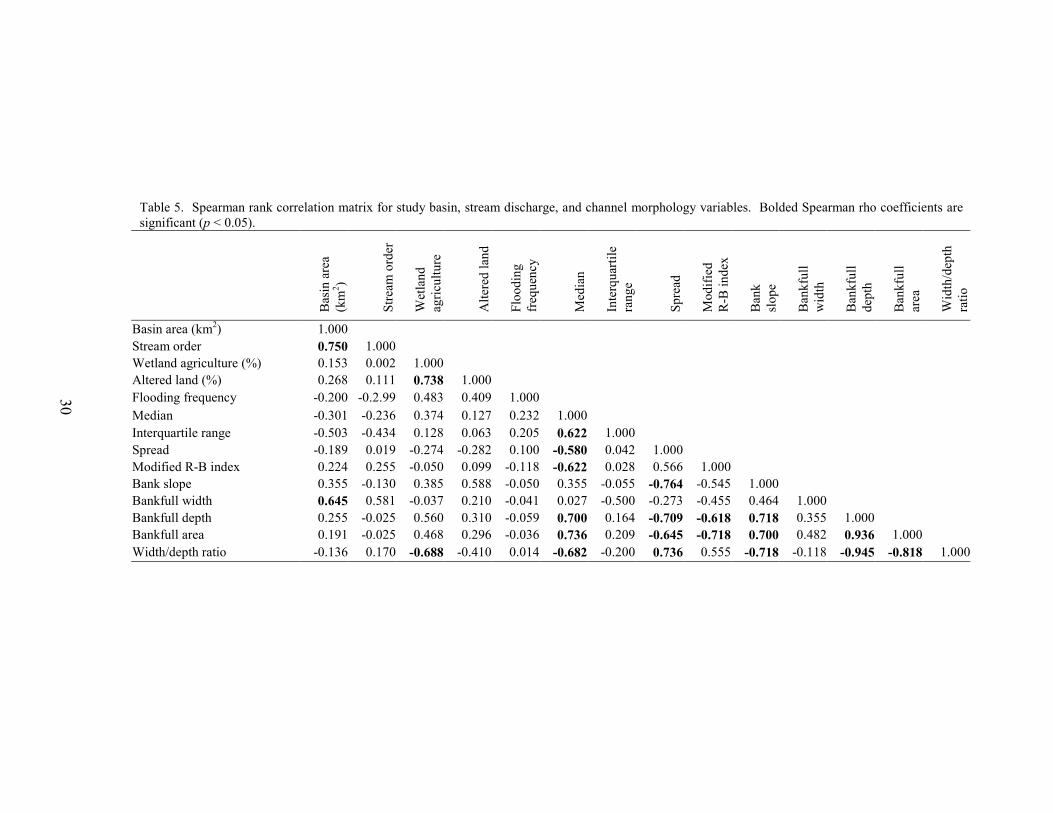
30
Table 5. Spearman rank correlation matrix for study basin, stream discharge, and channel morphology variables. Bolded Spearman rho coefficients are significant (p < 0.05).
Bas
in a
rea
(km
2 )
Stre
am o
rder
Wet
land
ag
ricul
ture
Alte
red
land
Floo
ding
fr
eque
ncy
Med
ian
Inte
rqua
rtile
ra
nge
Spre
ad
Mod
ified
R
-B in
dex
Ban
k sl
ope
Ban
kful
l w
idth
Ban
kful
l de
pth
Ban
kful
l ar
ea
Wid
th/d
epth
ra
tio
Basin area (km2) 1.000Stream order 0.750 1.000Wetland agriculture (%) 0.153 0.002 1.000Altered land (%) 0.268 0.111 0.738 1.000Flooding frequency -0.200 -0.2.99 0.483 0.409 1.000Median -0.301 -0.236 0.374 0.127 0.232 1.000Interquartile range -0.503 -0.434 0.128 0.063 0.205 0.622 1.000Spread -0.189 0.019 -0.274 -0.282 0.100 -0.580 0.042 1.000Modified R-B index 0.224 0.255 -0.050 0.099 -0.118 -0.622 0.028 0.566 1.000Bank slope 0.355 -0.130 0.385 0.588 -0.050 0.355 -0.055 -0.764 -0.545 1.000Bankfull width 0.645 0.581 -0.037 0.210 -0.041 0.027 -0.500 -0.273 -0.455 0.464 1.000Bankfull depth 0.255 -0.025 0.560 0.310 -0.059 0.700 0.164 -0.709 -0.618 0.718 0.355 1.000Bankfull area 0.191 -0.025 0.468 0.296 -0.036 0.736 0.209 -0.645 -0.718 0.700 0.482 0.936 1.000Width/depth ratio -0.136 0.170 -0.688 -0.410 0.014 -0.682 -0.200 0.736 0.555 -0.718 -0.118 -0.945 -0.818 1.000
30
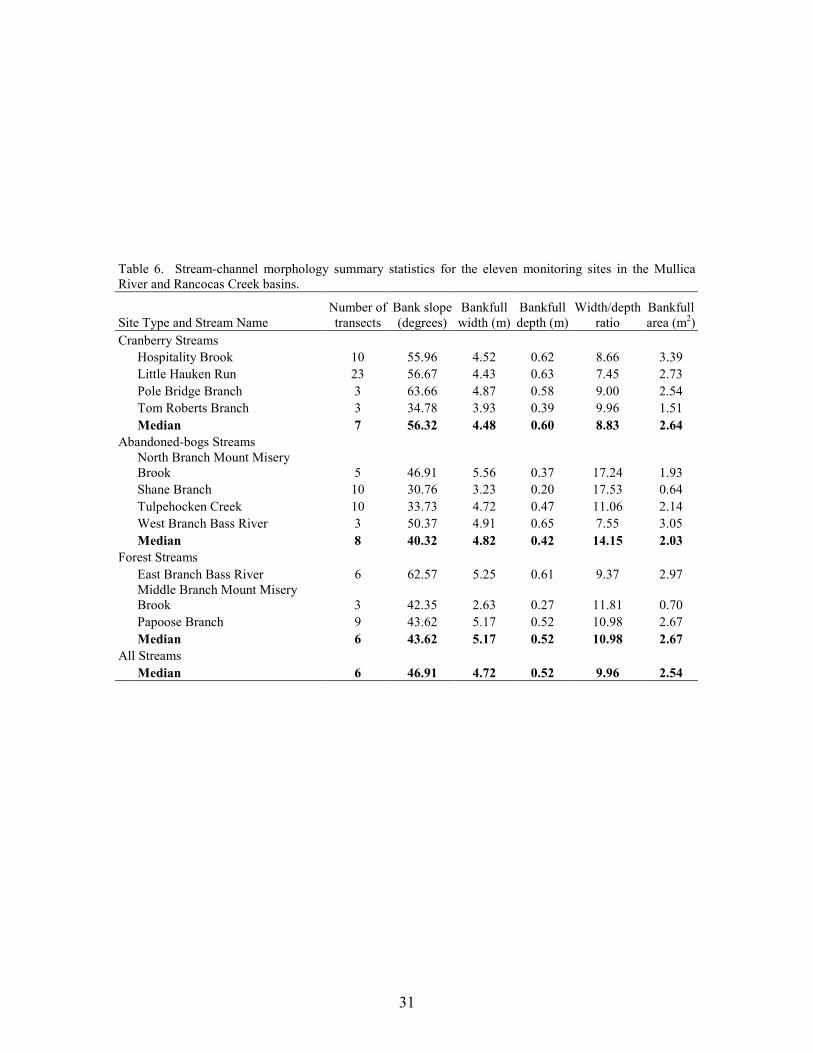
31
Table 6. Stream-channel morphology summary statistics for the eleven monitoring sites in the Mullica River and Rancocas Creek basins.
Site Type and Stream Name Number oftransects
Bank slope(degrees)
Bankfullwidth (m)
Bankfulldepth (m)
Width/depth ratio
Bankfullarea (m2)
Cranberry Streams Hospitality Brook 10 55.96 4.52 0.62 8.66 3.39 Little Hauken Run 23 56.67 4.43 0.63 7.45 2.73 Pole Bridge Branch 3 63.66 4.87 0.58 9.00 2.54 Tom Roberts Branch 3 34.78 3.93 0.39 9.96 1.51 Median 7 56.32 4.48 0.60 8.83 2.64 Abandoned-bogs Streams
North Branch Mount Misery Brook 5 46.91 5.56 0.37 17.24 1.93
Shane Branch 10 30.76 3.23 0.20 17.53 0.64 Tulpehocken Creek 10 33.73 4.72 0.47 11.06 2.14 West Branch Bass River 3 50.37 4.91 0.65 7.55 3.05 Median 8 40.32 4.82 0.42 14.15 2.03 Forest Streams East Branch Bass River 6 62.57 5.25 0.61 9.37 2.97
Middle Branch Mount Misery Brook 3 42.35 2.63 0.27 11.81 0.70
Papoose Branch 9 43.62 5.17 0.52 10.98 2.67 Median 6 43.62 5.17 0.52 10.98 2.67 All Streams Median 6 46.91 4.72 0.52 9.96 2.54
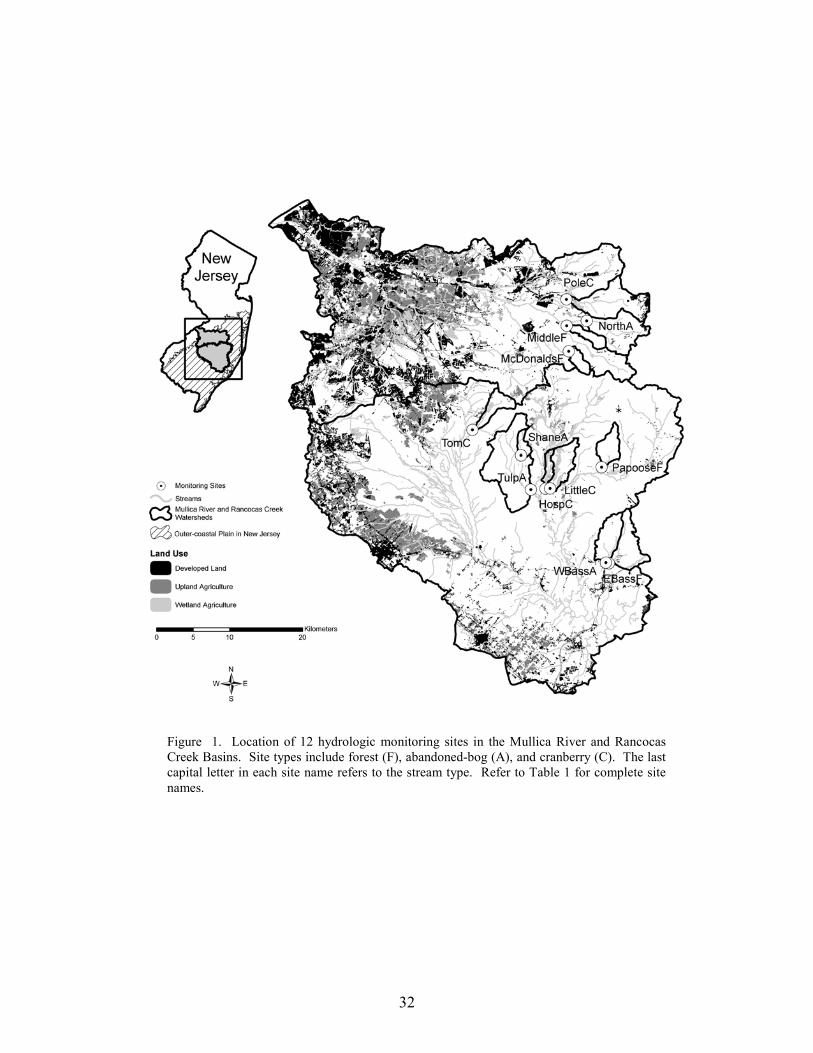
32
Figure 1. Location of 12 hydrologic monitoring sites in the Mullica River and Rancocas Creek Basins. Site types include forest (F), abandoned-bog (A), and cranberry (C). The last capital letter in each site name refers to the stream type. Refer to Table 1 for complete sitenames.
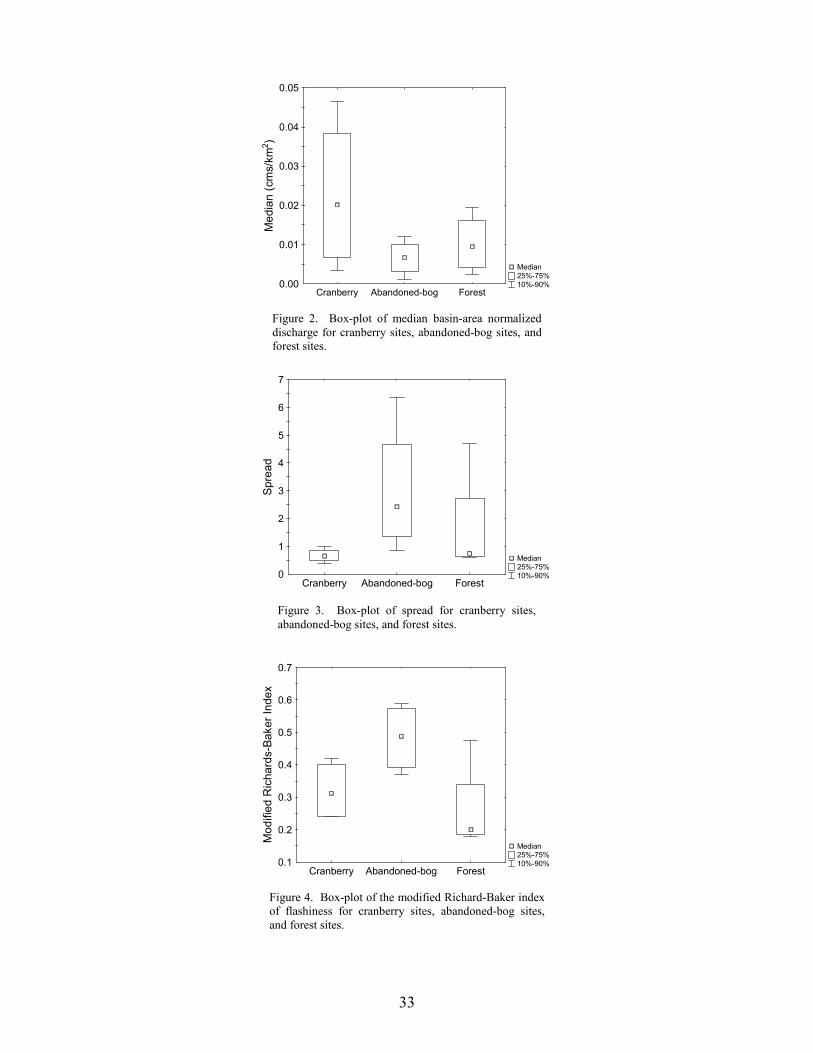
Median 25%-75% 10%-90%
Cranberry Abandoned-bog Forest0.00
0.01
0.02
0.03
0.04
0.05
Med
ian
(cm
s/km
2 )
Figure 2. Box-plot of median basin-area normalizeddischarge for cranberry sites, abandoned-bog sites, andforest sites.
33
Figure 3. Box-plot of spread for cranberry sites, abandoned-bog sites, and forest sites.
Median 25%-75% 10%-90%
Cranberry Abandoned-bog Forest0
1
2
3
4
5
6
7
Spre
ad
Figure 4. Box-plot of the modified Richard-Baker indexof flashiness for cranberry sites, abandoned-bog sites,and forest sites.
Median 25%-75% 10%-90%
Cranberry Abandoned-bog Forest0.1
0.2
0.3
0.4
0.5
0.6
0.7
Mod
ified
Ric
hard
s-Ba
ker I
ndex
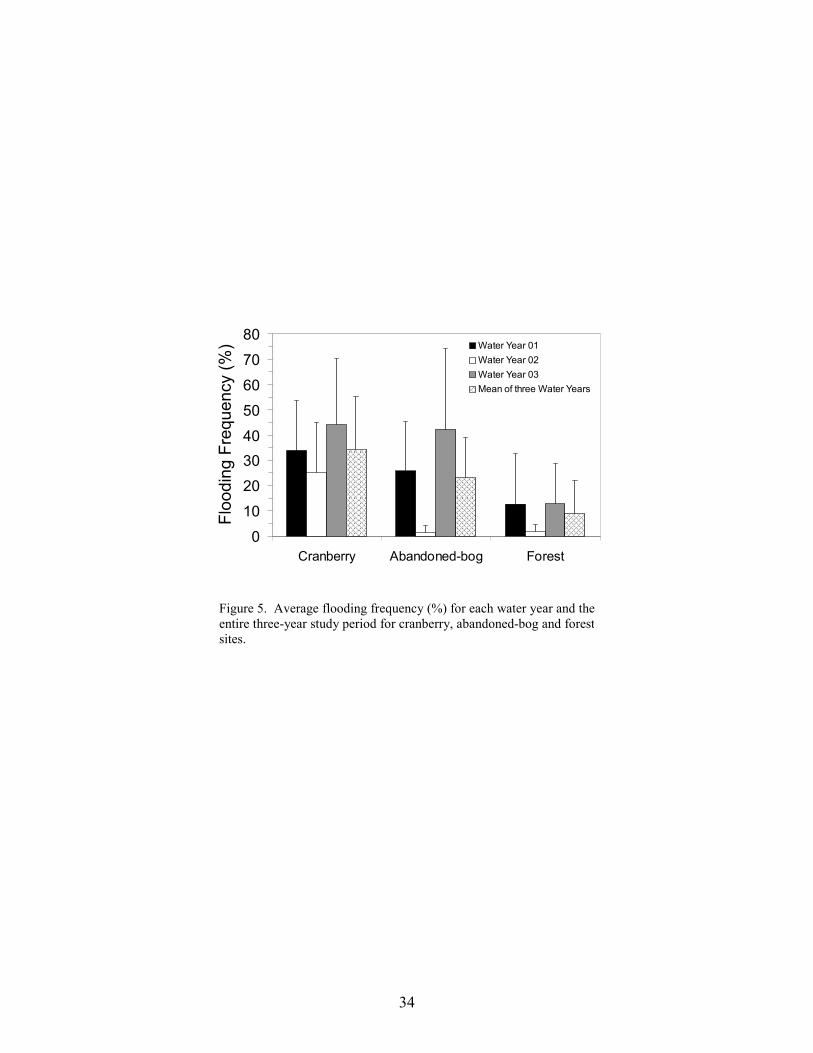
0
10
20
3040
50
60
70
80
Cranberry Abandoned-bog Forest
Floo
ding
Fre
quen
cy (%
) Water Year 01Water Year 02Water Year 03Mean of three Water Years
Figure 5. Average flooding frequency (%) for each water year and theentire three-year study period for cranberry, abandoned-bog and forestsites.
34
35
PART 3. DISTRIBUTION OF DIATOMS IN RELATION TO LAND USE AND PH IN BLACKWATER COASTAL PLAIN STREAMS
Robert A. Zampella, Kim J. Laidig, and Rex L. Lowe
Abstract
We compared the composition of diatom assemblages collected from New Jersey Pinelands blackwater streams draining four different land uses, including forest land, abandoned-cranberry bogs, active-cranberry bogs, and developed and upland-agricultural land. We addressed two questions. First, do diatom assemblages vary among land-use types? Secondly, are variations in diatom assemblages associated with differences in pH? Over a two-year period, we collected 132 diatom taxa at fourteen stream sites. Between-year variability in the composition of stream samples was high. Most diatom species were rarely encountered and were found in low abundance. Specific conductance and pH were higher at developed/agricultural sites compared with all other site types. Neither species richness nor genus richness was significantly different between stream types. However, clear community patterns were evident and a significant difference in species composition existed between the developed/agricultural sites and both cranberry and forest sites. The primary community gradient, represented by the first axis of a DCA ordination, was associated with variations in pH and specific conductance. Acidobiontic and acidophilous diatoms characterized the dominant species at forest, abandoned-bog, and cranberry sites, whereas indifferent (circumneutral) species dominated the developed/agricultural samples. Although our study demonstrated a relationship between the composition of diatom assemblages and watershed conditions, several factors, including taxonomic problems, the large number of diatom species, incomplete pH classifications, and year-to-year variability may limit the utility of diatoms species as indicators of watershed conditions in the New Jersey Pinelands.
Introduction Diatoms can be valuable indicators of water-quality characteristics (Lowe 1974, Pan et al. 1996, Stevenson and Pan 1999, Barbour et al. 1999), especially pH (Meriläinen 1967, Lowe 1974, Charles 1985, van Dam et al. 1994, Battarbee et al. 1999). The close relationship between the composition of modern diatom assemblages and pH has allowed the development and application of paleolimnological methods to reconstruct the pH history of lakes and infer the possible effect of increasing acidity due to acid precipitation (Arzet et al. 1986a, 1986b, Dixit 1986, Ford 1986, Battarbee and Charles 1986, Winkler 1988, Charles and Smol 1988, Dixit et al. 1988, 1992, Holmes et al. 1989). Fewer studies have addressed the effect of an increase in pH on the composition of diatom assemblages (Simola 1986, Ohl et al. 1990, Chessman et al. 1999). New Jersey Pinelands (Pine Barrens) streams are representative of blackwater coastal plain streams found along the east coast and Gulf Coast of the United States (Patrick 1996). Pinelands streams draining forested watersheds are characterized by highly acidic and nutrient-poor water, whereas streams draining developed lands and upland agriculture display elevated pH and dissolved-solid concentrations (Morgan and Good 1988, Zampella 1994). The median
36
pH of streams that are minimally disturbed by development and upland agriculture and those draining altered watersheds ranges from 4.2 - 4.4 and 6.2 - 6.4, respectively (Zampella 1994). The acid-water diatom flora that characterizes the region reflects the low pH of Pinelands streams (Patrick et al. 1979, Moul and Buell 1979, Morgan 1987, Patrick 1996). Characteristic genera include Actinella, Eunotia, Frustulia, Fragilaria, and Pinnularia. Moul and Buell (1979) suggested that a change in pH to neutral or alkaline conditions caused by pollution might eliminate most of the existing acid-water algal flora. In this study, we compare the composition of diatom assemblages collected from streams draining four different land uses, including forest land, abandoned-cranberry bogs, active-cranberry bogs, and developed and upland-agricultural land. Although all four types represent acid-water streams, the streams draining areas with a higher percentage of developed and upland-agricultural lands are characterized by higher pH values. We address two major questions. First, do diatom assemblages vary among land-use types? Secondly, are variations in diatom assemblages associated with differences in pH?
Methods
Study-site Selection We selected four streams representing each of three land-use types, including forest, active-cranberry bogs (cranberry), and developed and upland-agricultural lands (developed/agricultural land), and two streams representing the abandoned-cranberry bog (abandoned bog) land-use type (Figure 1, Table 1). Twelve streams are tributaries of the Mullica River and two are tributaries of the Rancocas Creek. All streams are associated with the Kirkwood-Cohansey aquifer system (Rhodehamel 1979a, 1979b). The fourteen streams were included in earlier water-quality, stream-vegetation, fish or anuran studies, and land-use profiles (Table 1) were completed as part of those studies (Zampella et al. 2001, 2003). The data set used to create the land-use profiles is based on a modified Anderson et al. (1976) system. In this paper, we refer to the Anderson-type land-use classes of urban land, agriculture, and agricultural wetlands as developed land, upland agriculture, and wetland agriculture, respectively. Collectively, we refer to developed land and upland agriculture as altered land. Wetland agriculture includes cranberry bogs and blueberry fields. Most wetland agriculture in the study basins is cranberry agriculture. Cranberry cultivation is a major land use in parts of the Pinelands. Harvested cranberry acreage, estimated to be about 3,100 acres in 2002 (U. S. Department of Agriculture 2003), represents less than one-third of the 11,200 acres that existed at the peak of bog cultivation in 1919 (Eck 1990). The abandoned-cranberry bogs are now a common feature of the landscape.
Our four forest sites were located in undeveloped watersheds with no apparent agricultural history (Figure 1, Table 1). The two abandoned-bog sites were located in streams draining abandoned-cranberry bogs and forest with no active-cranberry bogs. The four active-bog sites were located immediately downstream from active-cranberry farms in watersheds dominated by forest. Abandoned bogs bordered three of the active-bog sites. One developed/agricultural stream site was located in an abandoned bog and another was located
37
downstream from a tributary with abandoned bogs. All abandoned bogs have succeeded to emergent, shrub, or forested wetland types. Altered land in the developed/agricultural basins ranged from 29% to 62%.
Stream Habitats In 1999, we completed field measurements of pH and specific conductance at the twelve Mullica River basin sites (Zampella et al. 2001). We collected monthly samples during baseflow conditions in June, July, August, and October 1999. Specific conductance was measured with an Orion model 122-meter and pH was measured with an Orion model-250A meter. From May through November 2001 and April through November 2002, we used the same methods to collect monthly pH and specific conductance samples at all cranberry, abandoned-bog, and forest sites. The developed/agricultural sites were not sampled during this period. With the exception of one site, where median specific conductance differed by 16.4 µS cm-1, specific conductance and pH values for the eight sites sampled in both periods were similar. The median absolute difference in pH and specific conductance between the 1999 and 2001-2002 periods for the eight sites was 0.2 units and 3.1 µS cm-1, respectively. Based on these results, we used the 1999 data for the developed/agricultural sites and the more recent 2001-2002 data for the other sites to calculate median values and compare water quality (Table 1). We monitored stream discharge at the forest, abandoned-bog, and cranberry sites between October 2000 and October 2003. Discharge was not measured at one site (Buck Run). The U. S. Geological Survey measured discharge less frequently at or near three of the four altered sites as part of a separate study (Zampella et al. 2001). The exception was Great Swamp Branch. In our analysis, we limited the cranberry, abandoned-bog, and forest site discharge measurements to those that most closely matched the U. S. Geological Survey sampling dates. Because data are not available for all sites on all dates, we ranked discharge values for each date and used these ranks to calculate a median discharge rank for each site (Table 1).
We used a spherical densiometer to measure canopy cover directly above the points where diatoms were sampled. Mean canopy cover for each site was based on four spherical densiometer readings. Diatom Sampling We used periphyton samplers that held 16 glass microscope slides to collect diatom samples. The samplers were placed at each stream site for about two weeks on four separate occasions. The sampling dates were: July 15 - 31, 2002, September 13 - 30, 2002, July 6 - 17, 2003, and September 12 - 29, 2003. The use of artificial substrate is effective in streams with highly variable habitat conditions or natural substrate that is not suitable for sampling (Stevenson and Pan 1999). Our study streams are characterized by muck or sand sediment and the presence of hard substrate, represented by woody debris, is highly variable. Each year, we pooled slides collected in July and September as a single sample. The slides were soaked in 30% hydrogen peroxide for 24 hours and scraped into a beaker. The
38
remaining organic matter was oxidized using potassium dichromate. Following repeated episodes of distilled water addition, diatom settling, and decantation of dichromate from the samples, the diatoms were mounted in Naphrax. Diatoms were identified to species and enumerated using a light microscope. For each sample, up to 600 and 500 diatoms were counted in 2002 and 2003, respectively. Taxonomic references used included Camburn and Charles (2000), Hustedt (1930), Krammer and Lange-Bertalot (1986, 1988, 1991a, 1991b), and Patrick and Reimer (1966, 1975). We determined the relative abundance of each species in each year and calculated a mean relative abundance for the two-year period. Species richness and relative abundance was based on all taxa collected during the two years, including those taxa identified only to genus. pH Categories We assigned taxa to pH categories using Meriläinen (1967), Lowe (1974), van Dam et al. (1994), and Charles (1985). With the exception of van Dam (1994), who distinguishes between indifferent (no apparent optimum or insensitive to pH) and circumneutral (mainly occurring at pH about 7) categories, all categorize diatoms as either acidobiontic, acidophilic, indifferent (circumneutral), alkaliphilic, or alkalibiontic as defined by Hustedt (Hustedt 1938-1939 in Meriläinen 1967):
1) acidobiontic - occurring at pH values below 7, optimum distribution at pH 5.5 or less;
2) acidophilous - occurring at about pH 7 and with widest distribution at pH values below 7;
3) indifferent - occurrence around pH of 7; 4) alkaliphilous - occurring at pH values about 7 and with widest distribution at
pH values above 7; and 5) alkalibiontic - occurring at pH values above 7.
Categorizations vary somewhat among the four sources, but the differences are generally limited to classifying a taxon either as acidobiontic or acidophilous or alkalibiontic or alkaliphilous. To resolve these differences, we condensed the classification to three categories. Acidobiontic, acidophilous, and acidophilous-indifferent taxa were classified as acidobiontic-acidophilous. Alkalibiontic, alkaliphilous, and indifferent-alkaliphilous taxa were classified as alkalibiontic-alkaliphilous. Indifferent or circumneutral species were classified as indifferent.
Data analysis
We used detrended correspondence analysis (DCA, Hill 1979a, Hill and Gauch 1980) and TWINSPAN (Hill 1979b) to ordinate and classify diatom species and the fourteen stream sites using mean relative-abundance data for the two-year period. Log-transformed relative-abundance data were used in the DCA analysis. In the DCA diagrams, the scores were rescaled and shown as proportionate to the longest axis (% of Max).
39
The same data and nonparametric multi-response permutation procedures (MRPP, McCune and Mefford 1999) were used to determine if differences in diatom composition existed among the four stream classes and between individual classes. The MRPP analyses were based on Euclidean distance. Significance levels of the multiple tests were adjusted using the sequential Bonferroni method (Rice 1989, 1990). We report the p and A values for each analysis. The p value describes the likelihood that an observed difference is due to chance. The A statistic (chance-corrected within-group agreement) describes agreement within groups (i.e., stream type). A = 1 when all attributes within a group are identical, A = 0 when within group heterogeneity equals that expected by chance, and A < 0 when within-group heterogeneity is greater than expected by chance.
We also used MRPP to determine if differences in the relative abundance of dominant taxa included in each of the pH categories (acidobiontic-acidophilous, indifferent, and alkalibiontic-alkaliphilous) existed among the four stream types. Dominant-diatom taxa are those comprising more than 75% of a sample. We used analysis of variance to assess differences in taxonomic richness among stream types. Species-level and genus-level richness data for the two-year period were log transformed for the ANOVAs. Using Spearman rank correlation, we related the first and second DCA axes derived from ordination of the mean relative-abundance data to pH, specific conductance, percent-canopy cover, discharge ranks, basin area, and the percentage of altered land (developed land and agriculture), wetland agriculture, and combined wetlands and water cover in associated drainage basins. Significance levels for Spearman rank correlations and ANOVAs were adjusted using the sequential Bonferroni method (Rice 1989, 1990).
We used an alpha level of 0.05 to assess significance for all tests. Ordinations, TWINSPAN classifications, and MRPP analyses were performed using PC-ORD for Windows 4.27 (MjM Software, Gleneden Beach, OR 1999). ANOVAs and correlation analyses were performed using Statistica 5.5 (Statsoft Inc., Tulsa, OK, 1995).
Results Stream Habitats
Median pH and specific conductance at the developed/agriculture sites ranged from 6.3 to 6.8 and 63 µS cm-1 to 118 µS cm-1, respectively (Table 1). Median pH at all other sites ranged from 4.2 to 5.1. Median specific conductance was less than 50 µS cm-1 at these sites. Mean (± 1 SD) canopy cover at the diatom-sampling points ranged from 6.5 ± 9.2% for abandoned bogs to 28.5 ± 27.6% for active-cranberry bogs. Discharge was generally lower in the abandoned-bog streams.
40
Species Inventory
The samples included three problematic taxa, Eunotia exigua, E. tenella and E. paludosa. Because these three species overlap morphologically at the ends of their size ranges, they look very similar at the light microscopy level. To address the potential taxonomic uncertainty, we completed our analyses using a composite species comprised of the three Eunotia species.
Forty-three genera, comprising 132 taxa (134 taxa with Eunotia exigua, E. tenella and E.
paludosa as separate species), including 105 species, 7 varieties, and 20 taxa identified only to genus, were collected over the two-year period at the fourteen sites (Table 2). Between-year variability in the composition of stream samples was high. Only 51 taxa were collected in both years. Thirty-eight taxa were collected only in 2002 and 43 taxa were collected only in 2003. All 132 taxa were treated as species in the analyses.
The genus Eunotia was found at all sites. Other widely distributed genera, in order of decreasing frequency of occurrence at fourteen sites, were Frustulia (93%), Tabellaria (93%), Pinnularia (79%), Stenopterobia (79%), Navicula (64%), Brachysira (50%), and Gomphonema (50%).
Most diatom species were rarely encountered and were found in low abundance. In 2002, 53% of 89 species were found at only one of fourteen sites. Fifty-nine percent of the 94 species collected in 2003 were also found at a single site. Less than ten and twelve percent of all species occurred at fifty percent or more of all sites in 2002 and 2003, respectively. Over the two-year period, 65 (49%) of the 132 species collected occurred at only a single site. Most of the single-occurrence species were found at developed/agricultural sites (37%). The percentage of single-occurrence species at cranberry, abandoned-bog, and forest sites was 25%, 14%, and 25%, respectively. Only 13% of all species were found in all four stream classes.
Over the two-year period, seventeen species were found at more than half of the fourteen
sites. Only 22 (17%) of the 132 species comprised more than five percent of a sample (24 species when Eunotia exigua, E. paludosa, and E. tenella were considered separately). The most abundant taxa, comprising more than 50% of all cells at one or more sites, were the composite Eunotia species (91%), Tabellaria quadraceptata (86%), and Gomphonema parvulum (81%). The composite Eunotia species was most abundant in one forest stream, one abandoned-bog stream, and all four cranberry streams. Tabellaria quadraceptata was most abundant in two forest streams, and Gomphonema parvulum was most abundant in two developed/agricultural streams. Species Richness
Taxonomic richness at the fourteen sites ranged from 12 to 44 species and 5 to 25 genera. Mean species richness for stream types ranged from 23.8 for forest streams to 31.3 for developed/agricultural streams (Table 3). Mean genus richness ranged from 10.8 at forest sites to 15.3 at developed/agricultural sites. Analysis of variance revealed no significant difference in species richness (p = 0.83) or genus richness (p = 0.93) between stream types.
41
Community Patterns The first axis of the DCA ordination based on mean relative-abundance data for the two-year period clearly contrasted the developed/agricultural sites from the other sites (Figure 2). The first division of the TWINSPAN classification also separated the developed/agricultural streams from the other streams. The second DCA axis contrasted forest sites with cranberry sites. The two-dimensional diagram shows that sites were generally clustered with most other streams in the same class.
Nine taxa associated with one extreme end of the first DCA axis of the species ordination were found only at forest sites, and all but Adlafia bryophila occurred at a single site. Thirty-two of thirty-seven taxa associated with the other extreme end of the first axis were found only at developed/altered sites. Twenty-four of the thirty-two taxa occurred at a single site. The remaining eight taxa, which included Achnanthes pusilla, Brachysira vitrea, Caloneis hyalina, Fragilaria vaucheriae, Gomphonema truncatum var. turgidum, Navicula lanceolata, Synedra ulna, and an unidentified species of Fragilaria were found at from two to three developed/agricultural sites. Although also found at other site types, Eunotia pectinalis var. minor, Gomphonema parvulum, and Eunotia rhomboidea were found at all four developed/agricultural sites and were more abundant in these streams.
The second DCA axis contrasted taxa found at a single forest site with taxa occurring at a
single cranberry site. The taxa found only at forest sites included Eunotia curvata var. subarcuata, Stephanocyclus meneghiniana, and unidentified species of Desmogonium, Stenopterobia, and Gyrosigma. Species limited to the cranberry sites were Eunotia praerupta, Navicula rynchocephala, Nitzschia acicularis Nitzschia inconspicua, Pleurosira laevis, Rhoicosphenia curvata, and unidentified species of Stephanodiscus and Tryblionella.
The order of sites along the first and second DCA axes using all species and one derived
by ordinating only species found at two or more sites were nearly identical. Correlations were very high and significant when correlating the first (Spearman r = 0.99, p < 0.001) and second (Spearman r = -0.99, p < 0.001) DCA axes of the site ordinations. As with the ordination of all taxa, including single-occurrence species, Achnanthes pusilla, Brachysira vitrea, Caloneis hyalina, Fragilaria vaucheriae, Gomphonema truncatum var. turgidum, Navicula lanceolata, Synedra ulna, and an unidentified species of Fragilaria characterized the developed/agricultural side of the first DCA axis of the ordination derived using only species found at two or more sites.
The MRPP analysis of the mean relative-abundance data revealed a significant difference between stream types (A = 0.260, p < 0.001). Initial p values suggested that a difference in sample composition existed between cranberry and forest sites and between developed/agricultural sites and abandoned bogs, but the differences were not significant following the Bonferroni adjustment. A significant difference existed between the developed/agricultural sites and both cranberry and forest sites (Table 4).
42
Environmental Relationships
The first DCA axis of the site ordination was correlated with pH and specific conductance and the second axis was correlated with the combined area of wetlands and water (Table 5). Although not significant following the Bonferroni correction, altered land (developed land and upland agriculture) and wetland agriculture appeared to be associated with the first and second axis, respectively. Neither axis was associated with variations in basin area, canopy cover, or discharge. pH Categories Eighty-two (61%) of the 134 diatom species, including Eunotia exigua, E. paludosa, and E. tenella as separate species, collected at fourteen sites over the two-year period were assigned a pH category (Table 6). Forty-one species are classified as acidobiontic-acidophilous and 26 are classified as alkalibiontic-alkaliphilous. Fourteen species were classified as indifferent. van Dam et al. (1994) classifies one species, Eunotia bilunaris, as truly indifferent (i.e., insensitive to pH). One species, Neidium affine, was assigned contrasting pH preferences, ranging from acidophilous to alkaliphilous, by the different sources. Twenty-one species represented dominant taxa comprising more than 75% of a sample. All but three species were assigned a pH category. The exceptions represented 16% of one sample and four percent of another sample. Fourteen species were classified as acidobiontic-acidophilous, two as indifferent, and two as alkalibiontic-alkaliphilous. The dominant acidobiontic-acidophilous species included Eunotia incisa, E. pectinalis, E. pectinalis var. minor, E. rhomboidea, E. septentrionalis, the composite Eunotia species (E. exigua, E. paludosa, and E. tenella), Frustulia amphipleuroides, Frustulia rhomboides, Frustulia saxonica, Pinnularia biceps f. petersenii, P. subcapitata, Semiorbis hemicyclus, Tabellaria flocculosa, and T. quadraceptata. The two indifferent species were Achnanthidium minutissimum and Gomphonema parvulum, and the two alkalibiontic-alkaliphilous species were Aulacoseira ambigua and Cocconeis placentula. The MRPP analyses of the percentage of dominant species in each of the three pH categories revealed a significant difference between the developed/agricultural streams and both the cranberry (A = 0.540, p = 0.006) and forest streams (A = 0.508, p = 0.006). Although the composition of the abandoned-bog streams appeared to differ from the developed/agricultural streams (A = 0.397, p = 0.016), the difference was not significant following the Bonferroni correction. Acidobiontic and acidophilous diatoms characterized the dominant species at forest, abandoned-bog, and cranberry sites. Indifferent species dominated the developed/agricultural samples (Table 6).
Discussion
Although the composition of diatom assemblages at our study sites varied considerably between years and most diatom species were rarely encountered and found in low abundance, clear community patterns were evident. The DCA ordination and TWINSPAN classification contrasted the circumneutral developed/agricultural streams with the more acid forest,

43
abandoned-bog, and cranberry streams. The community gradient was associated with variations in pH and specific conductance.
Most species and genera associated with the contrast between the circumneutral streams
and sites on the opposite end of the primary community gradient represented by the first DCA axis were single occurrences, but deleting these species did not substantially change the order of stream sites along the first or second DCA axes. Although differences between cranberry, abandoned-bog, and forest sites were less apparent, and all four classes where characterized by acid-water diatoms, species composition also varied between these classes.
We found no difference in species richness between stream types. Researchers have reported different effects of human activity on taxa richness. Chessman et al. (1999) associated an increase in genus richness with increasing alkalinity, specific conductance, hardness, and pH related with human activity, and Hill et al. (2003) reported that diatom-species richness was positively correlated with total phosphorus and nitrogen. Cuffney et al. (1997) found that taxa richness of benthic-algal communities with diatoms as a dominant component did not show a strong relationship with land use or water quality. Hill et al. (2001) concluded that diatom-taxa richness is not consistently or predictably related to human-related watershed disturbances. Perhaps the most relevant study is that conducted by Morgan (1987) who collected 53 periphyton species over a one-year period at six Pinelands streams, including three undisturbed streams and three disturbed streams. The disturbed streams were characterized by elevated pH and nutrients. All six streams were within the same major drainage basins as those in our study. As in our study, the disturbed basins had a higher percentage of developed land and upland agriculture than the undisturbed-forested basins. Two of the three undisturbed streams drained land with both active-cranberry bogs and abandoned bogs. Twenty-five of the 53 species were diatoms, which is much lower than the number of taxa found in our study of 16 streams. Our results, based solely on diatom assemblages, do not fully agree with Morgan’s (1987) major conclusion that periphyton-taxonomic richness increases with disturbance. In our study, species and genus richness was highest in developed/agricultural sites compared to the other three classes, but the differences were not statistically significant.
Morgan (1987) identified nine diatom species as restricted to disturbed sites and nine species as restricted to undisturbed sites. We collected eight of these species in our study, and the distribution of only two species is consistent with his designations. Morgan (1987) included Actinella punctata, Gomphonema parvulum, Synedra ulna, and Tabellaria flocculosa in the disturbed-only category and Eunotia exigua, E. flexuosa, Frustulia saxonica, and Pinnularia viridis in the undisturbed-only category. In our study, Actinella punctata was found only in forest and abandoned-bog streams, Gomphonema parvulum and Tabellaria flocculosa were found in developed/agricultural, cranberry, and forest streams, and Eunotia exigua, E. flexuosa, and Frustulia saxonica were found in all-four stream types. The distributions of Synedra ulna, which was found only in developed/agricultural sites, and Pinnularia viridis, which was collected from cranberry and abandoned-bog sites, are consistent with Morgan’s (1987) classification. The between-year variability in restricted species in our study and the difference between our results and those of Morgan (1987) suggest that it may be difficult to identify reliable indicator species based on presence or absence.
44
Specific conductance and pH differed between the developed/agricultural sites and the three other site types, and diatom composition was related to both environmental variables and the combined percentage of wetlands and water in a drainage area. Initial p values also suggested that altered land (developed land and upland agriculture) and wetland agriculture were associated with variations in diatom composition. Basin area, canopy cover, and stream discharge did not vary along the community gradient.
Several other studies also demonstrate the association of pH, specific conductance, and
land use with variations in the composition of diatom assemblages. Geology is also a factor in some areas. Pan et al. (1999) concluded that in mid-Atlantic streams, broad spatial patterns of benthic-algal assemblages dominated by diatoms could be predicted by both site-specific factors, such as riparian conditions, and coarse-scale factors, such as land use in a drainage basin. Kutka and Richards (1996) point out that variations in diatom assemblages may be related to basin geology, chemistry, and land use rather than to proximate habitat factors. In a study of thirty-eight lakes in the Adirondack Mountains, Charles (1985) found strong relationships between pH-related factors (pH, alkalinity, Ca, Mg, Na, Al, and conductivity), the composition of diatom assemblages, and the distribution of individual taxa. Leland and Porter (2000) reported that the composition of benthic-algal assemblages in the Illinois River basin was related to variations in specific conductance (Na-Cl type salinity) and nutrients associated with agricultural and urban land uses.
Pan et al. (1996) demonstrated that diatom species composition in mid-Atlantic region
streams shifted along a pH gradient and concluded that pH was the most important environmental factor affecting diatom species composition in the streams studied. They attributed the high pH, which ranged from 6.4 to 8.7, to watershed geology and land-use activities such as liming and nutrient enrichment associated with agriculture. In the Yakima River basin in Washington, water chemistry and the composition of algal assemblages dominated by diatoms varied with geology in areas where timber harvest and grazing were the dominant land uses, whereas in agricultural areas, differences in algal assemblages were associated with nutrient enrichment (Leland 1995). Carpenter and Wait (2000) identified pH, specific conductance, percent open canopy, and drainage area as significant factors describing patterns of algal taxa in the Oregon streams. Distinct diatom assemblages and water quality characteristics were found in streams draining forested basins compared to streams in basins with a high percentage of urban or agricultural land.
Where altered lands are more extensive, urban and agricultural land uses can overshadow
the effect of geology (Leland and Porter 2000). In our study area, where all drainage areas are associated with the same underlying geology (Rhodehamel 1979a), developed land and upland agriculture are the primary factors influencing water quality (Zampella 1994, Zampella et al. 2001, 2003). Unlike most freshwater systems, weathering of sediments is not a major source of dissolved solids in Pinelands streams. An increase in specific conductance and pH in relation to land-use related watershed disturbance has been demonstrated in all the major Pinelands watersheds (Dow and Zampella 2000).
Experimental evidence supports the assumption that alkalinization associated with human
activity can influence the composition of diatom assemblages. In a study of two acidic, dark-
45
water Michigan lakes, Ohl et al. (1990) observed of a series of changes in diatom-species composition in a limed lake compared to the control. Similarly, diatoms in an acid-water Finnish lake neutralized with powdered lime changed to a diatom community more characteristic of alkaline conditions (Simola 1986).
Although diatoms from all pH categories were found in each stream class, acidobiontic
and acidophilous diatoms characterized the dominant species at forest, abandoned-bog, and cranberry sites. Indifferent (circumneutral) species dominated the developed/agricultural samples. In a study of Idaho rivers, Fore and Grafe (2002) indicated that many diatom species designated as eutrophic were also alkaliphilic. Similarly, van Dam et al. (1994) classify most of the alkalibiontic and alkaliphilous diatoms collected in our study as mesotrophic-eutrophic or eutrophic (meso-eutrophentic and eutraphentic), whereas they classify most of the acidobiontic and acidophilous diatoms as oligotrophic (oligotraphentic). Indifferent species are assigned a range of trophic states. Using abundance-weighted averages of diatom indicator values, Denys (2004) found that trophic status provided a measure of pH rather than nutrient levels or productivity. In our study, the relationship between diatom composition, pH, and trophic status is probably not spurious since pH and nutrients are positively correlated in Pinelands waters (Zampella 1994), and enhanced primary production associated with nutrient enrichment may also contribute to elevated pH in Pinelands waters (Morgan 1985). Zampella et al. (2001) reported a median nitrate-N concentration less than 0.05 mg L-1 for both Papoose Branch and East Branch Bass River, whereas median nitrate-N concentrations for the four developed/agricultural sites ranged from 0.51 to 2.25 mg L-1. At all six sites, total phosphorus was less than 0.01 mg L-1.
Variations in pH and specific conductance were not associated with differences in diatom assemblages between forest, abandoned-bog, and cranberry sites. Cranberries do not require excessive fertilization and nitrogen and phosphorus concentrations (Eck 1990), and Howes and Teal (1995) concluded that nitrogen and phosphorus in discharges from cranberry bogs in Massachusetts are generally low in comparison to other land uses. Although the direct effect of cranberry agriculture on nutrients has not been studied in the Pinelands, the possible effect of nutrient enrichment on diatom assemblages cannot be discounted. Zampella et al. (2001) reported a median total phosphorus concentration of 0.01 mg L-1 and 0.02 mg L-1 for the Oswego River and Wading River, respectively. The Oswego River and Wading River basins are the center of the Pinelands cranberry industry. The composition of diatom assemblages is influenced by factors other than water chemistry (Fore 2003). Many species found in Pinelands streams are also present in cranberry bogs and other wetland habitats (Moul and Buell 1979), so it is possible that proximal or watershed-wide landscape features influence the composition of stream-diatom assemblages.
The results of our study demonstrate that developed land and upland agriculture are associated with diatom assemblages that differ from those found in streams draining forested land with or without abandoned bogs and active-cranberry agriculture. Several factors, including taxonomic problems, the large number of diatoms, and incomplete pH classifications (Arzet et al. 1986b, Kelly et al. 1995, Hill et al. 2001) are obstacles to the use of diatoms for environmental monitoring. These factors, year-to-year variability, and the unreliability of indicator species may limit the utility of diatoms species as indicators of watershed conditions in the Pinelands.
46
Assessments based on genus-level diatom identifications may provide a reliable alternative to the analysis of species-level data (Kelly et al. 1995, Hill et al. 2001). Several genera, including Achnanthes, Achnanthidium, Caloneis, Cymbella, Fragilaria, Fragilariforma, Gomphonema, and Synedra were associated with our developed/agricultural streams in both 2002 and 2003. Another approach is to compare the composition of monitoring sites to that of minimally disturbed reference sites. Even though species composition varied between years, the developed/agricultural streams contrasted with the less disturbed, more acid forest, abandoned-bog, and cranberry streams. Because pH classifications are not available for all species, weighting of only dominant species may provide a third alternative.
Acknowledgments
We thank Nicholas Procopio, Christina Burns, Jason Shvanda, and Jim Rutherford for collecting water quality, stage, and discharge data and assisting with diatom sample collections. The New Jersey Division of Parks and Forestry authorized the state-lands research permits. Joseph Darlington granted permission to access Pole Bridge Branch on his property. Funding for this study was provided by the U. S. Environmental Protection Agency (State Wetlands Grant Program, Grant No. CD-99298001-1) and the Pinelands Commission.
Literature Cited Anderson, J. R., E. E. Hardy, J. T. Roach, and R. E. Witmer. 1976. A land use and land cover classification system for use with remote sensor data. U.S. Geological Survey Professional Paper 964. Arzet, K, D. Krause-Dellin, and C. Steinberg. 1986a. Acidification of four lakes in the Federal Republic of Germany as reflected by diatom assemblages, cladoceran remains and sediment chemistry. Pages 227-250 in J.P. Smol, R. W. Battarbee, R. B. Davis, and J. Meriläinen (eds.), Diatoms and lake acidity, Dr. W. Junk Publishers, Dordrecht, The Netherlands. Arzet, K., C. Steinberg, R. Psenner, and N. Schulz. 1986b. Diatom distribution and diatom inferred pH in the sediment of four alpine lakes. Hydrobiologia 143:247-254.
Barbour, M. T., J. Gerritsen, B. D. Snyder, and J. B. Stribling. 1999. Rapid bioassessment protocols for use in streams and wadeable rivers: periphyton, benthic macroinvertebrates and fish. Second Edition. EPA 841-B-99-002. U. S. Environmental Protection Agency, Office of Water, Washington, D.C, USA. Battarbee, R. W. and D. F. Charles. 1986. Diatom-based pH reconstruction studies of acid lakes in Europe and North America: a synthesis. Water, Air and Soil Pollution 30:347-354. Battarbee R. W., D. F. Charles, S. S. Dixit, and I. Renberg. 1999. Diatoms as indicators of surface water acidity. Pages 85-127 in E.F. Stoermer and J. P. Smol (eds.), The diatoms: applications for the environmental sciences. Cambridge University Press, Cambridge, UK.
47
Camburn, K. E. and Charles, D. F. 2000. Diatoms of low-alkalinity lakes in the northeastern United States. The Academy of Natural Sciences of Philadelphia, Philadelphia, PA, USA. Carpenter, Kurt, D. and I. R. Waite. 2000. Relations of habitat-specific algal assemblages to land use and water chemistry in the Willamette Basin, Oregon. Environmental Monitoring and Assessment 64: 247-257. Charles D. F. 1985. Relationships between surface sediment diatom assemblages and lakewater characteristics in Adirondack lakes. Ecology 66:994-1011. Charles, D. F. and J. P. Smol. 1988. New methods for using diatoms and chrysophytes to infer past pH of low-alkalinity lakes. Limnology and Oceanography 33:1451-1462. Chessman, B. I. Growns, J. Currey, and N. Plunkett-Cole. 1999. Predicting diatom communities at the genus level for the rapid biological assessment of rivers. Freshwater Biology 41:317-331. Cuffney, T. F., M.R. Meador, S. D. Porter, M. E. Gurtz. 1997. Distribution of fish, benthic invertebrate, and algal communities in relation to physical and chemical conditions, Yakima River Basin, Washington, 1990. U. S. Geological Survey, Water Resources Investigations Report 96-4280. Denys, L. 2004. Relation of abundance-weighted averages of diatom indicator values to measure environmental conditions in standing freshwaters. Ecological Indicators 4:255-275. Dixit, S. S. 1986. Diatom-inferred pH calibration of lakes near Wawa, Ontario. Canadian Journal of Botany 64:1129-1133. Dixit, S. S., A. S. Dixit, and R. D. Evans. 1988. Sedimentary diatom assemblages and their utility in computing diatom-inferred pH in Sudbury Ontario lakes. Hydrobiologia 169:135-148. Dixit, A. S., S. S. Dixit, and J. P. Smol. 1992. Long-term trends in lake water pH and metal concentrations inferred from diatoms and chrysophytes in three lakes near Sudbury, Ontario. Canadian Journal of Fisheries and Aquatic Sciences 49:17-24. Dow, C. L. and R. A. Zampella. 2000. Specific conductance and pH as indicators of watershed disturbance in streams of the New Jersey Pinelands, USA. Environmental Management. 26:437-445. Eck, P. 1990. The American cranberry. Rutgers University Press, New Brunswick, New Jersey, USA. Ford, J. 1986. The recent history of a naturally acidic lake (Cone Pond, N.H.). Pages 131-148 in J.P. Smol, R. W. Battarbee, R. B. Davis, and J. Meriläinen (eds.), Diatoms and lake acidity, Dr. W. Junk Publishers, Dordrecht, The Netherlands.
48
Fore, L. S. 2003. Response of diatom assemblages to human disturbance: Development and testing of a multimetric index for the mid-Atlantic region (USA). Pages 445-480 in T. P. Simon (ed.), Biological response signatures: indicator patterns using aquatic communities. CRC Press, Roca Raton, FLA, USA. Fore, L. S. and C. Grafe. 2002. Using diatoms to assess the biological condition of large rivers in Idaho (U.S.A.). Freshwater Biology 47:2015-2037. Hill, M. O. 1979a. DECORANA-A FORTRAN Program for detrended correspondence analysis and reciprocal averaging. Cornell University, Ithaca, NY, USA. Hill, M. O. 1979b. TWINSPAN-A FORTRAN Program for arranging multivariate data in an ordered two-way table by classification of individuals and attributes. Cornell University, Ithaca, NY, USA. Hill, M. O., and H. G. Gauch Jr. 1980. Detrended correspondence analysis: an improved ordination technique. Vegetatio 42:47-58. Hill, B. H., R. J. Stevenson, Y. Pan, A. T. Herlihy, P. R. Kaufmann, and C. B. Johnson. 2001. Comparison of correlations between environmental characteristics and stream diatom assemblages characterized at genus and species level. Journal of the North American Benthological Society 20:299-310. Hill, B. H., A. T. Herlihy, P. R. Kaufmann, S. J. DeCelles, M. A. Vander Borgh. 2003. Assessment of streams of the eastern United States using a periphyton index of biotic integrity. Ecological Indicators 2: 325-338. Holmes, R. W., M. C. Whiting, and J. L. Stoddard. 1989. Changes in diatom-inferred pH and acid neutralizing capacity in a dilute, high elevation, Sierra Nevada lake since a.d. 1825. Freshwater Biology 21:295-310. Howes, B. L., and J. M. Teal. 1995. Nutrient balance of a Massachusetts cranberry bog and relationships to coastal eutrophication. Environmental Science and Technology 29:960 Hustedt, F. 1930. Bacillariophyta (Diatomae). In Pascher, A. (ed.). Die Süßwasser-Flora Mitteleuropas 10:1-466. Verlag von Gustav Fischer. Jena, Germany. Kelly, M. G., C. J. Penny, and B. A. Whitton. 1995. Comparative performance of benthic diatom indices used to assess river water quality. Hydrobiologia 302: 179-188. Krammer, K. & Lange-Bertalot, H. 1986. Bacillariophyceae. 1. Teil: Naviculaceae. In Ettl, H., Gerloff, J., Heynig, H., & Mollenhauer, D. (eds.). Süsswasserflora von Mitteleuropa. 2: 1-876. Gustav Fisher Verlag, Germany.
49
Krammer, K. and Lange-Bertalot, H. 1988. Bacillariophyceae. 2. Teil: Bacillariaceae, Epithemiaceae, Surirellaceae. In Ettl, H., Gerloff, H., Heynig, H. & Mollenhauer, D. (eds.). Süsswasserflora von Mitteleuropa. 2: 1-596. Gustav Fisher Verlag, Germany. Krammer, K. and Lange-Bertalot, H. 1991a. Bacillariophyceae. 3. Teil: Centrales, Fragilariaceae, Eunotiaceae. In Ettl, H., Gerloff, J., Heynig, H. & Mollenhauer, D. (eds.). Süsswasserflora von Mitteleuropa. 2: 1-576. Gustav Fisher Verlag, Germany. Krammer, K. and Lange-Bertalot, H. 1991b. Bacillariophyceae. 4. Teil: Achnanthaceae. Kritische Ergänzungen zu Navicula (Lineolatae) und Gomphonema. In Ettl, H., Gärtner, G., Gerloff, J., Heynig, H. & Mollenhauer, D. (eds.). Süsswasserflora von Mitteleuropa. 2: 1-437. Gustav Fisher Verlag, Germany. Kutka, F. J. and C. Richards. 1996. Relating diatom assemblage structure to stream habitat quality. Journal of the North American Benthological Society 15:469-480. Leland, H. V. 1995. Distribution of phytobenthos in the Yakima River basin, Washington, in relation to geology, land use, and other environmental factors. Canadian Journal of Fisheries and Aquatic Sciences 52: 1108-1129. Leland, H. V. and S. D. Porter. 2000. Distribution of benthic algae in the upper Illinois River basin in relation to geology and land use. Freshwater Biology 44: 279-301. Lowe, R. L. 1974. Environmental requirements and pollution tolerance of freshwater diatoms. EP A-670/4-74-005. U. S. Environmental Protection Agency, Cincinnati, Ohio, USA. McCune, B., and M. J. Mefford. 1999. PC-ORD. Multivariate analysis of ecological data, Version 4. MjM Software Design, Gleneden Beach, Oregon, USA. Meriläinen, J. 1967. The diatom flora and hydrogen-ion concentration of the water. Annales Botanici Fennici 4:51-58. Morgan, M. D. 1985. Photosynthetically elevated pH in acid waters with high nutrient content and its significance for the zooplankton community. Hydrobiologia 128:239-247. Morgan, M. D. 1987. Impact of nutrient enrichment and alkalinization on periphyton communities in the New Jersey Pine Barrens. Hydrobiologia 144:233-241. Morgan, M. D. and R. E. Good. 1988. Stream chemistry in the New Jersey Pinelands: the influence of precipitation and watershed disturbance. Water Resources Research 24:1091-1100. Moul, E. T. and H. F. Buell. 1979. Algae of the Pine Barrens. Pages 425-440 in R.T.T. Forman (ed.). Pine Barrens: ecosystem and landscape. Academic Press, New York, NY, USA. Ohl, L. E., R. A. Gont, and E. D. Dibble. 1990. Diatom response to liming of a temperate, brown water lake. Canadian Journal of Botany 68:347-353.
50
Pan, Y., R. J. Stevenson, B. H. Hill, A. T. Herlihy, and G. B. Collins. 1996. Using diatoms as indicators of ecological conditions in lotic systems: a regional assessment. Journal of the North American Benthological Society 15:481-495. Pan, Y., R. J. Stevenson, B. H. Hill and P. R. Kaufmann and A. T. Herlihy. 1999. Spatial patterns and ecological determinant of benthic algal assemblages in mid-Atlantic Streams, USA. Journal of Phycology 35:460-468. Patrick, R. and C. W. Reimer. 1966. The diatoms of the United States. Vol. 1. Monographs of the Academy of Natural Sciences Number 13:1-213. Philadelphia, PA, USA. Patrick, R. & C. W. Reimer. 1975. The diatoms of the United States. Vol. 2, Part 1. Monographs of the Academy of Natural Sciences of Philadelphia 13:1-213. Philadelphia, PA, USA. Patrick, R., B. Matson, and L. Anderson. 1979. Streams and lakes in the Pine Barrens. Pages 169-193 in R.T.T. Forman (ed.). Pine Barrens: ecosystem and landscape. Academic Press, New York, NY, USA. Patrick, R. 1996. Rivers of the United States of America. Volume III: The eastern and southeastern states. John Wiley and Sons, Inc., NY, USA. Rhodehamel, E. C. 1979a. Geology of the Pine Barrens of New Jersey. Pages 39-60 in R.T.T. Forman (ed.). Pine Barrens: ecosystem and landscape. Academic Press, New York, NY, USA. Rhodehamel, E. C. 1979b. Hydrology of the New Jersey Pine Barrens. Pages 147-167 in R.T.T. Forman (ed.). Pine Barrens: ecosystem and landscape. Academic Press, New York, NY, USA. Rice, W. R. 1989. Analyzing tables of statistical tests. Evolution 43:223-225. Rice, W. R. 1990. A consensus combined p-value test and family wide significance of component tests. Biometrics 46:303-308. Simola, H. 1986. Diatom responses to acidification and lime-treatment in a clear-water lake: comparison of two methods of analysis of a diatom stratigraphy. Pages 221-226 in J.P. Smol, R. W. Battarbee, R. B. Davis, and J. Meriläinen (eds.), Diatoms and lake acidity, Dr. W. Junk Publishers, Dordrecht, The Netherlands. Stevenson, R. J. and Y. Pan. 1999. Assessing environmental conditions in rivers and streams with diatoms. Pages 11-40 in E.F. Stoermer and J. P. Smol (eds.), The diatoms: applications for the environmental sciences. Cambridge University Press, Cambridge, UK. U. S. Department of Agriculture. 2003. 2002 Cranberry statistics. New Jersey Agricultural Statistics Service, U.S. Department of Agriculture, Trenton, NJ. www.nass.usda.gov/nj/CranBook2003.pdf.
51
van Dam, H., A. Mertens, and J. Sinkeldam. 1994. A coded checklist and ecological indicator values of freshwater diatoms from the Netherlands. Netherlands Journal of Aquatic Ecology 28:117-133. Winkler, M. G. 1988. Paleolimnology of a Cape Cod kettle pond: diatoms and reconstructed pH. Ecological Monographs 58:197-214. Zampella, R. A. 1994. Characterization of surface water quality along a watershed disturbance gradient. Water Resources Bulletin 30:605-611. Zampella, R. A., J. F. Bunnell, K. J. Laidig, and C. L. Dow. 2001. The Mullica River Basin: a report to the Pinelands Commission on the status of the landscape and selected aquatic and wetland resources. Pinelands Commission, New Lisbon, NJ, USA. Zampella, R. A., J. F. Bunnell, K. J. Laidig, and N. A. Procopio. 2003. The Rancocas Creek Basin: a report to the Pinelands Commission on the status of selected aquatic and wetland resources. Pinelands Commission, New Lisbon, NJ, USA.
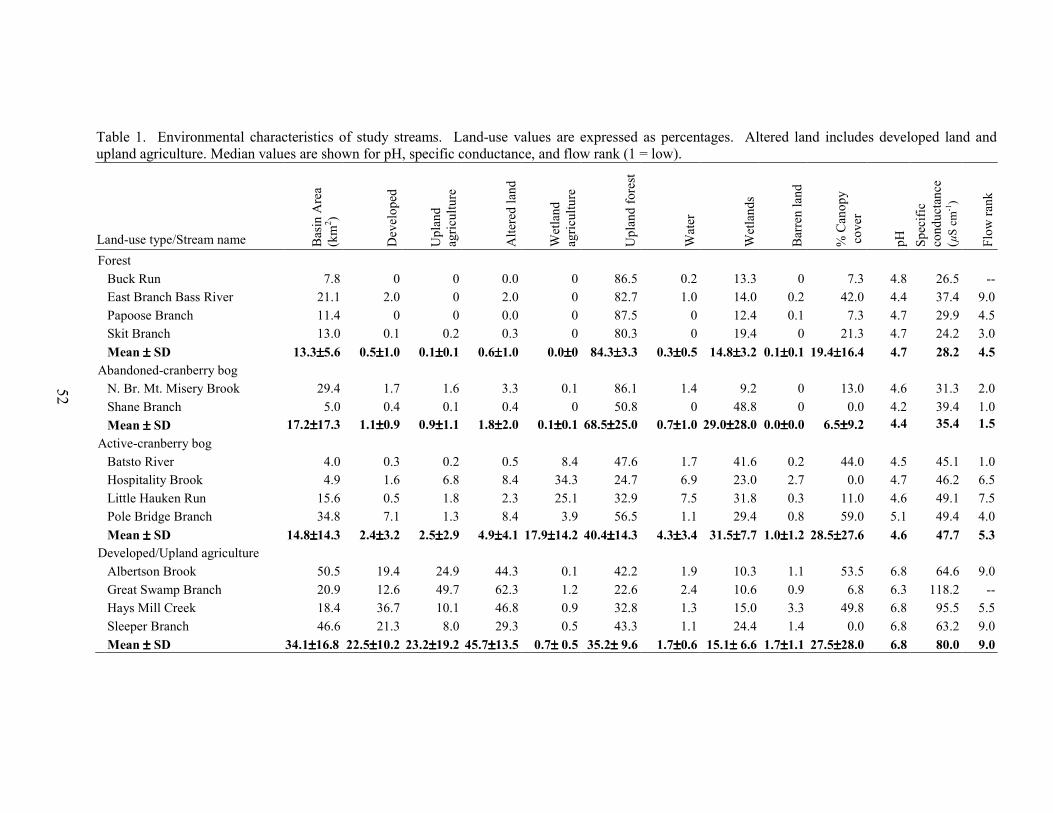
52
Table 1. Environmental characteristics of study streams. Land-use values are expressed as percentages. Altered land includes developed land and upland agriculture. Median values are shown for pH, specific conductance, and flow rank (1 = low).
Land-use type/Stream name Bas
in A
rea
(km
2 )
Dev
elop
ed
Upl
and
agric
ultu
re
Alte
red
land
Wet
land
ag
ricul
ture
Upl
and
fore
st
Wat
er
Wet
land
s
Bar
ren
land
% C
anop
y c
over
pH
Spec
ific
cond
ucta
nce
(µ
S cm
-1)
Flow
rank
Forest
Buck Run 7.8 0 0 0.0 0 86.5 0.2 13.3 0 7.3 4.8 26.5 -- East Branch Bass River 21.1 2.0 0 2.0 0 82.7 1.0 14.0 0.2 42.0 4.4 37.4 9.0 Papoose Branch 11.4 0 0 0.0 0 87.5 0 12.4 0.1 7.3 4.7 29.9 4.5 Skit Branch 13.0 0.1 0.2 0.3 0 80.3 0 19.4 0 21.3 4.7 24.2 3.0 Mean ± ± ± ± SD 13.3±±±±5.6 0.5±±±±1.0 0.1±±±±0.1 0.6±±±±1.0 0.0±±±±0 84.3±±±±3.3 0.3±±±±0.5 14.8±±±±3.2 0.1±±±±0.1 19.4±±±±16.4 4.7 28.2 4.5 Abandoned-cranberry bog N. Br. Mt. Misery Brook 29.4 1.7 1.6 3.3 0.1 86.1 1.4 9.2 0 13.0 4.6 31.3 2.0 Shane Branch 5.0 0.4 0.1 0.4 0 50.8 0 48.8 0 0.0 4.2 39.4 1.0 Mean ± ± ± ± SD 17.2±±±±17.3 1.1±±±±0.9 0.9±±±±1.1 1.8±±±±2.0 0.1±±±±0.1 68.5±±±±25.0 0.7±±±±1.0 29.0±±±±28.0 0.0±±±±0.0 6.5±±±±9.2 4.4 35.4 1.5 Active-cranberry bog Batsto River 4.0 0.3 0.2 0.5 8.4 47.6 1.7 41.6 0.2 44.0 4.5 45.1 1.0 Hospitality Brook 4.9 1.6 6.8 8.4 34.3 24.7 6.9 23.0 2.7 0.0 4.7 46.2 6.5 Little Hauken Run 15.6 0.5 1.8 2.3 25.1 32.9 7.5 31.8 0.3 11.0 4.6 49.1 7.5 Pole Bridge Branch 34.8 7.1 1.3 8.4 3.9 56.5 1.1 29.4 0.8 59.0 5.1 49.4 4.0 Mean ± ± ± ± SD 14.8±±±±14.3 2.4±±±±3.2 2.5±±±±2.9 4.9±±±±4.1 17.9±±±±14.2 40.4±±±±14.3 4.3±±±±3.4 31.5±±±±7.7 1.0±±±±1.2 28.5±±±±27.6 4.6 47.7 5.3 Developed/Upland agriculture Albertson Brook 50.5 19.4 24.9 44.3 0.1 42.2 1.9 10.3 1.1 53.5 6.8 64.6 9.0 Great Swamp Branch 20.9 12.6 49.7 62.3 1.2 22.6 2.4 10.6 0.9 6.8 6.3 118.2 -- Hays Mill Creek 18.4 36.7 10.1 46.8 0.9 32.8 1.3 15.0 3.3 49.8 6.8 95.5 5.5 Sleeper Branch 46.6 21.3 8.0 29.3 0.5 43.3 1.1 24.4 1.4 0.0 6.8 63.2 9.0 Mean ± ± ± ± SD 34.1±±±±16.8 22.5±±±±10.2 23.2±±±±19.2 45.7±±±±13.5 0.7±±±± 0.5 35.2±±±± 9.6 1.7±±±±0.6 15.1±±±± 6.6 1.7±±±±1.1 27.5±±±±28.0 6.8 80.0 9.0
52
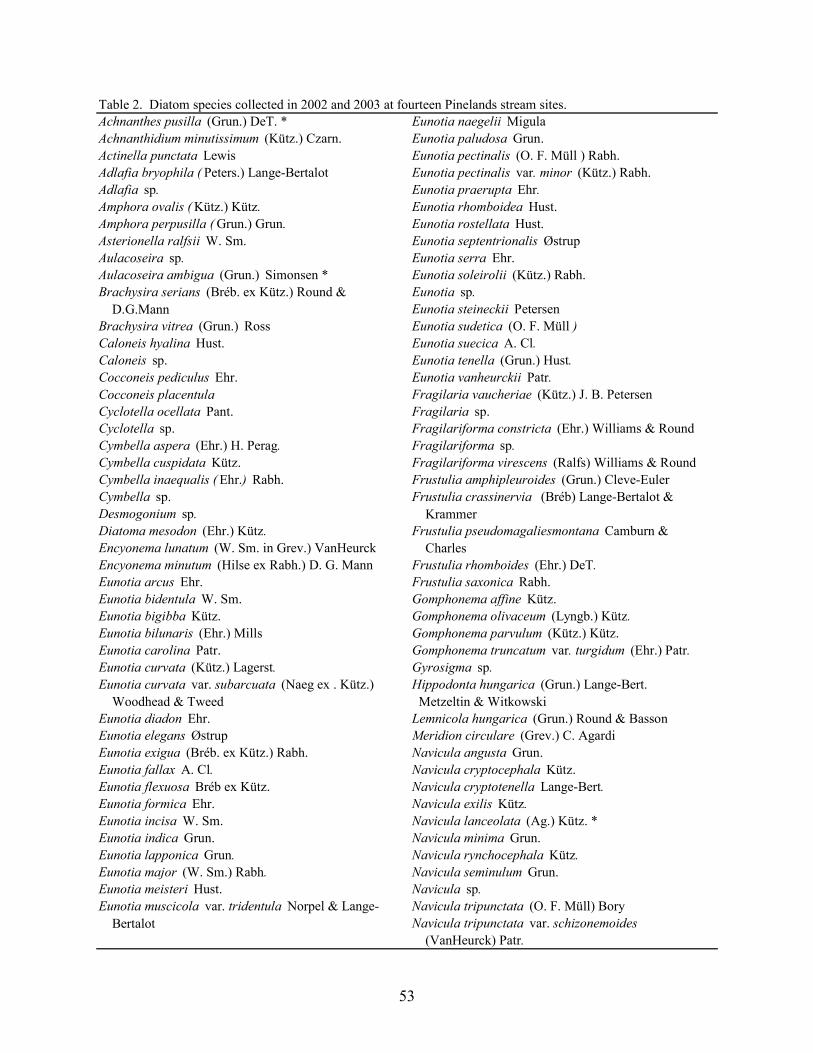
53
Table 2. Diatom species collected in 2002 and 2003 at fourteen Pinelands stream sites.Achnanthes pusilla (Grun.) DeT. * Eunotia naegelii Migula Achnanthidium minutissimum (Kütz.) Czarn. Eunotia paludosa Grun.Actinella punctata Lewis Eunotia pectinalis (O. F. Müll ) Rabh.Adlafia bryophila ( Peters.) Lange-Bertalot Eunotia pectinalis var. minor (Kütz.) Rabh.Adlafia sp. Eunotia praerupta Ehr.Amphora ovalis ( Kütz.) Kütz. Eunotia rhomboidea Hust.Amphora perpusilla ( Grun.) Grun. Eunotia rostellata Hust.Asterionella ralfsii W. Sm. Eunotia septentrionalis Østrup Aulacoseira sp. Eunotia serra Ehr.Aulacoseira ambigua (Grun.) Simonsen * Eunotia soleirolii (Kütz.) Rabh.Brachysira serians (Bréb. ex Kütz.) Round & Eunotia sp. D.G.Mann Eunotia steineckii PetersenBrachysira vitrea (Grun.) Ross Eunotia sudetica (O. F. Müll )Caloneis hyalina Hust. Eunotia suecica A. Cl.Caloneis sp. Eunotia tenella (Grun.) Hust.Cocconeis pediculus Ehr. Eunotia vanheurckii Patr.Cocconeis placentula Fragilaria vaucheriae (Kütz.) J. B. Petersen Cyclotella ocellata Pant. Fragilaria sp.Cyclotella sp. Fragilariforma constricta (Ehr.) Williams & Round Cymbella aspera (Ehr.) H. Perag. Fragilariforma sp.Cymbella cuspidata Kütz. Fragilariforma virescens (Ralfs) Williams & Round Cymbella inaequalis ( Ehr.) Rabh. Frustulia amphipleuroides (Grun.) Cleve-EulerCymbella sp. Frustulia crassinervia (Bréb) Lange-Bertalot & Desmogonium sp. KrammerDiatoma mesodon (Ehr.) Kütz. Frustulia pseudomagaliesmontana Camburn & Encyonema lunatum (W. Sm. in Grev.) VanHeurck CharlesEncyonema minutum (Hilse ex Rabh.) D. G. Mann Frustulia rhomboides (Ehr.) DeT. Eunotia arcus Ehr. Frustulia saxonica Rabh.Eunotia bidentula W. Sm. Gomphonema affine Kütz. Eunotia bigibba Kütz. Gomphonema olivaceum (Lyngb.) Kütz. Eunotia bilunaris (Ehr.) Mills Gomphonema parvulum (Kütz.) Kütz. Eunotia carolina Patr. Gomphonema truncatum var. turgidum (Ehr.) Patr.Eunotia curvata (Kütz.) Lagerst. Gyrosigma sp.Eunotia curvata var. subarcuata (Naeg ex . Kütz.) Hippodonta hungarica (Grun.) Lange-Bert. Woodhead & Tweed Metzeltin & WitkowskiEunotia diadon Ehr. Lemnicola hungarica (Grun.) Round & BassonEunotia elegans Østrup Meridion circulare (Grev.) C. AgardiEunotia exigua (Bréb. ex Kütz.) Rabh. Navicula angusta Grun. Eunotia fallax A. Cl. Navicula cryptocephala Kütz.Eunotia flexuosa Bréb ex Kütz. Navicula cryptotenella Lange-Bert. Eunotia formica Ehr. Navicula exilis Kütz.Eunotia incisa W. Sm. Navicula lanceolata (Ag.) Kütz. *Eunotia indica Grun. Navicula minima Grun.Eunotia lapponica Grun. Navicula rynchocephala Kütz.Eunotia major (W. Sm.) Rabh. Navicula seminulum Grun.Eunotia meisteri Hust. Navicula sp.Eunotia muscicola var. tridentula Norpel & Lange- Navicula tripunctata (O. F. Müll) Bory Bertalot Navicula tripunctata var. schizonemoides
(VanHeurck) Patr.
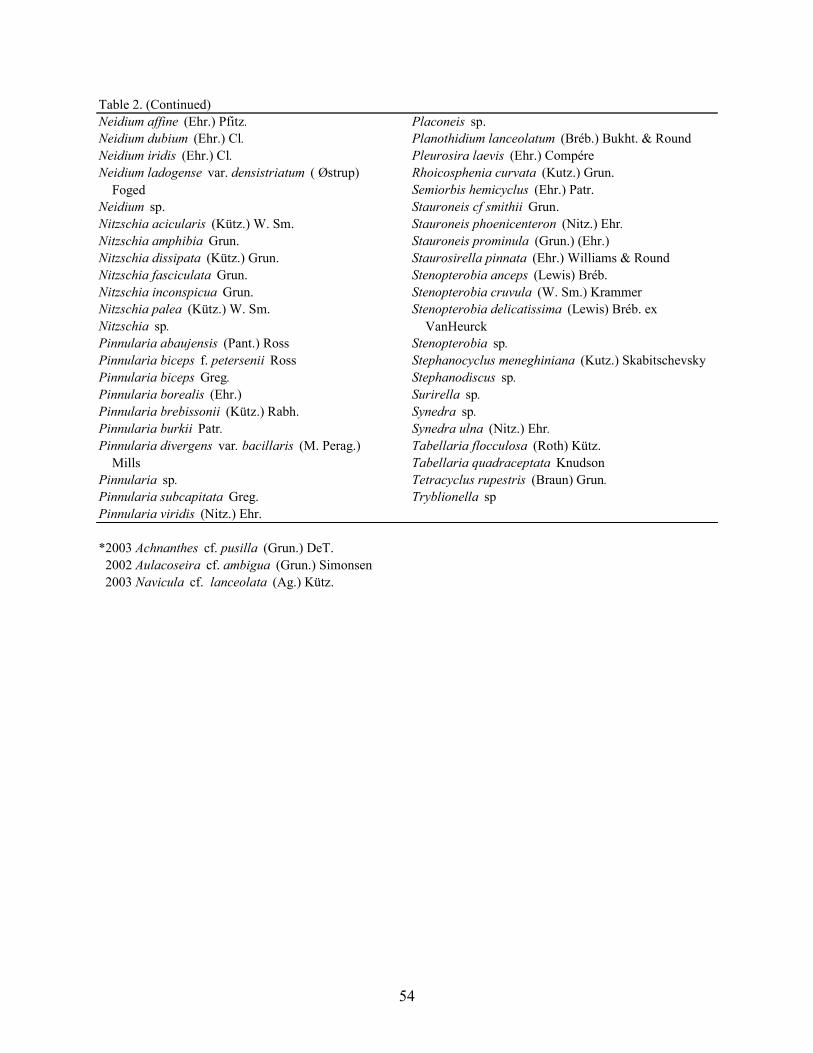
54
Table 2. (Continued)Neidium affine (Ehr.) Pfitz. Placoneis sp.Neidium dubium (Ehr.) Cl. Planothidium lanceolatum (Bréb.) Bukht. & Round Neidium iridis (Ehr.) Cl. Pleurosira laevis (Ehr.) CompéreNeidium ladogense var. densistriatum ( Østrup) Rhoicosphenia curvata (Kutz.) Grun. Foged Semiorbis hemicyclus (Ehr.) Patr.Neidium sp. Stauroneis cf smithii Grun.Nitzschia acicularis (Kütz.) W. Sm. Stauroneis phoenicenteron (Nitz.) Ehr.Nitzschia amphibia Grun. Stauroneis prominula (Grun.) (Ehr.)Nitzschia dissipata (Kütz.) Grun. Staurosirella pinnata (Ehr.) Williams & RoundNitzschia fasciculata Grun. Stenopterobia anceps (Lewis) Bréb.Nitzschia inconspicua Grun. Stenopterobia cruvula (W. Sm.) KrammerNitzschia palea (Kütz.) W. Sm. Stenopterobia delicatissima (Lewis) Bréb. exNitzschia sp. VanHeurckPinnularia abaujensis (Pant.) Ross Stenopterobia sp.Pinnularia biceps f. petersenii Ross Stephanocyclus meneghiniana (Kutz.) SkabitschevskyPinnularia biceps Greg. Stephanodiscus sp.Pinnularia borealis (Ehr.) Surirella sp.Pinnularia brebissonii (Kütz.) Rabh. Synedra sp.Pinnularia burkii Patr. Synedra ulna (Nitz.) Ehr.Pinnularia divergens var. bacillaris (M. Perag.) Tabellaria flocculosa (Roth) Kütz. Mills Tabellaria quadraceptata Knudson Pinnularia sp. Tetracyclus rupestris (Braun) Grun.Pinnularia subcapitata Greg. Tryblionella spPinnularia viridis (Nitz.) Ehr.
*2003 Achnanthes cf. pusilla (Grun.) DeT. 2002 Aulacoseira cf. ambigua (Grun.) Simonsen 2003 Navicula cf. lanceolata (Ag.) Kütz.
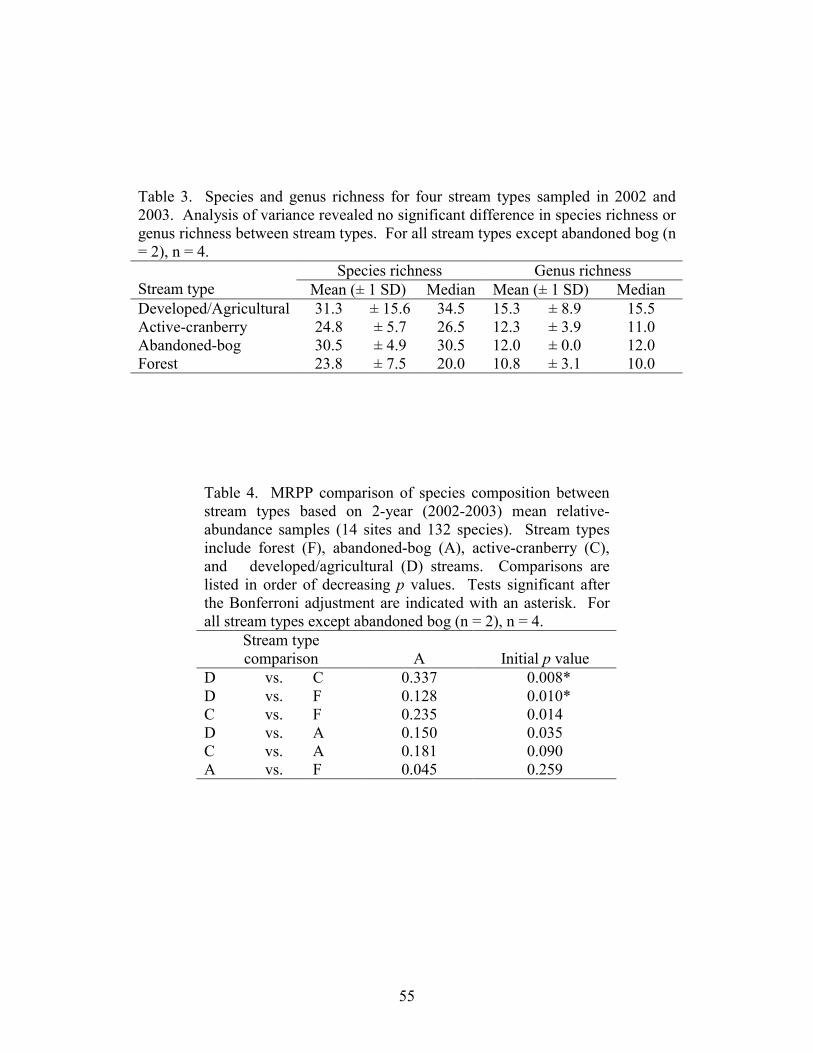
55
Table 3. Species and genus richness for four stream types sampled in 2002 and 2003. Analysis of variance revealed no significant difference in species richness or genus richness between stream types. For all stream types except abandoned bog (n = 2), n = 4.
Species richness Genus richness Stream type Mean (± 1 SD) Median Mean (± 1 SD) Median Developed/Agricultural 31.3 ± 15.6 34.5 15.3 ± 8.9 15.5 Active-cranberry 24.8 ± 5.7 26.5 12.3 ± 3.9 11.0 Abandoned-bog 30.5 ± 4.9 30.5 12.0 ± 0.0 12.0 Forest 23.8 ± 7.5 20.0 10.8 ± 3.1 10.0
Table 4. MRPP comparison of species composition between stream types based on 2-year (2002-2003) mean relative-abundance samples (14 sites and 132 species). Stream types include forest (F), abandoned-bog (A), active-cranberry (C), and developed/agricultural (D) streams. Comparisons are listed in order of decreasing p values. Tests significant after the Bonferroni adjustment are indicated with an asterisk. For all stream types except abandoned bog (n = 2), n = 4.
Stream type comparison A Initial p value
D vs. C 0.337 0.008* D vs. F 0.128 0.010* C vs. F 0.235 0.014 D vs. A 0.150 0.035 C vs. A 0.181 0.090 A vs. F 0.045 0.259
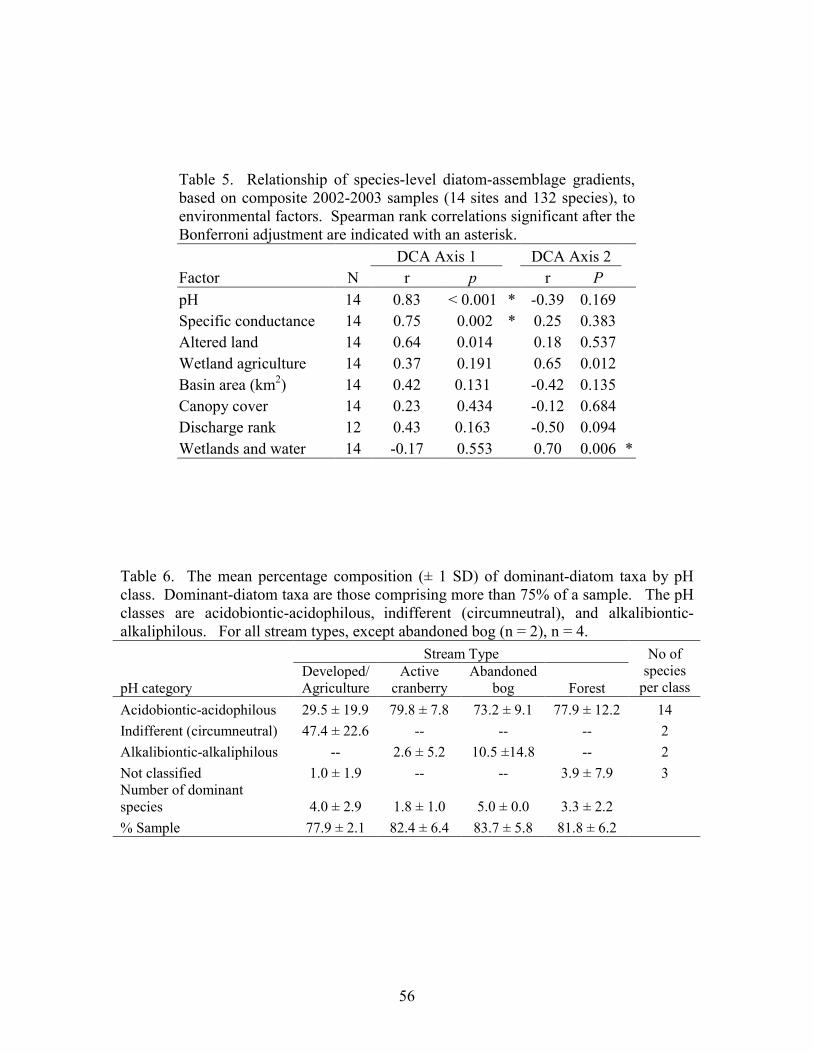
56
Table 5. Relationship of species-level diatom-assemblage gradients, based on composite 2002-2003 samples (14 sites and 132 species), to environmental factors. Spearman rank correlations significant after the Bonferroni adjustment are indicated with an asterisk. DCA Axis 1 DCA Axis 2 Factor N r p r P pH 14 0.83 < 0.001 * -0.39 0.169 Specific conductance 14 0.75 0.002 * 0.25 0.383 Altered land 14 0.64 0.014 0.18 0.537 Wetland agriculture 14 0.37 0.191 0.65 0.012 Basin area (km2) 14 0.42 0.131 -0.42 0.135 Canopy cover 14 0.23 0.434 -0.12 0.684 Discharge rank 12 0.43 0.163 -0.50 0.094 Wetlands and water 14 -0.17 0.553 0.70 0.006 *
Table 6. The mean percentage composition (± 1 SD) of dominant-diatom taxa by pH class. Dominant-diatom taxa are those comprising more than 75% of a sample. The pH classes are acidobiontic-acidophilous, indifferent (circumneutral), and alkalibiontic-alkaliphilous. For all stream types, except abandoned bog (n = 2), n = 4.
Stream Type
pH category Developed/Agriculture
Active cranberry
Abandoned bog Forest
No of species
per class Acidobiontic-acidophilous 29.5 ± 19.9 79.8 ± 7.8 73.2 ± 9.1 77.9 ± 12.2 14 Indifferent (circumneutral) 47.4 ± 22.6 -- -- -- 2 Alkalibiontic-alkaliphilous -- 2.6 ± 5.2 10.5 ±14.8 -- 2 Not classified 1.0 ± 1.9 -- -- 3.9 ± 7.9 3 Number of dominant species 4.0 ± 2.9 1.8 ± 1.0 5.0 ± 0.0 3.3 ± 2.2 % Sample 77.9 ± 2.1 82.4 ± 6.4 83.7 ± 5.8 81.8 ± 6.2
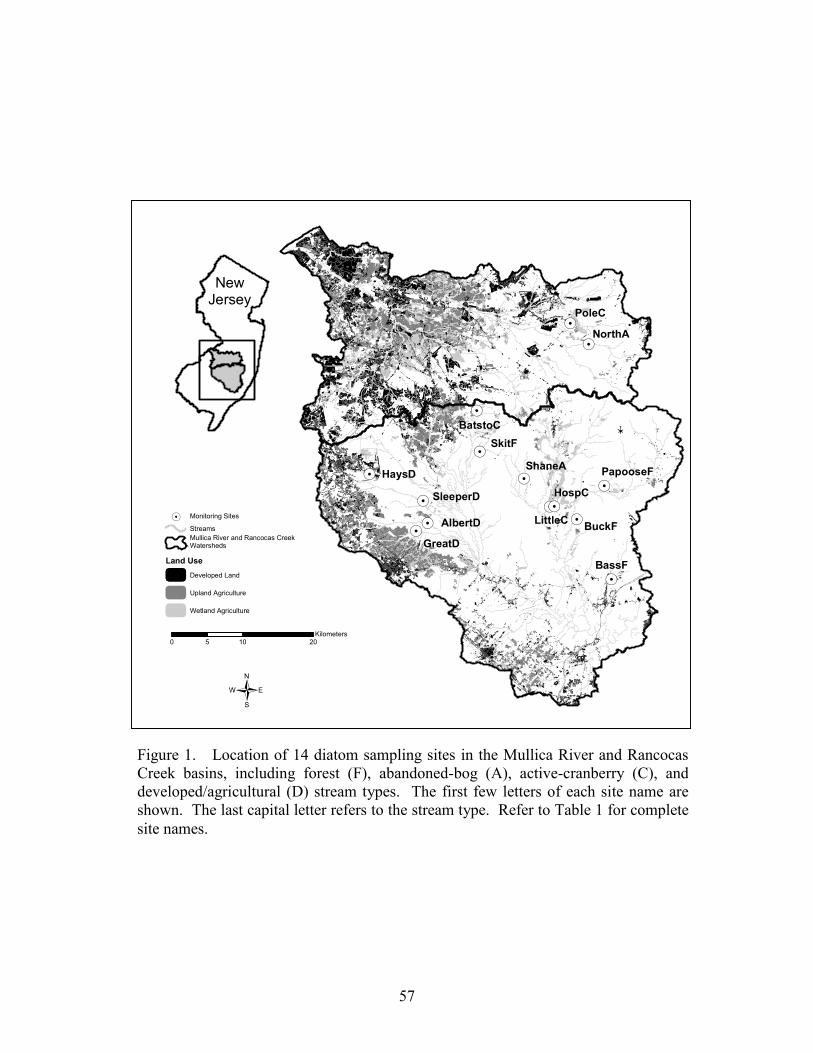
57
!.
!.
!.!.
!.!.
!.
!.
!.!.!.
!.
!.
!.
PapooseF
BatstoC
LittleC
ShaneA
NorthA
BassF
SkitF
BuckF
HospC
PoleC
HaysD
GreatD
AlbertD
SleeperD
{
NewJersey
0 10 205Kilometers
Land Use
StreamsMullica River and Rancocas CreekWatersheds
Upland Agriculture
Wetland Agriculture
Developed Land
Monitoring Sites!.
Figure 1. Location of 14 diatom sampling sites in the Mullica River and Rancocas Creek basins, including forest (F), abandoned-bog (A), active-cranberry (C), and developed/agricultural (D) stream types. The first few letters of each site name areshown. The last capital letter refers to the stream type. Refer to Table 1 for complete site names.
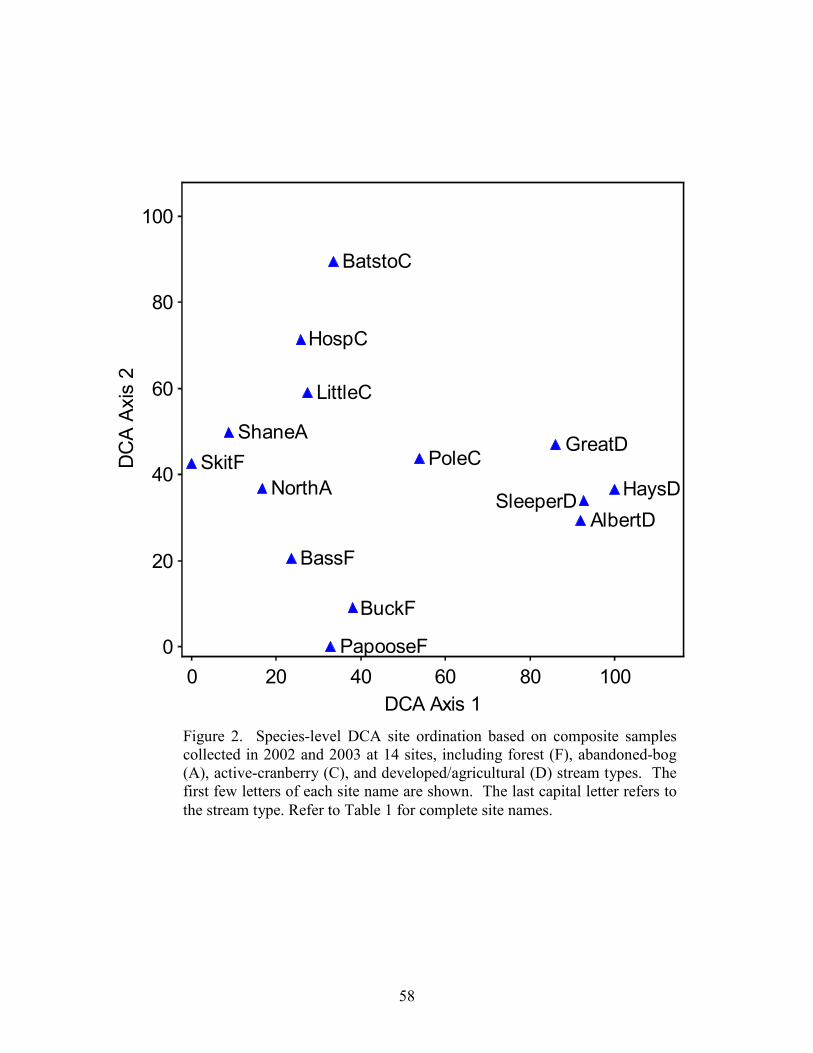
58
Figure 2. Species-level DCA site ordination based on composite samplescollected in 2002 and 2003 at 14 sites, including forest (F), abandoned-bog (A), active-cranberry (C), and developed/agricultural (D) stream types. The first few letters of each site name are shown. The last capital letter refers tothe stream type. Refer to Table 1 for complete site names.
AlbertD
GreatD
HaysDSleeperD
BatstoC
HospC
LittleC
PoleCNorthA
ShaneA
BassF
BuckF
PapooseF
SkitF
00
20 40 60 80 100
20
40
60
80
100
DCA Axis 1
DC
A A
xis
2
59
PART 4. VEGETATION IN PINELANDS STREAMS DRAINING ACTIVE-CRANBERRY BOGS, ABANDONED-CRANBERRY BOGS, AND FOREST LAND
Kim J. Laidig
Abstract
Channel and bank vegetation from eleven Pinelands streams draining forest land,
abandoned-cranberry bogs, and active-cranberry bogs were compared. The objectives were to determine if channel and bank plant-species composition was related to differences in upstream land use (forest land, abandoned-cranberry bogs, and active-cranberry bogs) and environmental factors, including water temperature, dissolved oxygen, pH, specific conductance, basin area, channel-vegetation cover, bank-vegetation cover, substrate texture (muck or sand), total-canopy cover, canopy-species cover, bankfull-channel depth, bankfull-channel width, and discharge rank. Detrended correspondence analysis and TWINSPAN were used to ordinate and classify the eleven stream sites and channel and bank vegetation using presence-absence, relative-cover, and absolute-cover data. Nonparametric multi-response permutation procedures (MRPP) were used to compare the same three measures of channel and bank vegetation composition between stream types. The study sites were characterized by low pH, specific conductance, dissolved oxygen, and discharge values with muck as the dominant bank and channel sediment. Channel and bank-vegetation quadrats yielded 114 vascular plant species, including 83 herbaceous and 31 woody species, with the majority of species considered native to the Pinelands. Total channel and bank-vegetation cover and channel and bank species richness did not differ significantly between forest, cranberry, and abandoned-bog sites. Ordination of channel and bank vegetation based on presence-absence, relative-cover, and absolute-cover data produced similar results. However, presence-absence data most clearly contrasted forest, cranberry, and abandoned-bog site groups. Ordination and classification of channel-vegetation presence-absence data revealed a distinct cranberry to abandoned-bog to forest site gradient. This gradient was correlated with increasing Atlantic white cedar-canopy cover and dissolved oxygen and decreasing red maple-canopy cover and specific conductance. Ordination and classification of bank-vegetation presence-absence data revealed a cranberry and abandoned-bog to forest site gradient. This gradient was correlated with increasing cedar-canopy cover and decreasing maple-canopy cover and specific conductance. Although the MRPP analysis of channel-vegetation presence-absence data indicated an overall significant difference, post-hoc comparisons indicated no significant differences between the three site groups. For bank vegetation, MRPP analysis of presence-absence data indicated significant differences between the three site groups. Differences in bank-vegetation and channel-vegetation composition between site groups appear to be most closely related to the type of canopy cover at the site. Whether canopy type is determined by land use is not known.
Introduction
Several studies have compared the aquatic and wetland plants in Pinelands streams
draining forested watersheds with streams draining lands with a high percentage of development and upland agriculture (Morgan and Philipp 1986, Zampella and Laidig 1997, Zampella et al. 2001, 2003). Forested Pinelands streams are characterized by acid waters that are low in
60
nutrients and other dissolved solids, whereas streams degraded by upland agriculture and development are generally characterized by elevated pH and dissolved-solid concentrations (Morgan and Good 1988, Zampella 1994). A major difference between sites in forested watersheds and those in heavily farmed and developed watersheds is the occurrence of nonnative plants in the degraded streams.
Sites surveyed in forested watersheds by Zampella and Laidig (1997) and Zampella et al. (2001, 2003) included active-cranberry agriculture and abandoned-cranberry bogs. No major differences in native plant species composition, based on presence-absence data, were observed between watersheds with past or present cranberry agriculture and those with no history of wetland agriculture. A number of streams in cranberry drainages were described as reference sites, which are sites located in drainages with a high percentage of forest and native plant communities and minimal developed or upland agricultural land. The assumption that drainages with cranberry bogs can represent reference watersheds is important because such benchmarks are used to assess the integrity of other sites. In this study, I compared channel and bank vegetation from Pinelands streams draining three different land uses, including forest, abandoned-cranberry bogs, and active-cranberry bogs. All three land-use types represent acid-water streams with minimal upland agriculture or developed lands. I address two major questions. First, is channel and bank plant-species composition related to differences in upstream land use within the associated drainage basin? Second, is channel and bank plant-species composition related to environmental factors, including water quality, channel and basin morphology, and tree-canopy cover?
Methods
Land Use and Study Site Selection Three to four streams representing each of the three land-use types, including forest, abandoned-cranberry bog (abandoned-bog), and active-cranberry bog (cranberry) were selected (Figure 1, Table 1). All eleven streams were included in earlier water-quality, stream-vegetation, fish or anuran studies and land-use profiles were completed as part of those studies (Zampella et al. 2001, 2003). The data set used to create the land-use profiles uses a modified Anderson et al. (1976) system. In this study, I refer to the Anderson-type land-use classes of urban land, agriculture, and agricultural wetlands as developed land, upland agriculture, and wetland agriculture, respectively. Collectively, developed land and upland agriculture is referred to as altered land. The combined area of upland forest, water, wetlands, and barren land is described as forest. Wetland agriculture includes cranberry bogs and blueberry fields. Most wetland agriculture in the study basins is cranberry agriculture.
The percentage of developed land and upland agriculture was low in all eleven drainage areas (Table 1). Altered land, which was generally highest in the cranberry drainage areas, did not exceed ten percent in any basin. The four forest sites were located in watersheds with no apparent agricultural history. Abandoned-bog sites were located in streams draining abandoned-cranberry bogs and forest. The three cranberry sites were located immediately downstream from active-cranberry farms and were bordered by abandoned bogs. All abandoned bogs have
61
succeeded to emergent, shrub, or forested wetlands types. The percentage of wetland agriculture in the cranberry drainage basins ranged from 8.4 to 34.3% and the percentage of forest ranged from 57% to 91%. Environmental Factors From May through November 2001 and April through November 2002, pH, specific conductance, dissolved oxygen, and temperature were measured monthly at road or trail crossings in the vicinity of vegetation sampling sites. All water-quality measurements were completed under baseflow conditions. Specific conductance was measured with an Orion model-122 meter, pH was measured using an Orion model-250A meter, and temperature and dissolved oxygen were measured with a YSI 52 dissolved-oxygen meter. All available data were used to calculate median values for each sampling site. Stream discharge was monitored at seven vegetation-sampling sites on 63 to 64 dates between October 2000 and October 2003. The Batsto River and Skit Branch sites were monitored for a shorter period (March 2002 to October 2003 and October 2000 to October 2001, respectively). Median discharge values for the period of record at these sites were less than 17 cfs. Discharge was not measured at Buck Run and Deep Run. To allow a comparison of all sites where discharge was measured, including Batsto River and Skit Branch, available discharge values for each date were ranked and these ranks were used to calculate a median discharge rank for each site. Stream habitat was evaluated at cross-sectional transects placed at 25-m intervals. The number of transects established along each stream, which depended on the length of accessible habitat, ranged from 5 to 42 with a mean (± 1 SD) of 15 ± 11. Bankfull-channel depth and bankfull-channel width were measured at each transect. Depth was recorded at 10-cm intervals. At five points along each transect, including the right and left bank, the right and left side of the channel, and the thalweg (deepest point in the channel), I subjectively described streambed substrate texture as muck or sand. To obtain an estimate of shading and canopy composition above each transect, I used a spherical densiometer to measure canopy cover and identify the dominant canopy-tree species. If a single tree species was not clearly dominant, canopy composition was recorded as mixed. Using the data from each transect, mean bankfull-channel depth, bankfull-channel width, and canopy-cover values were calculated for each stream. Sediment values represent the number of points, given as a percentage of total points, where each type of substrate was found in a stream. Similarly, canopy composition is expressed as the percentage of transects where a dominant, individual canopy-tree species was found. Vegetation Sampling I estimated total plant cover and the cover of individual vascular-plant species in 0.5-m by 0.5-m quadrats set at five points along each transect, including the right and left bank, the right and left side of the channel, and the thalweg. Cover estimates were limited to vegetation <
62
1.0 m tall. Sampling was conducted in July and August, 2001 and in August and September, 2002. Taxonomic nomenclature follows Gleason and Cronquist (1991). Using the percentage-cover data for each species from the two bank quadrats and the three channel quadrats, I calculated average bank and channel percentage-cover values for each transect and grand averages for each stream. I used the same procedure and total plant-cover data to calculate mean channel-vegetation and bank-vegetation cover. Percentage-cover data was used to calculate total, bank, and channel species richness for each stream. Data Analysis I used detrended correspondence analysis (DCA, Hill 1979a, Hill and Gauch 1980) and TWINSPAN (Hill 1979b) to ordinate and classify stream vegetation and the eleven stream sites. Separate channel and bank vegetation ordinations were completed using presence-absence, relative-cover, and absolute-cover values. Untransformed data were used in the ordinations because preliminary ordinations using untransformed data and log, arcsine, and arcsine-squareroot transformed data yielded similar results. Default settings were used in the TWINSPAN and DCA analyses. To limit the effect of rare species on the ordinations, only species occurring at two or more sites were included in the analyses. With two exceptions, plant specimens that were identified only to genus were eliminated from the analyses if the genus was represented by known species. Panic-grasses that were difficult to identify in the field were lumped into a composite species (Panicum sp.). Utricularia sp. was another composite species that included U. fibrosa, among other aquatic bladderworts.
Spearman rank correlations were used to relate the first and second DCA axes of the channel and bank ordinations to water quality (pH, specific conductance, temperature, and dissolved oxygen), channel and basin (bankfull-channel depth, bankfull-channel width, channel and bank muck frequency, drainage area, discharge rank), and canopy variables, including total-canopy cover, Atlantic white cedar (Chamaecyparis thyoides) cover, red maple (Acer rubrum) cover, pitch pine (Pinus rigida) cover, and mixed species cover. Within these groups of related correlations, the alpha level was corrected for multiple comparisons using the sequential Bonferroni method (Rice 1989, 1990). Separate nonparametric multi-response permutation procedures (MRPP, McCune and Mefford 1999) were used to compare vegetation composition between stream types based on presence-absence, relative-cover, and absolute-cover data for channel vegetation and bank vegetation. The MRPP analyses were based on Euclidean distance, and the alpha levels of the multiple tests were adjusted using the sequential Bonferroni method (Rice 1989, 1990). I report the p and A values for each analysis. The p value describes the likelihood that an observed difference is due to chance. The A statistic (chance-corrected within-group agreement) describes agreement within groups (i.e., stream type). A = 1 when all attributes within a group are identical, A = 0 when within group heterogeneity equals that expected by chance, and A < 0 when within-group heterogeneity is greater than expected by chance. I used separate Kruskal-Wallis ANOVA tests to compare species richness and total plant cover for both channel and bank vegetation.
63
An alpha level of 0.05 was used to assess significance for all tests. Ordinations, TWINSPAN classifications, and MRPP analyses were performed using PC-ORD for Windows 4.27 (MjM Software, Gleneden Beach, OR). Kruskal-Wallis ANOVAs and correlation analyses were performed using Statistica 7.1 (StatSoft, Inc., Tulsa, OK).
Results and Discussion
Environmental Factors
The eleven stream sites were acidic (<4.9) and, with the exception of Deep Run, had very
low conductance values (<50 µS cm-1) (Table 2). All sites where stream flow was measured exhibited low median discharge values (<17 cfs). Dissolved oxygen concentrations were also low with percent-saturation values ranging from 30% to 72%. Bankfull-channel depth at the eleven sites ranged from 17 to 63 cm and bankfull-channel width ranged from 2.5 to 6.1 m. Muck was the dominant channel and bank sediment at all but one of the sites. When present, canopy cover was dominated by Atlantic white cedar, red maple and other hardwoods, and mixed cedar and maple forests. Pitch pine canopy occurred at two of the sites. Drainage basin area ranged from 4.0 to 56.6 km2. Forest sites generally exhibited higher dissolved oxygen, lower water temperature, higher cedar-canopy cover, and lower maple-canopy cover values. Total-canopy cover was highest in forest sites and lowest in the more open abandoned-bog sites. Stream-vegetation Inventory
A total of 114 vascular plant species, including 83 herbaceous and 31 woody species,
were found at the eleven study sites (Appendix). Based on a plant classification scheme described in Zampella et al. (2001, 2003), the majority of these species are considered native to the Pinelands. Ludwigia palustris and Carex lurida, species that are considered indicators of land-use related watershed disturbance (Zampella and Laidig 1997), were each found at a single cranberry site. Ninety plant species were found in channel plots and one hundred and nine species were associated with bank plots. Total plant-species richness at the eleven sites ranged from 20 to 54. The cranberry site group had the highest mean channel species richness. However, analysis of variance indicated no significant difference in bank-, channel-, or total-species richness between forest, abandoned-bog, and cranberry sites.
The lowest (5%) and highest (47%) channel-plant cover occurred at cranberry sites
(Table 2). With the exception of one site, total channel-plant cover was lower than the adjacent banks. Total plant cover on the stream banks ranged from 10% to 65%. The forest site group had the lowest mean bank-plant cover. However, analysis of variance revealed no significant difference in total channel-plant cover and total bank-plant cover between the stream types.
Total cover for the majority of individual species was low (< 5%) for both bank and
channel habitats (Appendix). Fourteen bank species and eight channel species reached average cover values of greater than 5% at one or more sites. For plants occurring on stream banks, the greatest cover values were obtained for several shrub species, including Chamaedaphne calyculata, Clethra alnifolia, and Vaccinium macrocarpon, and six wetland-herbaceous plants, including Sparganium americanum, Leersia oryzoides, Eleocharis tenuis, Carex striata, Carex
64
exilis, and Peltandra virginica. Aquatic and wetland plants with the highest cover values in stream channels included Sparganium americanum, Scirpus subterminalis, Utricularia sp., and Eleocharis robbinsii. Channel-vegetation Composition
The first DCA axis of the presence-absence ordination contrasted forest sites, shown on the right side of the site diagram, with cranberry sites shown on the left side of the diagram (Figure 2, Table 3). Abandoned-bog sites were more centrally located along the first axis. The first division of the TWINSPAN classification separated forest sites and two abandoned-bog sites (Tulpehocken Creek and Shane Branch) from cranberry sites and the remaining two abandoned-bog sites. The species ordination contrasted plants absent from forest sites and encountered most frequently at cranberry sites with species generally absent from cranberry sites and encountered most frequently at forest sites (Table 3). The MRPP analysis of presence-absence data indicated an overall significant difference in channel-vegetation composition between stream types (A = 0.056, p = 0.009). Post-hoc tests revealed a significant difference only between forest and cranberry site types, but this difference was not significant after the Bonferroni correction.
The first DCA-axis site scores of the ordinations based on presence-absence, relative-
cover values, and absolute-cover data were strongly correlated (r = 0.91, p < 0.001 for presence-absence vs. relative cover, r = 0.92, p < 0.001 for presence-absence vs. absolute cover, and r = 0.89, p < 0.001 for relative cover vs. absolute cover). The second axes of the different ordinations were not correlated. The first DCA axis of all three ordinations generally contrasted forest sites with most cranberry and abandoned-bog sites (Figure 2). However, the presence-absence ordination more clearly separated the cranberry and abandoned-bog sites and represented a cranberry to abandoned-bog to forest gradient. The more pronounced contrast between site types in the presence-absence ordination compared to the relative and absolute-cover ordinations was due in part to variations in species cover between sites. Where two sites with the same species are considered identical based on presence-absence data, they appear less similar when differences in percentage cover are considered. Results of the MRPP analyses based on relative cover and absolute cover revealed no significant difference between site types.
The first DCA-axis site scores of the presence-absence ordination were correlated with
increasing cedar-canopy cover and decreasing maple-canopy cover (Table 4). Cedar-canopy cover was also correlated with the first axis of both the relative-cover and absolute-cover ordinations. The forest sites and two abandoned-bog sites (Tulpehocken Creek and Shane Branch) had relatively high cedar-canopy values, whereas the other two abandoned-bog sites and most cranberry sites had higher maple-canopy cover. The first axes of all three ordinations were correlated with both specific conductance and dissolved oxygen (Table 4). Specific conductance decreased along these axes. The opposite trend was observed for dissolved oxygen. Statistical significance varied for the individual correlations following the Bonferroni correction.
The contrast between species associated with the forest and cranberry ends of the
vegetation gradient based on presence-absence data may be directly related to the forest types that border the study streams. Of the ten plants associated with the forest end of the presence-
65
absence vegetation gradient, only one species, Sparganium americanum, was not reported by Laidig and Zampella (1999) as occurring in the understory of Pinelands cedar swamps. Conversely, only five of the ten plants associated with the cranberry end of the gradient were found in the understory of cedar swamps (Laidig and Zampella 1999). The five plants not associated with cedar swamps included Scirpus cyperinus, Itea virginica, Juncus effusus, Panicum virgatum, and Panicum verrucosum. Unlike Sparganium americanum, which is an aquatic macrophyte, the five exceptions are wetland species. Bank-vegetation Composition
The first DCA axis of the bank-vegetation presence-absence ordination contrasted forest sites, shown on the right side of the site diagram, with cranberry sites and abandoned-bog sites on the left side of the diagram (Figure 2, Table 5). The first division of the TWINSPAN classification also separated the four forest streams from the cranberry and abandoned-bog sites. Cranberry sites and a single abandoned-bog site (N. Br. Mt. Misery Brook) were separated from the remaining abandoned-bog sites in the second TWINSPAN division. The species ordination contrasted plants absent from forest sites and generally encountered most frequently at cranberry sites with species generally absent from cranberry sites and encountered most frequently at forest sites (Table 5).
The major patterns displayed by the presence-absence and absolute-cover ordinations were more similar to each other than to the relative-cover ordination (Figure 2). The first DCA-axis site scores of the ordination based on absolute-cover values were correlated with site scores of the ordinations based on presence-absence (r = 0.94, p < 0.001) and relative cover (r = 0.74, p = 0.010). The first DCA-axis site scores of the presence-absence and relative-cover ordinations were not correlated (r = 0.51, p = 0.105). The second axes of only the presence-absence and absolute-cover ordinations were correlated (r = 0.89, p < 0.001). The first DCA axis of the presence-absence and absolute-cover ordinations contrasted forest sites with a mix of cranberry and abandoned-bog sites. Both ordinations revealed a cranberry and abandoned-bog to forest site gradient (Figure 2).
MRPP analyses of presence-absence data indicated an overall significant difference in
bank-vegetation composition between the three site classes (A = 0.073, p = 0.001). Post-hoc comparisons showed a significant difference between cranberry and forest sites (A = 0.091, p = 0.014), cranberry and abandoned-bog sites (A = 0.045, p = 0.039), and forest and abandoned-bog sites (A = 0.044, p = 0.007). MRPP analyses based on relative cover and absolute cover revealed overall significant differences between the three site types (A = 0.104, p = 0.005 for relative cover; A = 0.110, p = 0.011 for absolute cover). Post-hoc tests indicated that, for relative cover, only abandoned-bog and forest site types (A = 0.094, p = 0.013) and cranberry and abandoned-bog site types (A = 0.100, p = 0.020) were significantly different. For absolute cover, only cranberry and forest site types were significantly different (A = 0.087, p = 0.010). The greater contrast between sites based on presence-absence data compared to the cover-data analyses were due in part to the variation in species cover between sites. Where two sites with the same species are considered identical based on presence-absence data, they appeared less similar when differences in percentage cover are considered.
66
The first axes of the bank-vegetation and channel-vegetation ordinations were correlated (r = 0.90, p < 0.001). With two exceptions, the first-axis site scores of the three bank-vegetation ordinations were correlated with increasing cedar-canopy cover, decreasing maple-canopy cover, and decreasing specific conductance (Table 4). The two exceptions were the correlations between presence-absence scores and maple-canopy cover and relative-cover scores and cedar-canopy cover. Second-axis scores of the absolute-cover and presence-absence ordinations were correlated with increasing total-canopy cover, which reflected the higher total-canopy cover at cranberry and forest sites compared to abandoned-bog sites. Statistical significance varied for the individual correlations following the Bonferroni correction.
As noted in the channel-vegetation results, the contrast between species associated with
the forest and cranberry ends of the bank-vegetation gradient based on presence-absence data may be directly related to the forest types that border the study streams. All ten species associated with the forest end of the bank-vegetation gradient were reported to occur in the understory of cedar swamps by Laidig and Zampella (1999). Conversely, only three of the ten plants associated with the cranberry end of the gradient were listed as occurring in the cedar understory. The seven species not associated with cedar swamps studied by Laidig and Zampella (1999) included an aquatic macrophyte, Nuphar variegata, and six wetland species, including Itea virginica, Juncus effusus, Panicum virgatum, Panicum verrucosum, Eleocharis tenuis, and Cladium mariscoides.
Summary
1. Bank and channel vegetation found in eleven Pinelands streams draining three different
land uses, including forest land, abandoned-cranberry bogs, and active-cranberry bogs, were compared and related to environmental factors.
2. Environmental variables measured included water temperature, dissolved oxygen, pH,
specific conductance, basin area, channel-vegetation cover, bank-vegetation cover, muck, sand, total-canopy cover, canopy-species cover, bankfull-channel depth, bankfull-channel width, and discharge rank.
3. The eleven streams were characterized by low pH, specific conductance, dissolved
oxygen, and discharge values. Muck was the dominant bank and channel sediment at most sites.
4. One hundred and fourteen vascular plant species, including 83 herbaceous and 31 woody
species were found at the eleven stream sites. The majority of these species are considered native to the Pinelands.
5. Channel, bank, and total-species richness did not differ significantly between forest,
cranberry, and abandoned-bog sites. 6. Total channel and bank vegetation cover did not differ significantly between forest,
cranberry, and abandoned-bog sites.
67
7. Ordination of channel and bank vegetation based on presence-absence, relative-cover, and absolute-cover data produced similar results. However, in both cases, presence-absence data most clearly distinguished forest, cranberry, and abandoned-bog site groups.
8. Ordination of channel-vegetation presence-absence data revealed a cranberry to
abandoned-bog to forest site gradient. Although the MRPP analysis of channel-vegetation presence-absence data indicated an overall significant difference, post-hoc comparisons indicated no significant differences between the three site groups.
9. Ordination and classification of bank vegetation clearly separated forest sites from
cranberry and abandoned-bog sites. Bank-vegetation composition based on presence-absence data differed significantly between all site groups. Ordination of the presence-absence data revealed a cranberry and abandoned-bog to forest site gradient.
10. The first DCA axis of the channel-vegetation ordination based on presence-absence data
was correlated with increasing cedar-canopy cover and dissolved oxygen and decreasing maple-canopy cover and specific conductance. The first axis of the bank-vegetation ordination based on presence-absence data was correlated with increasing cedar-canopy cover, decreasing maple-canopy cover and decreasing specific conductance.
11. Differences in bank-vegetation and channel-vegetation composition between site groups
appear to be most closely related to the type of canopy cover at the site. Whether canopy type is determined by land use is not known.
Acknowledgements
Robert Zampella, Nicholas Procopio, John Bunnell, Jennifer Ciraolo, Christina Burns, and Jason Shvanda provided valuable assistance with various aspects of the study. The New Jersey Division of Parks and Forestry authorized the state-lands research permits. Funding for this study was provided by the U. S. Environmental Protection Agency (State Wetlands Grant Program, Grant No. CD-99298001-1), the Pinelands Commission, and the National Park Service.
Literature Cited
Anderson, J. R., E. E. Hardy, J. T. Roach, and R. E. Witmer. 1976. A land use and land cover classification system for use with remote sensor data. U.S. Geological Survey Professional Paper 964. Gleason, H. A. and A. Cronquist. 1991. Manual of vascular plants of northeastern United States and adjacent Canada, 2nd Edition. New York Botanical Garden, Bronx, New York, USA. Hill, M. O. 1979a. DECORANA-A FORTRAN program for detrended correspondence analysis and reciprocal averaging. Cornell University, Ithaca, NY, USA.

68
Hill, M. O. 1979b. TWINSPAN-A FORTRAN program for arranging multivariate data in an ordered two-way table by classification of individuals and attributes. Cornell University, Ithaca, NY, USA. Hill, M. O., and H. G. Gauch Jr. 1980. Detrended correspondence analysis: an improved ordination technique. Vegetatio 42:47-58. Laidig, K. J. and R. A. Zampella. 1999. Community attributes of Atlantic white cedar (Chamaecyparis thyoides) swamps in disturbed and undisturbed Pinelands watersheds. Wetlands 19:35-49. McCune, B., and M. J. Mefford. 1999. PC-ORD. Multivariate analysis of ecological data, Version 4. MjM Software Design, Gleneden Beach, OR, USA. Morgan, M. D., and K. R. Philipp. 1986. The effect of agricultural and residential development on aquatic macrophytes in the New Jersey Pine Barrens. Biological Conservation 35:143-158. Morgan, M. D., and R. E. Good. 1988. Stream chemistry in the New Jersey Pinelands: the influence of precipitation and watershed disturbance. Water Resources Research 24:1091-1100. Rice, W. R. 1989. Analyzing tables of statistical tests. Evolution 43:223-225. Rice, W. R. 1990. A consensus combined p-value test and family wide significance of component tests. Biometrics 46:303-308. Zampella, R. A. 1994. Characterization of surface water quality along a watershed disturbance gradient. Water Resources Bulletin 30:605-611. Zampella, R. A., and K. J. Laidig. 1997. Effect of watershed disturbance on Pinelands stream vegetation. Journal of the Torrey Botanical Society 124:52-66. Zampella, R. A., J. F. Bunnell, K. J. Laidig, and C. L. Dow. 2001. The Mullica River Basin: A report to the Pinelands Commission on the status of the landscape and selected aquatic and wetland resources. Pinelands Commission, New Lisbon, NJ. Zampella, R. A., J. F. Bunnell, K. J. Laidig, and N. A. Procopio. 2003. The Rancocas Creek Basin: A report to the Pinelands Commission on the status of selected aquatic and wetland resources. Pinelands Commission, New Lisbon, NJ.
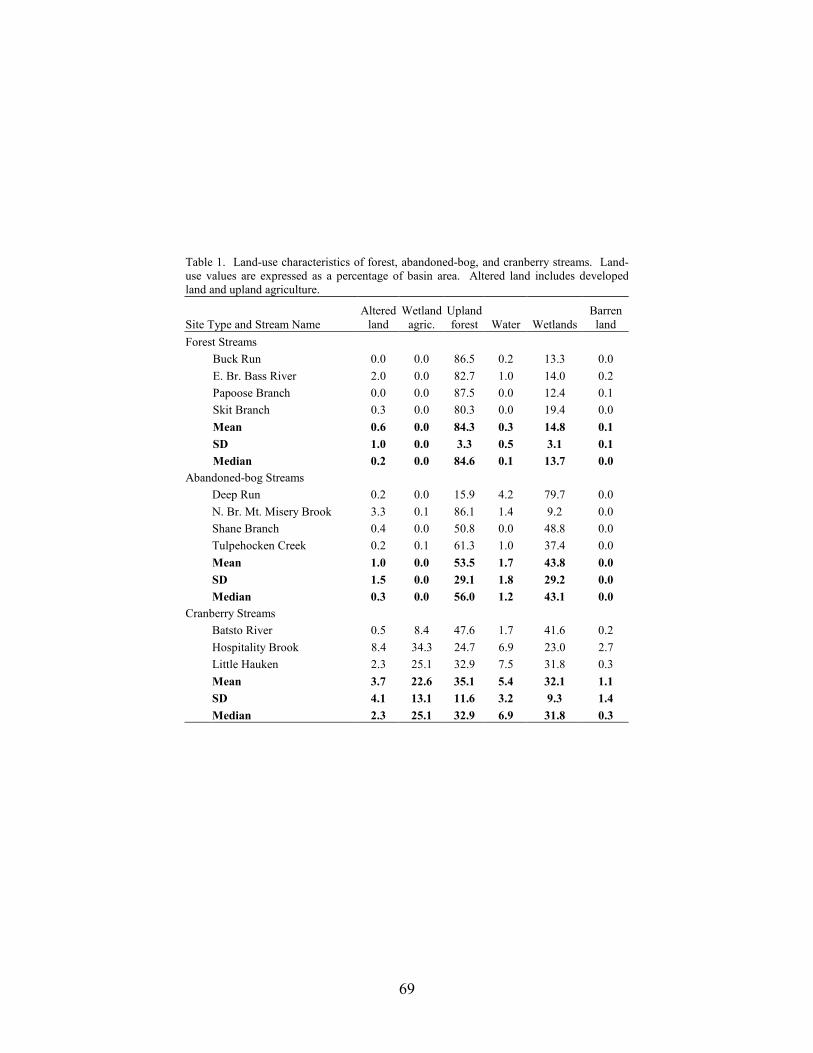
69
Table 1. Land-use characteristics of forest, abandoned-bog, and cranberry streams. Land-use values are expressed as a percentage of basin area. Altered land includes developedland and upland agriculture.
Site Type and Stream Name Altered
land Wetland
agric. Uplandforest Water Wetlands
Barren land
Forest Streams Buck Run 0.0 0.0 86.5 0.2 13.3 0.0 E. Br. Bass River 2.0 0.0 82.7 1.0 14.0 0.2 Papoose Branch 0.0 0.0 87.5 0.0 12.4 0.1 Skit Branch 0.3 0.0 80.3 0.0 19.4 0.0 Mean 0.6 0.0 84.3 0.3 14.8 0.1 SD 1.0 0.0 3.3 0.5 3.1 0.1 Median 0.2 0.0 84.6 0.1 13.7 0.0 Abandoned-bog Streams Deep Run 0.2 0.0 15.9 4.2 79.7 0.0 N. Br. Mt. Misery Brook 3.3 0.1 86.1 1.4 9.2 0.0 Shane Branch 0.4 0.0 50.8 0.0 48.8 0.0 Tulpehocken Creek 0.2 0.1 61.3 1.0 37.4 0.0 Mean 1.0 0.0 53.5 1.7 43.8 0.0 SD 1.5 0.0 29.1 1.8 29.2 0.0 Median 0.3 0.0 56.0 1.2 43.1 0.0 Cranberry Streams Batsto River 0.5 8.4 47.6 1.7 41.6 0.2 Hospitality Brook 8.4 34.3 24.7 6.9 23.0 2.7 Little Hauken 2.3 25.1 32.9 7.5 31.8 0.3 Mean 3.7 22.6 35.1 5.4 32.1 1.1 SD 4.1 13.1 11.6 3.2 9.3 1.4 Median 2.3 25.1 32.9 6.9 31.8 0.3
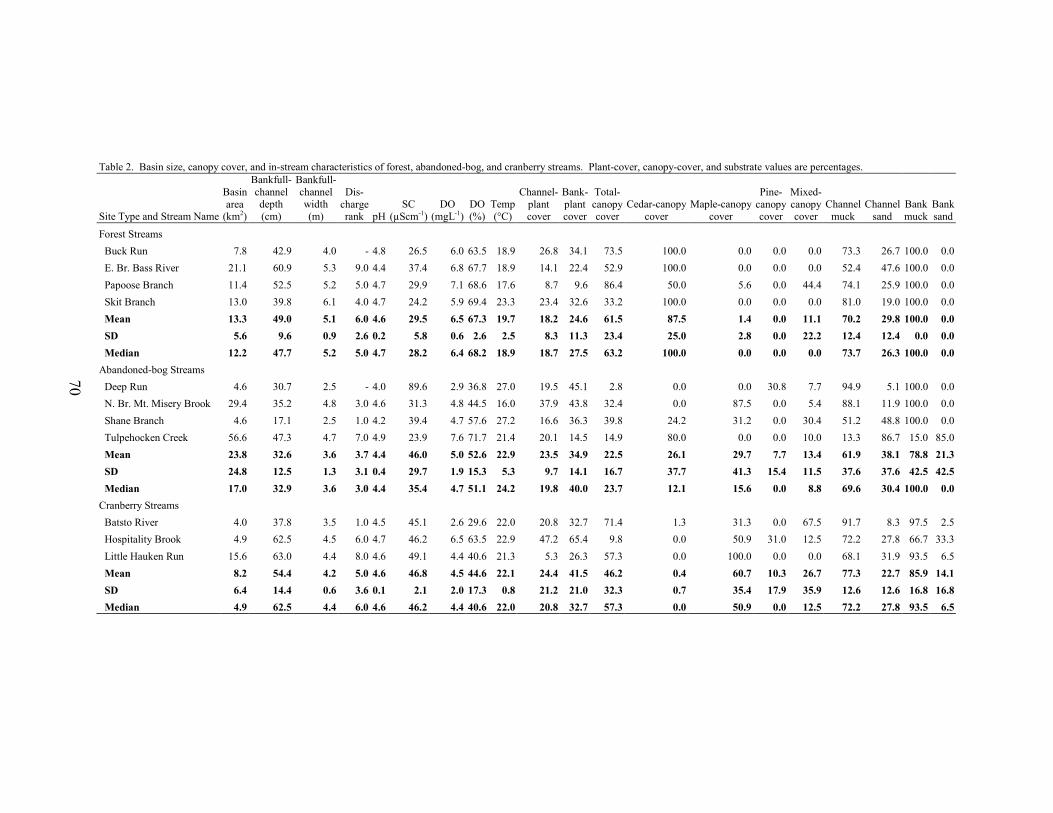
70
Table 2. Basin size, canopy cover, and in-stream characteristics of forest, abandoned-bog, and cranberry streams. Plant-cover, canopy-cover, and substrate values are percentages.
Site Type and Stream Name
Basin area
(km2)
Bankfull- channel depth (cm)
Bankfull-channel width(m)
Dis-chargerank pH
SC (µScm-1)
DO(mgL-1)
DO(%)
Temp(°C)
Channel-plantcover
Bank-plantcover
Total- canopy cover
Cedar-canopycover
Maple-canopycover
Pine- canopycover
Mixed-canopycover
Channelmuck
Channelsand
Bankmuck
Banksand
Forest Streams Buck Run 7.8 42.9 4.0 - 4.8 26.5 6.0 63.5 18.9 26.8 34.1 73.5 100.0 0.0 0.0 0.0 73.3 26.7 100.0 0.0 E. Br. Bass River 21.1 60.9 5.3 9.0 4.4 37.4 6.8 67.7 18.9 14.1 22.4 52.9 100.0 0.0 0.0 0.0 52.4 47.6 100.0 0.0 Papoose Branch 11.4 52.5 5.2 5.0 4.7 29.9 7.1 68.6 17.6 8.7 9.6 86.4 50.0 5.6 0.0 44.4 74.1 25.9 100.0 0.0 Skit Branch 13.0 39.8 6.1 4.0 4.7 24.2 5.9 69.4 23.3 23.4 32.6 33.2 100.0 0.0 0.0 0.0 81.0 19.0 100.0 0.0 Mean 13.3 49.0 5.1 6.0 4.6 29.5 6.5 67.3 19.7 18.2 24.6 61.5 87.5 1.4 0.0 11.1 70.2 29.8 100.0 0.0 SD 5.6 9.6 0.9 2.6 0.2 5.8 0.6 2.6 2.5 8.3 11.3 23.4 25.0 2.8 0.0 22.2 12.4 12.4 0.0 0.0 Median 12.2 47.7 5.2 5.0 4.7 28.2 6.4 68.2 18.9 18.7 27.5 63.2 100.0 0.0 0.0 0.0 73.7 26.3 100.0 0.0Abandoned-bog Streams Deep Run 4.6 30.7 2.5 - 4.0 89.6 2.9 36.8 27.0 19.5 45.1 2.8 0.0 0.0 30.8 7.7 94.9 5.1 100.0 0.0 N. Br. Mt. Misery Brook 29.4 35.2 4.8 3.0 4.6 31.3 4.8 44.5 16.0 37.9 43.8 32.4 0.0 87.5 0.0 5.4 88.1 11.9 100.0 0.0 Shane Branch 4.6 17.1 2.5 1.0 4.2 39.4 4.7 57.6 27.2 16.6 36.3 39.8 24.2 31.2 0.0 30.4 51.2 48.8 100.0 0.0 Tulpehocken Creek 56.6 47.3 4.7 7.0 4.9 23.9 7.6 71.7 21.4 20.1 14.5 14.9 80.0 0.0 0.0 10.0 13.3 86.7 15.0 85.0 Mean 23.8 32.6 3.6 3.7 4.4 46.0 5.0 52.6 22.9 23.5 34.9 22.5 26.1 29.7 7.7 13.4 61.9 38.1 78.8 21.3 SD 24.8 12.5 1.3 3.1 0.4 29.7 1.9 15.3 5.3 9.7 14.1 16.7 37.7 41.3 15.4 11.5 37.6 37.6 42.5 42.5 Median 17.0 32.9 3.6 3.0 4.4 35.4 4.7 51.1 24.2 19.8 40.0 23.7 12.1 15.6 0.0 8.8 69.6 30.4 100.0 0.0Cranberry Streams Batsto River 4.0 37.8 3.5 1.0 4.5 45.1 2.6 29.6 22.0 20.8 32.7 71.4 1.3 31.3 0.0 67.5 91.7 8.3 97.5 2.5 Hospitality Brook 4.9 62.5 4.5 6.0 4.7 46.2 6.5 63.5 22.9 47.2 65.4 9.8 0.0 50.9 31.0 12.5 72.2 27.8 66.7 33.3 Little Hauken Run 15.6 63.0 4.4 8.0 4.6 49.1 4.4 40.6 21.3 5.3 26.3 57.3 0.0 100.0 0.0 0.0 68.1 31.9 93.5 6.5 Mean 8.2 54.4 4.2 5.0 4.6 46.8 4.5 44.6 22.1 24.4 41.5 46.2 0.4 60.7 10.3 26.7 77.3 22.7 85.9 14.1 SD 6.4 14.4 0.6 3.6 0.1 2.1 2.0 17.3 0.8 21.2 21.0 32.3 0.7 35.4 17.9 35.9 12.6 12.6 16.8 16.8 Median 4.9 62.5 4.4 6.0 4.6 46.2 4.4 40.6 22.0 20.8 32.7 57.3 0.0 50.9 0.0 12.5 72.2 27.8 93.5 6.5
70
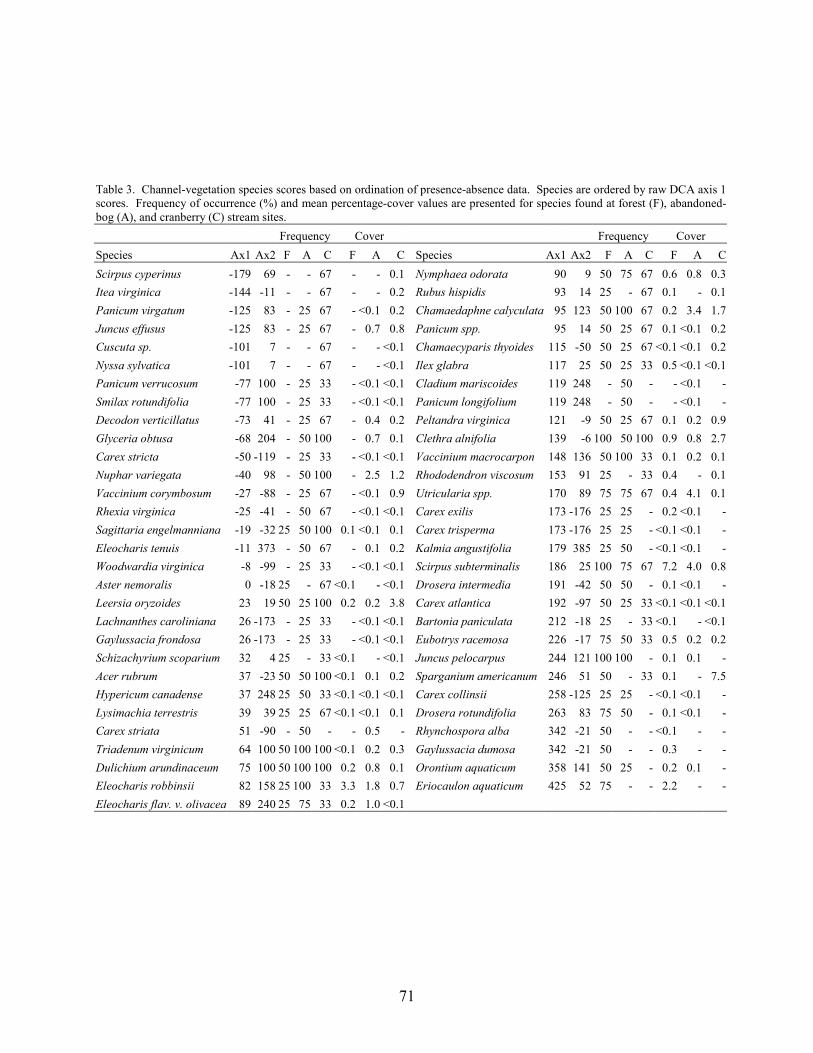
71
Table 3. Channel-vegetation species scores based on ordination of presence-absence data. Species are ordered by raw DCA axis 1 scores. Frequency of occurrence (%) and mean percentage-cover values are presented for species found at forest (F), abandoned-bog (A), and cranberry (C) stream sites. Frequency Cover Frequency Cover Species Ax1 Ax2 F A C F A C Species Ax1 Ax2 F A C F A CScirpus cyperinus -179 69 - - 67 - - 0.1 Nymphaea odorata 90 9 50 75 67 0.6 0.8 0.3Itea virginica -144 -11 - - 67 - - 0.2 Rubus hispidis 93 14 25 - 67 0.1 - 0.1Panicum virgatum -125 83 - 25 67 - <0.1 0.2 Chamaedaphne calyculata 95 123 50 100 67 0.2 3.4 1.7Juncus effusus -125 83 - 25 67 - 0.7 0.8 Panicum spp. 95 14 50 25 67 0.1 <0.1 0.2Cuscuta sp. -101 7 - - 67 - - <0.1 Chamaecyparis thyoides 115 -50 50 25 67 <0.1 <0.1 0.2Nyssa sylvatica -101 7 - - 67 - - <0.1 Ilex glabra 117 25 50 25 33 0.5 <0.1 <0.1Panicum verrucosum -77 100 - 25 33 - <0.1 <0.1 Cladium mariscoides 119 248 - 50 - - <0.1 -Smilax rotundifolia -77 100 - 25 33 - <0.1 <0.1 Panicum longifolium 119 248 - 50 - - <0.1 -Decodon verticillatus -73 41 - 25 67 - 0.4 0.2 Peltandra virginica 121 -9 50 25 67 0.1 0.2 0.9Glyceria obtusa -68 204 - 50 100 - 0.7 0.1 Clethra alnifolia 139 -6 100 50 100 0.9 0.8 2.7Carex stricta -50 -119 - 25 33 - <0.1 <0.1 Vaccinium macrocarpon 148 136 50 100 33 0.1 0.2 0.1Nuphar variegata -40 98 - 50 100 - 2.5 1.2 Rhododendron viscosum 153 91 25 - 33 0.4 - 0.1Vaccinium corymbosum -27 -88 - 25 67 - <0.1 0.9 Utricularia spp. 170 89 75 75 67 0.4 4.1 0.1Rhexia virginica -25 -41 - 50 67 - <0.1 <0.1 Carex exilis 173 -176 25 25 - 0.2 <0.1 -Sagittaria engelmanniana -19 -32 25 50 100 0.1 <0.1 0.1 Carex trisperma 173 -176 25 25 - <0.1 <0.1 -Eleocharis tenuis -11 373 - 50 67 - 0.1 0.2 Kalmia angustifolia 179 385 25 50 - <0.1 <0.1 -Woodwardia virginica -8 -99 - 25 33 - <0.1 <0.1 Scirpus subterminalis 186 25 100 75 67 7.2 4.0 0.8Aster nemoralis 0 -18 25 - 67 <0.1 - <0.1 Drosera intermedia 191 -42 50 50 - 0.1 <0.1 -Leersia oryzoides 23 19 50 25 100 0.2 0.2 3.8 Carex atlantica 192 -97 50 25 33 <0.1 <0.1 <0.1Lachnanthes caroliniana 26 -173 - 25 33 - <0.1 <0.1 Bartonia paniculata 212 -18 25 - 33 <0.1 - <0.1Gaylussacia frondosa 26 -173 - 25 33 - <0.1 <0.1 Eubotrys racemosa 226 -17 75 50 33 0.5 0.2 0.2Schizachyrium scoparium 32 4 25 - 33 <0.1 - <0.1 Juncus pelocarpus 244 121 100 100 - 0.1 0.1 -Acer rubrum 37 -23 50 50 100 <0.1 0.1 0.2 Sparganium americanum 246 51 50 - 33 0.1 - 7.5Hypericum canadense 37 248 25 50 33 <0.1 <0.1 <0.1 Carex collinsii 258 -125 25 25 - <0.1 <0.1 -Lysimachia terrestris 39 39 25 25 67 <0.1 <0.1 0.1 Drosera rotundifolia 263 83 75 50 - 0.1 <0.1 -Carex striata 51 -90 - 50 - - 0.5 - Rhynchospora alba 342 -21 50 - - <0.1 - -Triadenum virginicum 64 100 50 100 100 <0.1 0.2 0.3 Gaylussacia dumosa 342 -21 50 - - 0.3 - -Dulichium arundinaceum 75 100 50 100 100 0.2 0.8 0.1 Orontium aquaticum 358 141 50 25 - 0.2 0.1 -Eleocharis robbinsii 82 158 25 100 33 3.3 1.8 0.7 Eriocaulon aquaticum 425 52 75 - - 2.2 - -Eleocharis flav. v. olivacea 89 240 25 75 33 0.2 1.0 <0.1
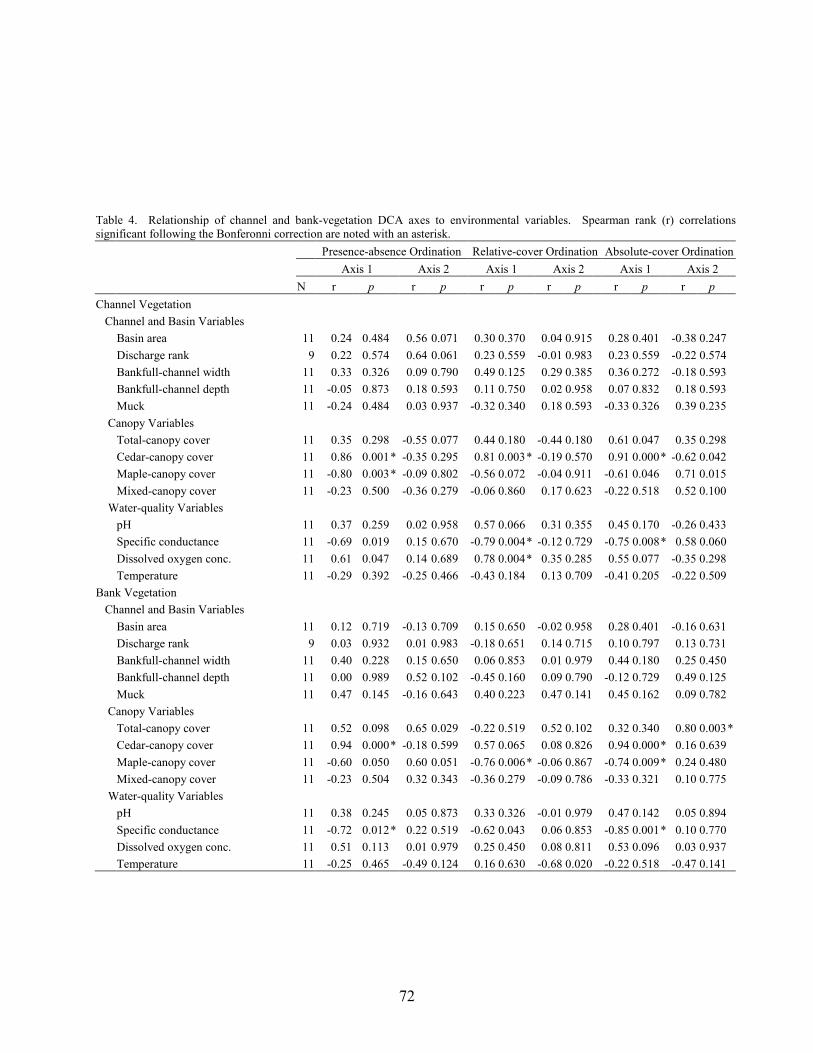
72
Table 4. Relationship of channel and bank-vegetation DCA axes to environmental variables. Spearman rank (r) correlations significant following the Bonferonni correction are noted with an asterisk. Presence-absence Ordination Relative-cover Ordination Absolute-cover Ordination Axis 1 Axis 2 Axis 1 Axis 2 Axis 1 Axis 2 N r p r p r p r p r p r p Channel Vegetation Channel and Basin Variables Basin area 11 0.24 0.484 0.56 0.071 0.30 0.370 0.04 0.915 0.28 0.401 -0.38 0.247 Discharge rank 9 0.22 0.574 0.64 0.061 0.23 0.559 -0.01 0.983 0.23 0.559 -0.22 0.574 Bankfull-channel width 11 0.33 0.326 0.09 0.790 0.49 0.125 0.29 0.385 0.36 0.272 -0.18 0.593 Bankfull-channel depth 11 -0.05 0.873 0.18 0.593 0.11 0.750 0.02 0.958 0.07 0.832 0.18 0.593 Muck 11 -0.24 0.484 0.03 0.937 -0.32 0.340 0.18 0.593 -0.33 0.326 0.39 0.235 Canopy Variables Total-canopy cover 11 0.35 0.298 -0.55 0.077 0.44 0.180 -0.44 0.180 0.61 0.047 0.35 0.298 Cedar-canopy cover 11 0.86 0.001* -0.35 0.295 0.81 0.003* -0.19 0.570 0.91 0.000* -0.62 0.042 Maple-canopy cover 11 -0.80 0.003* -0.09 0.802 -0.56 0.072 -0.04 0.911 -0.61 0.046 0.71 0.015 Mixed-canopy cover 11 -0.23 0.500 -0.36 0.279 -0.06 0.860 0.17 0.623 -0.22 0.518 0.52 0.100 Water-quality Variables pH 11 0.37 0.259 0.02 0.958 0.57 0.066 0.31 0.355 0.45 0.170 -0.26 0.433 Specific conductance 11 -0.69 0.019 0.15 0.670 -0.79 0.004* -0.12 0.729 -0.75 0.008* 0.58 0.060 Dissolved oxygen conc. 11 0.61 0.047 0.14 0.689 0.78 0.004* 0.35 0.285 0.55 0.077 -0.35 0.298 Temperature 11 -0.29 0.392 -0.25 0.466 -0.43 0.184 0.13 0.709 -0.41 0.205 -0.22 0.509 Bank Vegetation Channel and Basin Variables Basin area 11 0.12 0.719 -0.13 0.709 0.15 0.650 -0.02 0.958 0.28 0.401 -0.16 0.631 Discharge rank 9 0.03 0.932 0.01 0.983 -0.18 0.651 0.14 0.715 0.10 0.797 0.13 0.731 Bankfull-channel width 11 0.40 0.228 0.15 0.650 0.06 0.853 0.01 0.979 0.44 0.180 0.25 0.450 Bankfull-channel depth 11 0.00 0.989 0.52 0.102 -0.45 0.160 0.09 0.790 -0.12 0.729 0.49 0.125 Muck 11 0.47 0.145 -0.16 0.643 0.40 0.223 0.47 0.141 0.45 0.162 0.09 0.782 Canopy Variables Total-canopy cover 11 0.52 0.098 0.65 0.029 -0.22 0.519 0.52 0.102 0.32 0.340 0.80 0.003* Cedar-canopy cover 11 0.94 0.000* -0.18 0.599 0.57 0.065 0.08 0.826 0.94 0.000* 0.16 0.639 Maple-canopy cover 11 -0.60 0.050 0.60 0.051 -0.76 0.006* -0.06 0.867 -0.74 0.009* 0.24 0.480 Mixed-canopy cover 11 -0.23 0.504 0.32 0.343 -0.36 0.279 -0.09 0.786 -0.33 0.321 0.10 0.775 Water-quality Variables pH 11 0.38 0.245 0.05 0.873 0.33 0.326 -0.01 0.979 0.47 0.142 0.05 0.894 Specific conductance 11 -0.72 0.012* 0.22 0.519 -0.62 0.043 0.06 0.853 -0.85 0.001* 0.10 0.770 Dissolved oxygen conc. 11 0.51 0.113 0.01 0.979 0.25 0.450 0.08 0.811 0.53 0.096 0.03 0.937 Temperature 11 -0.25 0.465 -0.49 0.124 0.16 0.630 -0.68 0.020 -0.22 0.518 -0.47 0.141
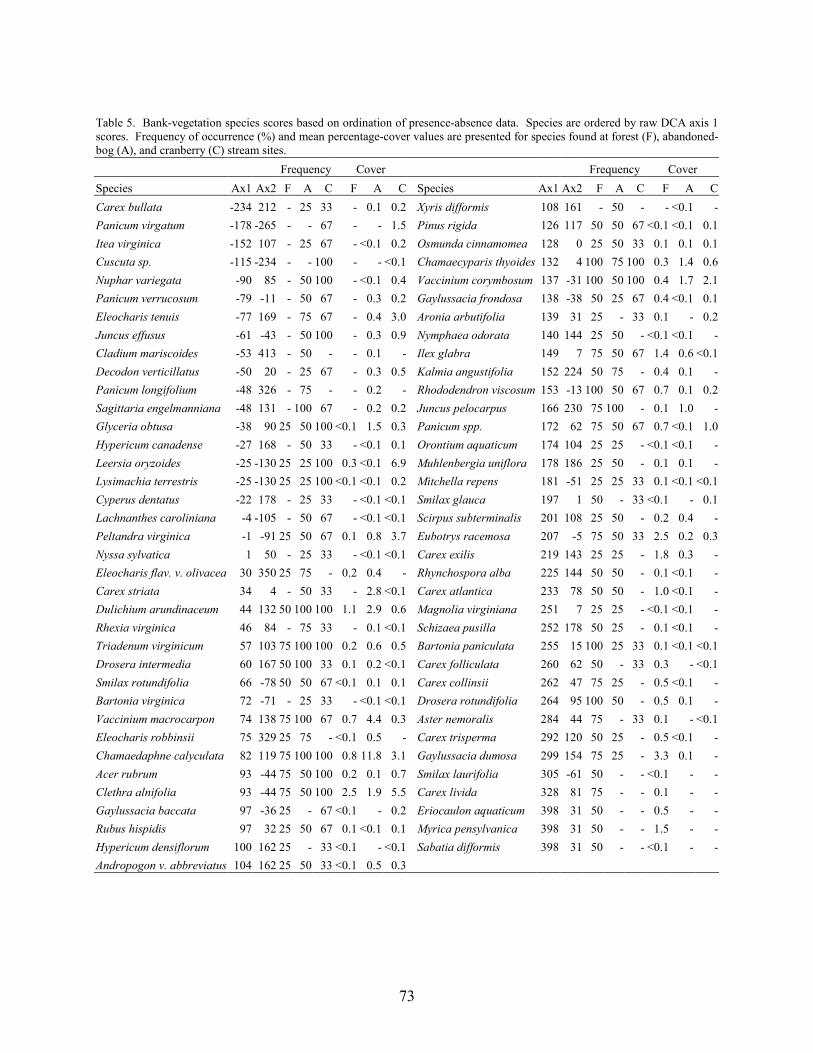
73
Table 5. Bank-vegetation species scores based on ordination of presence-absence data. Species are ordered by raw DCA axis 1 scores. Frequency of occurrence (%) and mean percentage-cover values are presented for species found at forest (F), abandoned-bog (A), and cranberry (C) stream sites. Frequency Cover Frequency Cover Species Ax1 Ax2 F A C F A C Species Ax1 Ax2 F A C F A CCarex bullata -234 212 - 25 33 - 0.1 0.2 Xyris difformis 108 161 - 50 - - <0.1 -Panicum virgatum -178 -265 - - 67 - - 1.5 Pinus rigida 126 117 50 50 67 <0.1 <0.1 0.1Itea virginica -152 107 - 25 67 - <0.1 0.2 Osmunda cinnamomea 128 0 25 50 33 0.1 0.1 0.1Cuscuta sp. -115 -234 - - 100 - - <0.1 Chamaecyparis thyoides 132 4 100 75 100 0.3 1.4 0.6Nuphar variegata -90 85 - 50 100 - <0.1 0.4 Vaccinium corymbosum 137 -31 100 50 100 0.4 1.7 2.1Panicum verrucosum -79 -11 - 50 67 - 0.3 0.2 Gaylussacia frondosa 138 -38 50 25 67 0.4 <0.1 0.1Eleocharis tenuis -77 169 - 75 67 - 0.4 3.0 Aronia arbutifolia 139 31 25 - 33 0.1 - 0.2Juncus effusus -61 -43 - 50 100 - 0.3 0.9 Nymphaea odorata 140 144 25 50 - <0.1 <0.1 -Cladium mariscoides -53 413 - 50 - - 0.1 - Ilex glabra 149 7 75 50 67 1.4 0.6 <0.1Decodon verticillatus -50 20 - 25 67 - 0.3 0.5 Kalmia angustifolia 152 224 50 75 - 0.4 0.1 -Panicum longifolium -48 326 - 75 - - 0.2 - Rhododendron viscosum 153 -13 100 50 67 0.7 0.1 0.2Sagittaria engelmanniana -48 131 - 100 67 - 0.2 0.2 Juncus pelocarpus 166 230 75 100 - 0.1 1.0 -Glyceria obtusa -38 90 25 50 100 <0.1 1.5 0.3 Panicum spp. 172 62 75 50 67 0.7 <0.1 1.0Hypericum canadense -27 168 - 50 33 - <0.1 0.1 Orontium aquaticum 174 104 25 25 - <0.1 <0.1 -Leersia oryzoides -25 -130 25 25 100 0.3 <0.1 6.9 Muhlenbergia uniflora 178 186 25 50 - 0.1 0.1 -Lysimachia terrestris -25 -130 25 25 100 <0.1 <0.1 0.2 Mitchella repens 181 -51 25 25 33 0.1 <0.1 <0.1Cyperus dentatus -22 178 - 25 33 - <0.1 <0.1 Smilax glauca 197 1 50 - 33 <0.1 - 0.1Lachnanthes caroliniana -4 -105 - 50 67 - <0.1 <0.1 Scirpus subterminalis 201 108 25 50 - 0.2 0.4 -Peltandra virginica -1 -91 25 50 67 0.1 0.8 3.7 Eubotrys racemosa 207 -5 75 50 33 2.5 0.2 0.3Nyssa sylvatica 1 50 - 25 33 - <0.1 <0.1 Carex exilis 219 143 25 25 - 1.8 0.3 -Eleocharis flav. v. olivacea 30 350 25 75 - 0.2 0.4 - Rhynchospora alba 225 144 50 50 - 0.1 <0.1 -Carex striata 34 4 - 50 33 - 2.8 <0.1 Carex atlantica 233 78 50 50 - 1.0 <0.1 -Dulichium arundinaceum 44 132 50 100 100 1.1 2.9 0.6 Magnolia virginiana 251 7 25 25 - <0.1 <0.1 -Rhexia virginica 46 84 - 75 33 - 0.1 <0.1 Schizaea pusilla 252 178 50 25 - 0.1 <0.1 -Triadenum virginicum 57 103 75 100 100 0.2 0.6 0.5 Bartonia paniculata 255 15 100 25 33 0.1 <0.1 <0.1Drosera intermedia 60 167 50 100 33 0.1 0.2 <0.1 Carex folliculata 260 62 50 - 33 0.3 - <0.1Smilax rotundifolia 66 -78 50 50 67 <0.1 0.1 0.1 Carex collinsii 262 47 75 25 - 0.5 <0.1 -Bartonia virginica 72 -71 - 25 33 - <0.1 <0.1 Drosera rotundifolia 264 95 100 50 - 0.5 0.1 -Vaccinium macrocarpon 74 138 75 100 67 0.7 4.4 0.3 Aster nemoralis 284 44 75 - 33 0.1 - <0.1Eleocharis robbinsii 75 329 25 75 - <0.1 0.5 - Carex trisperma 292 120 50 25 - 0.5 <0.1 -Chamaedaphne calyculata 82 119 75 100 100 0.8 11.8 3.1 Gaylussacia dumosa 299 154 75 25 - 3.3 0.1 -Acer rubrum 93 -44 75 50 100 0.2 0.1 0.7 Smilax laurifolia 305 -61 50 - - <0.1 - -Clethra alnifolia 93 -44 75 50 100 2.5 1.9 5.5 Carex livida 328 81 75 - - 0.1 - -Gaylussacia baccata 97 -36 25 - 67 <0.1 - 0.2 Eriocaulon aquaticum 398 31 50 - - 0.5 - -Rubus hispidis 97 32 25 50 67 0.1 <0.1 0.1 Myrica pensylvanica 398 31 50 - - 1.5 - -Hypericum densiflorum 100 162 25 - 33 <0.1 - <0.1 Sabatia difformis 398 31 50 - - <0.1 - -Andropogon v. abbreviatus 104 162 25 50 33 <0.1 0.5 0.3
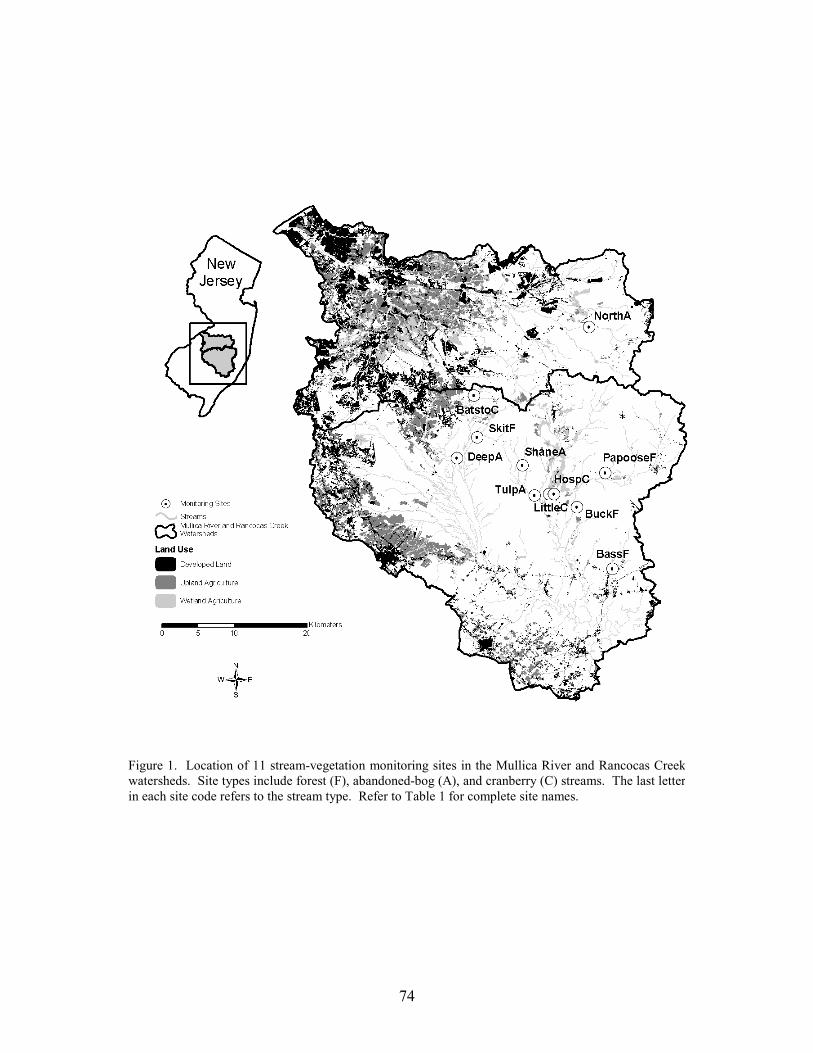
74
Figure 1. Location of 11 stream-vegetation monitoring sites in the Mullica River and Rancocas Creekwatersheds. Site types include forest (F), abandoned-bog (A), and cranberry (C) streams. The last letter in each site code refers to the stream type. Refer to Table 1 for complete site names.
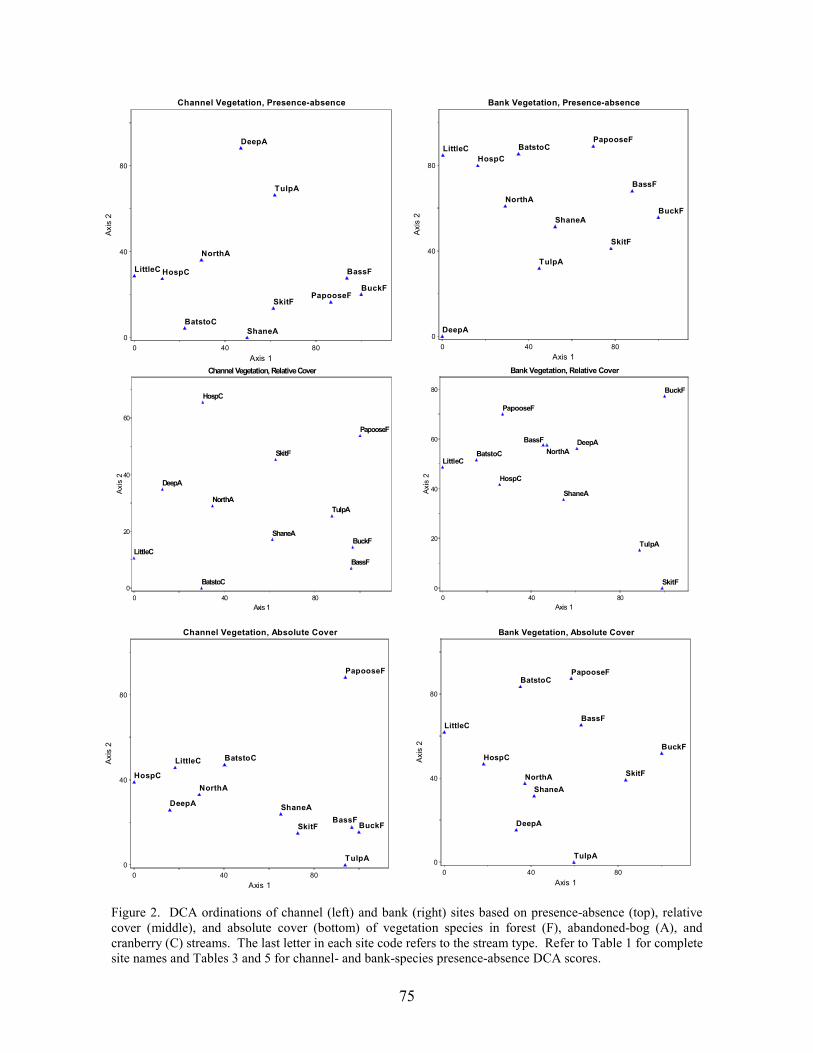
75
TulpA
NorthA
LittleC HospC
DeepA
BatstoCShaneA
PapooseF
BassF
BuckFSkitF
00
40 80
40
80
Channel Vegetation, Presence-absence
Axis 1
Axis
2
TulpA
NorthA
LittleC
HospC
DeepA
BatstoC
ShaneA
PapooseF
BassFBuckFSkitF
00
40 80
40
80
Channel Vegetation, Absolute Cover
Axis 1
Axi
s 2
TulpANorthA
LittleC
HospC
DeepA
BatstoC
ShaneA
PapooseF
BassF
BuckF
SkitF
00
40 80
20
40
60
Channel Vegetation, Relative Cover
Axis 1
Axi
s 2
TulpA
NorthA
LittleCHospC
DeepA
BatstoC
ShaneA
PapooseF
BassF
BuckF
SkitF
00
40 80
40
80
Bank Vegetation, Presence-absence
Axis 1
Axi
s 2
TulpA
NorthALittleC
HospC
DeepABatstoC
ShaneA
PapooseF
BassF
BuckF
SkitF
00
40 80
20
40
60
80
Bank Vegetation, Relative Cover
Axis 1
Axis
2
TulpA
NorthA
LittleC
HospC
DeepA
BatstoC
ShaneA
PapooseF
BassF
BuckF
SkitF
00
40 80
40
80
Bank Vegetation, Absolute Cover
Axis 1
Axis
2
Figure 2. DCA ordinations of channel (left) and bank (right) sites based on presence-absence (top), relative cover (middle), and absolute cover (bottom) of vegetation species in forest (F), abandoned-bog (A), and cranberry (C) streams. The last letter in each site code refers to the stream type. Refer to Table 1 for completesite names and Tables 3 and 5 for channel- and bank-species presence-absence DCA scores.

76
Appendix. Mean bank (B) and channel (C) percentage-cover values for herbaceous and woody plants found at forest, abandoned-bog, and cranberry streams. Total, channel, and bank-species richness values are presented at the bottom of the table. Forest Streams Abandoned-bog Streams Cranberry Streams
Buck RunE. Br.
Bass RiverPapooseBranch
Skit Branch Deep Run
N. Br. Mt. Misery
Brook Shane Branch
TulpehockenCreek
Batsto River
HospitalityBrook
Little Hauken
Run Species B C B C B C B C B C B C B C B C B C B C B CHerbaceous species: Amphicarpum purshii - - - - - - - - - - - - 0.01 - - - - - - - - -Andropogon v. abbreviatus - - - - - - 0.04 - - - - - 0.89 - 1.03 - - - 1.00 0.19 - -Aster nemoralis 0.20 - 0.18 - - - 0.18 0.02 - - - - - - - - 0.10 0.01 - 0.02 - -Aster novi-belgii - - - - - - - - - - - - - - - - - - 0.08 0.08 - -Bartonia paniculata 0.15 0.03 0.04 - 0.22 - 0.04 - - - - - 0.01 - - - 0.03 0.01 - - - -Bartonia virginica - - - - - - - - - - - - 0.01 - - - 0.01 - - - - -Calamogrostis cinnoides - - - - - - 0.04 - - - - - - - - - - - - - - -Carex atlantica 3.90 0.10 - - 0.03 - - 0.02 - - - - 0.05 0.01 0.03 - - 0.01 - - - -Carex atlantica v. capillacea - - - - - - - - - - - - - - - - 0.10 - - - - -Carex bullata - - - - - - - - 0.25 - - - - - - - - - - - 0.72 0.01Carex collinsii - - 0.04 - 1.81 0.19 0.04 - - - - - 0.01 <0.01 - - - - - - - -Carex exilis - - - - - - 7.36 0.90 - - - - 1.20 0.01 - - - - - - - -Carex folliculata 1.00 0.20 - - - - 0.07 - - - - - - - - - 0.06 - - - - -Carex intumescens - - - - - - - - - - - - - - - - 1.30 0.01 - - - -Carex livida 0.10 - - - 0.33 - 0.14 - - - - - - - - - - - - 0.30 - -Carex lurida - - - - - - - - - - - - - - - - 0.03 0.01 - - - -Carex striata - - - - - - - - - - 3.80 0.77 7.25 1.05 - - 0.06 - - - - -Carex stricta - - - - - - - - - - - - - 0.02 - - - - - - 0.22 0.01Carex trisperma 0.80 - - - - - 1.07 0.14 - - - - 0.01 <0.01 - - - - - - - -Chasmanthium laxum - - - - - - - - - - - - - - - - 1.11 0.05 - - - -Cladium mariscoides - - - - - - - - 0.54 0.18 - - 0.05 0.02 - - - - - - - -Cuscuta sp. - - - - - - - - - - - - - - - - 0.01 0.01 0.13 0.05 0.01 -Cyperus dentatus - - - - - - - - - - - - - - 0.18 - - - 0.06 - - -Danthonia sericea v. epilis - - - - - - 0.04 - - - - - - - - - - - - - - -Decodon verticillatus - - - - - - - - - - 1.25 1.57 - - - - 0.25 0.01 1.28 0.63 - -Dioscorea villosa - - - - 0.06 - - - - - - - - - - - - - - - - -Drosera filiformis - - - - - - - - - - - - - - 0.60 - - - - - - -Drosera intermedia - - 0.25 0.07 - - 0.25 0.24 0.02 - 0.16 0.05 0.52 0.12 0.23 - - - - - 0.01 -Drosera rotundifolia 0.50 0.10 0.50 - 0.42 0.06 0.57 0.10 - 0.01 - - 0.14 0.01 0.13 - - - - - - -
76
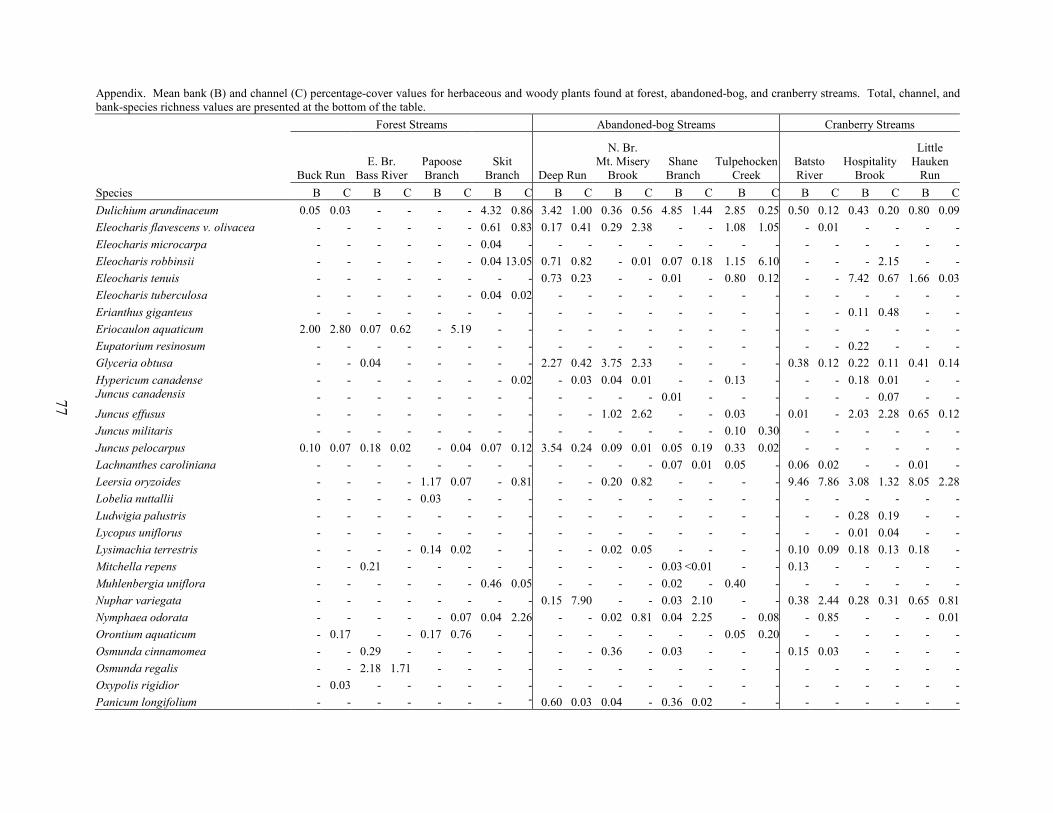
77
Appendix. Mean bank (B) and channel (C) percentage-cover values for herbaceous and woody plants found at forest, abandoned-bog, and cranberry streams. Total, channel, and bank-species richness values are presented at the bottom of the table. Forest Streams Abandoned-bog Streams Cranberry Streams
Buck RunE. Br.
Bass RiverPapooseBranch
Skit Branch Deep Run
N. Br. Mt. Misery
Brook Shane Branch
TulpehockenCreek
Batsto River
HospitalityBrook
Little Hauken
Run Species B C B C B C B C B C B C B C B C B C B C B CDulichium arundinaceum 0.05 0.03 - - - - 4.32 0.86 3.42 1.00 0.36 0.56 4.85 1.44 2.85 0.25 0.50 0.12 0.43 0.20 0.80 0.09Eleocharis flavescens v. olivacea - - - - - - 0.61 0.83 0.17 0.41 0.29 2.38 - - 1.08 1.05 - 0.01 - - - -Eleocharis microcarpa - - - - - - 0.04 - - - - - - - - - - - - - - -Eleocharis robbinsii - - - - - - 0.04 13.05 0.71 0.82 - 0.01 0.07 0.18 1.15 6.10 - - - 2.15 - -Eleocharis tenuis - - - - - - - - 0.73 0.23 - - 0.01 - 0.80 0.12 - - 7.42 0.67 1.66 0.03Eleocharis tuberculosa - - - - - - 0.04 0.02 - - - - - - - - - - - - - -Erianthus giganteus - - - - - - - - - - - - - - - - - - 0.11 0.48 - -Eriocaulon aquaticum 2.00 2.80 0.07 0.62 - 5.19 - - - - - - - - - - - - - - - -Eupatorium resinosum - - - - - - - - - - - - - - - - - - 0.22 - - -Glyceria obtusa - - 0.04 - - - - - 2.27 0.42 3.75 2.33 - - - - 0.38 0.12 0.22 0.11 0.41 0.14Hypericum canadense - - - - - - - 0.02 - 0.03 0.04 0.01 - - 0.13 - - - 0.18 0.01 - -Juncus canadensis - - - - - - - - - - - - 0.01 - - - - - - 0.07 - -Juncus effusus - - - - - - - - - - 1.02 2.62 - - 0.03 - 0.01 - 2.03 2.28 0.65 0.12Juncus militaris - - - - - - - - - - - - - - 0.10 0.30 - - - - - -Juncus pelocarpus 0.10 0.07 0.18 0.02 - 0.04 0.07 0.12 3.54 0.24 0.09 0.01 0.05 0.19 0.33 0.02 - - - - - -Lachnanthes caroliniana - - - - - - - - - - - - 0.07 0.01 0.05 - 0.06 0.02 - - 0.01 -Leersia oryzoides - - - - 1.17 0.07 - 0.81 - - 0.20 0.82 - - - - 9.46 7.86 3.08 1.32 8.05 2.28Lobelia nuttallii - - - - 0.03 - - - - - - - - - - - - - - - - -Ludwigia palustris - - - - - - - - - - - - - - - - - - 0.28 0.19 - -Lycopus uniflorus - - - - - - - - - - - - - - - - - - 0.01 0.04 - -Lysimachia terrestris - - - - 0.14 0.02 - - - - 0.02 0.05 - - - - 0.10 0.09 0.18 0.13 0.18 -Mitchella repens - - 0.21 - - - - - - - - - 0.03 <0.01 - - 0.13 - - - - -Muhlenbergia uniflora - - - - - - 0.46 0.05 - - - - 0.02 - 0.40 - - - - - - -Nuphar variegata - - - - - - - - 0.15 7.90 - - 0.03 2.10 - - 0.38 2.44 0.28 0.31 0.65 0.81Nymphaea odorata - - - - - 0.07 0.04 2.26 - - 0.02 0.81 0.04 2.25 - 0.08 - 0.85 - - - 0.01Orontium aquaticum - 0.17 - - 0.17 0.76 - - - - - - - - 0.05 0.20 - - - - - -Osmunda cinnamomea - - 0.29 - - - - - - - 0.36 - 0.03 - - - 0.15 0.03 - - - -Osmunda regalis - - 2.18 1.71 - - - - - - - - - - - - - - - - - -Oxypolis rigidior - 0.03 - - - - - - - - - - - - - - - - - - - -Panicum longifolium - - - - - - - - 0.60 0.03 0.04 - 0.36 0.02 - - - - - - - -
77
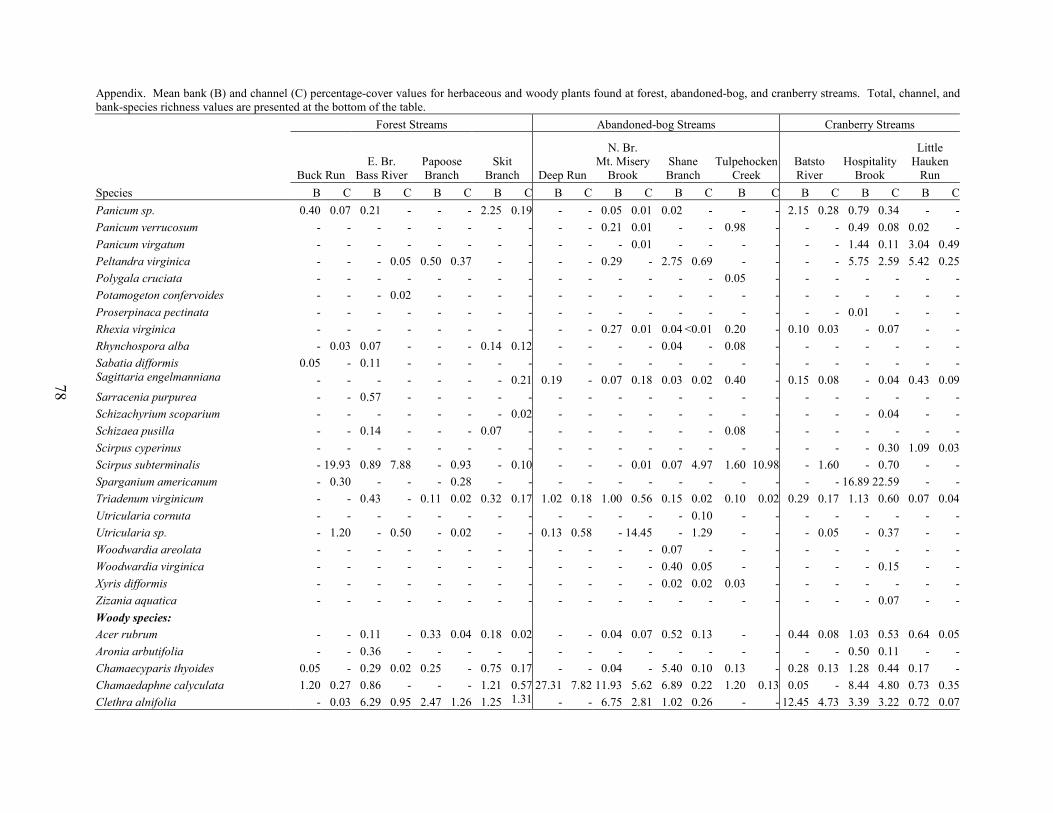
78
Appendix. Mean bank (B) and channel (C) percentage-cover values for herbaceous and woody plants found at forest, abandoned-bog, and cranberry streams. Total, channel, and bank-species richness values are presented at the bottom of the table. Forest Streams Abandoned-bog Streams Cranberry Streams
Buck RunE. Br.
Bass RiverPapooseBranch
Skit Branch Deep Run
N. Br. Mt. Misery
Brook Shane Branch
TulpehockenCreek
Batsto River
HospitalityBrook
Little Hauken
Run Species B C B C B C B C B C B C B C B C B C B C B CPanicum sp. 0.40 0.07 0.21 - - - 2.25 0.19 - - 0.05 0.01 0.02 - - - 2.15 0.28 0.79 0.34 - -Panicum verrucosum - - - - - - - - - - 0.21 0.01 - - 0.98 - - - 0.49 0.08 0.02 -Panicum virgatum - - - - - - - - - - - 0.01 - - - - - - 1.44 0.11 3.04 0.49Peltandra virginica - - - 0.05 0.50 0.37 - - - - 0.29 - 2.75 0.69 - - - - 5.75 2.59 5.42 0.25Polygala cruciata - - - - - - - - - - - - - - 0.05 - - - - - - -Potamogeton confervoides - - - 0.02 - - - - - - - - - - - - - - - - - -Proserpinaca pectinata - - - - - - - - - - - - - - - - - - 0.01 - - -Rhexia virginica - - - - - - - - - - 0.27 0.01 0.04 <0.01 0.20 - 0.10 0.03 - 0.07 - -Rhynchospora alba - 0.03 0.07 - - - 0.14 0.12 - - - - 0.04 - 0.08 - - - - - - -Sabatia difformis 0.05 - 0.11 - - - - - - - - - - - - - - - - - - -Sagittaria engelmanniana - - - - - - - 0.21 0.19 - 0.07 0.18 0.03 0.02 0.40 - 0.15 0.08 - 0.04 0.43 0.09Sarracenia purpurea - - 0.57 - - - - - - - - - - - - - - - - - - -Schizachyrium scoparium - - - - - - - 0.02 - - - - - - - - - - - 0.04 - -Schizaea pusilla - - 0.14 - - - 0.07 - - - - - - - 0.08 - - - - - - -Scirpus cyperinus - - - - - - - - - - - - - - - - - - - 0.30 1.09 0.03Scirpus subterminalis - 19.93 0.89 7.88 - 0.93 - 0.10 - - - 0.01 0.07 4.97 1.60 10.98 - 1.60 - 0.70 - -Sparganium americanum - 0.30 - - - 0.28 - - - - - - - - - - - - 16.89 22.59 - -Triadenum virginicum - - 0.43 - 0.11 0.02 0.32 0.17 1.02 0.18 1.00 0.56 0.15 0.02 0.10 0.02 0.29 0.17 1.13 0.60 0.07 0.04Utricularia cornuta - - - - - - - - - - - - - 0.10 - - - - - - - -Utricularia sp. - 1.20 - 0.50 - 0.02 - - 0.13 0.58 - 14.45 - 1.29 - - - 0.05 - 0.37 - -Woodwardia areolata - - - - - - - - - - - - 0.07 - - - - - - - - -Woodwardia virginica - - - - - - - - - - - - 0.40 0.05 - - - - - 0.15 - -Xyris difformis - - - - - - - - - - - - 0.02 0.02 0.03 - - - - - - -Zizania aquatica - - - - - - - - - - - - - - - - - - - 0.07 - -Woody species: Acer rubrum - - 0.11 - 0.33 0.04 0.18 0.02 - - 0.04 0.07 0.52 0.13 - - 0.44 0.08 1.03 0.53 0.64 0.05Aronia arbutifolia - - 0.36 - - - - - - - - - - - - - - - 0.50 0.11 - -Chamaecyparis thyoides 0.05 - 0.29 0.02 0.25 - 0.75 0.17 - - 0.04 - 5.40 0.10 0.13 - 0.28 0.13 1.28 0.44 0.17 -Chamaedaphne calyculata 1.20 0.27 0.86 - - - 1.21 0.57 27.31 7.82 11.93 5.62 6.89 0.22 1.20 0.13 0.05 - 8.44 4.80 0.73 0.35Clethra alnifolia - 0.03 6.29 0.95 2.47 1.26 1.25 1.31 - - 6.75 2.81 1.02 0.26 - - 12.45 4.73 3.39 3.22 0.72 0.07
78
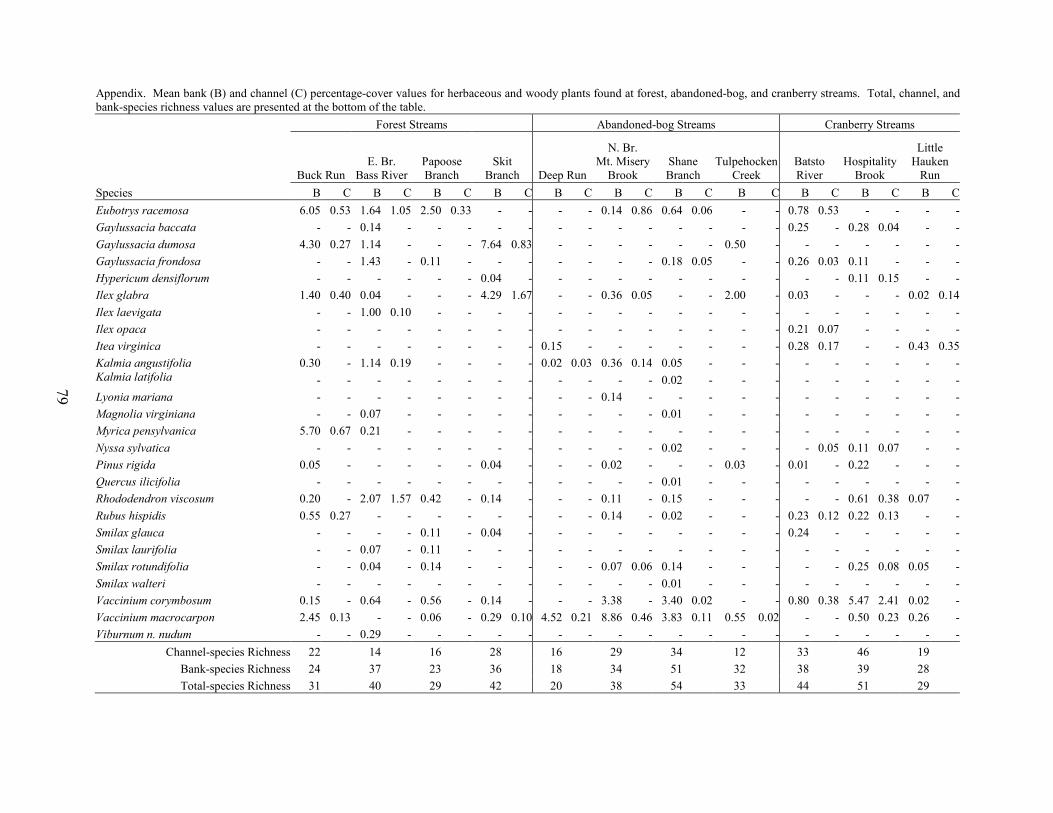
79
Appendix. Mean bank (B) and channel (C) percentage-cover values for herbaceous and woody plants found at forest, abandoned-bog, and cranberry streams. Total, channel, and bank-species richness values are presented at the bottom of the table. Forest Streams Abandoned-bog Streams Cranberry Streams
Buck RunE. Br.
Bass RiverPapooseBranch
Skit Branch Deep Run
N. Br. Mt. Misery
Brook Shane Branch
TulpehockenCreek
Batsto River
HospitalityBrook
Little Hauken
Run Species B C B C B C B C B C B C B C B C B C B C B CEubotrys racemosa 6.05 0.53 1.64 1.05 2.50 0.33 - - - - 0.14 0.86 0.64 0.06 - - 0.78 0.53 - - - -Gaylussacia baccata - - 0.14 - - - - - - - - - - - - - 0.25 - 0.28 0.04 - -Gaylussacia dumosa 4.30 0.27 1.14 - - - 7.64 0.83 - - - - - - 0.50 - - - - - - -Gaylussacia frondosa - - 1.43 - 0.11 - - - - - - - 0.18 0.05 - - 0.26 0.03 0.11 - - -Hypericum densiflorum - - - - - - 0.04 - - - - - - - - - - - 0.11 0.15 - -Ilex glabra 1.40 0.40 0.04 - - - 4.29 1.67 - - 0.36 0.05 - - 2.00 - 0.03 - - - 0.02 0.14Ilex laevigata - - 1.00 0.10 - - - - - - - - - - - - - - - - - -Ilex opaca - - - - - - - - - - - - - - - - 0.21 0.07 - - - -Itea virginica - - - - - - - - 0.15 - - - - - - - 0.28 0.17 - - 0.43 0.35Kalmia angustifolia 0.30 - 1.14 0.19 - - - - 0.02 0.03 0.36 0.14 0.05 - - - - - - - - -Kalmia latifolia - - - - - - - - - - - - 0.02 - - - - - - - - -Lyonia mariana - - - - - - - - - - 0.14 - - - - - - - - - - -Magnolia virginiana - - 0.07 - - - - - - - - - 0.01 - - - - - - - - -Myrica pensylvanica 5.70 0.67 0.21 - - - - - - - - - - - - - - - - - - -Nyssa sylvatica - - - - - - - - - - - - 0.02 - - - - 0.05 0.11 0.07 - -Pinus rigida 0.05 - - - - - 0.04 - - - 0.02 - - - 0.03 - 0.01 - 0.22 - - -Quercus ilicifolia - - - - - - - - - - - - 0.01 - - - - - - - - -Rhododendron viscosum 0.20 - 2.07 1.57 0.42 - 0.14 - - - 0.11 - 0.15 - - - - - 0.61 0.38 0.07 -Rubus hispidis 0.55 0.27 - - - - - - - - 0.14 - 0.02 - - - 0.23 0.12 0.22 0.13 - -Smilax glauca - - - - 0.11 - 0.04 - - - - - - - - - 0.24 - - - - -Smilax laurifolia - - 0.07 - 0.11 - - - - - - - - - - - - - - - - -Smilax rotundifolia - - 0.04 - 0.14 - - - - - 0.07 0.06 0.14 - - - - - 0.25 0.08 0.05 -Smilax walteri - - - - - - - - - - - - 0.01 - - - - - - - - -Vaccinium corymbosum 0.15 - 0.64 - 0.56 - 0.14 - - - 3.38 - 3.40 0.02 - - 0.80 0.38 5.47 2.41 0.02 -Vaccinium macrocarpon 2.45 0.13 - - 0.06 - 0.29 0.10 4.52 0.21 8.86 0.46 3.83 0.11 0.55 0.02 - - 0.50 0.23 0.26 -Viburnum n. nudum - - 0.29 - - - - - - - - - - - - - - - - - - -
Channel-species Richness 22 14 16 28 16 29 34 12 33 46 19Bank-species Richness 24 37 23 36 18 34 51 32 38 39 28Total-species Richness 31 40 29 42 20 38 54 33 44 51 29
79

81
PART 5. MACROINVERTEBRATE ASSEMBLAGES IN PINELANDS STREAMS DRAINING ACTIVE-CRANBERRY BOGS, ABANDONED-CRANBERRY BOGS, AND FOREST LAND
Robert A. Zampella, John F. Bunnell,
Nicholas A. Procopio, and Dean Bryson
Abstract
We compared the composition of macroinvertebrate assemblages collected from three habitats (muck, vegetated muck, and woody debris) in twelve New Jersey Pinelands blackwater streams draining forest land, abandoned-cranberry bogs, and active-cranberry bogs. We address two questions. First, are variations in macroinvertebrate assemblages related to differences in past and present land uses within the associated drainage basin? Secondly, do macroinvertebrate assemblages vary between habitats? Although the primary focus is family-level assemblages, we also evaluate community patterns at the genus level. All twelve streams were relatively slow moving and acidic, with low conductance values and dissolved-oxygen concentrations. Muck was the dominant sediment at most sites. Although no single environmental variable clearly separated the three stream types, higher dissolved-oxygen levels, lower water temperatures and specific conductance values, and a higher percentage of woody debris generally characterized the forest streams. Family richness was significantly different between forest and abandoned-bog streams. We found no statistically significant difference in mean genus richness between individual stream types. Mean family and genus richness was similar among muck, vegetated-muck, and woody-debris habitats. Cranberry and forest sites shared more families in common than each shared with abandoned-bog sites, and muck and vegetated-muck habitats shared more taxa in common than either shared with woody debris. Compared to abandoned-bog and cranberry sites, the highest number of genera restricted to a single stream type was found at forest sites. Both family-level and genus-level macroinvertebrate composition differed significantly between the cranberry streams and the other two stream classes, regardless of habitat type (muck, vegetated muck, and woody debris). Overall, the effect of stream type appears to overshadow that of habitat. Tubificidae, Chironomidae, and Asellidae were the most abundant and widespread families. Ephemeroptera, Plecoptera, and Trichoptera (EPT) composition differed significantly between each of the three stream types, with mayflies, stoneflies, and caddisflies occurring more frequently at forest sites. Genus-level chironomid composition differed significantly between cranberry and both forest and abandoned-bog streams. Because many of the taxa that we encountered are adapted to lentic habitats and slow-moving lotic habitats or low-oxygen environments, we attributed some of the variation in community composition to subtle differences in dissolved-oxygen levels. Although not conclusive, our results suggest that variations in macroinvertebrate composition may be related to a complex environmental gradient involving dissolved oxygen, temperature, specific conductance, stream width, and woody debris. The relationship between reduced canopy cover and both lower woody-debris cover and higher stream temperatures, which can influence dissolved-oxygen levels, is most likely related to deforestation associated with historic and active cranberry agriculture.
82
Introduction
Urban and agricultural land uses within a drainage basin may strongly influence the composition of stream-macroinvertebrate communities (Jones and Clark 1987, Lenat and Crawford 1994, Delong and Brusven 1998, Kennen 1999, Sponseller et al. 2001, Stephenuck et al. 2002, Stewart et al. 2003). Although present-day land uses may explain appreciable variation in stream-macroinvertebrate composition, the long-term effect of historic land uses, especially agriculture, must also be considered (Foster et al. 2003, Harding et al. 1998). Cranberry agriculture, which involves clearing land to construct bogs, damming streams to establish reservoirs, and controlling the flow of water by channelizing stream segments and creating extensive ditch networks (Eck 1990), is a major land use in parts of the New Jersey Pinelands (Pine Barrens). The native cranberry was first cultivated in New Jersey in the mid-19th century. Since that time, the industry has been an important landscape-shaping factor. Harvested cranberry acreage, estimated to be about 3,100 acres in 2002 (U.S. Department of Agriculture 2003), represents less than one-third of the 11,200 acres that existed at the peak of bog cultivation in 1919 (Eck 1990). Abandoned-cranberry bogs are now a common feature of the Pinelands landscape.
New Jersey Pinelands streams are representative of blackwater coastal plain streams found along the east coast and Gulf Coast of the United States (Patrick 1996). Previous studies have compared the composition of fish, frog, and plant assemblages in Pinelands streams draining basins with active-cranberry agriculture, abandoned-cranberry bogs, and developed and upland-agricultural land (altered land) to basins with no altered land or evidence of past or present cranberry cultivation. A major difference between the forested and altered-land watersheds is the occurrence of nonnative species in the altered basins (Hastings 1979, 1984, Morgan and Philipp 1986, Zampella and Laidig 1997, Zampella and Bunnell 1998, 2000). Although these studies have demonstrated that streams draining basins with active-cranberry and abandoned-cranberry bogs support native fish, frog, and plant assemblages similar to those found in forested basins, a comparison of the macroinvertebrate communities found in these three stream types has not been conducted.
In this study, we compare the composition of macroinvertebrate assemblages collected from central-Pinelands blackwater streams draining forest land, abandoned-cranberry bogs, and active-cranberry bogs. All three land-use types represent acid-water streams with minimal upland agriculture or developed lands. Within each stream we sampled muck, vegetated-muck, and woody-debris habitats. We address two major questions. First, are variations in macroinvertebrate assemblages related to differences in past and present land uses within the associated drainage basin? Secondly, do macroinvertebrate assemblages vary between habitats? Although the primary focus is family-level assemblages, we also evaluate community patterns at the genus level.
83
Methods
Land Use and Study Site Selection We selected four streams representing each of the three stream types, including forest, abandoned-cranberry bog (abandoned-bog), and active-cranberry bog (cranberry) streams (Figure 1, Table 1). All twelve streams were included in earlier water-quality, stream-vegetation, fish, or anuran studies and land-use profiles were completed as part of those studies (Zampella et al. 2001, 2003). The data set used to create the land-use profiles is based on a modified Anderson et al. (1976) system. In this paper, we refer to the Anderson-type land-use classes of urban land, agriculture, and agricultural wetlands as developed land, upland agriculture, and wetland agriculture, respectively. Collectively, we refer to developed land and upland agriculture as altered land. Wetland agriculture includes cranberry bogs and blueberry fields. Most wetland agriculture in the study basins is cranberry agriculture.
The percentage of altered land (developed land and upland agriculture) was low in all twelve drainage areas (Table 1). Altered land, which was generally highest in the cranberry drainage areas, did not exceed ten percent in any basin. The four forest sites were located in undeveloped watersheds with no apparent agricultural history. Abandoned-bog sites were located in streams draining abandoned-cranberry bogs and forest. The four cranberry sites were located immediately downstream from cranberry bogs. Abandoned bogs bordered three of these sites. All abandoned bogs have succeeded to emergent, shrub, or forested wetlands. The percentage of wetland agriculture in the cranberry drainage basins ranged from 3.9 – 34.3%. Environmental Factors From May through November 2001 and April through November 2002, we measured pH, specific conductance, dissolved oxygen, and temperature monthly at road or trail crossings near each macroinvertebrate sampling site. All water-quality measurements were completed under baseflow conditions. Specific conductance was measured with an Orion model-122 meter, pH was measured using an Orion model-250A meter, and temperature and dissolved oxygen were measured with a YSI 52 dissolved-oxygen meter. All available data were used to calculate median values for each sampling site. We monitored stream discharge at or near eight macroinvertebrate-sampling sites on 63 to 64 dates between October 2000 and October 2003. The Batsto River and Skit Branch sites were monitored for a shorter period (March 2002 to October 2003 and October 2000 to October 2001, respectively). We did not measure discharge at Buck Run and Deep Run. To allow a comparison of all sites where we measured discharge, including the Batsto River and Skit Branch, we ranked available discharge values for each date and used these ranks to calculate a median discharge rank for each site (Table 1). With one exception (Pole Bridge Branch), we evaluated stream habitat within 100-m to 200-m stream reaches at each site. Bankfull stream depth and width were measured along transects established at 25-m intervals. Using a 0.25-m2 quadrat, we estimated channel-vegetation and woody-debris cover at three points along each transect, including the right and
84
left side of the channel and the thalweg (deepest point in the channel). We also subjectively described the streambed substrate at the same three points as muck or sand. To obtain an estimate of shading, we used a spherical densiometer to measure canopy cover over the center of each transect. Using the data from each transect, we calculated mean bankfull depth and width and channel-vegetation, woody-debris, and canopy-cover values for each stream. Sediment values represent the number of points, given as a percentage of total points measured, where each type of substrate was found in a stream. Macroinvertebrate Sampling We sampled macroinvertebrates in three different habitats, including bare muck, vegetated muck, and woody debris. Using a 46 X 23 cm kick net, we completed from one to five one-meter long sweeps of bare muck at each site. The multiple sweeps were pooled as one sample. The same approach was used to sample muck with floating-leaved aquatic-macrophyte patches composed of Nuphar variegata and/or Nymphaea odorata (vegetated muck). At one site (Tulpehocken Creek), separate samples collected from Nymphaea odorata and Scirpus subterminalis patches were combined as one. At each site, we used the same number of sweeps for the muck and vegetated-muck sampling. Woody debris was sampled by cutting ten 30-cm sections of submerged wood and removing all visible macroinvertebrates. No woody debris was found at Hospitality Brook, a cranberry site, and two abandoned-bog sites, Shane Branch and Deep Run. We collected all bare muck and vegetated-muck samples within the same 100-m stream reach. At three sites, we sampled woody debris in an adjacent, 100-m stream reach. All sampling was conducted over a five-week period in June and July 2002. Each sample was sieved in the field and preserved with 10% formalin. Personnel of the New Jersey Department of Environmental Protection, Bureau of Freshwater and Biological Monitoring, sorted and identified all specimens. Specimens were evenly distributed in a light-colored pan marked with grids of equal sizes and removed from randomly selected grids until a total of at least 100 organisms were sampled. Three of thirty-three samples analyzed had less than 100 organisms. With a few exceptions, the individuals were then identified at least to family using 7 to 30X stereo zoom and 40 to 400X compound magnification. Most specimens were identified to genus. Data Analysis We used detrended correspondence analysis (DCA, Hill 1979a, Hill and Gauch 1980) and TWINSPAN (Hill 1979b) to ordinate and classify macroinvertebrate families and the 12 stream sites based on relative-abundance data. We averaged the relative-abundance data of the different habitats from each site and analyzed the composite samples. Because we found no woody debris at three sites, we also ordinated composite samples composed of muck and vegetated-muck samples only. Log-transformed relative-abundance data were used in all DCA analyses. We also analyzed genus-level relative-abundance data using the composite samples. Using Spearman rank correlation, we correlated the first and second DCA axes of the family-level and genus-level ordinations with each environmental variable. To describe relationships among environmental variables, we constructed a correlation matrix using Spearman rank correlation.
85
We used nonparametric multi-response permutation procedures (MRPP, McCune and Mefford 1999) to compare family-level and genus-level composition between stream types based on composite samples that included all habitats, and between stream types based on separate analyses of three different habitats. We also use MRPP to compare genus-level macroinvertebrate, EPT (Ephemeroptera, Plecoptera, and Trichoptera), and chironomid composition between stream types. Composite-habitat samples were used in all genus-level comparisons. The MRPP analyses were based on Euclidean distance, and significance levels of the multiple tests were adjusted using the sequential Bonferroni method (Rice 1989, 1990). We report the p and A values for each analysis. The p value describes the likelihood that an observed difference is due to chance. The A statistic (chance-corrected within-group agreement) describes agreement within groups (i.e., stream type). A = 1 when all attributes within a group are identical, A = 0 when within group heterogeneity equals that expected by chance, and A < 0 when within-group heterogeneity is greater than expected by chance. We used separate Kruskal-Wallis ANOVA tests to assess differences in family and genus richness between stream types. Post-hoc comparisons were conducted using multiple comparisons of mean ranks (Siegel and Castellan 1988).
We used an alpha level of 0.05 to assess significance for all statistical tests, and adjusted significance levels of multiple tests using the sequential Bonferroni method (Rice 1989, 1990). Ordinations, TWINSPAN classifications, and MRPP analyses were performed using PC-ORD for Windows 4.27 (MjM Software, Gleneden Beach, OR). ANOVAs and correlation analyses were performed using Statistica 7.1 (StatSoft, Inc., Tulsa, OK).
Results Environmental Factors
All twelve streams were relatively slow moving and acidic (Table 1). Sand was the dominant sediment at one site. Muck dominated the streambeds at the remaining sites. Dissolved-oxygen concentrations were low, with mean concentrations ranging from 4.7 mg L-1 for the cranberry streams to 6.5 mg L-1 for the forest streams. Median specific conductance values, which were <50 µS cm-1 at all but one site, were lowest in forest sites and highest in cranberry sites. Mean drainage area ranged from 13.3 km2 for forest streams to 23.8 km2 for abandoned-bog streams. Higher dissolved-oxygen levels, lower temperatures, and a higher percentage of woody-debris cover generally characterized the forest streams.
The correlation matrix revealed strong relationships between channel vegetation and
bankfull depth and channel muck, between basin area and channel muck, depth, and width, and between canopy cover and woody debris and temperature (Table 2). The negative relationship between muck and dissolved oxygen may be associated with variations in flow regimes. Due to the large number of comparisons, we cannot make conclusions regarding the statistical significance of these associations.
86
Macroinvertebrate Inventory Specimens from all but two taxa, the phylum Nematoda (roundworms) and the insect order Collembola (springtails), were identified to family. More than 90% of all specimens were also identified to genus. Fifty-three families, comprising 20 orders and represented by 110 genera, were collected from the 12 stream sites (Tables 3 and 4). The orders were represented by insects (Coleoptera, Diptera, Ephemeroptera, Hemiptera, Lepidoptera, Megaloptera, Odonata, Plecoptera, Trichoptera), crustaceans (Decapoda, Amphipoda, Isopoda), leeches (Pharyngobdellida, Rhychobdellida), bristle worms (Haplotaxida, Lumbriculida, Tubificida), clams (Veneroida), snails (Basommatophora), and turbellarian flatworms (Tricladia).
Both stoneflies (Plecoptera) and caddisflies (Trichoptera) occurred more frequently and with higher relative abundances at forest sites (Table 5). Mayflies (Ephemeroptera) occurred more frequently at forest sites compared to cranberry sites and were absent from abandoned-bog sites. Fingernail clams (Veneroida) were found at two cranberry streams and two forest streams, with higher relative abundances in the latter. Pyralid moths (Lepidopterans) were found only at abandoned-bog sites.
Megalopterans were found in all stream types, but occurred more frequently at forest sites. Isopods were also found at all three stream types, but were much more abundant at the cranberry sites. Both odonates and coleopterans were found at all site types and were slightly more abundant at cranberry and abandoned-bog sites. Both the relative abundance and frequency of occurrence of tubificid worms was similar for the three stream types. The lower relative abundance of dipterans in cranberry streams was due to the high relative abundance of isopods at these sites.
For convenience, both nematodes and collembolans are referred to as “families” and are
included in the family-level analysis. Nineteen families were represented by single-site occurrences. Sixteen families were found at a minimum of one-half of all sites. The family Chironomidae (midges) comprised five subfamilies, including Chironominae, Diamesinae, Orthocladiinae, Pseudochironomini, and Tanypodinae, represented by 41 genera (Table 4). The most frequently occurring families were Tubificidae (100%), Chironomidae (100%), and Asellidae (92%). Seventy-eight percent of the families were found in low abundance, with each contributing less than five-percent to relative abundance at any site. Families with the highest maximum relative abundance were Chaoboridae (18.5%), Tubificidae (28.2%), Asellidae (65.0%), and Chironomidae (74.9%). Family-level Comparison of Stream Types Family richness at the twelve sites ranged from 11 to 25 taxa. A total of 36 families were found at the cranberry sites, 27 at abandoned-bog sites, and 38 at forest sites. Mean (± 1 SD) and median family richness was highest at the forest sites (22.8 ± 2.6 and 23.5) compared to the cranberry (16.8 ± 3.1 and 16) and abandoned-bog sites (13.0 ± 2.8 and 12). Analysis of variance revealed a significant overall difference in family richness among types (p = 0.019). Mean family richness was considerably higher for forest sites compared to cranberry sites, but the post-
87
hoc tests revealed a significant difference only between abandoned bog and forest sites (p = 0.016). The highest number of families limited to one stream class was found at forest streams, followed by cranberry and abandoned-bog streams (Table 6). About one-third of the families occurred in all stream classes. Cranberry and forest sites shared more species in common than each shared with abandoned-bog sites. Only four families, including three forest-site taxa, Aeshnidae, Heptageniidae, Odontoceridae, and one abandoned-bog taxon, Nematoda, were limited to woody debris habitats. Muck and vegetated-muck habitats shared more families in common than either shared with woody debris. Mean (± 1 SD) family richness was similar among woody debris (9.4 ± 2.0), vegetated muck (10.1 ± 2.5), and muck (10.8 ± 2.9) samples. The first axis of the DCA ordination based on the three-habitat composite samples contrasted the forest streams and one abandoned-bog stream (Tulepehocken Creek), shown on the left side of the site diagram, with three abandoned-bog sites and all cranberry sites shown on the right side of the diagram (Figure 2). The first division of the TWINSPAN classification also separated the four forest streams and Tulpehocken Creek from the other sites. The two-dimensional diagram shows that sites were generally clustered with most other sites in the same class. With two exceptions, Asellidae (isopods) and Coenagrionidae (damselflies), families shown on the far-right side of the family diagram were absent from the forest sites but present at the cranberry or abandoned-bog sites (Figure 2). Of these fourteen families, Ancylidae (snails), Corduliidae (dragonflies), Noteridae (beetles), Gerridae (true bugs), Caenidae (mayflies), Crangonyctidae (amphipods), Glossiphoniidae (leeches), and Planariidae (turbellarian flatworms) were found only in the cranberry samples, and Libellulidae (dragonflies) and Curculionidae (weevils) were found only in the abandoned-bog samples. Haliplidae (beetles), Lumbriculidae (oligochaetes), Chaoboridae (phantom midges), and the order Collembola (springtails) were associated with both cranberry and abandoned-bog sites. None of these families was found at more than two sites in each stream class and two-thirds occurred at only one of the eight sites. Crangonyctidae and Collembola were found in all habitats. The other twelve families were limited to muck or vegetated-muck habitats. The relative abundance of all these families except Crangonyctidae and Chaoboridae was less than one percent. Chaoboridae was the most frequently occurring and abundant family, occurring at two cranberry and two abandoned-bog sites with a mean (± 1 SD) relative abundance of 7.7% (± 8.1%). The most obvious difference between the three stream types was the high relative abundance of Asellidae for cranberry sites (45.7 ± 16) compared to abandoned-bog (8.6 ±13.5) and forest sites (0.8 ± 0.70). However, removing this family from the ordination did not reveal patterns much different than that obtained using the full data set. Three additional taxa, nematodes, Gomphidae (dragonflies), and Pyralidae (moths), were present only at abandoned bog sites. Thirteen families shown on the extreme left side of the ordination diagram were present at forest sites but absent from the cranberry and abandoned-bog sites. Families associated only with forest sites included Brachycentridae, Limnephilidae, Molannidae, Odontoceridae (caddisflies), Ephemerellidae, Metretopodidae, Heptageniidae (mayflies), Empididae (true flies), Aeshnidae, Cordulegastridae (dragonflies), Calopterygidae (damselflies), Erpobdellidae
88
(leeches), and Cambaridae (crayfish). Limnephilidae, Molannidae, Empididae, Calopterygidae, and Erpobdellidae were found at two or more of the forest sites. The other families occurred at only one forest site. Molannidae and Ephemerellidae, with a maximum relative abundance of 1.8% and 1.3%, respectively, were the only two families that comprised more than one percent of any forest sample. Habitat use among the thirteen families varied. Three families were found only on woody debris, two only in muck, and two only in vegetated-muck samples. The six other families were found in two or more habitats. Simuliidae (blackflies) larvae, also shown on the forest side of the ordination, were found on woody debris at the four forest sites and in muck at one cranberry site. The patterns revealed by the MRPP analysis of the composite-sample based on all habitats were similar to those displayed by the associated DCA ordination (Table 7). We found a significant difference in family-level macroinvertebrate composition between the three groups of streams (A = 0.310, p = 0.003). A post-hoc comparison across all groups revealed a significant difference between the cranberry class and the other two stream classes but no difference between the abandoned-bog and forest classes.
We did not complete an MRPP analysis using the different habitats from each stream as separate samples because within-stream samples are not independent. However, comparison of the different stream classes based on separate MRPP analyses of each habitat type showed a significant difference in family-level composition between cranberry streams and both abandoned-bog and forest streams regardless of habitat (Table 8).
We obtained results similar to the three-habitat composite-sample analysis when ordinating either a two-habitat composite sample comprised of only muck and vegetated-muck samples or the three habitats from each stream site as separate samples (Figure 3). As with the three-habitat composite-sample data, the first axis of both DCA ordinations contrasted the forest sites and Tulpehocken Creek with the other sites. The ordering of sites and families along the first axis of the three ordinations was similar. Spearman rank correlations between the DCA axis 1 and axis 2 sites scores of the two-habitat and three-habitat composite-sample ordinations were significant (r = 0.89, p < 0.001 for axis 1 and r = 0.74, p = 0.006 for axis 2). The DCA axis 1 and axis 2 family scores for the three-sample and two-sample ordinations were also significantly correlated (r = 0.85, p < 0.001 for axis 1 and r = 0.65, p < 0.001 for axis 2), as were those for the three-sample and multiple-habitat ordinations (r = 0.86, p <0.001 for axis 1 and r = 0.58, p < 0.001 for axis 2). Forest sites, where the composition of woody-debris samples contrasted with that of muck and vegetated-muck samples, displayed the most obvious difference between habitats (Figure 3). Overall, the effect of stream type appears to overshadow that of habitat. Following the Bonferroni correction, we found no statistically significant correlation between the first two DCA axes based on the ordination of the three-habitat composite-sample data and environmental factors (Table 9). However, the correlation coefficient and initial p value suggest a negative relationship exists between the forest-to-cranberry/abandoned-bog community gradient, represented by the first DCA axis, and dissolved oxygen. The initial p value for specific conductance also suggests that the community gradient is positively correlated with this measure of dissolved solids.
89
Genus-level Comparison of Stream Types
Mean and median genus richness was highest at the forest sites compared to the cranberry
and abandoned-bog sites (Table 10). Excluding the chironomids, the number of named genera per family ranged from 1 to 5, with a mean (± 1 SD) of 1.6 (± 0.95). Analysis of variance indicated a significant difference in genus richness among sites (p = 0.030). Although none of the individual post-hoc comparisons were significant, the greatest difference was found between forest sites and both cranberry (p = 0.07) and abandoned-bog (p = 0.06) sites. Mean genus richness was generally similar between habitats, and was consistently lower for woody debris (Table 10). Compared to abandoned-bog and cranberry sites, the highest number of genera restricted to a single stream type was found at forest sites. About one-quarter of the genera were found at all three stream types (Tables 11).
As with the family-level site ordination, the first axis of the genus-level DCA ordination
contrasted the four forest sites and one abandoned-bog site (Tulpehocken Creek) with the other abandoned-bog streams and all cranberry streams (Figure 4). Sites within the same stream classes were clustered in the same general area of the two-dimensional site diagram. The first division of the genus-level TWINSPAN classification separated the four forest sites from the cranberry and abandoned-bog sites. The second division separated three cranberry sites from the remaining cranberry site and all four abandoned-bog sites.
Results of the MRPP analysis of the genus-level data showed a significant difference in
macroinvertebrate composition between stream types (A = 0.23, p = 0.002). Post-hoc comparisons revealed a significant difference between the cranberry class and the other two stream classes, but no difference between the abandoned-bog and forest classes (Table 12).
The first DCA axis of the genus-level ordination, which represented a cranberry/abandoned-bog to forest community gradient, was positively correlated with dissolved-oxygen concentrations (Table 13). Although not significant following the Bonferroni correction due to the large number of tests, the analysis revealed a positive relationship between the first axis and both woody debris and stream width and a negative relationship between the community gradient and specific conductance and temperature.
The genus-level ordination contrasted genera associated with forest sites with those associated with cranberry or abandoned bog sites (Table 14). Thirty-three of 34 genera shown on one extreme end of the ordination were found only at forest sites. Nineteen of these taxa occurred at a single site, but deleting these taxa had little effect on the ordering of sites along the first and second DCA axes. The remaining fourteen genera were found at from one-half to all of the four forest sites. Mayflies, caddisflies, chironomids, oligochaetes, and odonates dominated the group of thirty-three forest-site genera. Seven of the eight species associated with the extreme end of the species gradient were found only on woody debris. However, muck, vegetated muck, and woody debris accounted for 37.5%, 23.6%, and 38.9% of the individual occurrences of the thirty-three genera, which suggests that habitat preference was not fully responsible for the contrast between forest streams and the other two stream types. EPT composition differed significantly between each of the three stream types (Table 15). The
90
genus-level chironomid composition differed significantly between cranberry and both forest and abandoned-bog streams (Table 15).
The only plecopteran genus, Leuctra, was found at all forest sites, with a mean relative abundance of 5.6% (" 2.5%), as well as at a single cranberry site and a single abandoned-bog site. It occurred frequently in all three habitats. Ephemeropterans were represented by five genera, including Eurylophella, Stenonema, Siphloplecton, Caenis, and Paraleptophlebia. Most mayfly occurrences were associated with forest sites. Three genera, Eurylophella, Stenonema, and Siphloplecton, each occurred at a single forest site. Eurylophella was found in all three habitats, Siphloplecton inhabited muck and vegetated muck, and Stenonema was found only on woody debris. Caenis was found inhabiting muck in two cranberry streams. Paraleptophlebia was found inhabiting both muck and woody debris in forest streams and woody debris in a single cranberry stream.
Forest sites accounted for two-thirds of the genera-level tricopteran occurrences, which
were equally distributed among the three habitats. Seven genera, Brachycentrus, Cheumatopsyche, Hydroptila, Mystacides, Platycentropus, Molanna, and Psilotreta, were found only at forest sites. The genera Hydropsyche, Oecetis, and Neureclipsis were found across stream types. Polycentropus was the only caddisfly that was not found at a forest site. The trichopteran genera Hydropsyche and Hydroptila were more frequently associated with woody debris compared to muck and vegetated-muck habitats, and Nyctiophylax, Cheumatopsyche, and Psilotreta were found only on woody debris. Mystacides, Polycentropus, Brachycentrus, Molanna, and Platycentropus were found only in muck or vegetated-muck samples.
Megalopterans included Chauliodes, Nigronia, and Sialis. Nigronia was collected from
vegetated-muck and woody debris at one forest stream and from woody debris at a second forest stream. Chauliodes was found on woody debris at a single cranberry site. Sialis, which was found across stream types, was most frequently encountered in muck or vegetated-muck habitats.
Odonates comprised eight genera. Ischnura was found at four cranberry sites, a single
forest site, and a single abandoned-bog site. Boyeria, Calopteryx, Argria, and Cordulegaster were found only in forest streams. Except for Calopteryx, which was found at two forest sites, all were found at a single site. Gomphus and Sympetrum were each found at a single abandoned-bog site and Tetragoneuria at one cranberry site. Most odonates were collected from muck or vegetated-muck habitats. Only two genera, Boyeria and Ischnura, were found on woody debris. Nine of the ten habitat samples where Ischnura was found were either muck or vegetated muck.
Twelve of the forty-one chironomid genera were found only at forest sites, with most
limited to a single occurrence (Table 14). Only two genera were limited to the each of the other stream types. Sixteen chironomid genera were found across stream types. Three chironomid genera, Tvetenia, Potthastia, and Xylotopus were found only in woody debris. Six genera, including Nilothauma, Harnischia, Paralauterborniella, Psectrotanypus, and Stempellinella, were found only in muck samples, and four genera, including Corynoneura, Guttipelopia, Cryptotendipes, and Kiefferulus were found only in vegetated-muck samples. Rheotanytarsus and Simulium larvae, which were associated with forest sites, used contrasting habitats. Simulium larvae were found more frequently on woody debris, whereas Rheotanytarsus was
91
absent in this habitat. All Chaoborus larvae were collected from muck or vegetated-muck habitats in cranberry and abandoned bog-sites.
Discussion
Taxon richness is often used as a measure of impairment, with decreasing richness associated with increasing perturbation (Barbour et al. 1999). Family-level richness was higher at forest sites compared to abandoned-bog and cranberry sites, but only forest and abandoned-bog site family richness was significantly different. Differences in mean genus richness between stream types were not significant. Mean family and genus richness was similar among muck, vegetated-muck, and woody-debris habitats. Both family-level and genus-level composition differed significantly between the cranberry streams and the other two stream classes, regardless of habitat type (muck, vegetated muck, and woody debris). The difference between cranberry and abandoned-bog sites is noteworthy because abandoned bogs bordered some cranberry sites.
Muck and vegetated-muck habitats had more families in common than each shared with
woody debris, which can be attributed to the similarity between these two habitats. Our finding that mean family and genus richness was similar among habitats, and that genus richness was consistently lower for woody debris, is not consistent with those of other coastal plain stream studies where taxonomic richness and macroinvertebrate production is generally higher on snags than in less stable sand or silt habitats (Benke et al. 1984, 1985, Smock et al. 1985, Smock and Gilinsky 1992, Hax and Golladay 1998). We obtained similar family-level results when three-habitat composite samples, two-habitat (muck and vegetated-muck) composite samples, and individual-habitat samples were analyzed, indicating that the direct contribution of woody debris to contrasting site-type patterns was minimal. Forest sites displayed the most obvious difference between habitats and the influence of woody debris on macroinvertebrate composition, but overall, the effect of stream type appears to overshadow that of habitat. In the streams that we studied, woody debris may play a less direct but important role in shaping community composition by serving as a refuge and source of recolonizers following flow disturbances (Hax and Golladay 1998). Our results suggest that variations in family-level and genus-level composition paralleled dissolved-oxygen gradients. Relatively low oxygen levels are not unusual in the groundwater-fed, low-turbulent waters of the Pinelands. During our study period, the median dissolved-oxygen concentration and percent saturation for McDonalds Branch, a U. S. Geological Survey Hydrologic Benchmark Network Station located in a Pinelands state forest (Mast and Turk 1999), was 2.8 mg L-1 and 29%, respectively (DeLuca et al. 2002, 2003). Because many of the taxa that we encountered are adapted to lentic habitats and slow-moving lotic habitats or low-oxygen environments, variations in community composition may be associated with subtle differences in dissolved-oxygen levels.
Tubificidae, Chironomidae, and Asellidae were the most abundant and widespread families. Chironomids are an important taxon in coastal plain streams, where they can be responsible for the majority of production (Smith and Smock 1992, Wright and Smock 2001). The dominance of Chironomids, which are relatively tolerant of organic pollution (Hilsenhoff 1988) and associated low oxygen levels, at forest, abandoned-bog, and cranberry streams
92
suggests that this family is not an indicator of aquatic degradation in Pinelands streams. Similarly, Dougherty and Morgan (1991) found chironomids as the dominant benthic macroinvertebrates in both a dystrophic Pinelands lake and a degraded lake with fluctuating pH and elevated nutrients. However, we did find that differences in genus-level chironomid composition existed between stream types.
Neither the frequency of occurrence or the abundance of tubicid worms, which are
generally among the most tolerant macroinvertebrates (Barbour et al. 1999), contributed to the differences between the three stream types. The family Asellidae, represented by the genus Caecidotea, was widespread and found in all habitats. Although the much greater relative abundance of this isopod at cranberry sites compared to the other two stream types cannot be directly attributed to any of the measured environmental variables, the family is considered to be very tolerant of conditions associated with organic pollution (Hilsenhoff 1988).
Chaoborus larvae (Chaoboridae) generally occur in lentic habitats and are often abundant
in the low-oxygen environment of profundal zones (Hilsenhoff 2001, LaRow 1970). Tolerance of low-oxygen concentrations may explain why Chaoborus were found at cranberry and abandoned-bog sites that displayed some of the lowest dissolved-oxygen concentrations recorded for the twelve study streams.
Given the low pH of the study streams, it may appear unusual to find clams. Dougherty and Morgan (1991) described the presence of mollusks as one of the factors that distinguished the macroinvertebrate fauna of an enriched Pinelands lake from that of a dystrophic lake. Fingernail clams (Pisidiidae = Sphariidae) are among the few mollusks found in small, acidic coastal plain streams due to a greater tolerance to high acidity (Smock and Gilinsky 1992, Pennak 1978), yet the pH at which the clams were found is much more acidic than the lower pH limit of 6.0 reported by Pennak (1978). Like Chaoborus larvae, Pisidiid clams are generally adapted to waters with low oxygen levels (McMahon and Bogan 2001).
An increase in the number and relative abundance of EPT taxa is frequently associated with increasing levels of aquatic health. We found that EPT composition differed significantly between each of the three stream types and that stoneflies, caddisflies, and mayflies occurred more frequently at forest sites. Many of the caddisflies that we encountered, including Nyctiophylax, Molanna, Neureclipsis, Platycentropus, Mystacides, and Oxyethira, are found in lentic habitats or slow currents in streams, with the last four genera associated with aquatic macrophytes (Wiggins 1996a,b). Brachycentrus, Hydropsyche, Psilotreta, and Cheumatopsyche are generally associated with lotic habitats, and Polycentropus, Hydroptila and Oecetis are found in both lentic and lotic habitats (Wiggins 1996a,b). The lentic trichopterans represented 49% of the genus-level composite-sample occurrences, followed by lotic-lentic genera (27%), and lotic genera (24%), reflecting the slow currents that characterize the study streams. Most of the families encountered are considered moderately tolerant, although Brachycentrus and Psilotreta, two genera found only at forest sites, are included in families classified as intolerant by Hilsenhoff (1988).
Ephemeropterans, which are generally considered an intolerant group (Hilsenhoff 1988),
occurred more frequently at forest sites and were absent at abandoned-bog sites. Most of the
93
genera we encountered are associated with both lotic and lentic habitats (Edmunds and Waltz 1996). Caenis, the only mayfly genus limited to cranberry sites, usually inhabits stream pools or littoral sediments of lakes and ponds. This genus is one of the most tolerant mayflies (Hilsenhoff 1988). Leuctra, which was the only stonefly that we collected, was found across stream types but was more frequently encountered in forest streams. This intolerant stonefly (Hilsenhoff 1988) is generally associated with stream habitats (Stewart and Harper 1996).
Habitat use by odonates in a sand-bottomed coastal plain stream in Virginia varied among different species (Burcher and Smock 2002). Odonates were less abundant on snags compared to debris dams, silt, and sand. In our study, we collected most of the odonate genera from muck or vegetated-muck habitats, which are the habitats in which they are generally found (Westfall and Tennessen 1996). Ishnura, the most frequently encountered odonate, is associated with vegetated lentic or lotic-depositional habitats (Westfall and Tennessen 1996). The odonate families that we encountered display a range of tolerance values (Hilsenhoff 1988), which do not appear to be related to stream type.
Although not conclusive, our results suggest that variations in macroinvertebrate composition may be related to a complex environmental gradient involving dissolved oxygen, temperature, specific conductance, stream width, and woody debris. The relationship between reduced canopy cover and both lower woody-debris cover and higher stream temperatures, which influence dissolved-oxygen levels, is most likely related to deforestation and a higher percentage of open water associated with historic and active cranberry agriculture. Pesticide use in cranberry cultivation (Eck 1990, Szeto et al. 1990, Anderson and Davis 2000), which was not addressed in our study, may explain some of the variation in macroinvertebrate assemblages between stream types, but the actual effect is unknown and, as with other aquatic systems, may be difficult to determine (Sobiech and Henry 2003).
Acknowledgements We thank Kim Laidig, Christina Burns, and Jason Shvanda for assisting with various aspects of the study. The New Jersey Division of Parks and Forestry authorized the state-lands research permits. Joseph Darlington granted permission to access Pole Bridge Branch on his property. Funding for this study was provided by the U. S. Environmental Protection Agency (State Wetlands Grant Program, Grant No. CD-99298001-1), the Pinelands Commission, the National Park Service, and the New Jersey Department of Environmental Protection.
Literature Cited
Anderson, J. R., E. E. Hardy, J. T. Roach, and R. E. Witmer. 1976. A land use and land cover classification system for use with remote sensor data. U.S. Geological Survey Professional Paper 964. Anderson, P. and D. Davis. 2000. Evaluation of efforts to reduce pesticide contamination in cranberry bog drainage. Publication No. 00-03-041. Department of Ecological Publications, Washington State Department of Ecology, Olympia, WA, USA.
94
Barbour, M. T., J. Gerritsen, B. D. Snyder, and J. B. Stribling. 1999. Rapid bioassessment protocols for use in streams and wadeable rivers: periphyton, benthic macroinvertebrates and Fish, Second Edition. EPA 841-B-99-002. U. S. Environmental Protection Agency, Office of Water, Washington, D.C. USA. Benke, A. C., R. L. Henry III, D. M. Gillespie, R. J. Hunter. 1985. Importance of snag habitat for animal production in southeastern streams. Fisheries 10:8-13. Benke, A. C., T. C. van Arsdall, and D. M. Gillespie. 1984. Invertebrate productivity in a subtropical blackwater river: The importance of habitat and life history. Ecological Monographs. 54:25-63. Burcher, C. L. and L. A. Smock. 2002. Habitat distribution, dietary composition and life history characteristics of odonate nymphs in a blackwater Coastal Plain stream. The American Midland Naturalist 148: 75-89. Delong, M. D. and M. A. Brusven. 1998. Macroinvertebrate community structure along the longitudinal gradient of an agriculturally impacted stream. Environmental Management 22:445-457. DeLuca, M. J., H. L. Hoppe, H. A. Doyle, B. J. Gray. 2002. Water resources data, New Jersey, Water Year 2001, Volume 3. Water-quality data. U.S. Geological Survey Water-Data Report NJ-01-3. DeLuca, M. J., H. L. Hoppe, H. A. Heckathorn, B. J. Gray, M. L. Riskin. 2003. Water resources data, New Jersey, Water Year 2002, Volume 3. Water-quality data. U.S. Geological Survey Water-Data Report NJ-02-3. Dougherty, J. E. and M. D. Morgan. 1991. Benthic community response (primarily Chironomidae) to nutrient enrichment and alkalinization in shallow, soft water humic lakes. Hydrobiologia 215: 73-82. Eck, P. 1990. The American cranberry. Rutgers University Press, New Brunswick, New Jersey, USA. Edmunds, G. F. Jr. and R. D. Waltz. 1996. Ephemeroptera. Pages 126-163 in R. W. Merritt and K. W. Cummins (Editors). An introduction to the aquatic insects of North America (3rd Edition), Kendal/Hunt Publishing Company, Iowa, USA. Foster, D., F. Swanson, J. Aber, I. Burke, N. Brokaw, D. Tilman, and A. Knapp. 2003. The importance of land-use legacies to ecology and conservation. BioScience 53: 77–88. Harding, J. S., E. F. Benfield, P. V. Bolstad, G. S. Helfman, and E. B. D. Jones. III. 1998. Stream biodiversity: The ghost of land use past. Proceedings of the National Academy of Sciences 95:14843-14847.
95
Hastings, R. W. 1979. Fish of the Pine Barrens. Pages 489-504 in R. T. T. Forman (Editor). Pine Barrens: ecosystem and landscape. Academic Press, New York, NY, USA. Hastings, R. W. 1984. The fishes of the Mullica River, a naturally acid water system of the New Jersey Pine Barrens. Bulletin of the New Jersey Academy of Science 29:9-23. Hax, C. L. and S. W. Golladay. 1998. Flow disturbance of macroinvertebrates inhabiting sediments and woody debris in a prairie stream. The American Midland Naturalist 139:210-223. Hill, M. O. 1979a. DECORANA-A FORTRAN program for detrended correspondence analysis and reciprocal averaging. Cornell University, Ithaca, NY, USA. Hill, M. O. 1979b. TWINSPAN-A FORTRAN program for arranging multivariate data in an ordered two-way table by classification of individuals and attributes. Cornell University, Ithaca, NY, USA. Hill, M. O., and H. G. Gauch Jr. 1980. Detrended correspondence analysis: an improved ordination technique. Vegetatio 42:47-58. Hilsenhoff, W. L. 1988. Rapid field assessment of organic pollution with a family-level biotic index. Journal of the North American Benthological Society 7:65-68. Hilsenhoff, W. L. 2001. Diversity and classification of insects and Collembola. Pages 661-731 in J. H. Thorp and A. P. Covich (Editors). Ecology and classification of North American freshwater invertebrates (2nd Edition). Academic Press, San Diego, CA, USA. Jones, R. C. and C. C. Clark. 1987. Impact of watershed urbanization on stream insect communities. Water Resources Bulletin 23: 1047-1055. Kennen, J. G. 1999. Relation of macroinvertebrate community impairment to catchment characteristics in New Jersey streams. Journal of the American Water Resources Association 35:939-955. LaRow, E. J. 1970. The effect of oxygen tension on the vertical migration of Chaoborus larvae. Limnology and Oceanography 15:357-362. Lenat, D. R. and J. K. Crawford. 1994. Effects of land use on water quality and aquatic biota of three North Carolina piedmont streams. Hydrobiologia 294:185-199. Mast, M. A. and J. T. Turk. 1999. Environmental characteristics and water quality of Hydrologic Benchmark Network stations in the Eastern United States, 1963-95. U. S. Geological Survey Circular 1173-A. McCune, B., and M. J. Mefford. 1999. PC-ORD. Multivariate analysis of ecological data, Version 4. MjM Software Design, Gleneden Beach, OR, USA.
96
McMahon, R. F. and A. E. Bogan. 2001. Mollusca:Bivalvia. Pages 331-429 in J. H. Thorp and A. P. Covich (Editors). Ecology and classification of North American freshwater invertebrates (2nd Edition). Academic Press, San Diego, CA, USA. Morgan, M. D., and K. R. Philipp. 1986. The effect of agricultural and residential development on aquatic macrophytes in the New Jersey Pine Barrens. Biological Conservation 35:143-158. Patrick, R. 1996. Rivers of the United States of America. Volume III: The eastern and southeastern states. John Wiley and Sons, Inc., NY, USA. Pennak, R. W. 1978. Fresh-water invertebrates of the United States (2nd Edition). John Wiley & Sons, Inc. New York, NY, USA. Rice, W. R. 1989. Analyzing tables of statistical tests. Evolution 43:223-225. Rice, W. R. 1990. A consensus combined p-value test and family wide significance of component tests. Biometrics 46:303-308. Siegel, S. and N. J. Castellan. 1988. Nonparametric statistics for the behavioral sciences (2nd Edition). McGraw-Hill, New York, NY, USA. Smith, L. C. and L. A. Smock. 1992. Ecology of invertebrate predators in a Coastal Plain stream. Freshwater Biology 28:319-329. Smock, L. A. and E. Gilinsky. 1992. Coastal Plain blackwater streams. Pages 271-311 in C. T. Hackney, S. M. Adams, and W. H. Martin (Editors). Biodiversity of the Southeastern United States. John Wiley & Sons, Inc., New York, NY, USA. Smock, L.A, E. Gilinsky, D. L. Stoneburner. 1985. Macroinvertebrate production in a Southeastern United States blackwater stream. Ecology 66:1491-1503. Sobiech, S. A. and M. G. Henry. 2003. The difficulty of determining the effects of pesticides on aquatic communities. Pages 125-134 in T. P. Simon (Editor). Biological response signatures: indicator patterns using aquatic communities. CRC Press, Boca Raton, FLA, USA. Sponseller, R. A., E. F. Benfield, and H. M. Valett. 2001. Relationships between land use, spatial scale and stream macroinvertebrate communities. Freshwater Biology 46:1409 -1424. Stephenuck, K. F., R. L. Crunkilton, and L. Wang. 2002. Impacts of urban land use on macroinvertebrate communities in southeastern Wisconsin streams. Journal of the American Water Resources Association 38:1041-1051. Stewart, P. M., J. T. Butcher, and T. P. Simon. 2003. Fish and benthic macroinvertebrate assemblages as indicators of stream degradation in urbanizing watershed. Pages 227-249 in T. P. Simon (Editor). Biological response signatures: indicator patterns using aquatic communities. CRC Press, Boca Raton, FLA, USA.
97
Stewart, K. W. and P. P. Harper. 1996. Plecoptera. Pages 217-266 in R. W. Merritt and K. W. Cummins (Editors). An introduction to the aquatic insects of North America (3rd Edition), pp. 217-266. Kendal/Hunt Publishing Company, Iowa, USA. Szeto, S. Y., M. T. Wan, P. Price, and J. Roland. 1990. Distribution and persistence of Diazinon in a cranberry bog. Journal of Agricultural and Food Chemistry 38: 281-285. U.S. Department of Agriculture. 2003. 2002 Cranberry statistics. New Jersey Agricultural Statistics Service, U.S. Department of Agriculture, Trenton, NJ. www.nass.usda.gov/nj/CranBook2003.pdf. Westfall, M. J. Jr. and K. J. Tennessen. 1996. Odonata. Pages 164-211 in R. W. Merritt and K. W. Cummins (Editors). An introduction to the aquatic insects of North America (3rd Edition), Kendal/Hunt Publishing Company, Iowa, USA. Wiggins, G. B. 1996a. Larvae of the North American caddisfly genera (Trichoptera) (2nd Edition). University of Toronto Press, Toronto, Canada. Wiggins, G. B. 1996b. Trichopteran families. Pages 309-386 in R. W. Merritt and K. W. Cummins (Editors). An introduction to the aquatic insects of North America (3rd Edition), Kendal/Hunt Publishing Company, Iowa, USA. Wright, A. B. and L. A. Smock. 2001. Macroinvertebrate community structure and production in a low-gradient stream in an undisturbed watershed. Archiv für Hydrobiologie 152:297-313. Zampella, R. A., and J. F. Bunnell. 1998. Use of reference-site fish assemblages to assess aquatic degradation in Pinelands streams. Ecological Applications 8:645-658. Zampella, R. A., and J. F. Bunnell. 2000. The distribution of anurans in two river systems of a Coastal Plain watershed. Journal of Herpetology 34:210-221. Zampella, R. A., J. F. Bunnell, K. J. Laidig, and C. L. Dow. 2001. The Mullica River Basin: A report to the Pinelands Commission on the status of the landscape and selected aquatic and wetland resources. Pinelands Commission, New Lisbon, NJ, USA. Zampella, R. A., J. F. Bunnell, K. J. Laidig, and N. A. Procopio. 2003. The Rancocas Creek Basin: A report to the Pinelands Commission on the status of selected aquatic and wetland resources. Pinelands Commission, New Lisbon, NJ, USA. Zampella, R. A., and K. J. Laidig. 1997. Effect of watershed disturbance on Pinelands stream vegetation. Journal of the Torrey Botanical Society 124:52-66.
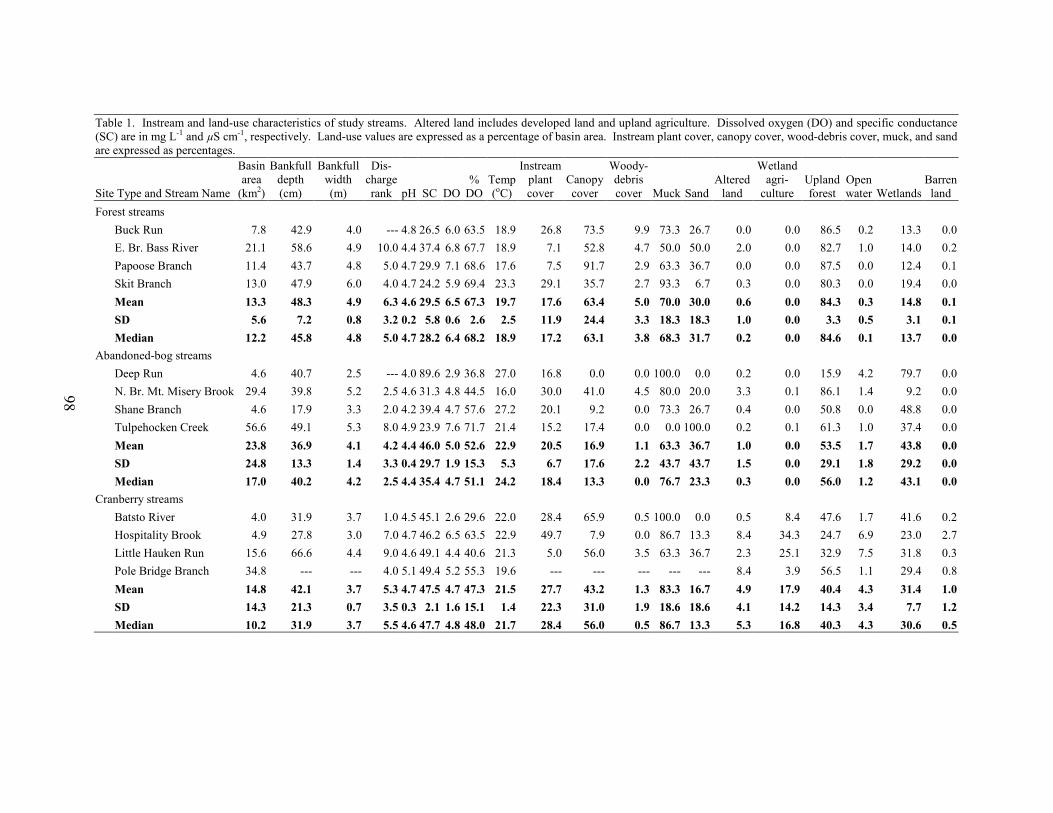
98
Table 1. Instream and land-use characteristics of study streams. Altered land includes developed land and upland agriculture. Dissolved oxygen (DO) and specific conductance (SC) are in mg L-1 and µS cm-1, respectively. Land-use values are expressed as a percentage of basin area. Instream plant cover, canopy cover, wood-debris cover, muck, and sand are expressed as percentages.
Site Type and Stream Name
Basin area
(km2)
Bankfull depth (cm)
Bankfull width (m)
Dis-chargerank pH SC DO
% DO
Temp(oC)
Instreamplant cover
Canopy cover
Woody-debris cover Muck Sand
Altered land
Wetland agri-
culture Upland forest
Open water Wetlands
Barrenland
Forest streams Buck Run 7.8 42.9 4.0 --- 4.8 26.5 6.0 63.5 18.9 26.8 73.5 9.9 73.3 26.7 0.0 0.0 86.5 0.2 13.3 0.0 E. Br. Bass River 21.1 58.6 4.9 10.0 4.4 37.4 6.8 67.7 18.9 7.1 52.8 4.7 50.0 50.0 2.0 0.0 82.7 1.0 14.0 0.2 Papoose Branch 11.4 43.7 4.8 5.0 4.7 29.9 7.1 68.6 17.6 7.5 91.7 2.9 63.3 36.7 0.0 0.0 87.5 0.0 12.4 0.1 Skit Branch 13.0 47.9 6.0 4.0 4.7 24.2 5.9 69.4 23.3 29.1 35.7 2.7 93.3 6.7 0.3 0.0 80.3 0.0 19.4 0.0 Mean 13.3 48.3 4.9 6.3 4.6 29.5 6.5 67.3 19.7 17.6 63.4 5.0 70.0 30.0 0.6 0.0 84.3 0.3 14.8 0.1 SD 5.6 7.2 0.8 3.2 0.2 5.8 0.6 2.6 2.5 11.9 24.4 3.3 18.3 18.3 1.0 0.0 3.3 0.5 3.1 0.1 Median 12.2 45.8 4.8 5.0 4.7 28.2 6.4 68.2 18.9 17.2 63.1 3.8 68.3 31.7 0.2 0.0 84.6 0.1 13.7 0.0Abandoned-bog streams Deep Run 4.6 40.7 2.5 --- 4.0 89.6 2.9 36.8 27.0 16.8 0.0 0.0 100.0 0.0 0.2 0.0 15.9 4.2 79.7 0.0 N. Br. Mt. Misery Brook 29.4 39.8 5.2 2.5 4.6 31.3 4.8 44.5 16.0 30.0 41.0 4.5 80.0 20.0 3.3 0.1 86.1 1.4 9.2 0.0 Shane Branch 4.6 17.9 3.3 2.0 4.2 39.4 4.7 57.6 27.2 20.1 9.2 0.0 73.3 26.7 0.4 0.0 50.8 0.0 48.8 0.0 Tulpehocken Creek 56.6 49.1 5.3 8.0 4.9 23.9 7.6 71.7 21.4 15.2 17.4 0.0 0.0 100.0 0.2 0.1 61.3 1.0 37.4 0.0 Mean 23.8 36.9 4.1 4.2 4.4 46.0 5.0 52.6 22.9 20.5 16.9 1.1 63.3 36.7 1.0 0.0 53.5 1.7 43.8 0.0 SD 24.8 13.3 1.4 3.3 0.4 29.7 1.9 15.3 5.3 6.7 17.6 2.2 43.7 43.7 1.5 0.0 29.1 1.8 29.2 0.0 Median 17.0 40.2 4.2 2.5 4.4 35.4 4.7 51.1 24.2 18.4 13.3 0.0 76.7 23.3 0.3 0.0 56.0 1.2 43.1 0.0Cranberry streams Batsto River 4.0 31.9 3.7 1.0 4.5 45.1 2.6 29.6 22.0 28.4 65.9 0.5 100.0 0.0 0.5 8.4 47.6 1.7 41.6 0.2 Hospitality Brook 4.9 27.8 3.0 7.0 4.7 46.2 6.5 63.5 22.9 49.7 7.9 0.0 86.7 13.3 8.4 34.3 24.7 6.9 23.0 2.7 Little Hauken Run 15.6 66.6 4.4 9.0 4.6 49.1 4.4 40.6 21.3 5.0 56.0 3.5 63.3 36.7 2.3 25.1 32.9 7.5 31.8 0.3 Pole Bridge Branch 34.8 --- --- 4.0 5.1 49.4 5.2 55.3 19.6 --- --- --- --- --- 8.4 3.9 56.5 1.1 29.4 0.8 Mean 14.8 42.1 3.7 5.3 4.7 47.5 4.7 47.3 21.5 27.7 43.2 1.3 83.3 16.7 4.9 17.9 40.4 4.3 31.4 1.0 SD 14.3 21.3 0.7 3.5 0.3 2.1 1.6 15.1 1.4 22.3 31.0 1.9 18.6 18.6 4.1 14.2 14.3 3.4 7.7 1.2 Median 10.2 31.9 3.7 5.5 4.6 47.7 4.8 48.0 21.7 28.4 56.0 0.5 86.7 13.3 5.3 16.8 40.3 4.3 30.6 0.5
98
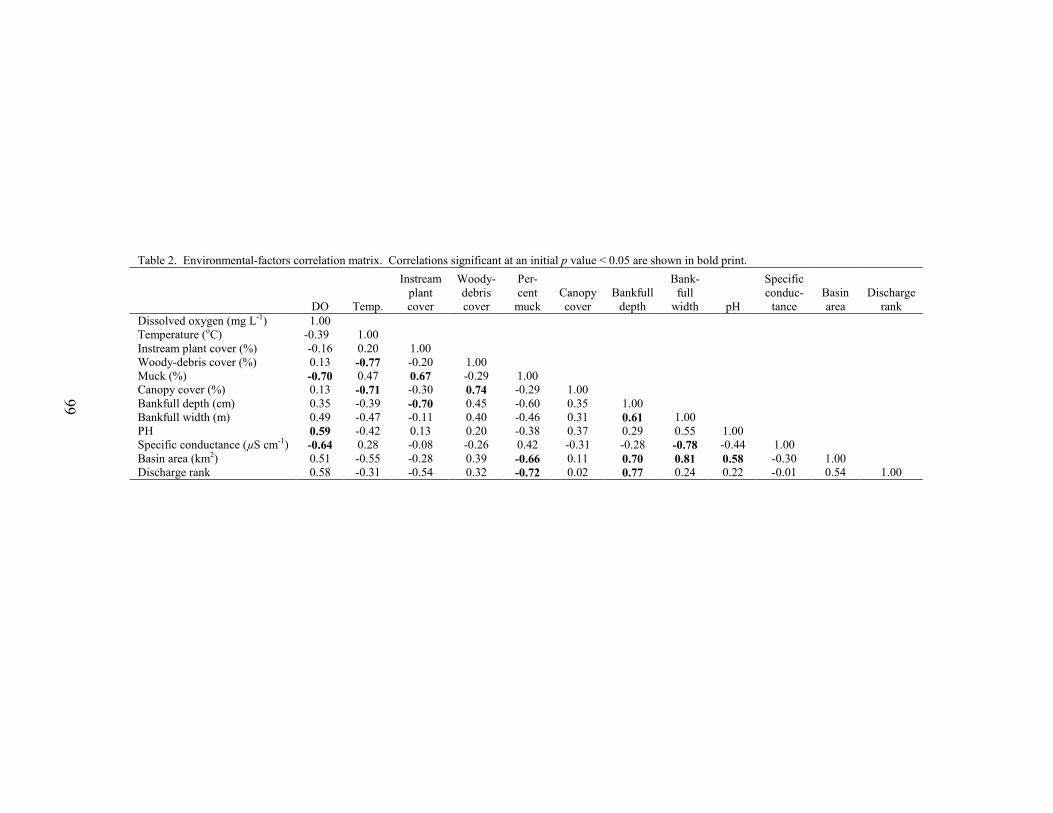
99
Table 2. Environmental-factors correlation matrix. Correlations significant at an initial p value < 0.05 are shown in bold print.
DO Temp.
Instream plant cover
Woody- debris cover
Per-cent
muck Canopy cover
Bankfull depth
Bank-full
width pH
Specific conduc-
tance Basin area
Discharge rank
Dissolved oxygen (mg L-1) 1.00 Temperature (oC) -0.39 1.00 Instream plant cover (%) -0.16 0.20 1.00 Woody-debris cover (%) 0.13 -0.77 -0.20 1.00 Muck (%) -0.70 0.47 0.67 -0.29 1.00 Canopy cover (%) 0.13 -0.71 -0.30 0.74 -0.29 1.00 Bankfull depth (cm) 0.35 -0.39 -0.70 0.45 -0.60 0.35 1.00 Bankfull width (m) 0.49 -0.47 -0.11 0.40 -0.46 0.31 0.61 1.00 PH 0.59 -0.42 0.13 0.20 -0.38 0.37 0.29 0.55 1.00 Specific conductance (µS cm-1) -0.64 0.28 -0.08 -0.26 0.42 -0.31 -0.28 -0.78 -0.44 1.00 Basin area (km2) 0.51 -0.55 -0.28 0.39 -0.66 0.11 0.70 0.81 0.58 -0.30 1.00 Discharge rank 0.58 -0.31 -0.54 0.32 -0.72 0.02 0.77 0.24 0.22 -0.01 0.54 1.00
99
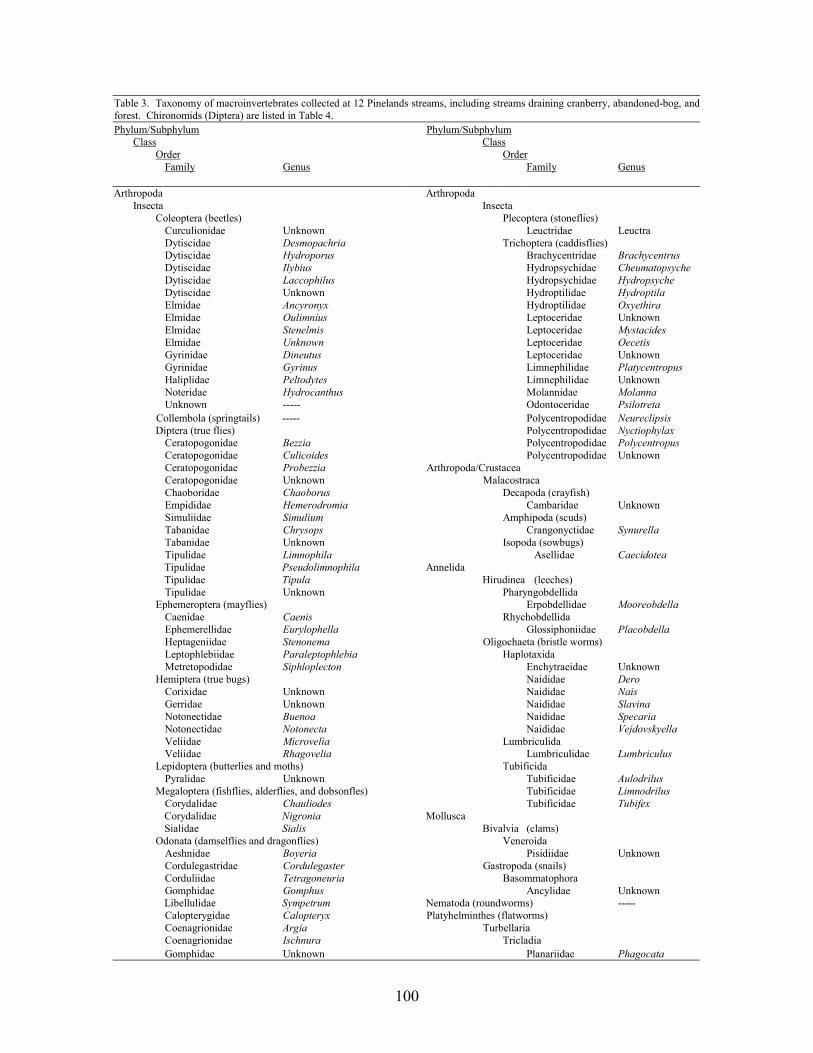
100
Table 3. Taxonomy of macroinvertebrates collected at 12 Pinelands streams, including streams draining cranberry, abandoned-bog, and forest. Chironomids (Diptera) are listed in Table 4. Phylum/Subphylum Phylum/Subphylum Class Class Order Order Family Genus Family Genus Arthropoda Arthropoda Insecta Insecta Coleoptera (beetles) Plecoptera (stoneflies) Curculionidae Unknown Leuctridae Leuctra Dytiscidae Desmopachria Trichoptera (caddisflies) Dytiscidae Hydroporus Brachycentridae Brachycentrus Dytiscidae Ilybius Hydropsychidae Cheumatopsyche Dytiscidae Laccophilus Hydropsychidae Hydropsyche Dytiscidae Unknown Hydroptilidae Hydroptila Elmidae Ancyronyx Hydroptilidae Oxyethira Elmidae Oulimnius Leptoceridae Unknown Elmidae Stenelmis Leptoceridae Mystacides Elmidae Unknown Leptoceridae Oecetis Gyrinidae Dineutus Leptoceridae Unknown Gyrinidae Gyrinus Limnephilidae Platycentropus Haliplidae Peltodytes Limnephilidae Unknown Noteridae Hydrocanthus Molannidae Molanna Unknown ----- Odontoceridae Psilotreta Collembola (springtails) ----- Polycentropodidae Neureclipsis Diptera (true flies) Polycentropodidae Nyctiophylax Ceratopogonidae Bezzia Polycentropodidae Polycentropus Ceratopogonidae Culicoides Polycentropodidae Unknown Ceratopogonidae Probezzia Arthropoda/Crustacea Ceratopogonidae Unknown Malacostraca Chaoboridae Chaoborus Decapoda (crayfish) Empididae Hemerodromia Cambaridae Unknown Simuliidae Simulium Amphipoda (scuds) Tabanidae Chrysops Crangonyctidae Synurella Tabanidae Unknown Isopoda (sowbugs) Tipulidae Limnophila Asellidae Caecidotea Tipulidae Pseudolimnophila Annelida Tipulidae Tipula Hirudinea (leeches) Tipulidae Unknown Pharyngobdellida Ephemeroptera (mayflies) Erpobdellidae Mooreobdella Caenidae Caenis Rhychobdellida Ephemerellidae Eurylophella Glossiphoniidae Placobdella Heptageniidae Stenonema Oligochaeta (bristle worms) Leptophlebiidae Paraleptophlebia Haplotaxida Metretopodidae Siphloplecton Enchytraeidae Unknown Hemiptera (true bugs) Naididae Dero Corixidae Unknown Naididae Nais Gerridae Unknown Naididae Slavina Notonectidae Buenoa Naididae Specaria Notonectidae Notonecta Naididae Vejdovskyella Veliidae Microvelia Lumbriculida Veliidae Rhagovelia Lumbriculidae Lumbriculus Lepidoptera (butterlies and moths) Tubificida Pyralidae Unknown Tubificidae Aulodrilus Megaloptera (fishflies, alderflies, and dobsonfles) Tubificidae Limnodrilus Corydalidae Chauliodes Tubificidae Tubifex Corydalidae Nigronia Mollusca Sialidae Sialis Bivalvia (clams) Odonata (damselflies and dragonflies) Veneroida Aeshnidae Boyeria Pisidiidae Unknown Cordulegastridae Cordulegaster Gastropoda (snails) Corduliidae Tetragoneuria Basommatophora Gomphidae Gomphus Ancylidae Unknown Libellulidae Sympetrum Nematoda (roundworms) ----- Calopterygidae Calopteryx Platyhelminthes (flatworms) Coenagrionidae Argia Turbellaria Coenagrionidae Ischnura Tricladia Gomphidae Unknown Planariidae Phagocata
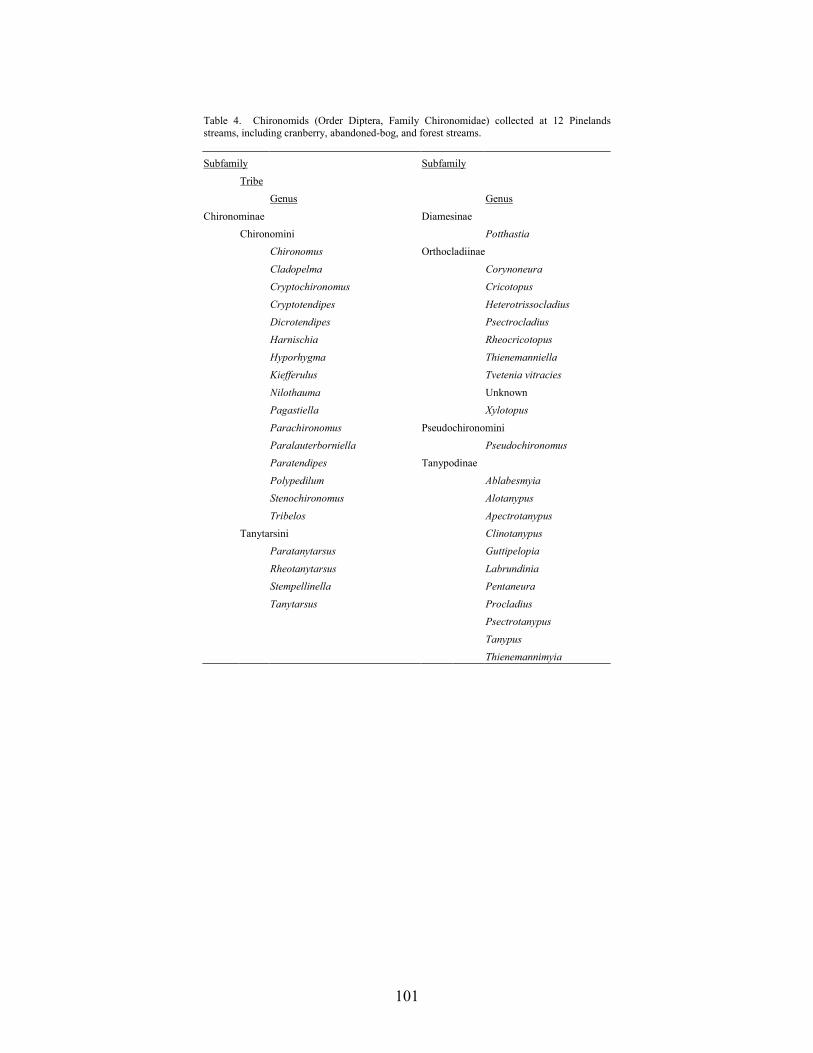
101
Table 4. Chironomids (Order Diptera, Family Chironomidae) collected at 12 Pinelands streams, including cranberry, abandoned-bog, and forest streams.
Subfamily Subfamily
Tribe Genus Genus
Chironominae Diamesinae Chironomini Potthastia Chironomus Orthocladiinae
Cladopelma Corynoneura Cryptochironomus Cricotopus Cryptotendipes Heterotrissocladius Dicrotendipes Psectrocladius Harnischia Rheocricotopus Hyporhygma Thienemanniella Kiefferulus Tvetenia vitracies Nilothauma Unknown Pagastiella Xylotopus Parachironomus Pseudochironomini Paralauterborniella Pseudochironomus Paratendipes Tanypodinae
Polypedilum Ablabesmyia Stenochironomus Alotanypus Tribelos Apectrotanypus Tanytarsini Clinotanypus Paratanytarsus Guttipelopia Rheotanytarsus Labrundinia Stempellinella Pentaneura Tanytarsus Procladius Psectrotanypus Tanypus Thienemannimyia
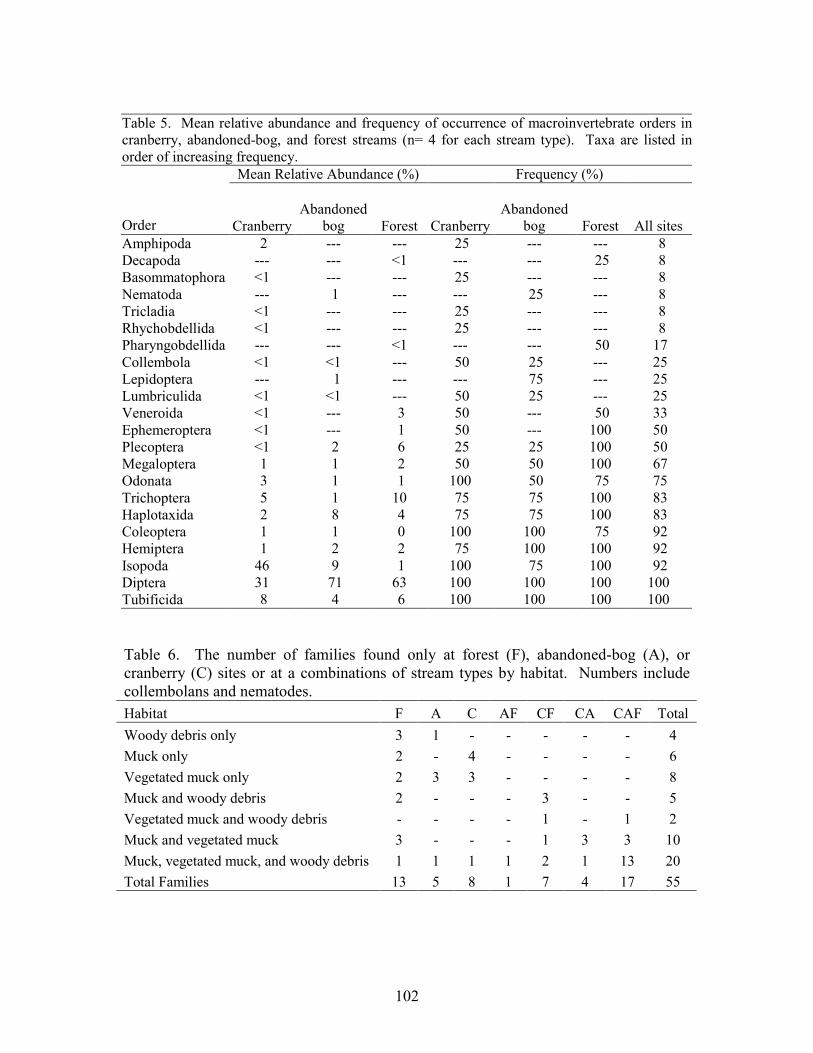
102
Table 5. Mean relative abundance and frequency of occurrence of macroinvertebrate orders incranberry, abandoned-bog, and forest streams (n= 4 for each stream type). Taxa are listed inorder of increasing frequency.
Mean Relative Abundance (%) Frequency (%)
Order Cranberry Abandoned
bog Forest CranberryAbandoned
bog Forest All sites Amphipoda 2 --- --- 25 --- --- 8 Decapoda --- --- <1 --- --- 25 8 Basommatophora <1 --- --- 25 --- --- 8 Nematoda --- 1 --- --- 25 --- 8 Tricladia <1 --- --- 25 --- --- 8 Rhychobdellida <1 --- --- 25 --- --- 8 Pharyngobdellida --- --- <1 --- --- 50 17 Collembola <1 <1 --- 50 25 --- 25 Lepidoptera --- 1 --- --- 75 --- 25 Lumbriculida <1 <1 --- 50 25 --- 25 Veneroida <1 --- 3 50 --- 50 33 Ephemeroptera <1 --- 1 50 --- 100 50 Plecoptera <1 2 6 25 25 100 50 Megaloptera 1 1 2 50 50 100 67 Odonata 3 1 1 100 50 75 75 Trichoptera 5 1 10 75 75 100 83 Haplotaxida 2 8 4 75 75 100 83 Coleoptera 1 1 0 100 100 75 92 Hemiptera 1 2 2 75 100 100 92 Isopoda 46 9 1 100 75 100 92 Diptera 31 71 63 100 100 100 100 Tubificida 8 4 6 100 100 100 100
Table 6. The number of families found only at forest (F), abandoned-bog (A), or cranberry (C) sites or at a combinations of stream types by habitat. Numbers include collembolans and nematodes. Habitat F A C AF CF CA CAF Total Woody debris only 3 1 - - - - - 4 Muck only 2 - 4 - - - - 6 Vegetated muck only 2 3 3 - - - - 8 Muck and woody debris 2 - - - 3 - - 5 Vegetated muck and woody debris - - - - 1 - 1 2 Muck and vegetated muck 3 - - - 1 3 3 10 Muck, vegetated muck, and woody debris 1 1 1 1 2 1 13 20 Total Families 13 5 8 1 7 4 17 55
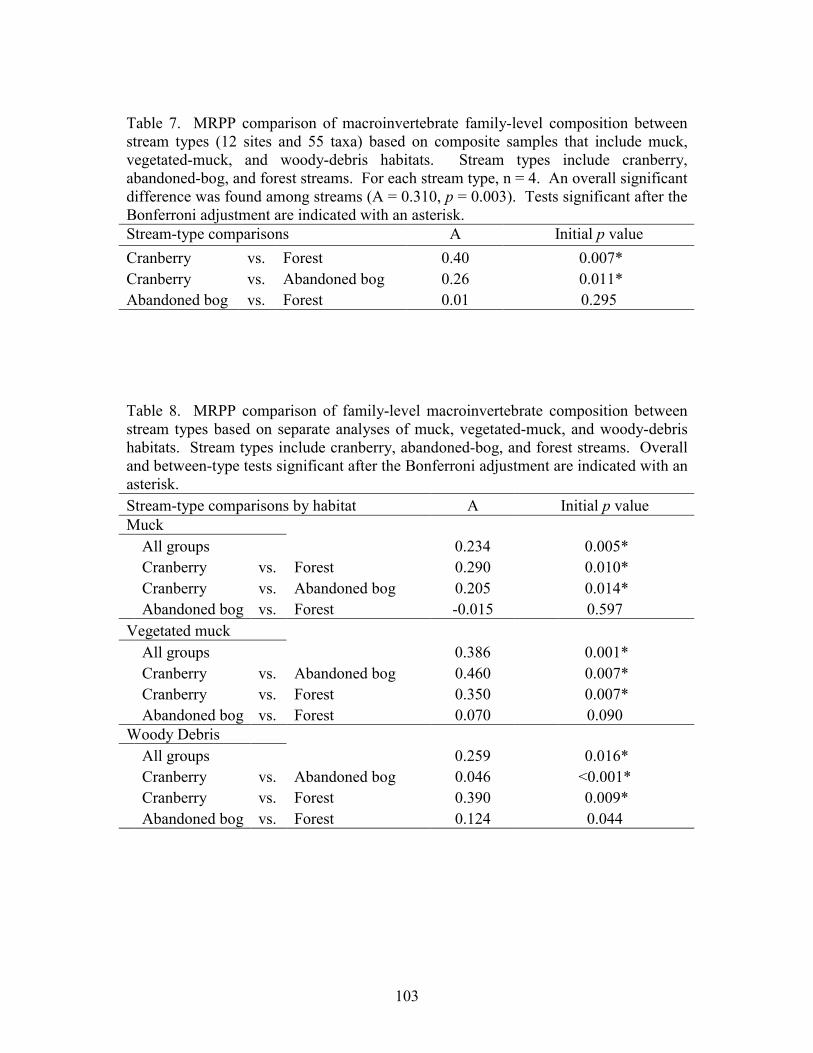
103
Table 7. MRPP comparison of macroinvertebrate family-level composition between stream types (12 sites and 55 taxa) based on composite samples that include muck, vegetated-muck, and woody-debris habitats. Stream types include cranberry, abandoned-bog, and forest streams. For each stream type, n = 4. An overall significant difference was found among streams (A = 0.310, p = 0.003). Tests significant after the Bonferroni adjustment are indicated with an asterisk. Stream-type comparisons A Initial p value Cranberry vs. Forest 0.40 0.007* Cranberry vs. Abandoned bog 0.26 0.011* Abandoned bog vs. Forest 0.01 0.295
Table 8. MRPP comparison of family-level macroinvertebrate composition between stream types based on separate analyses of muck, vegetated-muck, and woody-debris habitats. Stream types include cranberry, abandoned-bog, and forest streams. Overall and between-type tests significant after the Bonferroni adjustment are indicated with an asterisk. Stream-type comparisons by habitat A Initial p value Muck All groups 0.234 0.005* Cranberry vs. Forest 0.290 0.010* Cranberry vs. Abandoned bog 0.205 0.014* Abandoned bog vs. Forest -0.015 0.597 Vegetated muck All groups 0.386 0.001* Cranberry vs. Abandoned bog 0.460 0.007* Cranberry vs. Forest 0.350 0.007* Abandoned bog vs. Forest 0.070 0.090 Woody Debris All groups 0.259 0.016* Cranberry vs. Abandoned bog 0.046 <0.001* Cranberry vs. Forest 0.390 0.009* Abandoned bog vs. Forest 0.124 0.044
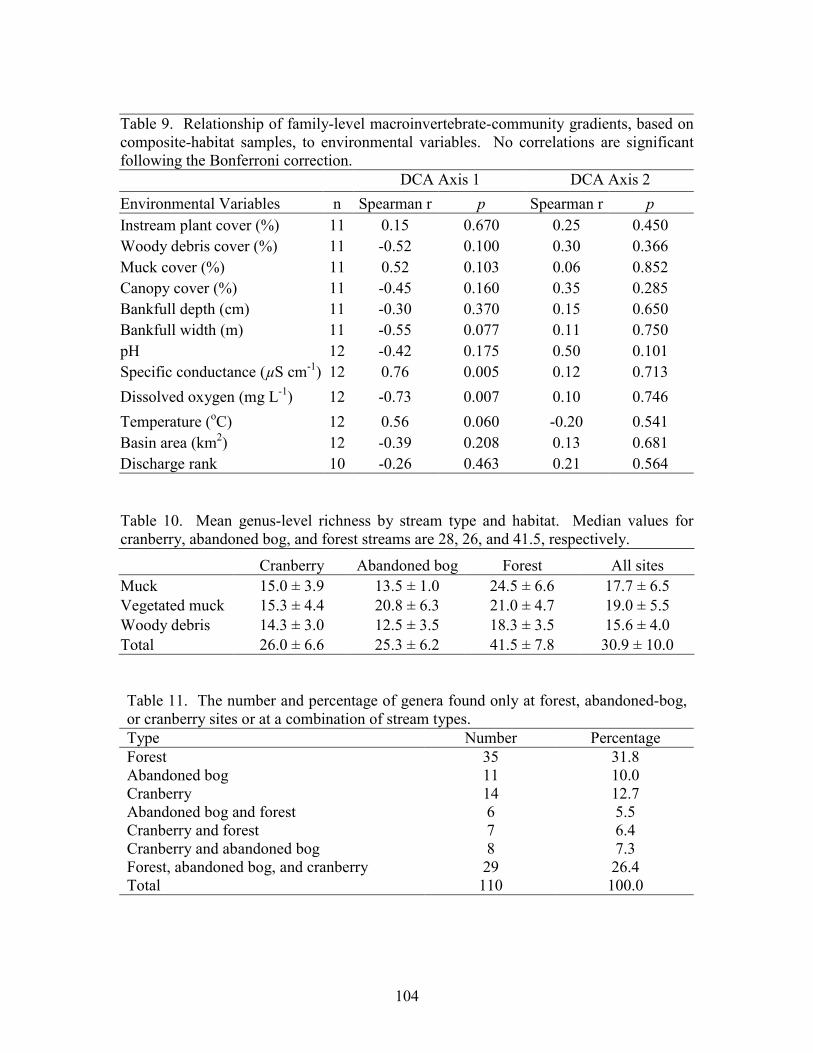
104
Table 9. Relationship of family-level macroinvertebrate-community gradients, based on composite-habitat samples, to environmental variables. No correlations are significant following the Bonferroni correction. DCA Axis 1 DCA Axis 2 Environmental Variables n Spearman r p Spearman r p Instream plant cover (%) 11 0.15 0.670 0.25 0.450 Woody debris cover (%) 11 -0.52 0.100 0.30 0.366 Muck cover (%) 11 0.52 0.103 0.06 0.852 Canopy cover (%) 11 -0.45 0.160 0.35 0.285 Bankfull depth (cm) 11 -0.30 0.370 0.15 0.650 Bankfull width (m) 11 -0.55 0.077 0.11 0.750 pH 12 -0.42 0.175 0.50 0.101 Specific conductance (µS cm-1) 12 0.76 0.005 0.12 0.713 Dissolved oxygen (mg L-1) 12 -0.73 0.007 0.10 0.746 Temperature (oC) 12 0.56 0.060 -0.20 0.541 Basin area (km2) 12 -0.39 0.208 0.13 0.681 Discharge rank 10 -0.26 0.463 0.21 0.564
Table 10. Mean genus-level richness by stream type and habitat. Median values for cranberry, abandoned bog, and forest streams are 28, 26, and 41.5, respectively. Cranberry Abandoned bog Forest All sites Muck 15.0 ± 3.9 13.5 ± 1.0 24.5 ± 6.6 17.7 ± 6.5 Vegetated muck 15.3 ± 4.4 20.8 ± 6.3 21.0 ± 4.7 19.0 ± 5.5 Woody debris 14.3 ± 3.0 12.5 ± 3.5 18.3 ± 3.5 15.6 ± 4.0 Total 26.0 ± 6.6 25.3 ± 6.2 41.5 ± 7.8 30.9 ± 10.0
Table 11. The number and percentage of genera found only at forest, abandoned-bog, or cranberry sites or at a combination of stream types. Type Number Percentage Forest 35 31.8 Abandoned bog 11 10.0 Cranberry 14 12.7 Abandoned bog and forest 6 5.5 Cranberry and forest 7 6.4 Cranberry and abandoned bog 8 7.3 Forest, abandoned bog, and cranberry 29 26.4 Total 110 100.0
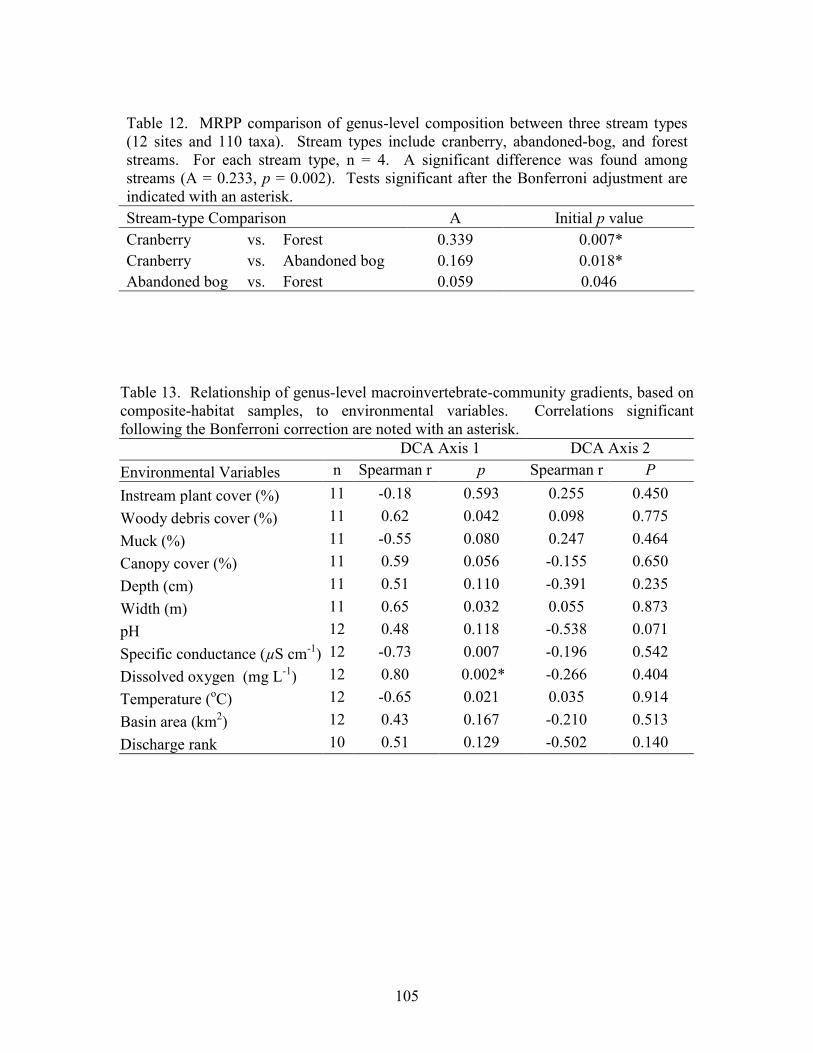
105
Table 12. MRPP comparison of genus-level composition between three stream types (12 sites and 110 taxa). Stream types include cranberry, abandoned-bog, and forest streams. For each stream type, n = 4. A significant difference was found among streams (A = 0.233, p = 0.002). Tests significant after the Bonferroni adjustment are indicated with an asterisk. Stream-type Comparison A Initial p value Cranberry vs. Forest 0.339 0.007* Cranberry vs. Abandoned bog 0.169 0.018* Abandoned bog vs. Forest 0.059 0.046
Table 13. Relationship of genus-level macroinvertebrate-community gradients, based on composite-habitat samples, to environmental variables. Correlations significant following the Bonferroni correction are noted with an asterisk. DCA Axis 1 DCA Axis 2 Environmental Variables n Spearman r p Spearman r P Instream plant cover (%) 11 -0.18 0.593 0.255 0.450 Woody debris cover (%) 11 0.62 0.042 0.098 0.775 Muck (%) 11 -0.55 0.080 0.247 0.464 Canopy cover (%) 11 0.59 0.056 -0.155 0.650 Depth (cm) 11 0.51 0.110 -0.391 0.235 Width (m) 11 0.65 0.032 0.055 0.873 pH 12 0.48 0.118 -0.538 0.071 Specific conductance (µS cm-1) 12 -0.73 0.007 -0.196 0.542 Dissolved oxygen (mg L-1) 12 0.80 0.002* -0.266 0.404 Temperature (oC) 12 -0.65 0.021 0.035 0.914 Basin area (km2) 12 0.43 0.167 -0.210 0.513 Discharge rank 10 0.51 0.129 -0.502 0.140
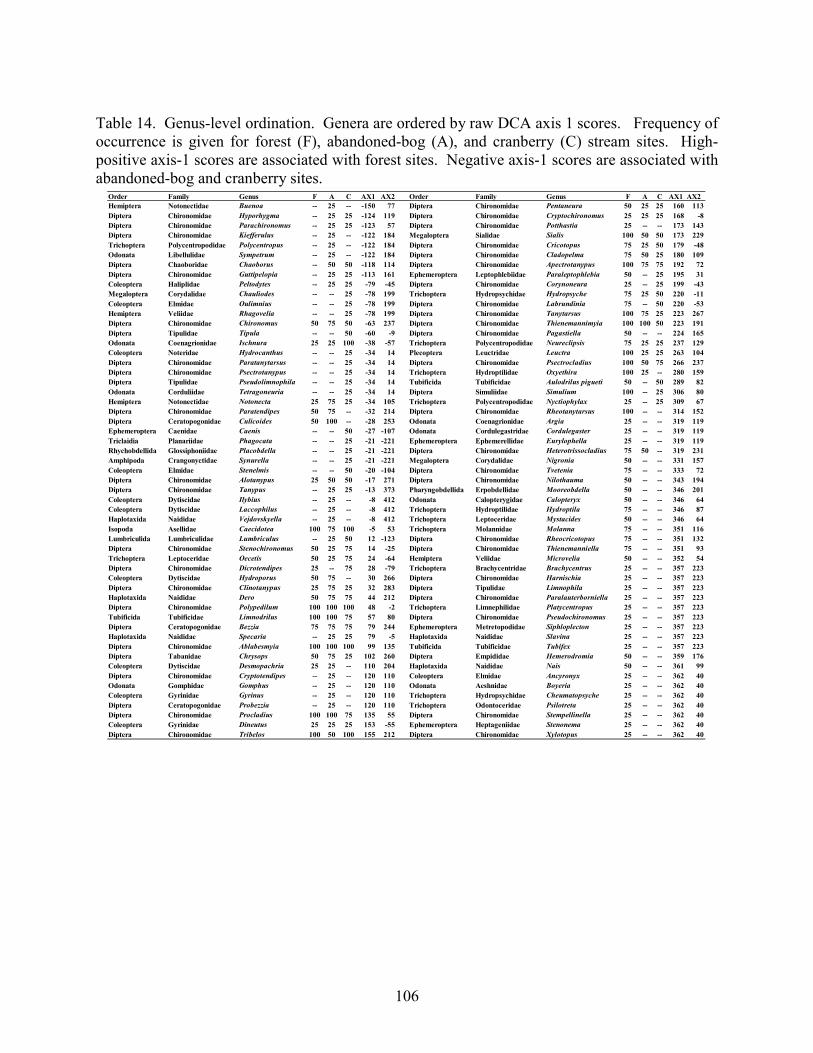
106
Table 14. Genus-level ordination. Genera are ordered by raw DCA axis 1 scores. Frequency of occurrence is given for forest (F), abandoned-bog (A), and cranberry (C) stream sites. High-positive axis-1 scores are associated with forest sites. Negative axis-1 scores are associated with abandoned-bog and cranberry sites.
Order Family Genus F A C AX1 AX2 Order Family Genus F A C AX1 AX2Hemiptera Notonectidae Buenoa -- 25 -- -150 77 Diptera Chironomidae Pentaneura 50 25 25 160 113Diptera Chironomidae Hyporhygma -- 25 25 -124 119 Diptera Chironomidae Cryptochironomus 25 25 25 168 -8Diptera Chironomidae Parachironomus -- 25 25 -123 57 Diptera Chironomidae Potthastia 25 -- -- 173 143Diptera Chironomidae Kiefferulus -- 25 -- -122 184 Megaloptera Sialidae Sialis 100 50 50 173 229Trichoptera Polycentropodidae Polycentropus -- 25 -- -122 184 Diptera Chironomidae Cricotopus 75 25 50 179 -48Odonata Libellulidae Sympetrum -- 25 -- -122 184 Diptera Chironomidae Cladopelma 75 50 25 180 109Diptera Chaoboridae Chaoborus -- 50 50 -118 114 Diptera Chironomidae Apectrotanypus 100 75 75 192 72Diptera Chironomidae Guttipelopia -- 25 25 -113 161 Ephemeroptera Leptophlebiidae Paraleptophlebia 50 -- 25 195 31Coleoptera Haliplidae Peltodytes -- 25 25 -79 -45 Diptera Chironomidae Corynoneura 25 -- 25 199 -43Megaloptera Corydalidae Chauliodes -- -- 25 -78 199 Trichoptera Hydropsychidae Hydropsyche 75 25 50 220 -11Coleoptera Elmidae Oulimnius -- -- 25 -78 199 Diptera Chironomidae Labrundinia 75 -- 50 220 -53Hemiptera Veliidae Rhagovelia -- -- 25 -78 199 Diptera Chironomidae Tanytarsus 100 75 25 223 267Diptera Chironomidae Chironomus 50 75 50 -63 237 Diptera Chironomidae Thienemannimyia 100 100 50 223 191Diptera Tipulidae Tipula -- -- 50 -60 -9 Diptera Chironomidae Pagastiella 50 -- -- 224 165Odonata Coenagrionidae Ischnura 25 25 100 -38 -57 Trichoptera Polycentropodidae Neureclipsis 75 25 25 237 129Coleoptera Noteridae Hydrocanthus -- -- 25 -34 14 Plecoptera Leuctridae Leuctra 100 25 25 263 104Diptera Chironomidae Paratanytarsus -- -- 25 -34 14 Diptera Chironomidae Psectrocladius 100 50 75 266 237Diptera Chironomidae Psectrotanypus -- -- 25 -34 14 Trichoptera Hydroptilidae Oxyethira 100 25 -- 280 159Diptera Tipulidae Pseudolimnophila -- -- 25 -34 14 Tubificida Tubificidae Aulodrilus pigueti 50 -- 50 289 82Odonata Corduliidae Tetragoneuria -- -- 25 -34 14 Diptera Simuliidae Simulium 100 -- 25 306 80Hemiptera Notonectidae Notonecta 25 75 25 -34 105 Trichoptera Polycentropodidae Nyctiophylax 25 -- 25 309 67Diptera Chironomidae Paratendipes 50 75 -- -32 214 Diptera Chironomidae Rheotanytarsus 100 -- -- 314 152Diptera Ceratopogonidae Culicoides 50 100 -- -28 253 Odonata Coenagrionidae Argia 25 -- -- 319 119Ephemeroptera Caenidae Caenis -- -- 50 -27 -107 Odonata Cordulegastridae Cordulegaster 25 -- -- 319 119Triclaidia Planariidae Phagocata -- -- 25 -21 -221 Ephemeroptera Ephemerellidae Eurylophella 25 -- -- 319 119Rhychobdellida Glossiphoniidae Placobdella -- -- 25 -21 -221 Diptera Chironomidae Heterotrissocladius 75 50 -- 319 231Amphipoda Crangonyctidae Synurella -- -- 25 -21 -221 Megaloptera Corydalidae Nigronia 50 -- -- 331 157Coleoptera Elmidae Stenelmis -- -- 50 -20 -104 Diptera Chironomidae Tvetenia 75 -- -- 333 72Diptera Chironomidae Alotanypus 25 50 50 -17 271 Diptera Chironomidae Nilothauma 50 -- -- 343 194Diptera Chironomidae Tanypus -- 25 25 -13 373 Pharyngobdellida Erpobdellidae Mooreobdella 50 -- -- 346 201Coleoptera Dytiscidae Ilybius -- 25 -- -8 412 Odonata Calopterygidae Calopteryx 50 -- -- 346 64Coleoptera Dytiscidae Laccophilus -- 25 -- -8 412 Trichoptera Hydroptilidae Hydroptila 75 -- -- 346 87Haplotaxida Naididae Vejdovskyella -- 25 -- -8 412 Trichoptera Leptoceridae Mystacides 50 -- -- 346 64Isopoda Asellidae Caecidotea 100 75 100 -5 53 Trichoptera Molannidae Molanna 75 -- -- 351 116Lumbriculida Lumbriculidae Lumbriculus -- 25 50 12 -123 Diptera Chironomidae Rheocricotopus 75 -- -- 351 132Diptera Chironomidae Stenochironomus 50 25 75 14 -25 Diptera Chironomidae Thienemanniella 75 -- -- 351 93Trichoptera Leptoceridae Oecetis 50 25 75 24 -64 Hemiptera Veliidae Microvelia 50 -- -- 352 54Diptera Chironomidae Dicrotendipes 25 -- 75 28 -79 Trichoptera Brachycentridae Brachycentrus 25 -- -- 357 223Coleoptera Dytiscidae Hydroporus 50 75 -- 30 266 Diptera Chironomidae Harnischia 25 -- -- 357 223Diptera Chironomidae Clinotanypus 25 75 25 32 283 Diptera Tipulidae Limnophila 25 -- -- 357 223Haplotaxida Naididae Dero 50 75 75 44 212 Diptera Chironomidae Paralauterborniella 25 -- -- 357 223Diptera Chironomidae Polypedilum 100 100 100 48 -2 Trichoptera Limnephilidae Platycentropus 25 -- -- 357 223Tubificida Tubificidae Limnodrilus 100 100 75 57 80 Diptera Chironomidae Pseudochironomus 25 -- -- 357 223Diptera Ceratopogonidae Bezzia 75 75 75 79 244 Ephemeroptera Metretopodidae Siphloplecton 25 -- -- 357 223Haplotaxida Naididae Specaria -- 25 25 79 -5 Haplotaxida Naididae Slavina 25 -- -- 357 223Diptera Chironomidae Ablabesmyia 100 100 100 99 135 Tubificida Tubificidae Tubifex 25 -- -- 357 223Diptera Tabanidae Chrysops 50 75 25 102 260 Diptera Empididae Hemerodromia 50 -- -- 359 176Coleoptera Dytiscidae Desmopachria 25 25 -- 110 204 Haplotaxida Naididae Nais 50 -- -- 361 99Diptera Chironomidae Cryptotendipes -- 25 -- 120 110 Coleoptera Elmidae Ancyronyx 25 -- -- 362 40Odonata Gomphidae Gomphus -- 25 -- 120 110 Odonata Aeshnidae Boyeria 25 -- -- 362 40Coleoptera Gyrinidae Gyrinus -- 25 -- 120 110 Trichoptera Hydropsychidae Cheumatopsyche 25 -- -- 362 40Diptera Ceratopogonidae Probezzia -- 25 -- 120 110 Trichoptera Odontoceridae Psilotreta 25 -- -- 362 40Diptera Chironomidae Procladius 100 100 75 135 55 Diptera Chironomidae Stempellinella 25 -- -- 362 40Coleoptera Gyrinidae Dineutus 25 25 25 153 -55 Ephemeroptera Heptageniidae Stenonema 25 -- -- 362 40Diptera Chironomidae Tribelos 100 50 100 155 212 Diptera Chironomidae Xylotopus 25 -- -- 362 40
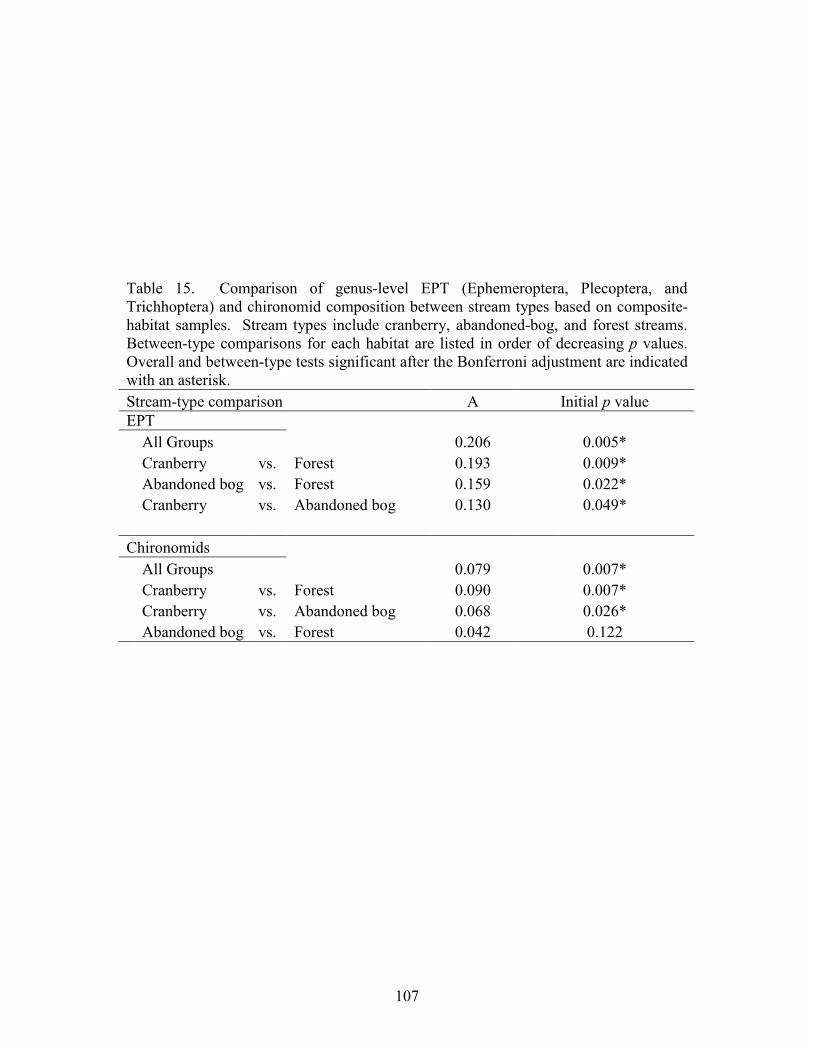
107
Table 15. Comparison of genus-level EPT (Ephemeroptera, Plecoptera, and Trichhoptera) and chironomid composition between stream types based on composite-habitat samples. Stream types include cranberry, abandoned-bog, and forest streams. Between-type comparisons for each habitat are listed in order of decreasing p values. Overall and between-type tests significant after the Bonferroni adjustment are indicated with an asterisk. Stream-type comparison A Initial p value EPT All Groups 0.206 0.005* Cranberry vs. Forest 0.193 0.009* Abandoned bog vs. Forest 0.159 0.022* Cranberry vs. Abandoned bog 0.130 0.049* Chironomids All Groups 0.079 0.007* Cranberry vs. Forest 0.090 0.007* Cranberry vs. Abandoned bog 0.068 0.026* Abandoned bog vs. Forest 0.042 0.122
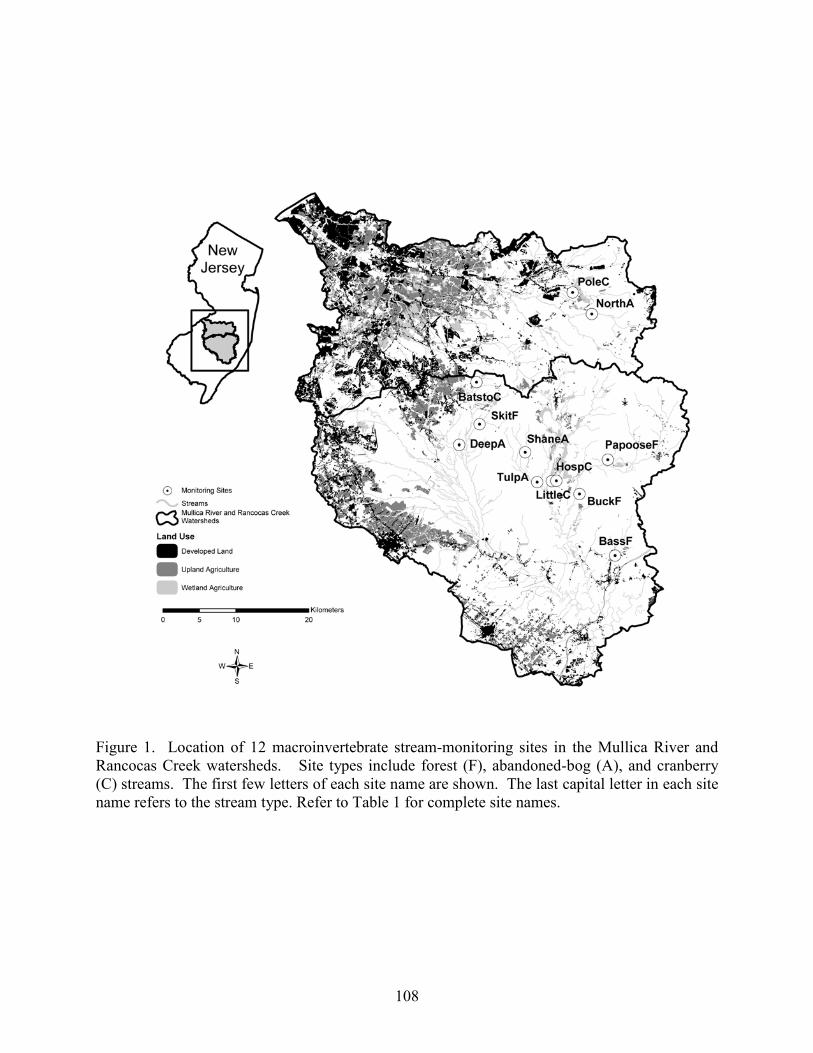
108
Figure 1. Location of 12 macroinvertebrate stream-monitoring sites in the Mullica River and Rancocas Creek watersheds. Site types include forest (F), abandoned-bog (A), and cranberry (C) streams. The first few letters of each site name are shown. The last capital letter in each site name refers to the stream type. Refer to Table 1 for complete site names.
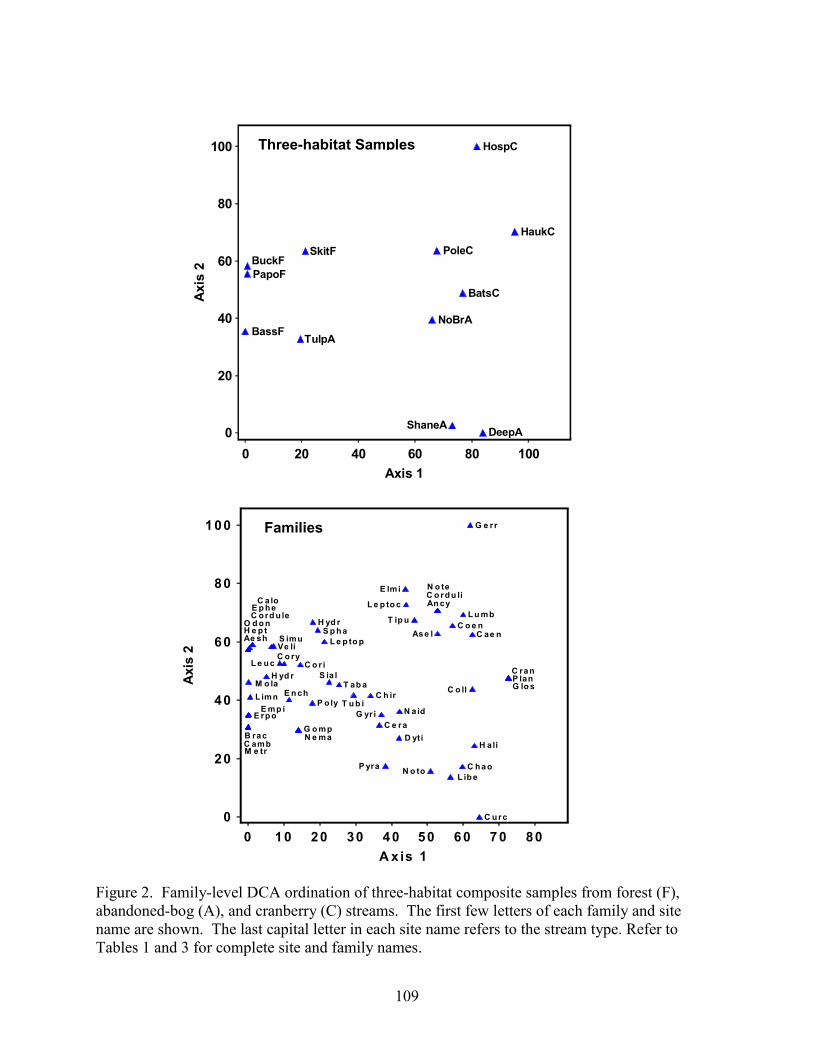
109
Figure 2. Family-level DCA ordination of three-habitat composite samples from forest (F), abandoned-bog (A), and cranberry (C) streams. The first few letters of each family and site name are shown. The last capital letter in each site name refers to the stream type. Refer to Tables 1 and 3 for complete site and family names.
BatsC
HospC
HaukCPoleC
DeepA
NoBrA
ShaneA
TulpA
BuckF
BassF
PapoF
SkitF
00
20 40 60 80 100
20
40
60
80
100
Axis 1
Axi
s 2
Ae sh
An cy
Ase l
B rac
C ae n
C a lo
C amb
C e ra
C hao
C h ir
C o e n
C o ll
C ord u le
C o rdu li
C o r iC o ry
C ran
C urc
D yti
E lmi
E mp i
E n ch
E p he
E rpo
G e rr
G lo s
G o mp
G yr i
H ali
H e p tH yd r
H yd r
L e p to c
L e p to p
L e uc
L ibe
L imn
L u mb
M e tr
M o la
N a id
N e ma
N o te
N o to
O d o n
P lan
P o ly
P yra
S ia l
S imuS p ha
T ab a
T ip u
T u b i
Ve li
00
1 0 20 30 4 0 50 6 0 7 0 80
20
40
60
80
1 00
A xis 1
Axi
s 2
Three-habitat Samples
Families
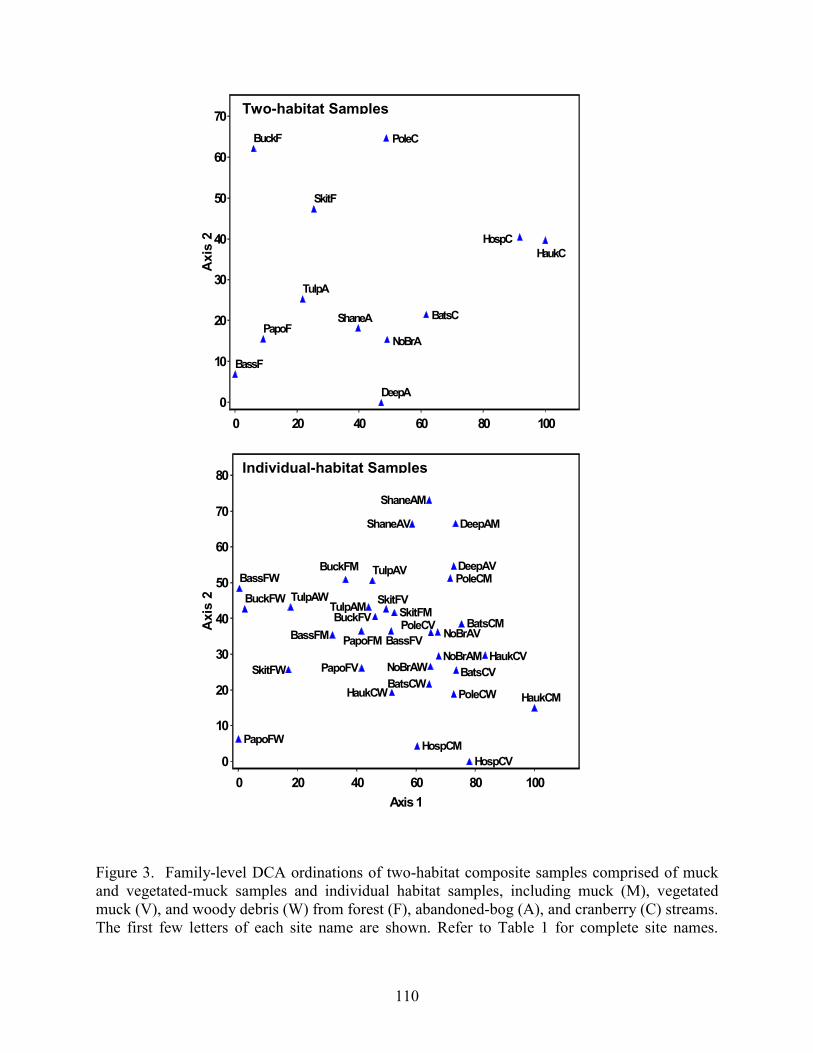
110
Figure 3. Family-level DCA ordinations of two-habitat composite samples comprised of muck and vegetated-muck samples and individual habitat samples, including muck (M), vegetated muck (V), and woody debris (W) from forest (F), abandoned-bog (A), and cranberry (C) streams. The first few letters of each site name are shown. Refer to Table 1 for complete site names.
BatsC
HaukCHospC
PoleC
DeepA
NoBrA
ShaneA
TulpA
BassF
BuckF
PapoF
SkitF
00
20 40 60 80 100
10
20
30
40
50
60
70
Axis 1
Axi
s 2
Two-habitat Samples
BatsCV
BatsCM
BatsCW
HospCVHospCM
HaukCV
HaukCMHaukCW
PoleCV
PoleCM
PoleCW
DeepAV
DeepAM
NoBrAV
NoBrAMNoBrAW
ShaneAV
ShaneAM
TulpAV
TulpAMTulpAW
BuckFV
BuckFM
BuckFW
BassFVBassFM
BassFW
PapoFV
PapoFM
PapoFW
SkitFVSkitFM
SkitFW
00
20 40 60 80 100
10
20
30
40
50
60
70
80
Axis 1
Axi
s 2
Individual-habitat Samples
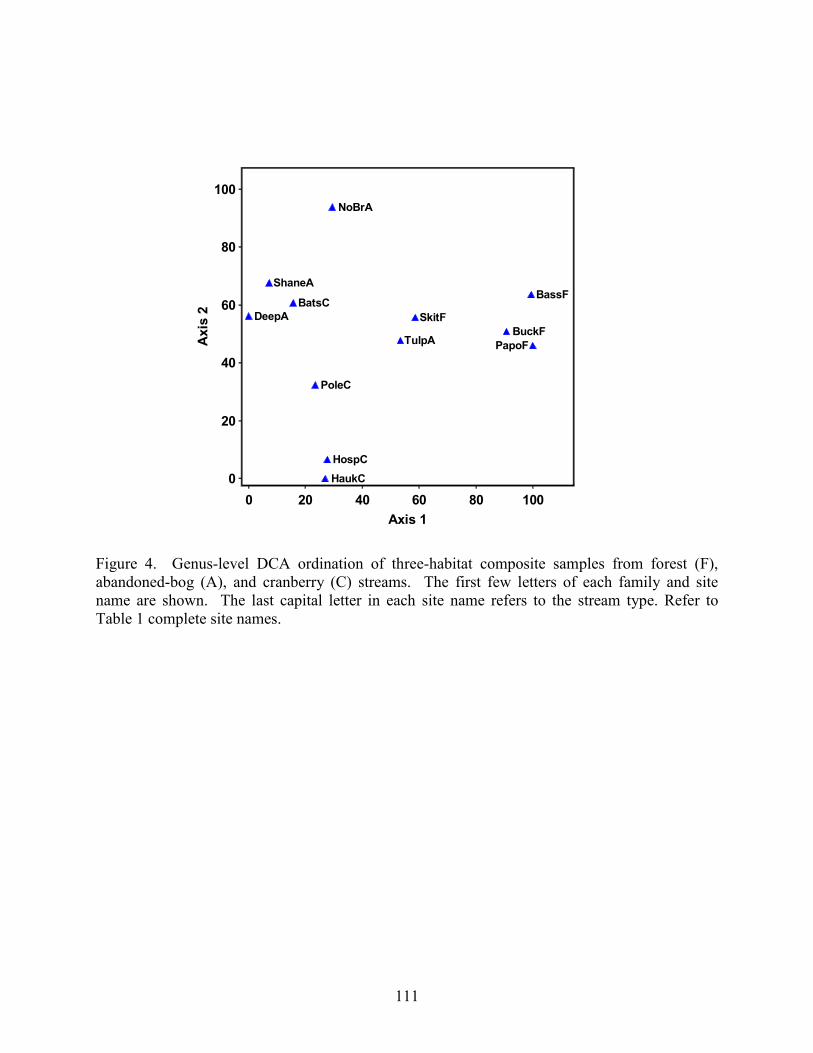
111
Figure 4. Genus-level DCA ordination of three-habitat composite samples from forest (F), abandoned-bog (A), and cranberry (C) streams. The first few letters of each family and site name are shown. The last capital letter in each site name refers to the stream type. Refer to Table 1 complete site names.
BatsC
HospCHaukC
PoleC
DeepA
NoBrA
TulpABuckF
BassF
PapoF
SkitF
ShaneA
00
20 40 60 80 100
20
40
60
80
100
Axis 1
Axi
s 2

113
PART 6. FISH ASSEMBLAGES IN PINELANDS STREAMS DRAINING ACTIVE-CRANBERRY BOGS, ABANDONED-CRANBERRY BOGS, AND FOREST LAND
John F. Bunnell
Abstract
I evaluated whether there were differences in fish-assemblage composition, fish
abundance, and fish biomass between Pinelands streams that drain active-cranberry bogs, abandoned-cranberry bogs, and forest land. All streams were shallow, relatively slow moving, and acidic, with low specific conductance and dissolved-oxygen values. Muck was the dominant sediment at most sites. Compared to forest streams, cranberry and abandoned-bog streams were generally characterized by less canopy cover, lower pH and dissolved-oxygen levels, and higher water temperature and specific conductance values. A total of twelve native Pinelands fish species were collected from the eleven streams. Although there was no difference in species richness between the three stream types, variations in species richness were related to several measures of stream size, including basin area, discharge, bankful-channel width, and bankful-channel depth. Fish-community gradients, generated from separate ordinations of presence-absence and relative-abundance data, did not distinguish stream types, but were related to species richness and the same four measures of stream size. The increase in species richness with stream size was primarily due to the addition of new species, rather than species replacement. The banded sunfish (Enneacanthus obesus) and eastern mudminnow (Umbra pygmaea) were the most frequently occurring species. Although there was no significant difference in the presence-absence or relative abundance of fish species between stream types, the swamp darter (Etheostoma fusiforme) was less abundant and the banded sunfish and eastern mudminnow were more abundant in cranberry and abandoned-bog streams compared to forest streams. Cranberry and abandoned-bog streams generally supported greater fish abundance and biomass (represented by the weight of six target species), which was primarily due to the higher abundance of banded sunfish and eastern mudminnows at streams in these two groups. Greater fish abundance and biomass for cranberry and abandoned-bog streams may be related to the lower pH and dissolved-oxygen levels at these sites, conditions that may favor the banded sunfish and eastern mudminnow. Reduced canopy cover, lower dissolved-oxygen levels, and higher water temperatures at cranberry and abandoned-bog streams are likely due to deforestation and the greater amount of open water in watersheds with past and present cranberry agriculture.
Introduction
Forested watersheds in the New Jersey Pinelands are characterized by acid-water
conditions and native-fish assemblages, whereas basins that drain upland agriculture and developed land display elevated pH and support nonnative-fish species (Hastings 1979, 1984, Zampella and Bunnell 1998). As many as ten fish species usually distributed outside the Pinelands and three species introduced to the state have been collected from degraded waters in the region (Zampella et al. 2003). In contrast to upland-agricultural impacts, basins that drain both past and present wetland agriculture, including active-cranberry farms and abandoned-cranberry bogs, support a similar suite of native species as forested watersheds (Zampella et al.
114
2001, 2003). Due to the similarity in fish species present, streams that drain active-cranberry bogs, abandoned bogs, and forest land have all served as reference sites to assess the aquatic integrity of other sites in the region (Zampella and Bunnell 1998, Zampella et al. in press). Because regional-reference sites should represent minimally disturbed streams (Hughes et al. 1986) and wetland agriculture comprises a substantial portion of some Pinelands watersheds (Procopio and Bunnell 2006), a detailed evaluation is warranted to determine whether differences in fish-assemblage composition exist between these three stream types. In this study, I compare fish assemblages from streams that drain active-cranberry bogs, abandoned-cranberry bogs, and forest land. All sites were located in central-Pinelands streams with minimal upland agriculture or developed land. I address two questions. First, are there differences in fish-assemblage composition based on the presence-absence or relative abundance of fish species between the three stream types? Secondly, does fish abundance and biomass differ between stream types?
Methods
Land Use and Study Site Selection I selected three active-cranberry (cranberry) streams, four abandoned-cranberry bog (abandoned-bog) streams, and four forest streams (Figure 1, Table 1). All eleven streams were included in earlier fish studies and drainage basin boundaries were delineated and land-use profiles were completed as part of those studies (Zampella et al. 2001, 2003). The data set used to create the land-use profiles used a modified Anderson et al. (1976) system. In this paper, I refer to the Anderson-type land-use classes of urban land, agriculture, and agricultural wetlands as developed land, upland agriculture, and wetland agriculture, respectively. Collectively, I refer to developed land and upland agriculture as altered land. Wetland agriculture includes cranberry and blueberry farming. Most wetland agriculture in the study basins is cranberry agriculture.
The percentage of altered land (developed land and upland agriculture) was below ten percent in all study basins (Table 1). The four forest sites were located in streams with no apparent agricultural history. Abandoned-bog sites were located in streams that drained abandoned bogs and forest. The three cranberry sites were located immediately downstream from active-cranberry farms and were within abandoned bogs. All abandoned bogs succeeded to emergent, shrub, or forested wetlands types. In the cranberry basins, the percentage of wetland agriculture ranged from 8.4 to 34.3%.
Fish Surveys Species-composition Surveys. To determine species composition, I sampled fish within 100-m stream reaches at the eleven study streams using a 4-mm mesh nylon seine. Surveys were completed from July through September 2001 and August through September 2002. Three stream reaches were less than 100-m (two reaches at Shane Branch were each 50 m and one reach at Little Hauken Run was 75 m). The number of sampling reaches per stream ranged from one to six. I identified, counted, and measured the total length of all fish collected. Some juvenile Esox and Enneacanthus could not be identified to species and were not included in the
115
analysis. I determined fish presence-absence and relative abundance for each stream reach. Relative abundance was calculated as: [number of individuals of a species/total number of individuals] x 100. The data from individual stream reaches were used to calculate presence/absence, mean relative abundance, and the number of fish collected per 100 m of stream for each study stream.
Biomass Surveys. To develop species-specific relationships between total length and weight, I completed separate surveys to collect six target species at three streams (Batsto River, Hospitality Brook, and North Branch Mount Misery Brook) from July through September 2001 and August through September 2002. Four species, banded sunfish (Enneacanthus obesus), eastern mudminnow (Umbra pygmaea), swamp darter (Etheostoma fusiforme), and mud sunfish (Acantharchus pomotis), were among the most frequently occurring and abundant species collected during the species-composition surveys. The other two species, redfin pickerel (Esox americanus) and chain pickerel (Esox niger), are major piscivores. I weighed and measured the total length of all individuals collected for use in determining fish biomass. Environmental Factors From May through November 2001 and April through November 2002, pH, specific conductance, dissolved oxygen, and water temperature were measured monthly near each fish-sampling site. All water-quality measurements were completed under baseflow conditions. Temperature and dissolved oxygen were measured with a YSI 52 dissolved-oxygen meter, pH was measured using an Orion model-250A meter, and specific conductance was measured with an Orion model-122 meter. All available data were used to calculate median values for each sampling site. From October 2000 through October 2003, stream discharge was measured on 63 to 64 dates at or near seven fish-sampling sites. Two additional sites were monitored for a shorter period (Batsto River - March 2002 to October 2003, n = 22, and Skit Branch - October 2000 to October 2001, n = 34). Discharge was not measured at Buck Run and Deep Run. To allow a comparison of all sites where discharge was measured, including the Batsto River and Skit Branch sites, available discharge values for each date were ranked and a median discharge rank was calculated for each site (Table 1). Stream habitat was characterized along transects established at 25-m intervals within each fish-sampling reach. At each transect, bankfull-channel width and depth were measured, canopy cover was measured using a spherical densitometer, and stream-vegetation cover was estimated in 0.5 x 0.5-m quadrats located at the right and left side of the channel and the thalweg (deepest point in the channel). Stream-bed substrate texture was subjectively classified as sand or muck in each quadrat. For each transect, I determined bankful-channel width, mean bankful-channel depth, mean channel-vegetation cover, mean canopy cover, and the frequency of occurrence of muck and sand expressed as a percentage.
116
Data Analysis Species Composition. I used detrended correspondence analysis (DCA, Hill 1979a, Hill and Gauch 1980) and TWINSPAN (Hill 1979b) to ordinate and classify fish assemblages and the eleven stream sites based on presence-absence and relative-abundance data. Relative-abundance data were log transformed prior to the DCA analysis. Default settings were used for the ordination and classification analyses. I used Spearman rank correlation to assess the relationship between the first two DCA axes of the presence-absence and relative-abundance ordinations and species richness and between these axes and the eleven environmental variables (basin area, discharge rank, pH, specific conductance, dissolved-oxygen concentration, temperature, channel-vegetation cover, canopy cover, muck frequency, channel depth, and channel width). I also used correlation to evaluate the relationship between the first and second DCA axes from both ordinations.
Nonparametric multi-response permutation procedures (MRPP, McCune and Mefford 1999) were used to compare the presence-absence and relative abundance of fish species between the three stream types. The MRPP analyses were based on Euclidean distance. I report the p and A values for each analysis. The p value describes the likelihood that an observed difference is due to chance. The A statistic (chance-corrected within-group agreement) describes agreement within groups (i.e., stream type). A = 1 when all attributes within a group are identical, A = 0 when within group heterogeneity equals that expected by chance, and A < 0 when within-group heterogeneity is greater than expected by chance.
Biomass and Abundance. I used simple linear regression to develop species-specific relationships between total length and weight for the six target species collected during the biomass surveys. Total length and weight values were log transformed prior to the regression analyses. I then used these relationships and data from the species-compositon surveys to predict the total weight of each target species, summed the predicted weights by stream, and expressed the sum as total weight per 100 m of stream (biomass). Total fish abundance for each stream was calculated as the total number of individuals of all species expressed per 100 meters of stream.
I used separate Mann-Whitney U Tests to evaluate differences in biomass (total weight of the six target species per 100 m of stream), fish abundance (total number of fish per 100 m of stream), and species richness between the three stream types. I used Spearman rank correlation to assess the relationship between fish biomass and abundance and between biomass, abundance, and species richness and the eleven environmental variables.
I used an alpha level of 0.05 to assess significance for all tests. Within groups of related
correlations and Mann-Whitney tests, the alpha level was corrected for multiple comparisons using the sequential Bonferroni significance-level adjustment (Rice 1989, 1991). Ordinations, TWINSPAN classifications, and MRPP analyses were performed using PC-ORD for Windows 4.27 (MjM Software, Gleneden Beach, OR). Mann-Whitney tests, correlations, and regression analyses were performed using Statistica 7.1 (StatSoft, Inc., Tulsa, OK).
117
Results Environmental Factors
All eleven streams were acidic, with low specific conductance values and dissolved oxygen (Table 1). Except for Tulpehocken Creek, where the streambed was primarily sand, the dominant stream-bed substrate at all sites was muck. Streams were generally shallow with mean depth ranging from 18.0 to 70.0 cm. Basin area ranged from 4.0 to 56.6 km2. Although the number of discharge measurements varied by stream and streamflow was not measured at two sites, median discharge for the period of record was below 17.0 cfs.
Canopy cover at the study streams was dominated by Atlantic white cedar
(Chamaecyparis thyoides), red maple (Acer rubrum) and other hardwoods, and mixed cedar/hardwood forests (Laidig 2006). Canopy cover ranged from 90% at Papoose Branch, one of the forest streams, to no canopy cover at Deep Run, an abandoned-bog stream (Table 1). Cranberry and abandoned-bog streams were generally characterized as having reduced canopy cover, lower pH and dissolved-oxygen concentrations, and higher water temperatures. Median specific conductance was lowest at forest sites and highest at cranberry sites.
The Spearman rank correlation matrix revealed strong relationships between some
environmental variables (Table 2). Generally, lower pH streams displayed lower dissolved oxygen and higher specific conductance values, sites with less canopy cover exhibited higher water temperatures, deeper streams were associated with higher discharge ranks, and streams with wider channels were in larger basins and displayed lower specific conductance values and higher dissolved-oxygen concentrations. Due to the large number of comparisons, conclusions regarding the statistical significance of these associations cannot be made. Fish Inventory
A total of 2,998 individuals, representing twelve species of native Pinelands fish, were collected from the eleven streams during the species-composition surveys (Table 3). Species richness ranged from 2.0 to 10.0 with an overall mean (±1 SD) and median of 6.4 (± 2.5) and 6.0, respectively. Mann-Whitney test results indicated there was no significant difference in species richness between the three stream types. There was a significant positive correlation between species richness and basin area (r = 0.77, p = 0.0054), channel width (r = 0.71, p = 0.0136), channel depth (r = 0.67, p = 0.0251), discharge rank (r = 0.74, p = 0.0228), and dissolved-oxygen concentration (r = 0.66, p = 0.0279). However, due to the large number of comparisions, these relationships were not significant after Bonferroni correction. Species richness was not related to any of the other environmental variables.
The most-frequently occurring species were the eastern mudminnow and banded sunfish (Table 3). All twelve species were present in the cranberry streams and eleven species were found in both the abandoned-bog and forest streams. The bluespotted sunfish (Enneacanthus gloriosus) was absent from abandoned-bog streams and the creek chubsucker (Erimyzon oblongus) was absent from forest streams.
118
The most abundant species were the banded sunfish, eastern mudminnow, and swamp darter. Mean (±1 SD) abundance was highest for banded sunfish (56.4 ± 79.1), intermediate for the eastern mudminnow (30.1 ± 34.4), and lowest for the swamp darter (10.7 ±12.4). Mean abundance of each of the remaining nine species was < 6.7 individuals per site. Banded sunfish were most abundant in cranberry streams and least abundant in forest streams (Table 4). Eastern mudminnows were most abundant in abandoned-bog streams and least abundant in forest streams. Cranberry and forest streams supported similar numbers of swamp darters, but abundance for this species was lowest at abandoned-bog streams.
Relative abundance of species also varied between stream types (Figure 2). The mean
relative abundance of the swamp darter was higher at forest streams (28%) compared to cranberry (8%) or abandoned-bog (7%) streams. Although less abundant overall, the American eel (Anguilla rostrata), pirate perch (Aphredoderus sayanus), yellow bullhead (Ameiurus natalis), and chain pickerel were also more abundant at forest sites compared to the other two stream types. The redfin pickerel showed the opposite trend. The mud sunfish was more abundant at abandoned-bog and forest streams compared to cranberry streams. The mean relative abundance of banded sunfish was considerably higher at cranberry (56%) and abandoned-bog (45%) streams compared to forest streams (10%). Eastern mudminnows and banded sunfish together represented about 70% of the fish collected from cranberry and abandoned-bog streams compared to about 40% for forest streams. In general, relative abundance was spread across more of the species present at forest sites compared to the other two stream types. Species Composition
The DCA ordination based on presence-absence data contrasted Batsto River, Shane Branch, Deep Run, and Papoose Branch, shown on the left side of the site diagram, with Hospitality Brook, Tulpehocken Creek, and Bass River, shown on the right side of the site diagram (Figure 3). Both groups included representatives of each stream type. Like the ordination, the TWINSPAN classification did not distinquish between stream types. The first division of the TWINSPAN classification separated Buck Run along with the Batsto River, Shane Branch, Deep Run, and Papoose Branch sites from all other sites.
The Batsto River, Shane Branch, Deep Run, and Papoose Branch sites were characterized
by low species richness and the absence of the blackbanded sunfish (Enneacanthus chaetodon), creek chubsucker, American eel, bluespotted sunfish, and yellow bullhead (Figure 3). Three of these four sites were shallow, narrow cranberry or abandoned-bog streams. In contrast, Hospitality Brook, Tulpehocken Creek, and Bass River displayed the highest species-richness values. These three sites were deep and wide with some of the highest discharge ranks.
The results of the MRPP based on presence-absence data indicated there was no
significant difference between stream types (A = -0.049, p = 0.8665). Spearman rank correlation results revealed a significant positive relationship between the presence-absence community gradient, represented by the first DCA axis, and basin area, discharge rank, and channel depth (Table 5). Because of the large number of comparisons, only the relationship with channel depth remained significant after Bonferroni adjustment. There was also a significant positive

119
relationship between the presence-absence community gradient and species richness (r = 0.86, p = 0.0006). The increase in species richness was primarily due to the addition of new species along the community gradient. The second axis of the presence-absence community gradient was not related to any of the environmental variables or species richness.
Results from the ordination based on relative-abundance data were similar to those
obtained using presence-absence data (Figure 4). There was a significant correlation between the first DCA axes from both site ordinations (r = 0.87, p = 0.0005), but the second axes were not related. Likewise, the first DCA axes from both species ordinations were correlated (r = 0.89, p = 0.0001), but there was no relationship between the second axes.
The first division of the TWINSPAN classification based on relative-abundance data
separated Bass River, Skit Branch, Hospitality Brook, and Tulpehocken Creek, shown on the right side of the first axis, from the other seven sites. The relative abundance of the creek chubsucker, American eel, bluespotted sunfish, blackbanded sunfish, and yellow bullhead was generally greater at these four sites, whereas the redfin pickerel was absent.
The results of the MRPP based on relative-abundance data indicated there was no
significant difference between stream types (A = 0.021, p = 0.2758). Spearman rank correlation results revealed a significant positive relationship between the relative-abundance community gradient, represented by the first axis of the relative-abundance ordination, and dissolved oxygen, channel width, channel depth, and discharge rank (Table 5). Because of the large number of tests, none of these relationships was significant after Bonferroni adjustment. There was a significant positive correlation between the second axis of the relative-abundance ordination and channel width, and a significant negative correlation between the second axis and temperature and specific conductance (Table 5). Only the relationship with channel width remained significant after Bonferroni correction. As with the presence-absence ordination, there was a significant positive correlation between the relative-abundance community gradient and species richness (r = 0.82, p = 0.0021), and species were added along this community gradient rather than replaced.
Biomass and Abundance
Overall mean (±1 SD) and median fish abundance (number of fish collected per 100 m of
stream) was 123.4 (±116.9) and 87.0, respectively. Fish abundance ranged from 24 individuals at East Branch Bass River, a forest stream, to 437 individuals at Hospitality Brook, a cranberry stream. Initial Mann-Whitney test results showed a significant difference in fish abundance only between abandoned-bog and forest streams (p = 0.0286), but this difference was not significant after Bonferroni correction. Although not significant, mean (±1 SD) fish abundance was highest for cranberry streams (226.0 ± 183.7), intermediate for abandoned-bog streams (123.4 ± 65.8), and lowest for forest streams (46.5 ± 18.0)(Figure 5).
Based on the regression analysis, there was a significant relationship between fish total length and weight for the six target species, with R-square values that ranged from 0.70 for swamp darter to 0.99 for mud sunfish (Figure 6). Biomass (total predicted weight of the six target species per 100 m of stream) ranged from 50.5g at Skit Branch, a forest stream, to 631.6g
120
at Hospitality Brook, a cranberry stream. Mean (±1 SD) biomass was considerably higher for cranberry (396.0 ± 218.2) and abandoned-bog (343.3 ± 184.5) streams compared to forest streams (109.6 ± 45.0) (Figure 5). However, Bonferroni corrected Mann-Whitney tests results indicated no significant difference in biomass between stream types.
The relative contribution of the six target species to the total weight varied by stream type
(Figure 7). Swamp darters represented a greater percentage of the total weight at forest streams compared to the other two stream types. Redfin pickerel showed the opposite trend. Chain pickerel represented a greater proportion of the total weight at abandoned-bog and forest sites compared to cranberry streams. Banded sunfish represented 60% of the total weight at cranberry streams compared to 28% at abandoned-bog streams and 22% at forest streams. The eastern mudminnow accounted for slightly more of the total weight at abandoned-bog streams compared to the other two stream types. Together, banded sunfish and eastern mudminnows comprised 71% of the total weight at cranberry streams, 46% of the total weight at abandoned-bog streams, and 34% of the total weight at forest streams.
There was a significant positive relationship between fish abundance and biomass (r =
0.80, p = 0.0034). Relationships between fish abundance and biomass and the environmental variables were not significant after Bonferroni correction due to the large number of comparisons. However, initial p values indicated a positive correlation between both fish abundance and biomass and specific conductance, and a negative relationship between fish abundance and dissolved oxygen and canopy cover (Table 6).
Discussion
The strong relationship between the first-axis site and species scores of both ordinations
indicated that the primary fish-community gradient based on presence-absence data paralleled that using relative-abundance data. The ordinations and associated MRPP analyses did not reveal differences in the presence-absence or relative-abundance of fish species between cranberry, abandoned-bog, and forest streams.
The low species richness found for all study streams is typical of the depauperate fish
fauna that characterizes Pinelands streams (Hastings 1979, Zampella and Bunnell 1998) and small, acid-water streams elsewhere (Mendonca et al. 2005). Although species richness did not differ between stream types, variations in species richness were related to several measures of stream size (basin area, channel width, channel depth, and discharge). Similarly, the presence-absence and relative-abundance fish-community gradients were related to species richness and the same measures of stream size. The increase in species richness with stream size was primarily due to the addition of new species, rather than species replacement.
Increasing species richness with stream size is a pattern consistent with basic theory of stream ecology (Matthews 1998). In many river systems of the central United States, species richness increases with both watershed area and stream order (Fausch et al. 1984), and can rise rapidly from upstream to downstream sections, mainly due to the addition of new species (Horowitz 1978). Although a similar trend has been observed in New England streams (Sheldon 1968), increasing species richness with stream order in South Carolina coastal plain streams is

121
primarily due to species replacement, rather than addition (Paller 1994, 1995). In contrast to trends in the United States, in France, sharp increases in species richness can occur further downstream between fifth and sixth order streams (Grenouillet et al. 2004). Exceptionally high species turnover can occur when species loss equals addition, leading to fairly constant richness along stream systems (Mendonca et al. 2005). The lack of a relationship between species richness and basin area or stream discharge in a previous Pinelands fish study was attributed to the relative stability of the permanently flowing streams sampled (Zampella and Bunnell 1998).
Although not significant after Bonferroni correction, fish abundance and biomass were generally higher at cranberry and abandoned-bog streams compared to forest streams. The correlation of increasing fish abundance with higher specific conductance values and lower canopy cover is consistent with this observation because cranberry and abandoned streams generally displayed higher specific conductance and lower canopy-cover values. Higher fish abundance and biomass for cranberry and abandoned-bog streams was primarily due to the greater abundance of banded sunfish and eastern mudninnows at these stream types. A similar pattern was observed by Zampella et al. (2001), who found that the same two species were associated with acidic, narrow, ditched streams located in abandoned-cranberry bogs in the Mullica River basin.
While no single environmental variable can account for the greater abundance of banded
sunfish and eastern mudninnows at cranberry and abandoned-bog streams, pH, dissolved oxygen, and temperature most likely play a role. Six of the seven sites with the lowest pH and dissolved-oxygen levels and highest temperature values were cranberry and abandoned-bog sites. Of all the Pinelands fish species, the eastern mudminnow is perhaps the most tolerant of low dissolved oxygen due to its ability to breathe atmospheric oxygen through the connection of its esophagus and swim bladder (Werner 2004). The banded sunfish, which has been reported from waters with pH as low as 3.7 (Graham and Hastings 1984), is one of the most acid-tolerant fish species known (Gonzalez and Dunson 1987, 1989, 1991). These physiological adaptations may allow both species to tolerate harsh environmental conditions such as those found at most of the cranberry and abandoned-bog sites. Both species may also be more tolerant of higher stream temperatures than some of the other species collected. Dominance of tolerant species often characterizes stream sites impacted by altered hydrologic regime, riparian-destruction, and channelization related to urbanization or agriculture (Scott and Hall 1997, Waite and Carpenter 2000, Kennen and Ayres 2002).
Another factor that may contribute to the higher abundance of banded sunfish at
cranberry and abandoned-bog streams is the landscape modification associated with past and present cranberry agriculture. Cranberry farming involves clearing land to construct bogs, impounding streams to establish reservoirs, and channelizing stream segments and creating extensive ditch networks to control the flow of water (Eck 1990). Although banded sunfish are common in both streams and impoundments throughout the Pinelands, this species is much more abundant in impoundments (Zampella et al. 2001, 2003, 2005), such as the reservoirs and flooded abandoned bogs associated with past and present cranberry agriculture.
Removal of riparian vegetation that shades coastal plain streams can result in high water
temperatures and severe dissolved-oxygen depletion (Maxted et al. 1995). Compared to forest

122
streams, cranberry and abandoned-bog streams generally displayed higher water temperature and specific conductance values and lower pH, dissolved-oxygen, and canopy-cover values. Higher stream temperatures and reduced dissolved-oxygen and canopy-cover values for cranberry and abandoned-bog streams are likely due to deforestation and the greater amount of open water associated with active and historic cranberry agriculture (Procopio and Bunnell 2006). The similarity in some of the habitat, water-quality, and fish-assemblage attributes between cranberry and abandoned-bog streams suggests that these stream types are more similar to each other than to forest streams.
Acknowledgements Robert Zampella, Kim Laidig, Nick Procopio, Christina Burns, and Jason Shvanda assisted with various aspects of this study. The New Jersey Division of Parks and Forestry authorized the state-lands research permits. The Division of Fish and Wildlife provided the necessary fish-collection permits. Funding for this study was provided by the U. S. Environmental Protection Agency (State Wetlands Grant Program, Grant No. CD-99298001-1), the Pinelands Commission, and the National Park Service.
Literature Cited
Anderson, J. R., E. E. Hardy, J. T. Roach, and R. E. Witmer. 1976. A land use and land cover classification system for use with remote sensor data. U.S. Geological Survey Professional Paper 964. Eck, P. E. 1990. The American Cranberry. Rutgers University Press, New Brunswick, New Jersey, USA. Fausch, K. D., J. R. Karr, and P. R. Yant. 1984. Regional application of an index of biotic integrity based on stream fish communities. Transactions of the American Fisheries Society 113:39-55. Gonzalez, R. J., and W. A. Dunson. 1987. Adaptations of sodium balance to low pH in a sunfish (Enneacanthus obesus) from naturally acidic waters. Journal of Comparative Physiology B 157:555-566. Gonzalez, R. J., and W. A. Dunson. 1989. Differences in low pH tolerance among closely related sunfish of the genus Enneacanthus. Environmental Biology of Fishes 26:303-310. Gonzalez, R. J., and W. A. Dunson. 1991. Does water pH control habitat segregation of sibling species of sunfish (Enneacanthus)? Wetlands 11:313-323. Graham, J. H., and R. W. Hastings. 1984. Distributional patterns of sunfishes on the New Jersey coastal plain. Environmental Biology of Fishes 10:137-148.
123
Grenouillet, G., D. Pont, and C. Herisse. 2004. Within-basin fish assemblage structure: the relative influence of habitat versus stream spatial position on local species richness. Canadian Journal of Fisheries and Aquatic Sciences 61:93-102. Hastings, R. W. 1979. Fish of the Pine Barrens. Pages 489-504 in: R. T. T. Forman (Editor). Pine Barrens: Ecosystem and Landscape. Academic Press, New York, NY, USA. Hastings, R. W. 1984. The fishes of the Mullica River, a naturally acid water system of the New Jersey Pine Barrens. Bulletin of the New Jersey Academy of Science 29:9-23. Hill, M. O. 1979a. DECORANA - A FORTRAN program for detrended correspondence analysis and reciprocal averaging. Cornell University, Ithaca, NY, USA. Hill, M. O. 1979b. TWINSPAN - A FORTRAN program for arranging multivariate data in an ordered two-way table by classification of individuals and attributes. Cornell University, Ithaca, NY, USA. Hill, M. O., and H. G. Gauch Jr. 1980. Detrended correspondence analysis: an improved ordination technique. Vegetatio 42:47-58. Horowitz, R. J. 1978. Temporal variability patterns and the distributional patterns of stream fishes. Ecological Monographs 48:307-321. Hughes, R. M., D. P. Larsen, and J. M. Omernik. 1986. Regional reference sites: a method for assessing stream potentials. Environmental Management 10:629-635. Kennen, J. K. and M. A. Ayres. 2002. Relation of environmental characterizations to the composition of aquatic assemblages along a gradient of urban land use in New Jersey, 1996-98. U.S. Geological Survey Water-Resources Investigations Report 02-4069. Laidig, K. J. 2006. Vegetation in Pinelands streams draining active-cranberry bogs, abandoned-cranberry bogs, and forest land. Pages 59-79 in: R. A. Zampella et al. Monitoring the ecological integrity of Pinelands wetlands: A comparison of wetland landscapes, hydrology, and stream communities in Pinelands watersheds draining active-cranberry bogs, abandoned-cranberry bogs, and forest land. Pinelands Commission, New Lisbon, NJ. Matthews, W. J. 1998. Patterns in freshwater fish ecology. Kluwer Academic Publishers, Norwell, Massachusetts. Maxted, J. R., E. L. Dickey, and G. M. Mitchell. 1995. The water quality effects of channelization in coastal plain streams of Delaware. Delaware Department of Natural Resources and Environmental Control, Division or Water Resources, Cover, DE. McCune, B., and M. J. Mefford. 1999. PC-ORD. Multivariate analysis of ecological data, version 4. MjM Software Design, Gleneden Beach, OR, USA.
124
Mendonca, F. P., W. E. Magnusson, and J. Zuanon. 2005. Relationships between habitat characteristics and fish assemblages in small streams of Central Amazonia. Copeia 2005:751-763. Page, L. M., and B. M. Burr. 1991. Peterson field guides- Freshwater fishes of North America north of Mexico. Houghton Mifflin Co, Boston. Paller, M. H. 1994. Relationships between fish assemblage structure and stream order in South Carolina coastal plain streams. Transactions of the American Fisheries Society 123:150-161. Paller, M. H. 1995. Relationships among number of fish species sampled, reach length surveyed, and sampling effort in South Carolina coastal plain streams. North American Journal of Fisheries Management 15:110-120. Procopio, N. A. and J. F. Bunnell. 2006. A comparison of stream patterns and wetland landscapes in Pinelands basins draining active-cranberry bogs, abandoned bogs, and forest land. Pages 1-18 in: R. A. Zampella et al. Monitoring the ecological integrity of Pinelands wetlands: A comparison of wetland landscapes, hydrology, and stream communities in Pinelands watersheds draining active-cranberry bogs, abandoned-cranberry bogs, and forest land. Pinelands Commission, New Lisbon, NJ. Pinelands Commission, New Lisbon, NJ. Rice, W. R. 1989. Analyzing tables of statistical tests. Evolution 43:223-225. Rice, W. R. 1990. A consensus combined p-value test and family wide significance of component tests. Biometrics 46:303-308. Scott, M. C., and L. W. Hall, Jr. 1997. Fish assemblages as indicators of environmental degradation in Maryland coastal plain streams. Transactions of the American Fisheries Society 126:349-360. Sheldon, A. L. 1968. Species diversity and longitudinal succession in stream fishes. Ecology 49:193-198. Waite, I. R. and K. D. Carpenter. 2000. Associations among fish assemblage structure and environmental variables in Willamette Basin streams, Oregon. Transactions of the American Fisheries Society. 129:754-770. Werner, R. G. 2004. Freshwater fishes of the Northeastern United States. Syracuse University Press, New York, USA. Zampella, R. A., and J. F. Bunnell. 1998. Use of reference-site fish assemblages to assess aquatic degradation in Pinelands streams. Ecological Applications 8:645-658. Zampella, R. A., J. F. Bunnell, K. J. Laidig, and C. L. Dow. 2001. The Mullica River Basin: A report to the Pinelands Commission on the status of the landscape and selected aquatic and wetland resources. Pinelands Commission, New Lisbon, NJ.
125
Zampella, R. A., J. F. Bunnell, K. J. Laidig, and N. A. Procopio. 2003. The Rancocas Creek Basin: A report to the Pinelands Commission on the status of selected aquatic and wetland resources. Pinelands Commission, New Lisbon, NJ. Zampella, R. A., J. F. Bunnell, K. J. Laidig, and N. A. Procopio. 2005. The Great Egg Harbor River Watershed Management Area: A report to the Pinelands Commission on the status of selected aquatic and wetland resources. Pinelands Commission, New Lisbon, NJ. Zampella, R. A., J. F. Bunnell, K. J. Laidig, and N. A. Procopio. in press. Using multiple indicators to evaluate the ecological integrity of a coastal plain stream system. Ecological Indicators.
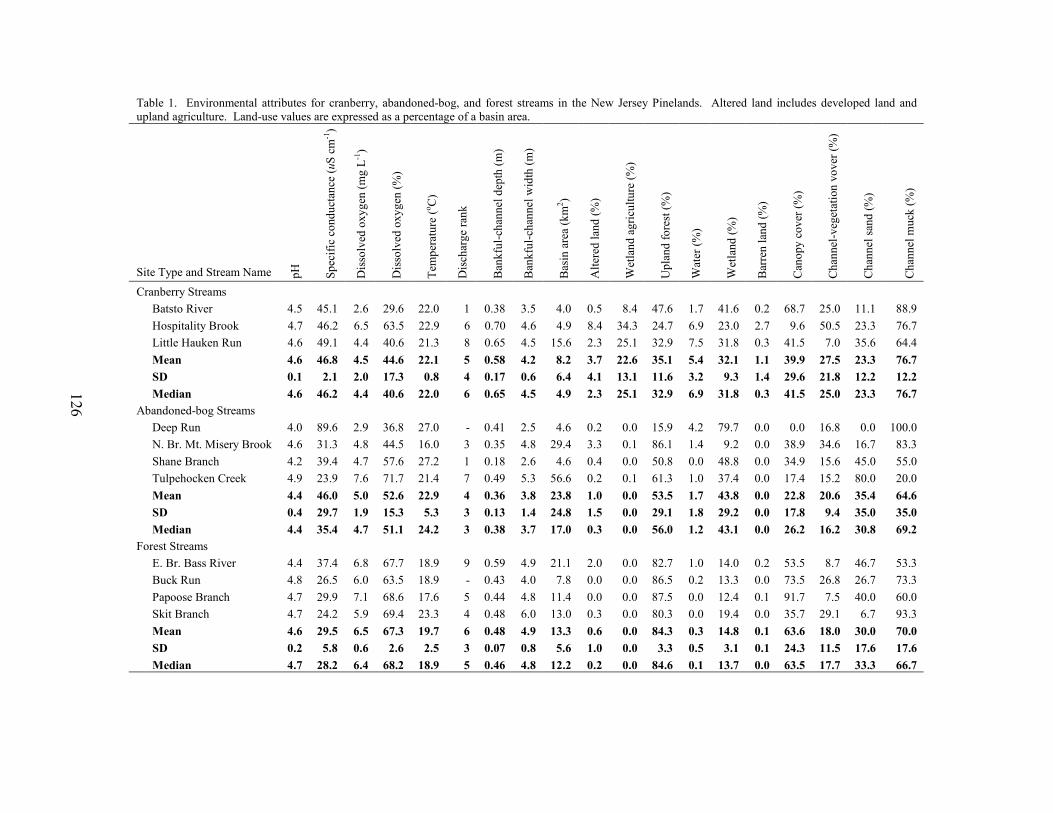
126
Table 1. Environmental attributes for cranberry, abandoned-bog, and forest streams in the New Jersey Pinelands. Altered land includes developed land and upland agriculture. Land-use values are expressed as a percentage of a basin area.
Site Type and Stream Name pH
Spec
ific
cond
ucta
nce
(uS
cm-1
)
Dis
solv
ed o
xyge
n (m
g L-1
)
Dis
solv
ed o
xyge
n (%
)
Tem
pera
ture
(o C)
Dis
char
ge ra
nk
Ban
kful
-cha
nnel
dep
th (m
)
Ban
kful
-cha
nnel
wid
th (m
)
Bas
in a
rea
(km
2 )
Alte
red
land
(%)
Wet
land
agr
icul
ture
(%)
Upl
and
fore
st (%
)
Wat
er (%
)
Wet
land
(%)
Bar
ren
land
(%)
Can
opy
cove
r (%
)
Cha
nnel
-veg
etat
ion
vove
r (%
)
Cha
nnel
sand
(%)
Cha
nnel
muc
k (%
)
Cranberry Streams Batsto River 4.5 45.1 2.6 29.6 22.0 1 0.38 3.5 4.0 0.5 8.4 47.6 1.7 41.6 0.2 68.7 25.0 11.1 88.9 Hospitality Brook 4.7 46.2 6.5 63.5 22.9 6 0.70 4.6 4.9 8.4 34.3 24.7 6.9 23.0 2.7 9.6 50.5 23.3 76.7 Little Hauken Run 4.6 49.1 4.4 40.6 21.3 8 0.65 4.5 15.6 2.3 25.1 32.9 7.5 31.8 0.3 41.5 7.0 35.6 64.4 Mean 4.6 46.8 4.5 44.6 22.1 5 0.58 4.2 8.2 3.7 22.6 35.1 5.4 32.1 1.1 39.9 27.5 23.3 76.7 SD 0.1 2.1 2.0 17.3 0.8 4 0.17 0.6 6.4 4.1 13.1 11.6 3.2 9.3 1.4 29.6 21.8 12.2 12.2 Median 4.6 46.2 4.4 40.6 22.0 6 0.65 4.5 4.9 2.3 25.1 32.9 6.9 31.8 0.3 41.5 25.0 23.3 76.7 Abandoned-bog Streams Deep Run 4.0 89.6 2.9 36.8 27.0 - 0.41 2.5 4.6 0.2 0.0 15.9 4.2 79.7 0.0 0.0 16.8 0.0 100.0 N. Br. Mt. Misery Brook 4.6 31.3 4.8 44.5 16.0 3 0.35 4.8 29.4 3.3 0.1 86.1 1.4 9.2 0.0 38.9 34.6 16.7 83.3 Shane Branch 4.2 39.4 4.7 57.6 27.2 1 0.18 2.6 4.6 0.4 0.0 50.8 0.0 48.8 0.0 34.9 15.6 45.0 55.0 Tulpehocken Creek 4.9 23.9 7.6 71.7 21.4 7 0.49 5.3 56.6 0.2 0.1 61.3 1.0 37.4 0.0 17.4 15.2 80.0 20.0 Mean 4.4 46.0 5.0 52.6 22.9 4 0.36 3.8 23.8 1.0 0.0 53.5 1.7 43.8 0.0 22.8 20.6 35.4 64.6 SD 0.4 29.7 1.9 15.3 5.3 3 0.13 1.4 24.8 1.5 0.0 29.1 1.8 29.2 0.0 17.8 9.4 35.0 35.0 Median 4.4 35.4 4.7 51.1 24.2 3 0.38 3.7 17.0 0.3 0.0 56.0 1.2 43.1 0.0 26.2 16.2 30.8 69.2 Forest Streams E. Br. Bass River 4.4 37.4 6.8 67.7 18.9 9 0.59 4.9 21.1 2.0 0.0 82.7 1.0 14.0 0.2 53.5 8.7 46.7 53.3 Buck Run 4.8 26.5 6.0 63.5 18.9 - 0.43 4.0 7.8 0.0 0.0 86.5 0.2 13.3 0.0 73.5 26.8 26.7 73.3 Papoose Branch 4.7 29.9 7.1 68.6 17.6 5 0.44 4.8 11.4 0.0 0.0 87.5 0.0 12.4 0.1 91.7 7.5 40.0 60.0 Skit Branch 4.7 24.2 5.9 69.4 23.3 4 0.48 6.0 13.0 0.3 0.0 80.3 0.0 19.4 0.0 35.7 29.1 6.7 93.3 Mean 4.6 29.5 6.5 67.3 19.7 6 0.48 4.9 13.3 0.6 0.0 84.3 0.3 14.8 0.1 63.6 18.0 30.0 70.0 SD 0.2 5.8 0.6 2.6 2.5 3 0.07 0.8 5.6 1.0 0.0 3.3 0.5 3.1 0.1 24.3 11.5 17.6 17.6 Median 4.7 28.2 6.4 68.2 18.9 5 0.46 4.8 12.2 0.2 0.0 84.6 0.1 13.7 0.0 63.5 17.7 33.3 66.7
126
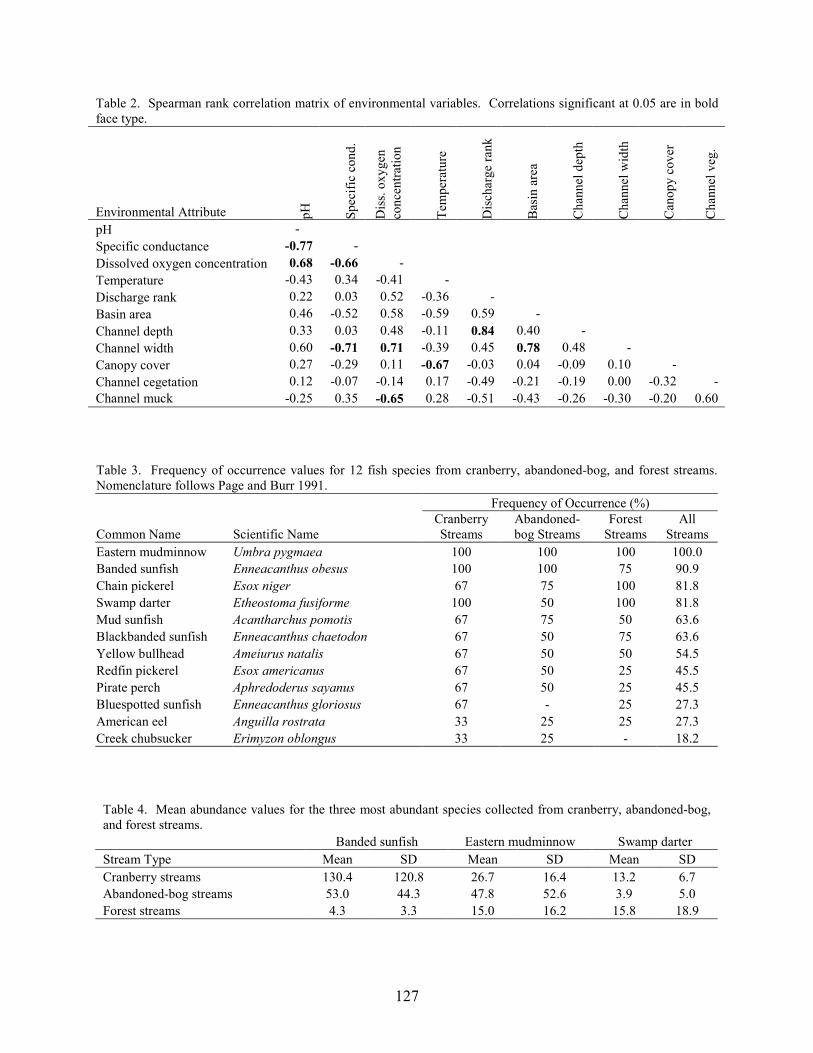
127
Table 2. Spearman rank correlation matrix of environmental variables. Correlations significant at 0.05 are in bold face type.
Environmental Attribute pH
Spec
ific
cond
.
Dis
s. ox
ygen
co
ncen
tratio
n
Tem
pera
ture
Dis
char
ge ra
nk
Bas
in a
rea
Cha
nnel
dep
th
Cha
nnel
wid
th
Can
opy
cove
r
Cha
nnel
veg
.
pH - Specific conductance -0.77 - Dissolved oxygen concentration 0.68 -0.66 - Temperature -0.43 0.34 -0.41 - Discharge rank 0.22 0.03 0.52 -0.36 - Basin area 0.46 -0.52 0.58 -0.59 0.59 - Channel depth 0.33 0.03 0.48 -0.11 0.84 0.40 - Channel width 0.60 -0.71 0.71 -0.39 0.45 0.78 0.48 - Canopy cover 0.27 -0.29 0.11 -0.67 -0.03 0.04 -0.09 0.10 - Channel cegetation 0.12 -0.07 -0.14 0.17 -0.49 -0.21 -0.19 0.00 -0.32 -Channel muck -0.25 0.35 -0.65 0.28 -0.51 -0.43 -0.26 -0.30 -0.20 0.60 Table 3. Frequency of occurrence values for 12 fish species from cranberry, abandoned-bog, and forest streams. Nomenclature follows Page and Burr 1991. Frequency of Occurrence (%)
Common Name Scientific Name Cranberry Streams
Abandoned- bog Streams
Forest Streams
All Streams
Eastern mudminnow Umbra pygmaea 100 100 100 100.0 Banded sunfish Enneacanthus obesus 100 100 75 90.9 Chain pickerel Esox niger 67 75 100 81.8 Swamp darter Etheostoma fusiforme 100 50 100 81.8 Mud sunfish Acantharchus pomotis 67 75 50 63.6 Blackbanded sunfish Enneacanthus chaetodon 67 50 75 63.6 Yellow bullhead Ameiurus natalis 67 50 50 54.5 Redfin pickerel Esox americanus 67 50 25 45.5 Pirate perch Aphredoderus sayanus 67 50 25 45.5 Bluespotted sunfish Enneacanthus gloriosus 67 - 25 27.3 American eel Anguilla rostrata 33 25 25 27.3 Creek chubsucker Erimyzon oblongus 33 25 - 18.2
Table 4. Mean abundance values for the three most abundant species collected from cranberry, abandoned-bog, and forest streams. Banded sunfish Eastern mudminnow Swamp darter Stream Type Mean SD Mean SD Mean SD Cranberry streams 130.4 120.8 26.7 16.4 13.2 6.7 Abandoned-bog streams 53.0 44.3 47.8 52.6 3.9 5.0 Forest streams 4.3 3.3 15.0 16.2 15.8 18.9
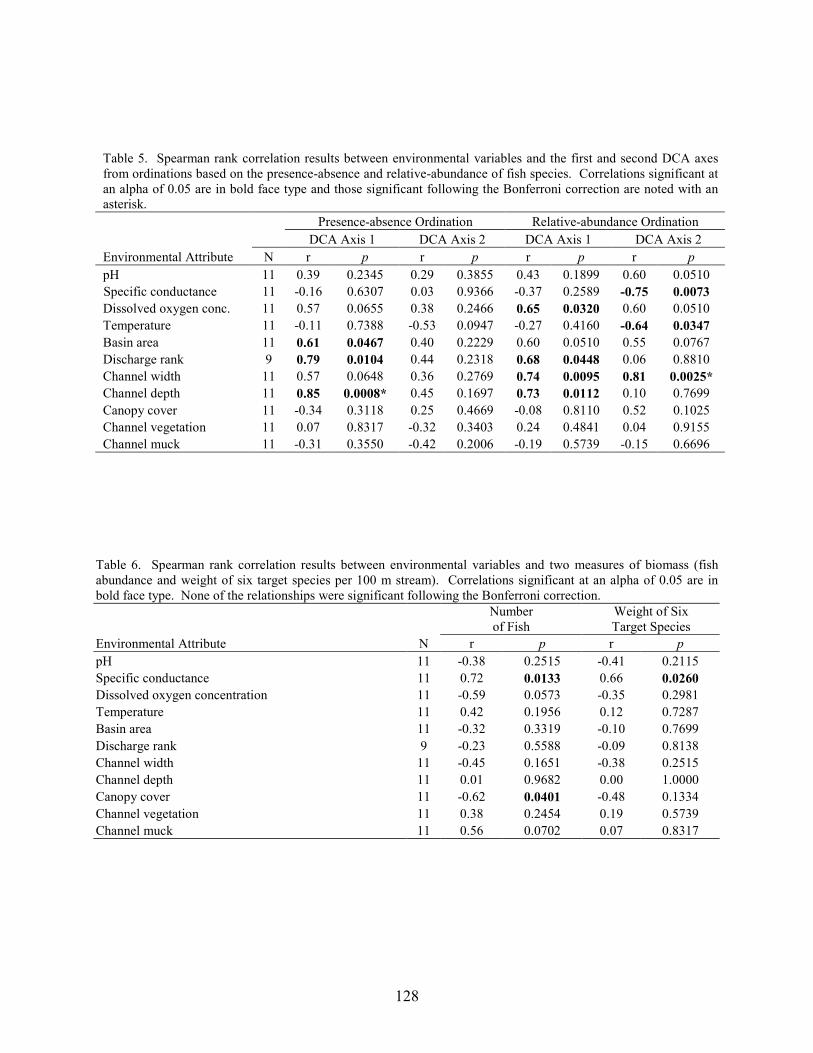
128
Table 5. Spearman rank correlation results between environmental variables and the first and second DCA axes from ordinations based on the presence-absence and relative-abundance of fish species. Correlations significant at an alpha of 0.05 are in bold face type and those significant following the Bonferroni correction are noted with an asterisk. Presence-absence Ordination Relative-abundance Ordination DCA Axis 1 DCA Axis 2 DCA Axis 1 DCA Axis 2 Environmental Attribute N r p r p r p r p pH 11 0.39 0.2345 0.29 0.3855 0.43 0.1899 0.60 0.0510 Specific conductance 11 -0.16 0.6307 0.03 0.9366 -0.37 0.2589 -0.75 0.0073 Dissolved oxygen conc. 11 0.57 0.0655 0.38 0.2466 0.65 0.0320 0.60 0.0510 Temperature 11 -0.11 0.7388 -0.53 0.0947 -0.27 0.4160 -0.64 0.0347 Basin area 11 0.61 0.0467 0.40 0.2229 0.60 0.0510 0.55 0.0767 Discharge rank 9 0.79 0.0104 0.44 0.2318 0.68 0.0448 0.06 0.8810 Channel width 11 0.57 0.0648 0.36 0.2769 0.74 0.0095 0.81 0.0025* Channel depth 11 0.85 0.0008* 0.45 0.1697 0.73 0.0112 0.10 0.7699 Canopy cover 11 -0.34 0.3118 0.25 0.4669 -0.08 0.8110 0.52 0.1025 Channel vegetation 11 0.07 0.8317 -0.32 0.3403 0.24 0.4841 0.04 0.9155 Channel muck 11 -0.31 0.3550 -0.42 0.2006 -0.19 0.5739 -0.15 0.6696
Table 6. Spearman rank correlation results between environmental variables and two measures of biomass (fish abundance and weight of six target species per 100 m stream). Correlations significant at an alpha of 0.05 are in bold face type. None of the relationships were significant following the Bonferroni correction.
Number of Fish
Weight of Six Target Species
Environmental Attribute N r p r p pH 11 -0.38 0.2515 -0.41 0.2115 Specific conductance 11 0.72 0.0133 0.66 0.0260 Dissolved oxygen concentration 11 -0.59 0.0573 -0.35 0.2981 Temperature 11 0.42 0.1956 0.12 0.7287 Basin area 11 -0.32 0.3319 -0.10 0.7699 Discharge rank 9 -0.23 0.5588 -0.09 0.8138 Channel width 11 -0.45 0.1651 -0.38 0.2515 Channel depth 11 0.01 0.9682 0.00 1.0000 Canopy cover 11 -0.62 0.0401 -0.48 0.1334 Channel vegetation 11 0.38 0.2454 0.19 0.5739 Channel muck 11 0.56 0.0702 0.07 0.8317
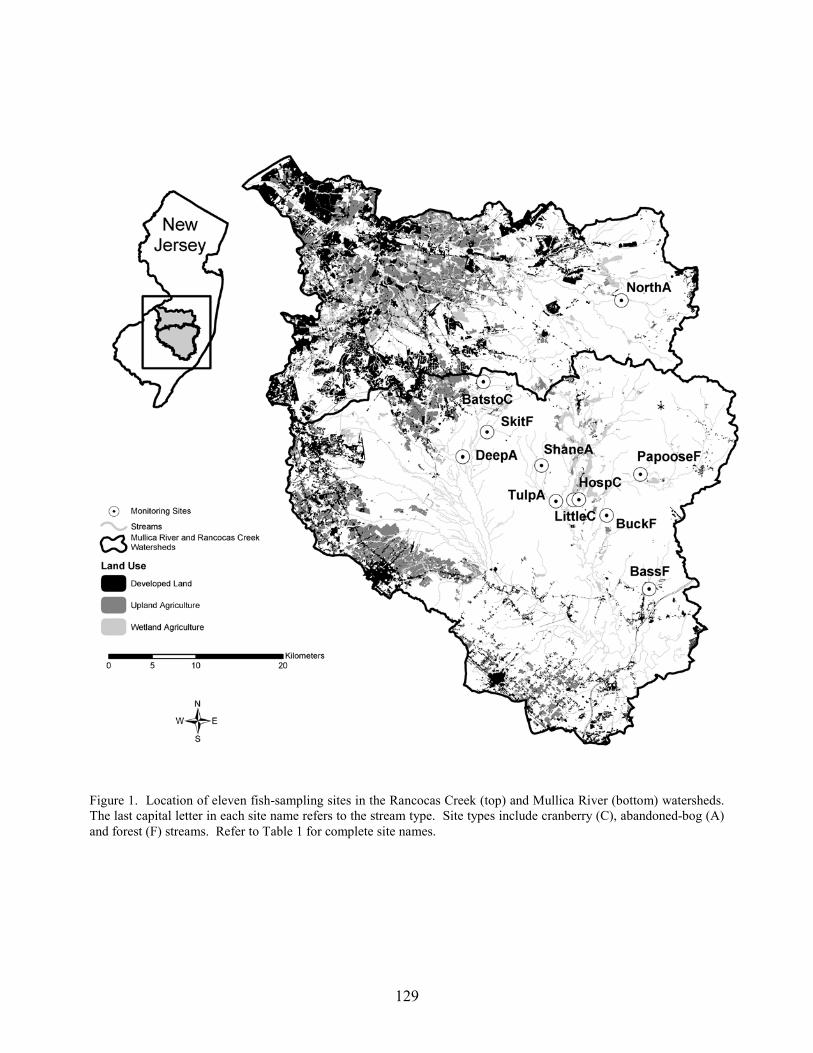
129
Figure 1. Location of eleven fish-sampling sites in the Rancocas Creek (top) and Mullica River (bottom) watersheds.The last capital letter in each site name refers to the stream type. Site types include cranberry (C), abandoned-bog (A)and forest (F) streams. Refer to Table 1 for complete site names.
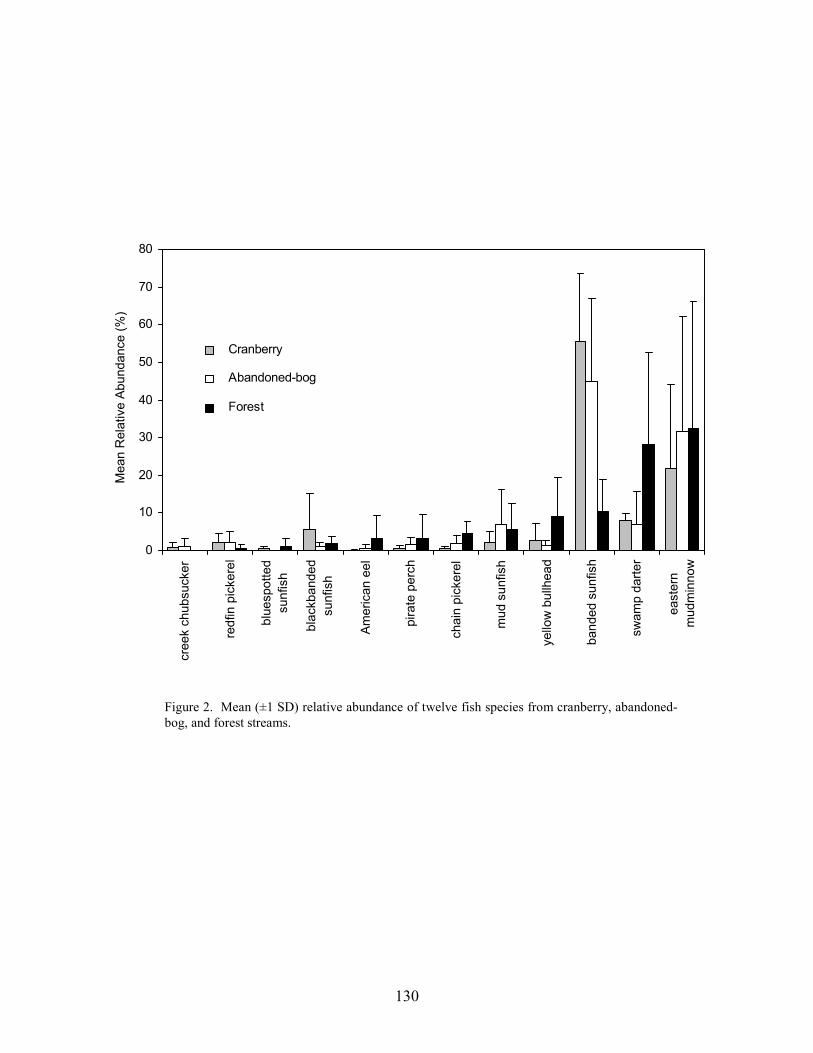
130
Figure 2. Mean (±1 SD) relative abundance of twelve fish species from cranberry, abandoned-bog, and forest streams.
0
10
20
30
40
50
60
70
80
cree
k ch
ubsu
cker
redf
in p
icke
rel
blue
spot
ted
sunf
ish
blac
kban
ded
sunf
ish
Amer
ican
eel
pira
te p
erch
chai
n pi
cker
el
mud
sun
fish
yello
w b
ullh
ead
band
ed s
unfis
h
swam
p da
rter
east
ern
mud
min
now
Mea
n R
elat
ive
Abun
danc
e (%
)
Cranberry
Abandoned-bog
Forest
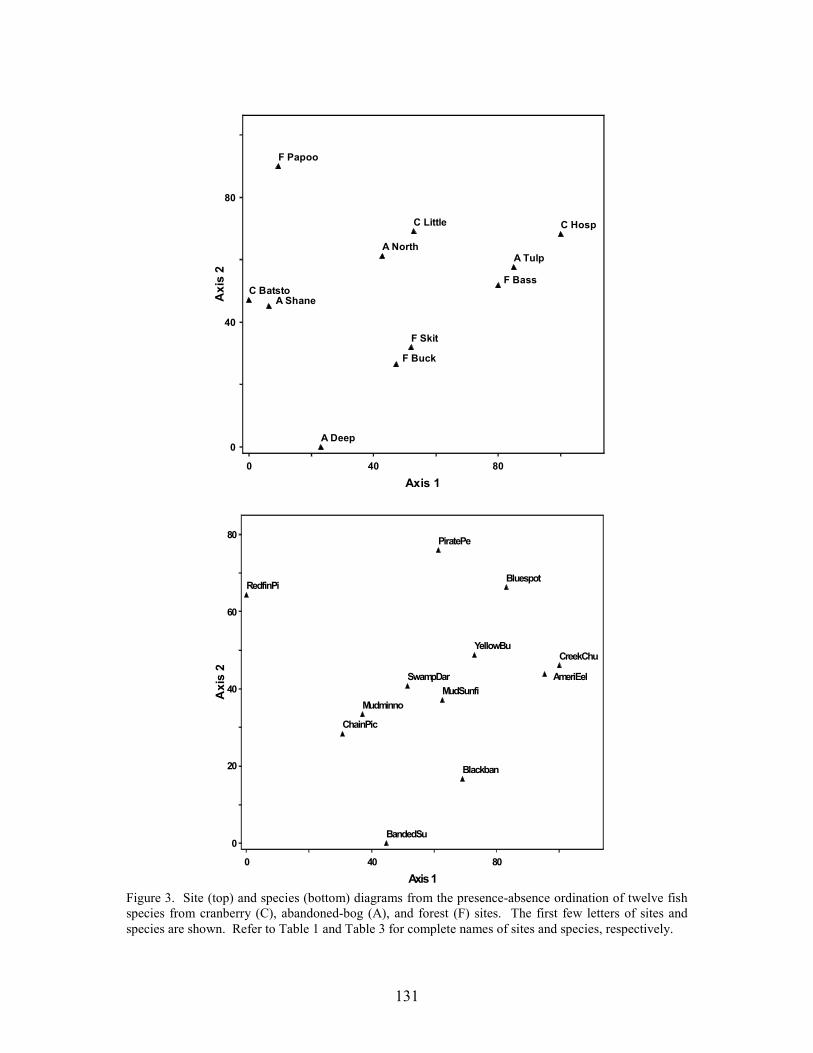
131
A Deep
A North
A Shane
A Tulp
C Batsto
C HospC Little
F Bass
F Buck
F Papoo
F Skit
0
0
40 80
40
80
Axis 1
Axi
s 2
Figure 3. Site (top) and species (bottom) diagrams from the presence-absence ordination of twelve fishspecies from cranberry (C), abandoned-bog (A), and forest (F) sites. The first few letters of sites andspecies are shown. Refer to Table 1 and Table 3 for complete names of sites and species, respectively.
MudSunfi
YellowBu
AmeriEel
PiratePe
Blackban
Bluespot
BandedSu
CreekChu
RedfinPi
ChainPic
SwampDar
Mudminno
0
0
40 80
20
40
60
80
Axis 1
Axi
s 2
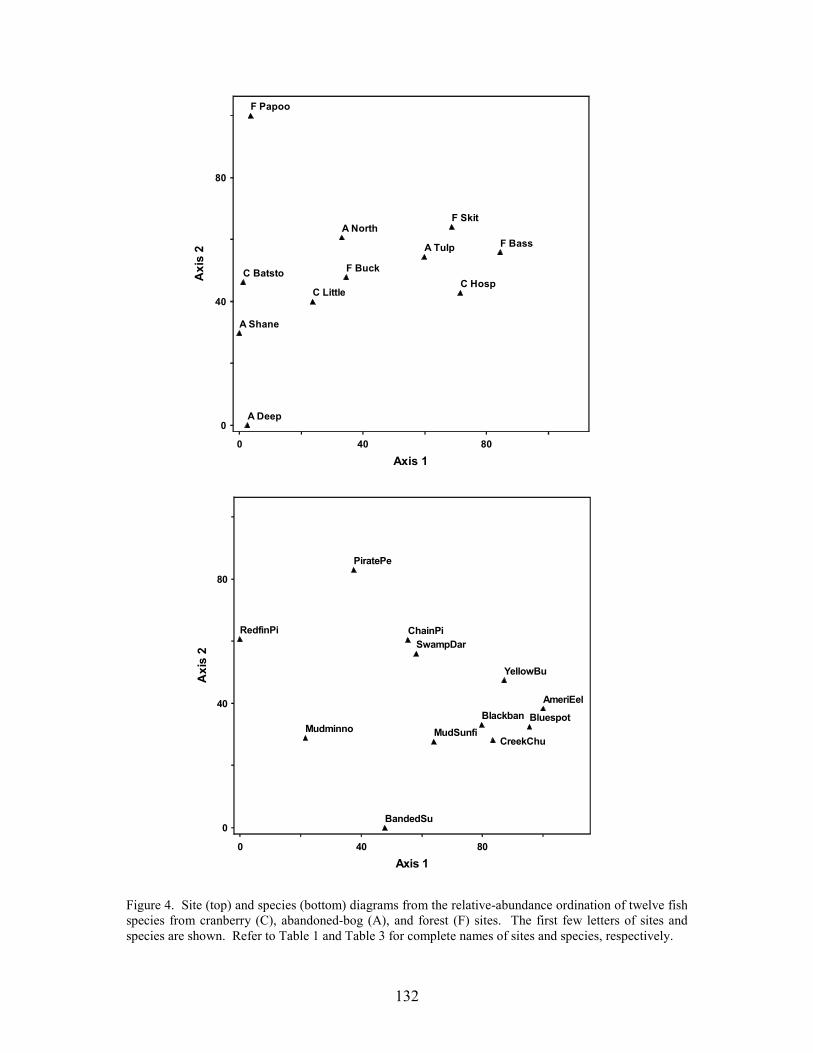
132
A Deep
A North
A Shane
A Tulp
C BatstoC Hosp
C Little
F Bass
F Buck
F Papoo
F Skit
0
0
40 80
40
80
Axis 1
Axi
s 2
MudSunfi
YellowBu
AmeriEel
PiratePe
Blackban Bluespot
BandedSu
CreekChu
RedfinPi ChainPiSwampDar
Mudminno
0
0
40 80
40
80
Axis 1
Axi
s 2
Figure 4. Site (top) and species (bottom) diagrams from the relative-abundance ordination of twelve fishspecies from cranberry (C), abandoned-bog (A), and forest (F) sites. The first few letters of sites andspecies are shown. Refer to Table 1 and Table 3 for complete names of sites and species, respectively.
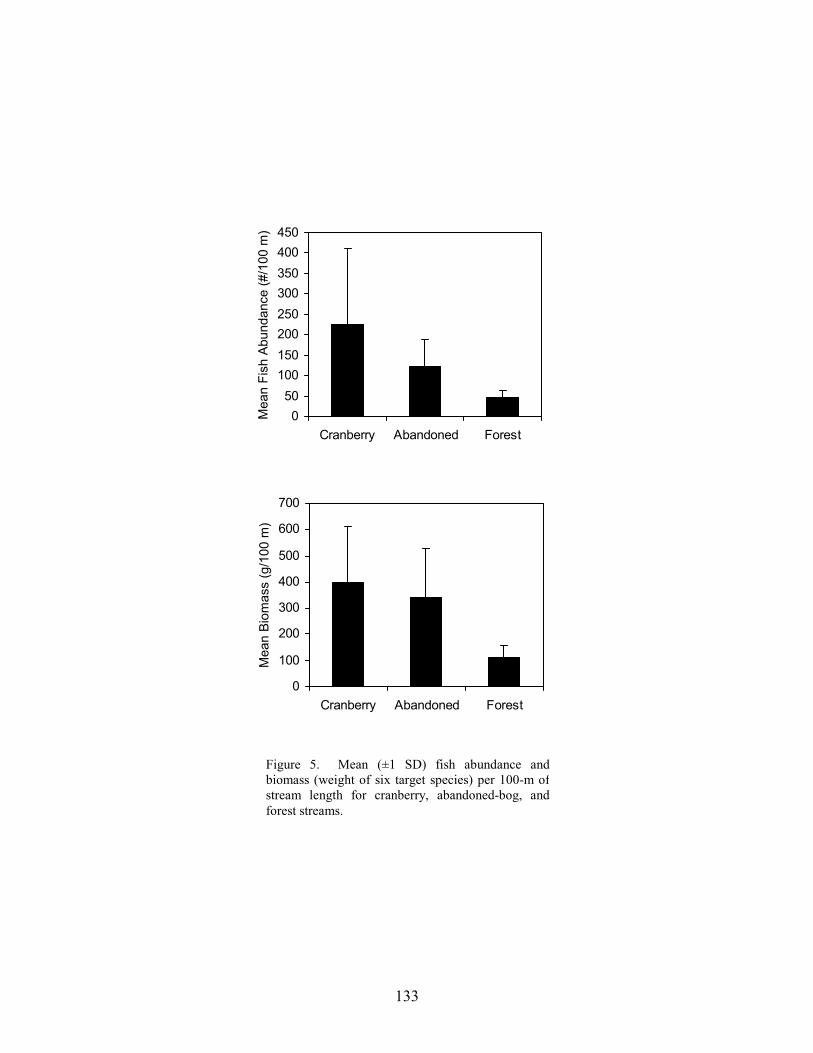
133
Figure 5. Mean (±1 SD) fish abundance and biomass (weight of six target species) per 100-m of stream length for cranberry, abandoned-bog, and forest streams.
050
100150200250300350400450
Cranberry Abandoned Forest
Mea
n Fi
sh A
bund
ance
(#/1
00 m
)
0
100
200
300
400
500
600
700
Cranberry Abandoned Forest
Mea
n Bi
omas
s (g
/100
m)
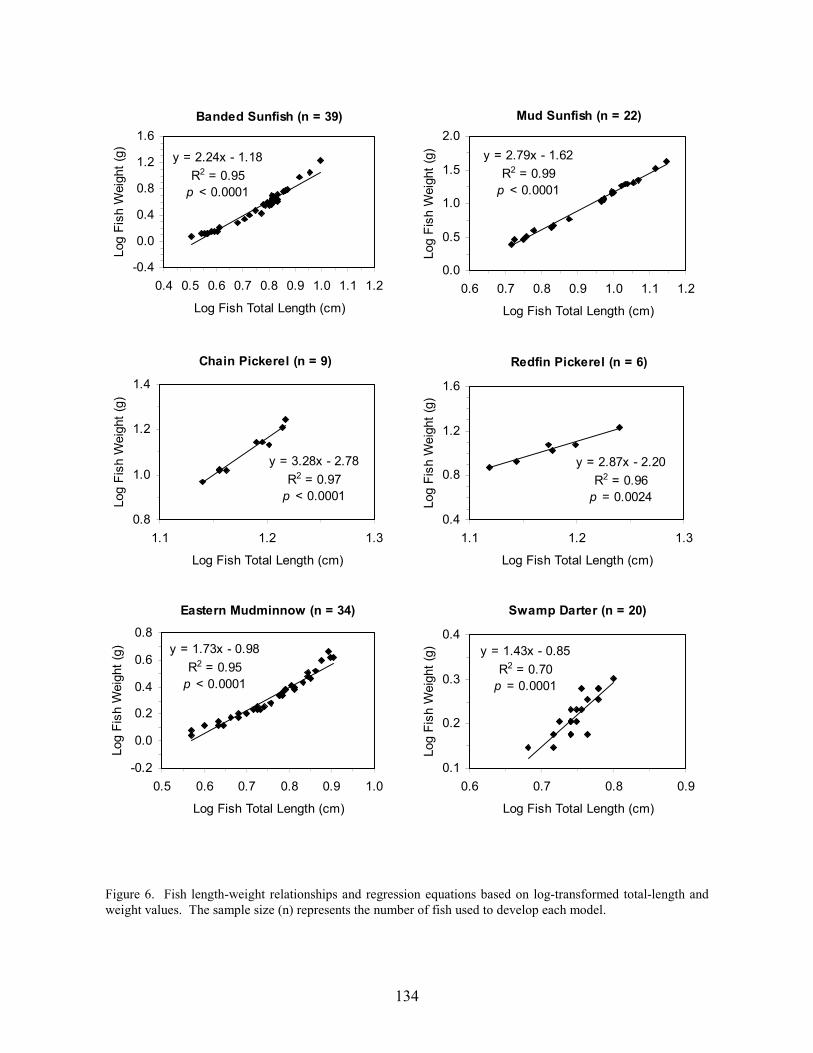
134
Figure 6. Fish length-weight relationships and regression equations based on log-transformed total-length and weight values. The sample size (n) represents the number of fish used to develop each model.
Banded Sunfish (n = 39)
y = 2.24x - 1.18R2 = 0.95p < 0.0001
-0.4
0.0
0.4
0.8
1.2
1.6
0.4 0.5 0.6 0.7 0.8 0.9 1.0 1.1 1.2
Log Fish Total Length (cm)
Log
Fish
Wei
ght (
g)
Chain Pickerel (n = 9)
y = 3.28x - 2.78R2 = 0.97p < 0.0001
0.8
1.0
1.2
1.4
1.1 1.2 1.3
Log Fish Total Length (cm)
Log
Fish
Wei
ght (
g)
Eastern Mudminnow (n = 34)
y = 1.73x - 0.98R2 = 0.95p < 0.0001
-0.2
0.0
0.2
0.4
0.6
0.8
0.5 0.6 0.7 0.8 0.9 1.0
Log Fish Total Length (cm)
Log
Fish
Wei
ght (
g)Mud Sunfish (n = 22)
y = 2.79x - 1.62R2 = 0.99p < 0.0001
0.0
0.5
1.0
1.5
2.0
0.6 0.7 0.8 0.9 1.0 1.1 1.2
Log Fish Total Length (cm)
Log
Fish
Wei
ght (
g)
Redfin Pickerel (n = 6)
y = 2.87x - 2.20R2 = 0.96p = 0.0024
0.4
0.8
1.2
1.6
1.1 1.2 1.3
Log Fish Total Length (cm)
Log
Fish
Wei
ght (
g)
Swamp Darter (n = 20)
y = 1.43x - 0.85R2 = 0.70p = 0.0001
0.1
0.2
0.3
0.4
0.6 0.7 0.8 0.9
Log Fish Total Length (cm)
Log
Fish
Wei
ght (
g)
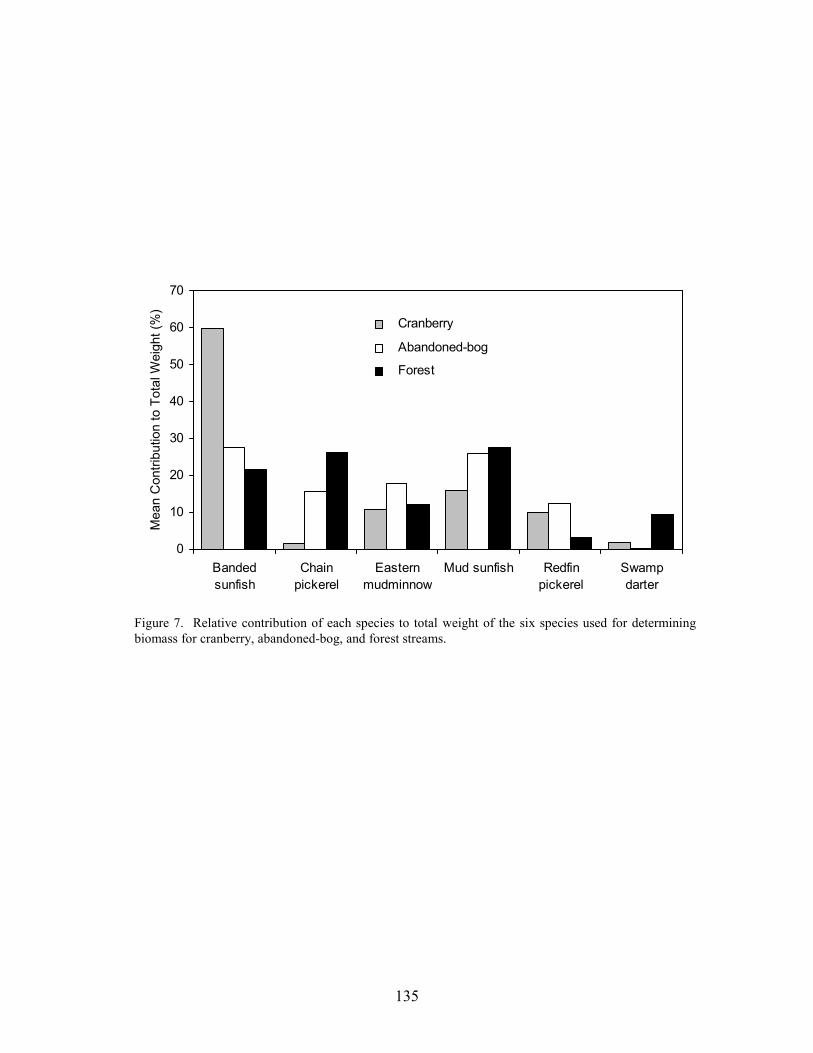
135
Figure 7. Relative contribution of each species to total weight of the six species used for determiningbiomass for cranberry, abandoned-bog, and forest streams.
0
10
20
30
40
50
60
70
Bandedsunfish
Chainpickerel
Easternmudminnow
Mud sunfish Redfinpickerel
Swampdarter
Mea
n C
ontri
butio
n to
Tot
al W
eigh
t (%
)
Cranberry
Abandoned-bog
Forest
Related Documents


