A Comparison of System Dynamics and Agent-Based Simulation Applied to the Study of Cellular Receptor Dynamics Edward J. Gallaher Behavioral Neuroscience, Pharmacology and Physiology Oregon Health & Science University C. Athena Aktipis Department of Psychology University of Pennsylvania Wayne W. Wakeland Systems Science Ph.D. Program Portland State University Louis M. Macovsky Dynamic BioSystems, LLC

A Comparison of System Dynamics and Agent-Based Simulation Applied to the Study of Cellular Receptor Dynamics Edward J. Gallaher Behavioral Neuroscience,
Dec 21, 2015
Welcome message from author
This document is posted to help you gain knowledge. Please leave a comment to let me know what you think about it! Share it to your friends and learn new things together.
Transcript

A Comparison of System Dynamics and Agent-Based Simulation
Applied to the Study of Cellular
Receptor Dynamics
Edward J. GallaherBehavioral Neuroscience,
Pharmacology and Physiology
Oregon Health & Science University
C. Athena AktipisDepartment of Psychology
University of Pennsylvania
Wayne W. WakelandSystems Science Ph.D.
Program
Portland State University
Louis M. MacovskyDynamic BioSystems, LLC

The Questions• Cellular receptor dynamics are analyzed via differential
equations• Thus, system dynamics (SD) is an obvious candidate
methodology• But how well does SD “fit” the needs of a biomedical
researcher? • When might it be useful to model the phenomena at a
biomolecular level?• Will unexpected behavior modes emerge when
concentrations and reaction probabilities are low?• If so, would the use of agent based simulation (ABS)
lead to new insights?

Approach & Findings
• We applied both SD and ABS to the study of non-equilibrium ligand-receptor dynamics– Over a broad range of concentrations
– And, where the probability of interaction is varied from low to very low
• We found that both approaches offer much to the researcher and are complementary
• We did not find a clear demarcation indicating when one paradigm or the other would be strongly preferred

A seemingly trivial starting point
• Receptors are in one of two states, {A} and {B} • Over time, receptors in state {A} shift to state {B}
– e.g. they become “bound”• Similarly, receptors in state {B} shift [back] to state {A}• Simple 1st order dynamics
– The quantity in each state always approaches an equilibrium– The time to reach equilibrium and the final fraction in a each state
depends on the forward and reverse reaction probabilities• This is, of course, easily modeled via SD

Notation & Basic Math
•k1_f_EFF = (1/mol-time) x ligand (mol) = 1/time
•LR_associations/time = R • k1_f_EFF• Assuming constant ligand concentration• Binding decreases as unbound receptor R is depleted.
•The LR complex also dissociates spontaneously• Again following first-order decay kinetics: k1_r = 1/time
•LR_dissociations/time = LR • k1_r
•Bound R = ((Total R) * L) / (KD + L)

SD Flow diagram for generic 2SE model
SD flow diagram for Divalent insulin receptor model (a 3SE model)
insulink1 f
k1 f EFF
k1 r
R R R RX
RR to R RX association
R RX to R R dissociation
RX RX
R RX to RX RX association
RX RX to R RX dissociation
k2 rK2 f EFF
k2 f multiplier
k2 r multiplier

Fraction bound over time with different ligand concentrations (using sensitivity analysis feature)
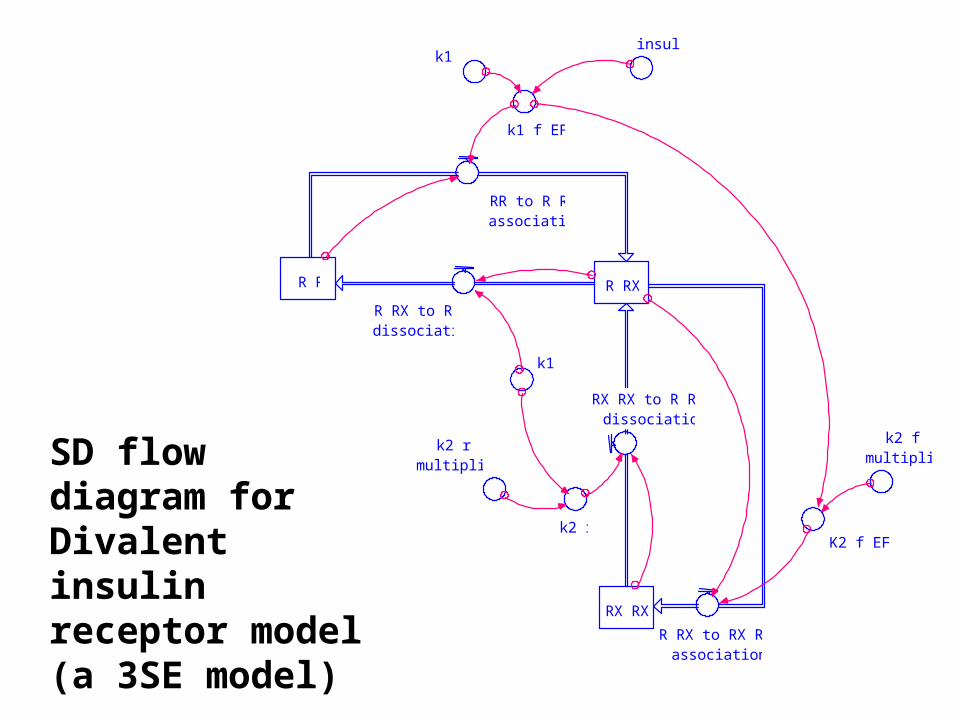
Different Types of Diagrams
• Plotting behavior over time is obviously easy
• But, can the SD model be used to create the types of diagrams used by biomedical researchers?– The log dose response curve?– The Scatchard plot?
• We felt that perhaps we could utilize the automated sensitivity analysis features to do so…

Log dose-response curve
•Smooth sigmoid curve suggests the presence of a single receptor population
•Comparative x-y graphs w/special logic to suppress most of the trace so only the endpoints show

The Scatchard Plot
• The fact that this plot is linear is also indicative of a single receptor
population
• The x-intercept is the concentration of receptor (.1e-9 moles/liter)
• The slope is 1/KD, the half-
maximal binding concentration
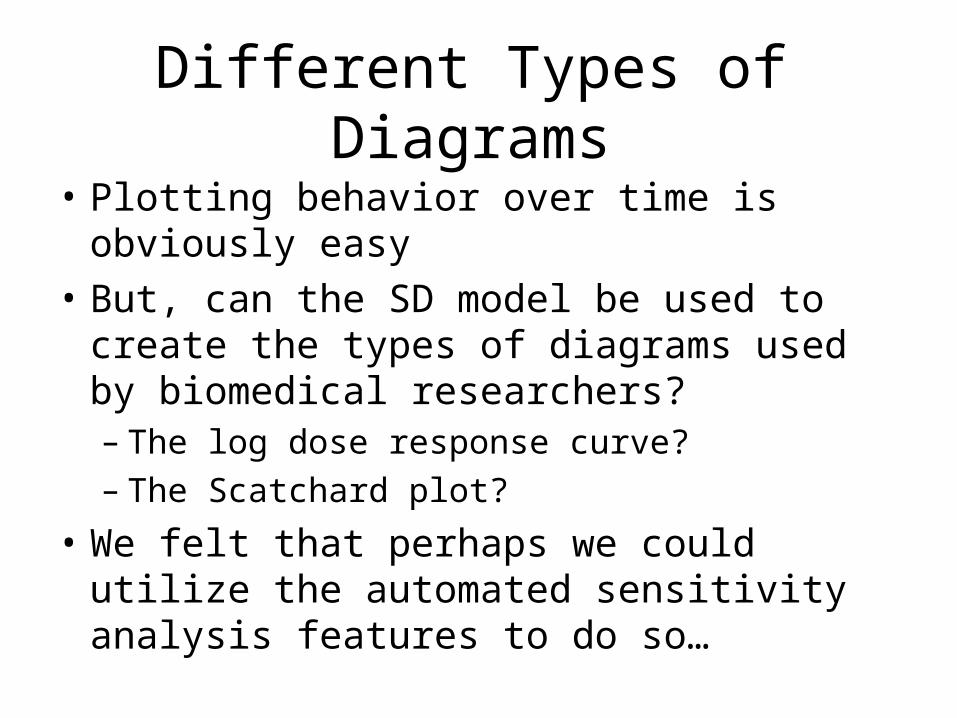
Comments about SD Modeling
• SD model results match the literature
• SD is well suited to analyzing multi-state equilibrium processes
• SD can create the plots and charts used by biomedical researchers
• SD modeling can enhance the researchers’ intuition regarding the underlying biological processes– Through the process of building SD models
– By understanding the structural properties of these models
– By experimenting with widely varying parameter values
• Thus, SD can help to enhance the researchers’ ability to design and interpret laboratory experiments and experimental data
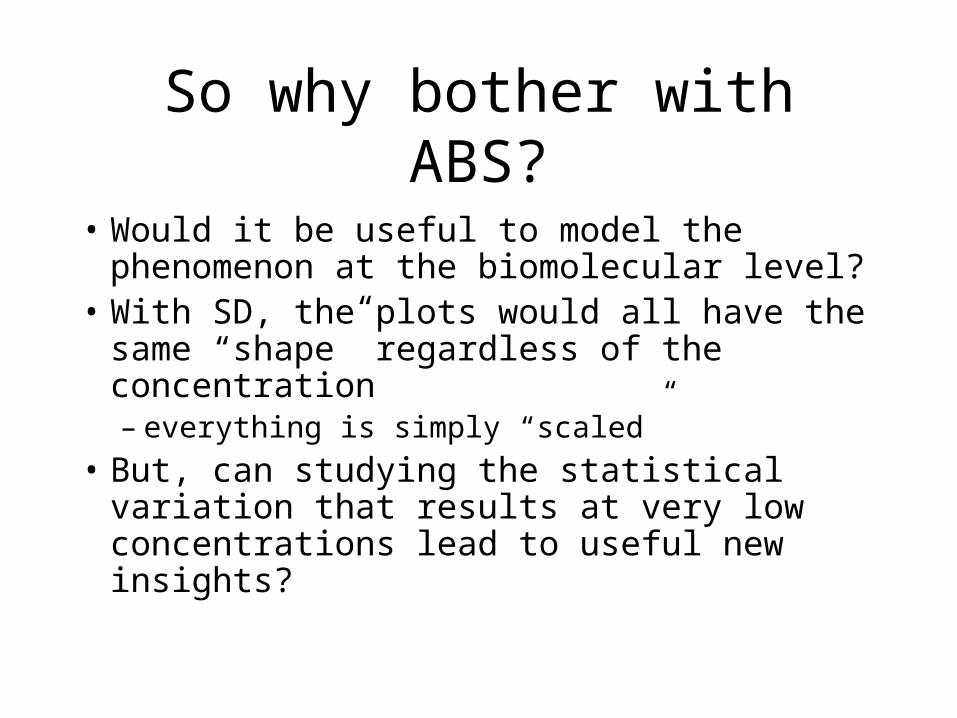
So why bother with ABS?
• Would it be useful to model the phenomenon at the biomolecular level?
• With SD, the plots would all have the same “shape” regardless of the concentration– everything is simply “scaled”
• But, can studying the statistical variation that results at very low concentrations lead to useful new insights?

An ABS Model (using StarLogo in this case)

StarLogo code fragments from the divalent insulin receptor model

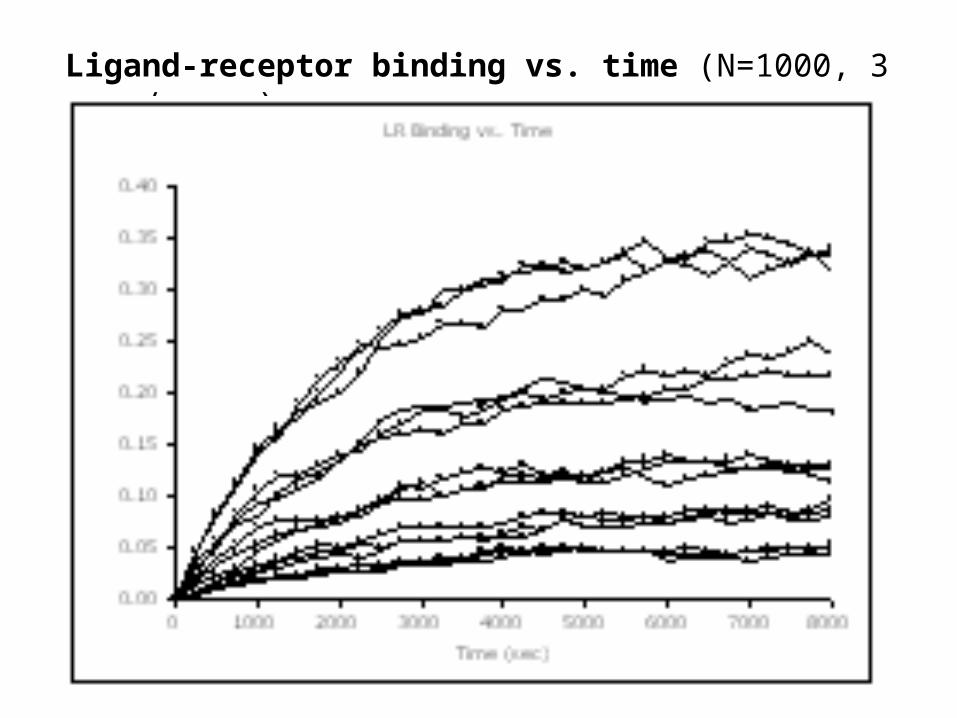
Ligand-receptor binding vs. time (N=1000, 3 runs/conc.)

Lab notes regarding multiple model runs at low concentrations

Receptor Saturation vs. Ligand Concentration
• Shows the expected rectangularhyperbola.
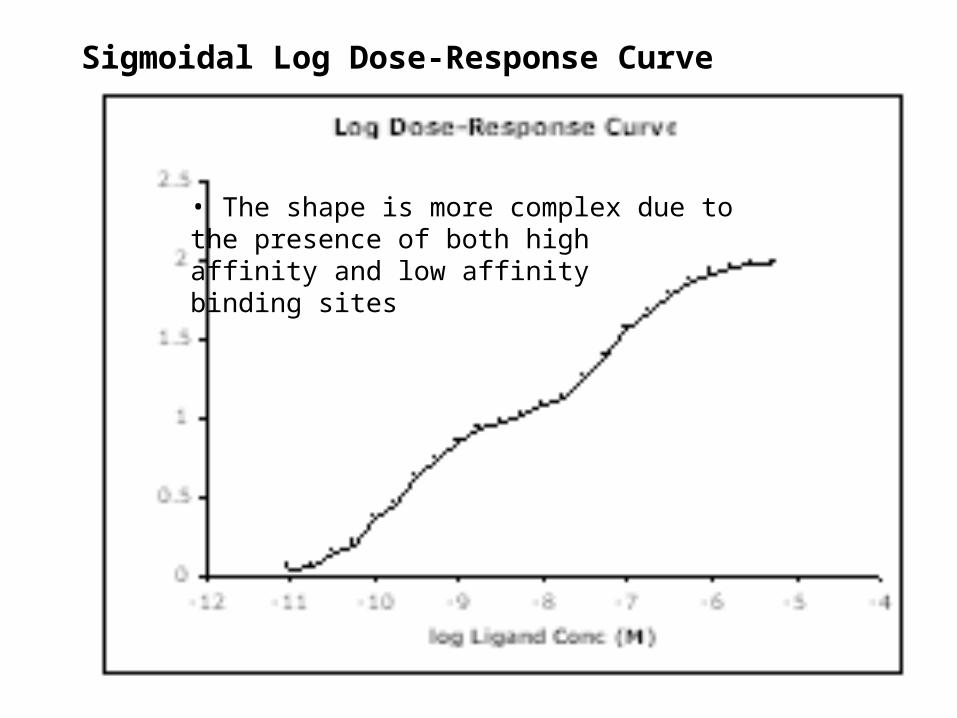
Sigmoidal Log Dose-Response Curve
• The shape is more complex due tothe presence of both highaffinity and low affinitybinding sites

Scatchard plot, divalent insulin receptor
Due to high affinity receptor
Due to low affinityreceptor
This shape could be due toone divalent receptor pop.or two different receptors

Comments about ABS
• Visualization is excellent– Can watch the binding process (if desired)– Can capture the variability at low concentrations
• The “rules” are embedded in computer programs– Less accessible, perhaps, but not entirely– Likely to foster collaboration between modelers and
biomedical researchers
• Starlogo has appreciable limitations– Requires considerable “baby-sitting” when making
multiple, long runs– Would often simply quit running after a number of hours
• “memory leak”?

Overall Comparison of SD and ABS

SD and ABS Comparison (cont.)
Related Documents