A Comparision of Organic and Conventional Apple Juice Sales Lisa Wilmer Economics 308 Final Project Presentation

Welcome message from author
This document is posted to help you gain knowledge. Please leave a comment to let me know what you think about it! Share it to your friends and learn new things together.
Transcript
A Comparision of Organic and Conventional Apple Juice SalesLisa WilmerEconomics 308Final Project Presentation
Why Apple Juice?
Work at WegmansCherry Hill
5 years, 338 days
Nature’s Marketplacesell natural and organic products
Interesting to compare sales of an organic and conventional product
Same brand and sizeSomething common
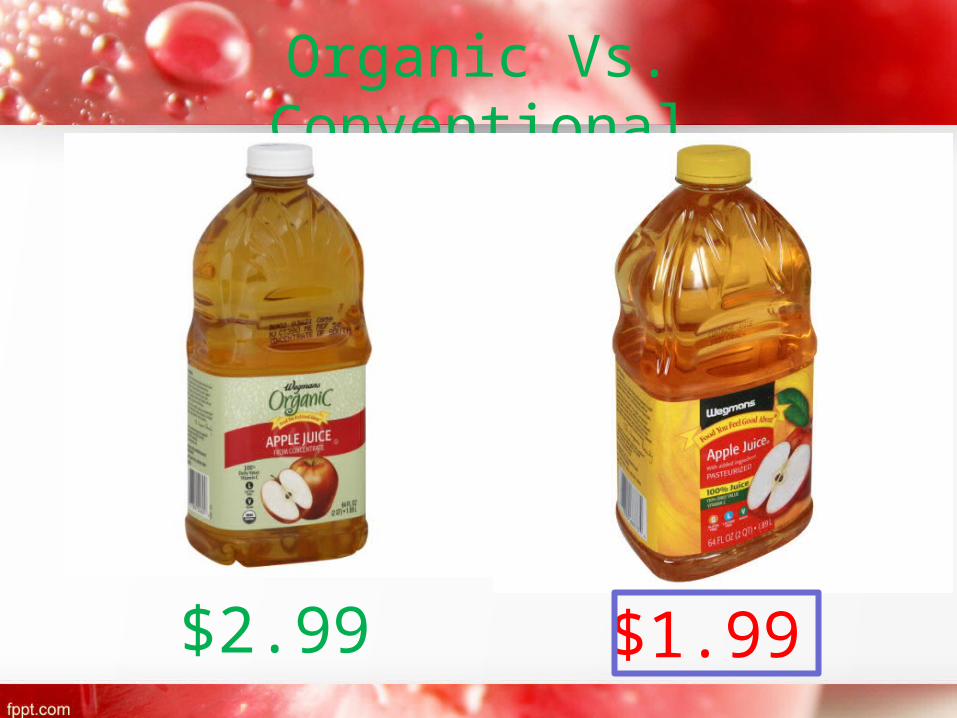
Organic Vs. Conventional
$2.99 $1.99
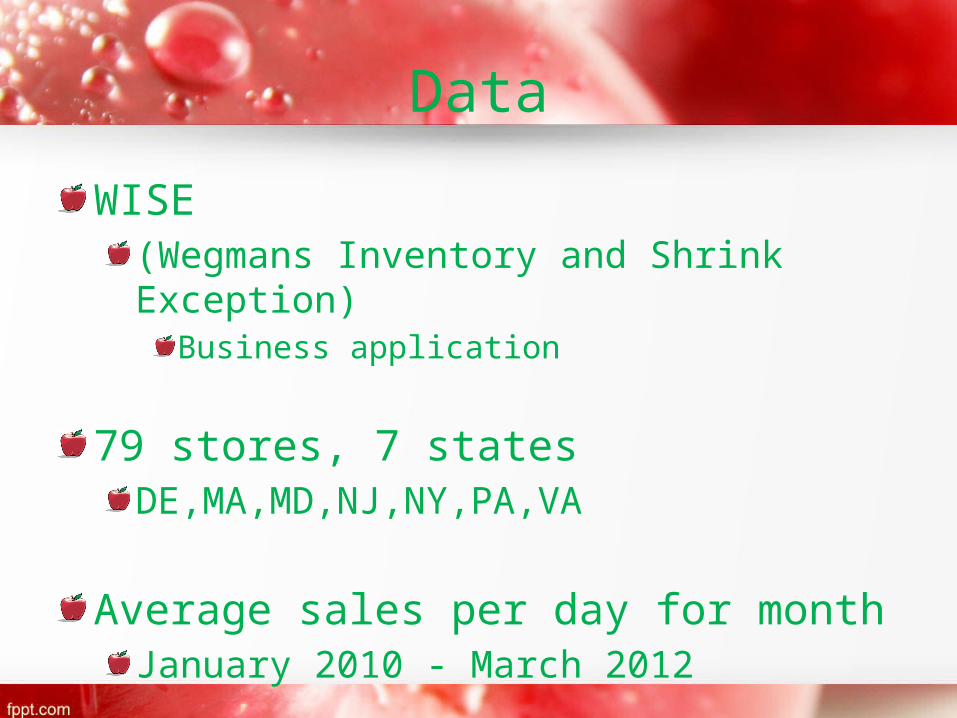
DataWISE(Wegmans Inventory and Shrink Exception)
Business application
79 stores, 7 statesDE,MA,MD,NJ,NY,PA,VA
Average sales per day for monthJanuary 2010 - March 2012
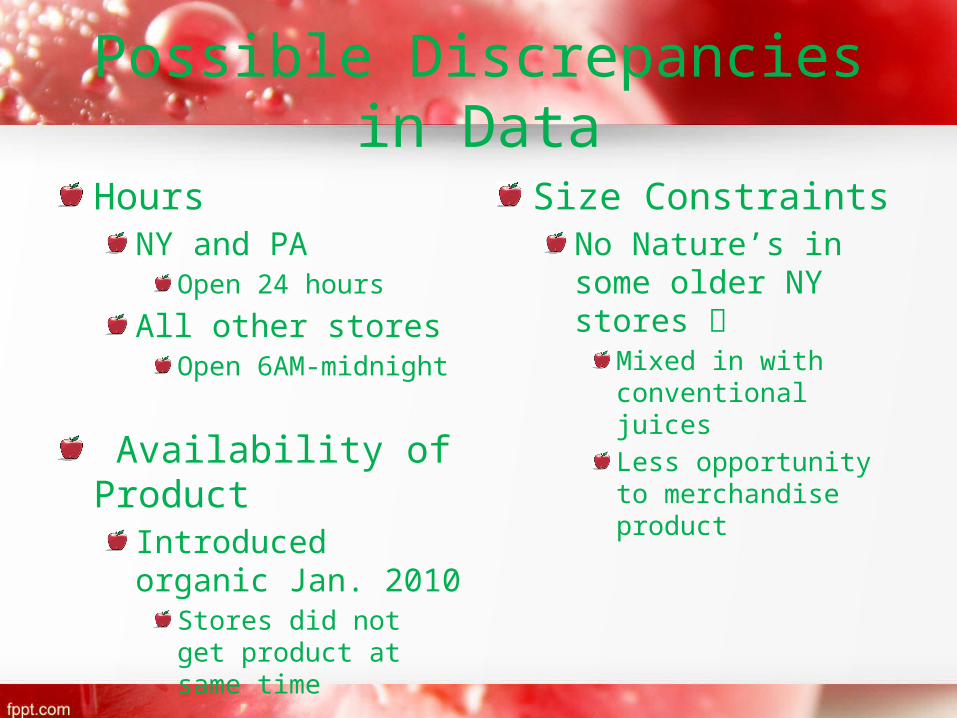
Possible Discrepancies in Data
HoursNY and PA
Open 24 hoursAll other stores
Open 6AM-midnight
Availability of Product
Introduced organic Jan. 2010
Stores did not get product at same time
Size ConstraintsNo Nature’s in some older NY stores
Mixed in with conventional juicesLess opportunity to merchandise product
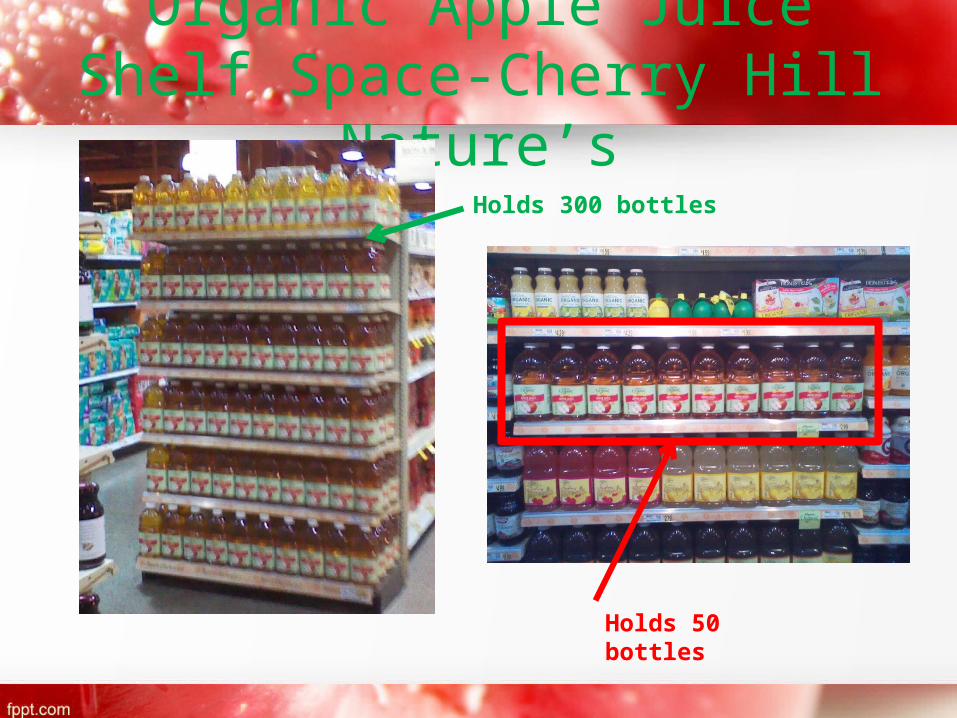
Organic Apple Juice Shelf Space-Cherry Hill
Nature’sHolds 300 bottles
Holds 50 bottles
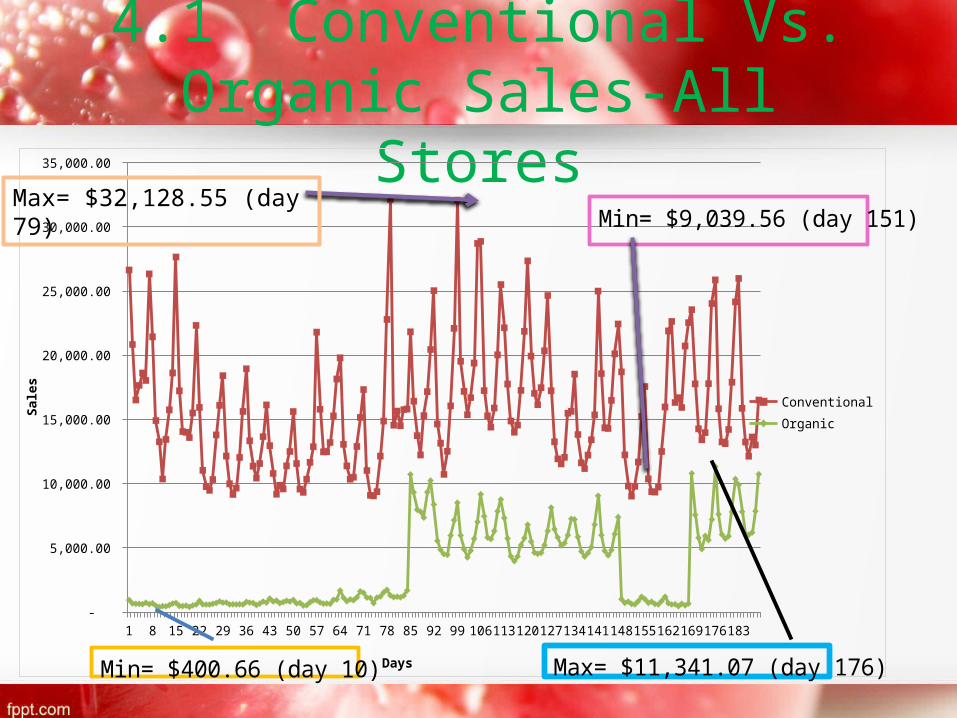
4.1 Conventional Vs. Organic Sales-All
Stores
1 8 15 22 29 36 43 50 57 64 71 78 85 92 99 106113120127134141148155162169176183 -
5,000.00
10,000.00
15,000.00
20,000.00
25,000.00
30,000.00
35,000.00
ConventionalOrganic
Days
Sales
Max= $11,341.07 (day 176)
Min= $9,039.56 (day 151)
Min= $400.66 (day 10)
Max= $32,128.55 (day 79)
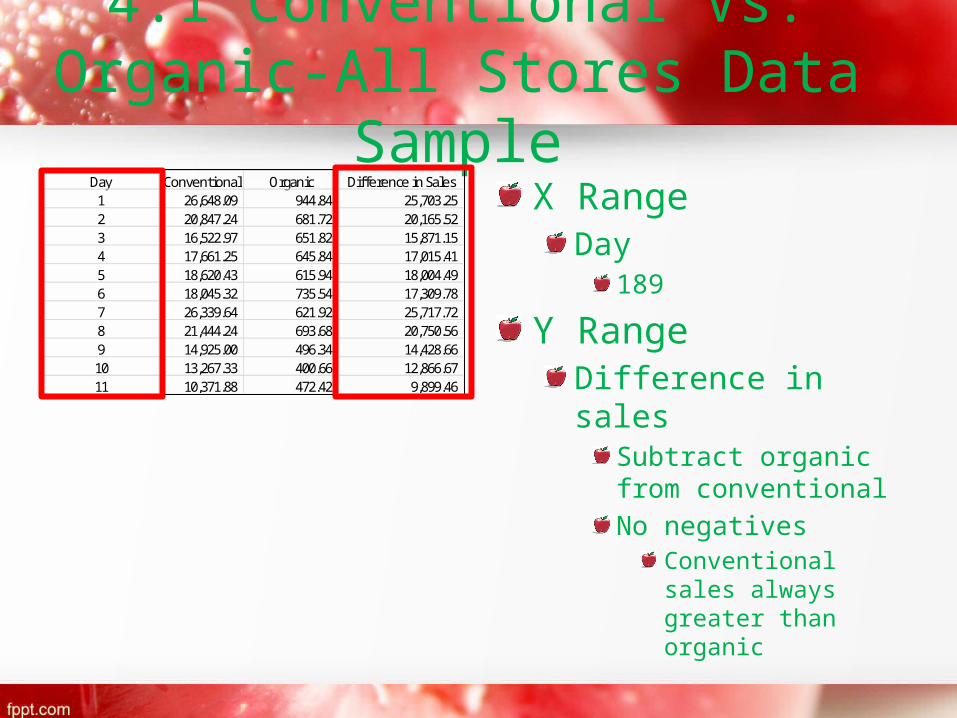
4.1 Conventional Vs. Organic-All Stores Data
SampleX Range
Day189
Y RangeDifference in sales
Subtract organic from conventionalNo negatives
Conventional sales always greater than organic
Day Conventional Organic Difference in Sales1 26,648.09 944.84 25,703.25 2 20,847.24 681.72 20,165.52 3 16,522.97 651.82 15,871.15 4 17,661.25 645.84 17,015.41 5 18,620.43 615.94 18,004.49 6 18,045.32 735.54 17,309.78 7 26,339.64 621.92 25,717.72 8 21,444.24 693.68 20,750.56 9 14,925.00 496.34 14,428.66 10 13,267.33 400.66 12,866.67 11 10,371.88 472.42 9,899.46
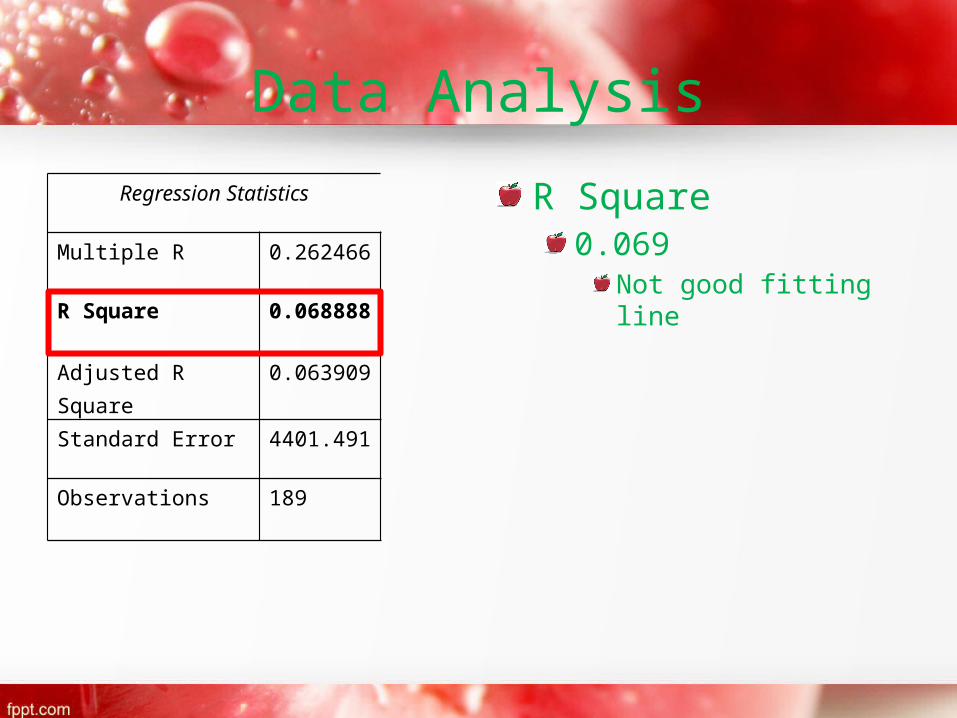
Data AnalysisRegression Statistics
Multiple R 0.262466
R Square 0.068888
Adjusted R Square
0.063909
Standard Error 4401.491
Observations 189
R Square0.069
Not good fitting line
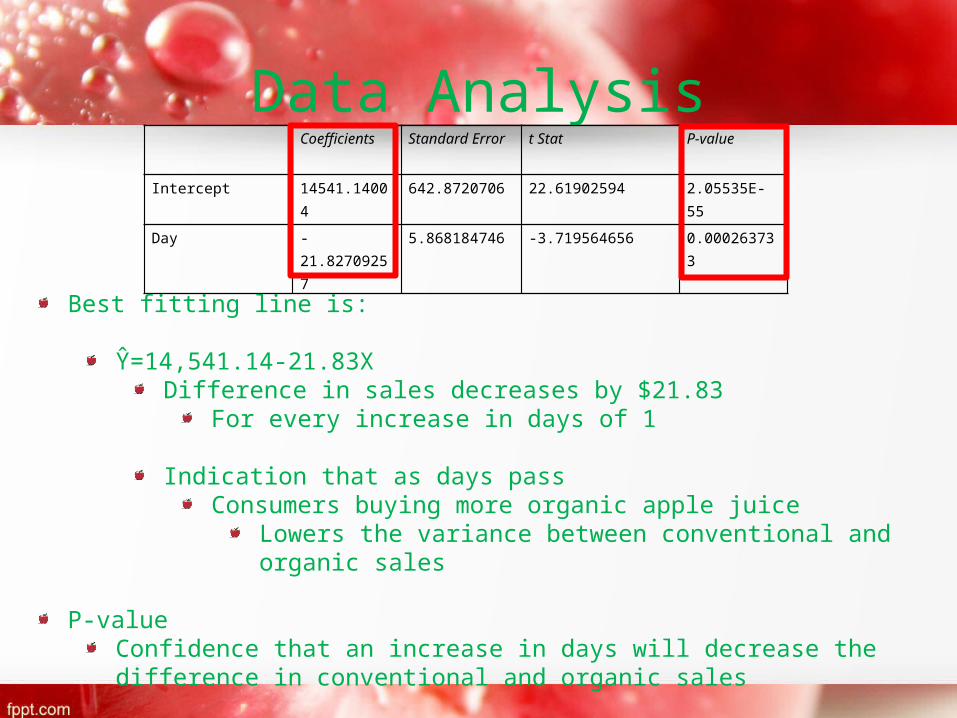
Data Analysis Coefficients Standard Error t Stat P-value
Intercept 14541.14004
642.8720706 22.61902594 2.05535E-55
Day -21.82709257
5.868184746 -3.719564656 0.000263733
Best fitting line is:
Ŷ=14,541.14-21.83XDifference in sales decreases by $21.83
For every increase in days of 1
Indication that as days passConsumers buying more organic apple juice
Lowers the variance between conventional and organic sales
P-valueConfidence that an increase in days will decrease the difference in conventional and organic sales
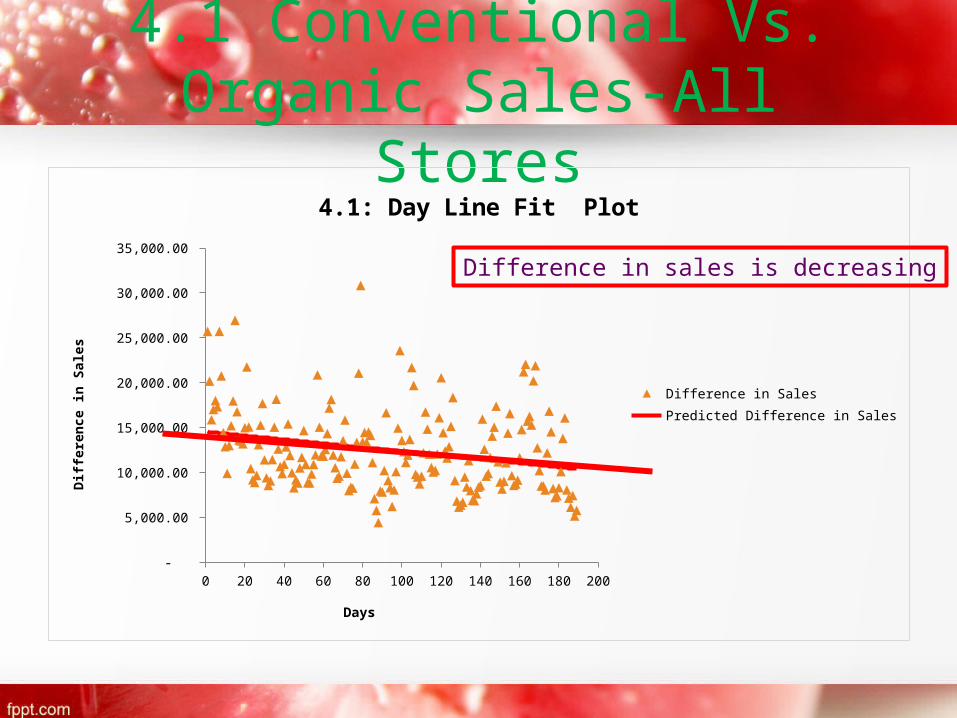
4.1 Conventional Vs. Organic Sales-All
Stores
0 20 40 60 80 100 120 140 160 180 200 -
5,000.00
10,000.00
15,000.00
20,000.00
25,000.00
30,000.00
35,000.00
4.1: Day Line Fit Plot
Difference in SalesPredicted Difference in Sales
Days
Diff
eren
ce in
Sale
s
Difference in sales is decreasing
Other Components of Paper4.2 Sales of Conventional and
Organic Apple Juice for Cherry Hill4.3 Sales of Organic Apple Juice: Cherry Hill Vs. IthacaIthaca leads company in Nature’s sales
$210,000 per week$190,000 per week (Cherry Hill)
4.4 When do People Buy the Most Apple Juice: Beginning, Middle or End of the Week?Weekend has most sales ($94,917.55)
ConclusionOrganic apple juice sales increasing
Might think about a small increase in price
Say, $0.20 -$0.30Least apple juice sales during Middle (Wed. Thurs.) of week
($50,001.77)Maybe run a special on apple juice during slow period
Attract more customers to shop Middle of week
Beginning of week sales (Mon. and Tues.)
($57,040.23)

Celebrating Organics at Wegmans!

The End
Related Documents