A Comparison of Migration Behaviour in Japan and Britain Using Spatial Interaction Models Keiji Yano, 1 Tomoki Nakaya, 1 A. Stewart Fotheringham, 2 * Stan Openshaw 3 and Yoshitaka Ishikawa 4 1 Department of Geography, Ritsumeikan University, Kyoto, Japan 2 Department of Geography, University of Newcastle, Newcastle-upon-Tyne, UK 3 Centre for Computational Geography, University of Leeds, Leeds, UK 4 Department of Geography, Kyoto University, Kyoto, Japan INTRODUCTION T here has been increased interest recently in cross-national comparisons of inter- nal migration (inter alia; Rogers and Willekens, 1986; Cochrane and Vining, 1988; Frey, 1988; Long et al., 1988; Rees et al., 1996; Rees and Kupiszewski, 1999; Bell et al., 2002) although Bell et al. (2002: 436) lament that there is still a ‘dearth of comparative work in the field’. The causes of this dearth are primarily related to the different measurements of migration in different coun- tries. This extends not only to different defini- tions of what constitutes a migrant, but also to different temporal intervals being used to capture a migration movement, different sets of spatial units being used as reporting zones for the origins and destination of migrants, different aggregations of age being reported, and to dif- ferent ways of dealing with sectors of the popu- lation such as students, the institutionalised and the armed forces. To alleviate some of these con- cerns, Long et al. (1988) suggested that distance moved is more desirable for the purposes of international comparisons than traditional measures such as the proportion of population change attributable to migration or the volumes of migration streams themselves. However, migration distances are strongly influenced by the spatial distribution of population within a country, and therefore might not reflect behav- ioural differences in migration. Perhaps a better solution to cross-national measurement prob- lems is to report migration statistics that are relatively independent of measurement issues, such as the estimated elasticities in a model of migration destination choice. 1 INTERNATIONAL JOURNAL OF POPULATION GEOGRAPHY Int. J. Popul. Geogr. 9, 419–431 (2003) Published online in Wiley InterScience (www.interscience.wiley.com). DOI: 10.1002/ijpg.297 Copyright © 2003 John Wiley & Sons, Ltd. ABSTRACT Several recent papers have compared the measurement of migration in different countries, and some have compared migration patterns to the extent that these can be compared cross-nationally. In this paper we measure and comment on differences in the behaviour of migrants in two systems, Japan and Britain. In both countries the focus of attention is on interregional migration. Migration behaviour is measured in terms of elasticities of migration responses to various aspects of destination attractiveness, namely distance from the origin, population size and relative accessibility to other destinations. Origin-specific migration destination choice models are calibrated to obtain this information. The results reveal interesting differences in the factors underlying destination attractiveness in the two countries which have important implications both for the way in which migration is modelled, and for the impacts of migration on the urban systems in both countries. Copyright © 2003 John Wiley & Sons, Ltd. Received 11 December 2002; revised 1 April 2003; accepted 17 April 2003 Keywords: migration; spatial interaction; Japan; Britain; distance-decay; spatial competition; urbanisation; counter-urbanisation * Correspondence to: A. S. Fotheringham, Department of Geography, University of Newcastle, Newcastle-upon-Tyne, UK. E-mail: [email protected]

Welcome message from author
This document is posted to help you gain knowledge. Please leave a comment to let me know what you think about it! Share it to your friends and learn new things together.
Transcript
A Comparison of Migration Behaviour in Japan and Britain Using SpatialInteraction ModelsKeiji Yano,1 Tomoki Nakaya,1 A. Stewart Fotheringham,2* Stan Openshaw3 and Yoshitaka Ishikawa4
1 Department of Geography, Ritsumeikan University, Kyoto, Japan2 Department of Geography, University of Newcastle, Newcastle-upon-Tyne, UK3 Centre for Computational Geography, University of Leeds, Leeds, UK4 Department of Geography, Kyoto University, Kyoto, Japan
INTRODUCTION
There has been increased interest recently in cross-national comparisons of inter-nal migration (inter alia; Rogers and
Willekens, 1986; Cochrane and Vining, 1988; Frey,1988; Long et al., 1988; Rees et al., 1996; Rees andKupiszewski, 1999; Bell et al., 2002) although Bellet al. (2002: 436) lament that there is still a ‘dearthof comparative work in the field’. The causes ofthis dearth are primarily related to the differentmeasurements of migration in different coun-tries. This extends not only to different defini-tions of what constitutes a migrant, but also to different temporal intervals being used tocapture a migration movement, different sets of spatial units being used as reporting zones forthe origins and destination of migrants, differentaggregations of age being reported, and to dif-ferent ways of dealing with sectors of the popu-lation such as students, the institutionalised andthe armed forces. To alleviate some of these con-cerns, Long et al. (1988) suggested that distancemoved is more desirable for the purposes ofinternational comparisons than traditional measures such as the proportion of populationchange attributable to migration or the volumesof migration streams themselves. However,migration distances are strongly influenced bythe spatial distribution of population within acountry, and therefore might not reflect behav-ioural differences in migration. Perhaps a bettersolution to cross-national measurement prob-lems is to report migration statistics that are relatively independent of measurement issues,such as the estimated elasticities in a model ofmigration destination choice.1
INTERNATIONAL JOURNAL OF POPULATION GEOGRAPHYInt. J. Popul. Geogr. 9, 419–431 (2003)Published online in Wiley InterScience (www.interscience.wiley.com). DOI: 10.1002/ijpg.297
Copyright © 2003 John Wiley & Sons, Ltd.
ABSTRACT
Several recent papers have compared themeasurement of migration in differentcountries, and some have compared migrationpatterns to the extent that these can becompared cross-nationally. In this paper wemeasure and comment on differences in thebehaviour of migrants in two systems, Japanand Britain. In both countries the focus ofattention is on interregional migration.Migration behaviour is measured in terms ofelasticities of migration responses to variousaspects of destination attractiveness, namelydistance from the origin, population size andrelative accessibility to other destinations.Origin-specific migration destination choicemodels are calibrated to obtain thisinformation. The results reveal interestingdifferences in the factors underlyingdestination attractiveness in the two countrieswhich have important implications both forthe way in which migration is modelled, andfor the impacts of migration on the urbansystems in both countries. Copyright © 2003John Wiley & Sons, Ltd.
Received 11 December 2002; revised 1 April 2003; accepted 17 April 2003
Keywords: migration; spatial interaction; Japan;Britain; distance-decay; spatial competition;urbanisation; counter-urbanisation
*Correspondence to: A. S. Fotheringham, Department ofGeography, University of Newcastle, Newcastle-upon-Tyne,UK.E-mail: [email protected]
The focus of this paper is therefore not on acomparison of migration trends between coun-tries, but on a comparison of migration behaviour.We capture this behaviour by calibrating modelsof destination choice for migrants in two coun-tries, Japan and Britain, and comparing the elas-ticities derived from these models. Although thederivation of elasticities through the calibrationof various types of migration models is a reason-ably common procedure in the analysis of intra-national migration (inter alia, Stillwell, 1978, 1991;Ishikawa, 1989; Liaw and Otomo, 1991; Pellegriniand Fotheringham, 2002), to our knowledge,cross-national comparisons of this type have notbeen undertaken before. We have selected thesetwo countries because they share many similar-ities. Both are densely populated island countriesof similar size with advanced economies andexcellent transportation systems. Mobility inboth countries is therefore high, and both haveexperienced drifts of population towards themajor economic and urban centres. The urbansystems of both countries are dominated by‘world cities’, Tokyo and London. Finally, migra-tion is captured with a relatively high degree of accuracy in both countries and is reported at similar spatial scales. Research on trends inmigration using these data in both countries have recently been published (Isoda, 1997, 2000;Ishikawa and Fielding, 1998).
MIGRATION DATA
A comparison is made of migration behaviour inJapan and Britain using data from the populationcensuses from both countries for roughly com-parable time periods. In the case of Japan, migra-tion data were obtained from the 1990 Census ofJapan (the 1990 Population Census of Japan, Volume7, Results of Tabulations on Internal Migration)which is available from the Japan Statistical Association (Nihon Tokei Kyokai) on specialorder (Yano et al., 2000). This provides data on allthe inter-municipal migration flows in thecountry between each pair of 3327 local munici-palities (shi (city), ku (ward), machi (town) andmura (village)). The information is obtained onthe Japanese Census form from reported differ-ences in residence over a five-year period from 1October 1985 to 1 October 1990. The data can bedisaggregated into flows of sex-specific popula-tion older than five years or more, and into flows
of sex-specific employed persons aged 15 yearsor more.
In the case of Britain, origin–destination flowmatrices of migrants between 10,528 wards canbe obtained using the migration flow data in theSpecial Migration Statistics (SMS) from the 1991UK Census of Population. The SMS data-set pro-vides information on the residence of migrantson 21 April 1991 and one year previous to this for each census ward (Champion et al., 1998).
The longer time interval over which Japanesemigration is recorded (five years as opposed toone year in Britain) implies that migration dis-tances, ceteris paribus, will probably be longer inthe Japanese statistics because of the increasedpossibility of multiple moves (Long et al., 1988;Bell et al., 2002), but the difference in time inter-vals is unlikely to affect the behavioural para-meters estimated here in any substantial way.Firstly, the incidence of multiple moves awayfrom the original origin is quite likely to be relatively low, especially given the housing con-straints in Japan. Secondly, the rate of distance-decay, which is measured here, is less likely to beaffected by multiple moves than is the calculationof migration distances, assuming that suchmoves occur with approximately equal probabil-ity at all distance ranges from an origin.
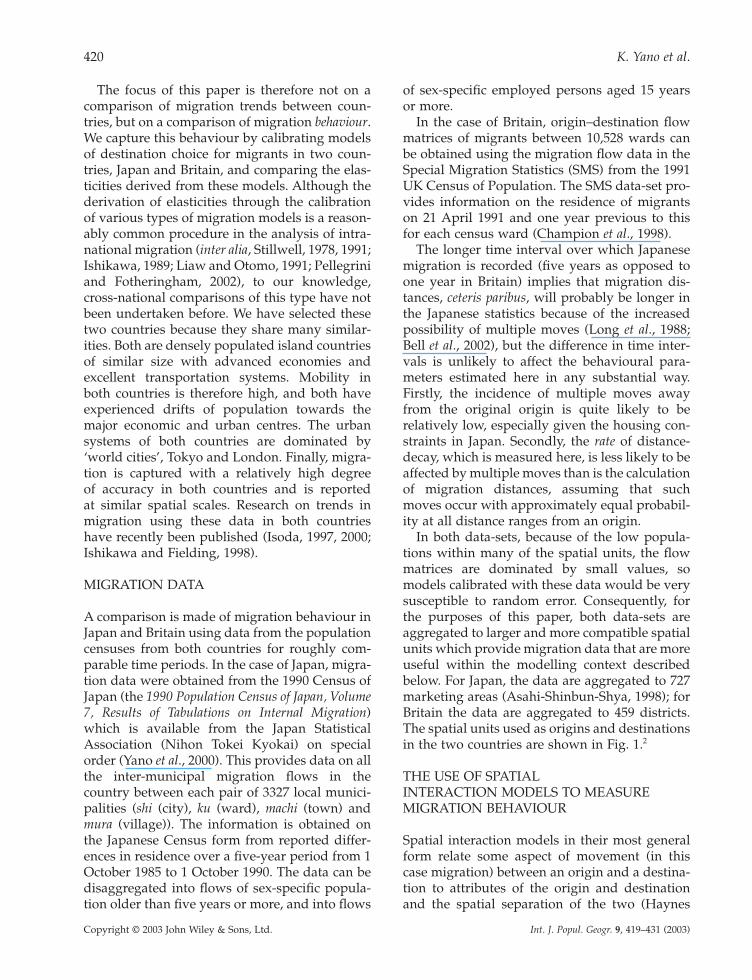
In both data-sets, because of the low popula-tions within many of the spatial units, the flowmatrices are dominated by small values, somodels calibrated with these data would be verysusceptible to random error. Consequently, forthe purposes of this paper, both data-sets areaggregated to larger and more compatible spatialunits which provide migration data that are moreuseful within the modelling context describedbelow. For Japan, the data are aggregated to 727marketing areas (Asahi-Shinbun-Shya, 1998); forBritain the data are aggregated to 459 districts.The spatial units used as origins and destinationsin the two countries are shown in Fig. 1.2
THE USE OF SPATIALINTERACTION MODELS TO MEASUREMIGRATION BEHAVIOUR
Spatial interaction models in their most generalform relate some aspect of movement (in thiscase migration) between an origin and a destina-tion to attributes of the origin and destinationand the spatial separation of the two (Haynes
420 K. Yano et al.
Copyright © 2003 John Wiley & Sons, Ltd. Int. J. Popul. Geogr. 9, 419–431 (2003)
and Fotheringham, 1984; Fotheringham andO’Kelly, 1989). However, spatial interactionmodels that are more theoretically defensibletend to focus on aspects of the decision-makingprocedure leading to a type of movement. Interms of migration, for example, the focus ofattention is often on either the decision to leavean origin, or the decision leading to the selectionof a particular destination (Rees et al., 2003). Herewe concentrate on the latter where the model has the generic form:
(1)
where pij denotes the probability that a migrantat origin i will select destination j, Xj represents avector of attributes of destination j that affect thisdecision, and Sij represents the spatial separationof places i and j. The specific form of this modelis that of a production-constrained spatial inter-action model. Suppose we have two destinationattributes that affect destination choice: popula-tion size, Pj, and a measure of relative locationwith respect to other destinations, Aj. Furthersuppose that spatial separation is measured bythe distance separating i and j, dij. Then the modelcan be written as:
p f Sij j ij= ( )X ,
(2)
where a denotes the elasticity of destinationchoice with respect to population size, d denotesthe elasticity of destination choice with respect tothe relative location of the destination, and bdenotes the elasticity of destination choice withrespect to distance. The relative location of a destination captures the competition faced by adestination from surrounding destinations and isknown as the competing destinations variable(Fotheringham, 1983, 1986). This can be meas-ured in a variety of ways, but a common formulation is:
(3)
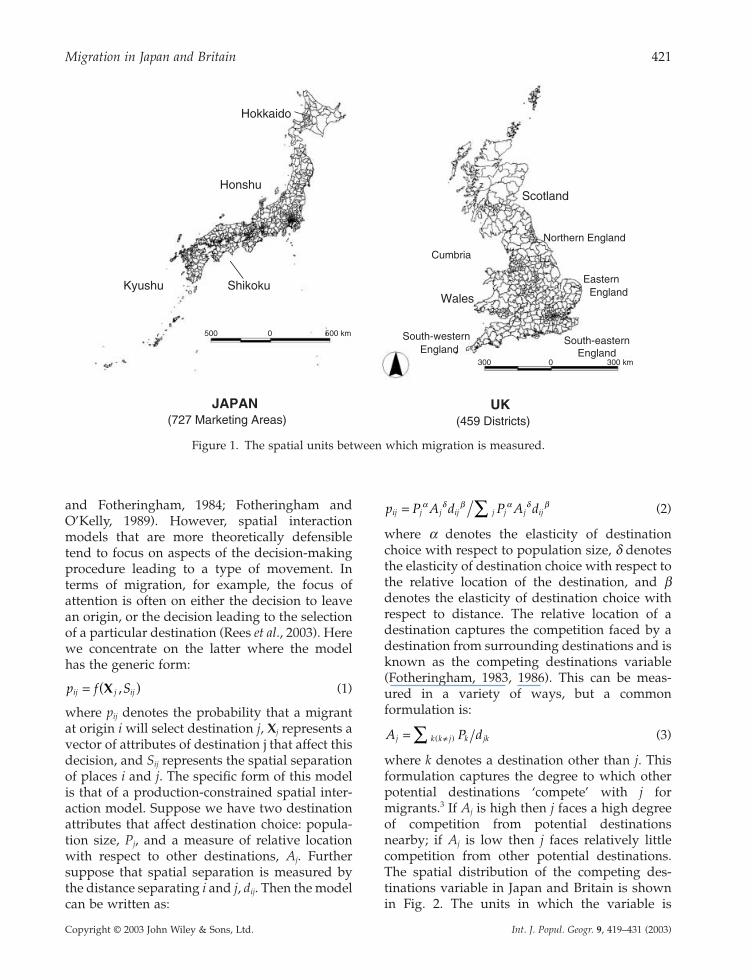
where k denotes a destination other than j. Thisformulation captures the degree to which otherpotential destinations ‘compete’ with j formigrants.3 If Aj is high then j faces a high degreeof competition from potential destinationsnearby; if Aj is low then j faces relatively littlecompetition from other potential destinations.The spatial distribution of the competing des-tinations variable in Japan and Britain is shownin Fig. 2. The units in which the variable is
A P dj k k j k jk= π( )Â
p P A d P A dij j j ij j j j ij= Âa d b a d b
Migration in Japan and Britain 421
Copyright © 2003 John Wiley & Sons, Ltd. Int. J. Popul. Geogr. 9, 419–431 (2003)
JAPAN(727 Marketing Areas)
UK(459 Districts)
Hokkaido
Honshu
Kyushu Shikoku
Scotland
Wales
Cumbria
Northern England
South-westernEngland
South-easternEngland
Eastern England
300 0 300 km
500 0 500 km
Figure 1. The spatial units between which migration is measured.
measured are unimportant, as the parameter tobe estimated is independent of these units. Thepattern in Japan is one of high values towards thecentre of the country near the two main metro-politan areas of Tokyo and Keihanshin (the latterincludes the cities of Kyoto, Osaka and Kobe),both of which are on Honshu. In northernHonshu and Hokkaido and in the southern tip ofHonshu and the southern islands of Shikoku andKyushu, the values are relatively low becausedestinations here face relatively little competitionfrom major urban areas. In Britain the pattern ofhigh competition values is centred on Londonand the South East, but high values are alsofound in areas around Birmingham and the Manchester-to-Liverpool axis. Low competitionvalues are found in Northern England, most ofScotland and the western fringes of Wales andthe far South West.
The competition variable has been shown tohave an important role in spatial interactionmodelling and in migration modelling in particu-lar, both in the context of British (Fotheringham,1991; Champion et al., 1998; Fotheringham et al.,2000, 2002; Rees et al., 2003) and Japanese(Ishikawa, 1987; Yano et al., 2000; Nakaya, 2001)migration systems. Indeed, Roy (1990) describedits inclusion as one of the four main advances inspatial interaction modelling in recent times. Not
only does it result in substantial improvementsin model accuracy but it also removes the spatialstructure effect from the model which results inmisspecification bias, particular in the estimateddistance-decay parameters (Fotheringham, 1991;Fotheringham et al., 2001; Pellegrini and Fother-ingham, 2002). Furthermore, the inclusion of thevariable allows estimates of the parameter d to beobtained, which has a useful behavioural inter-pretation as described below.
Calibrating a model of the form given in equa-tion (2) yields estimates of the parameters a, band d which provide valuable information on thedestination choices of migrants. Furthermore,because these parameters are elasticities, they arescale-independent and therefore the informationthey provide can be used to undertake meaning-ful comparisons of migration behaviour in dif-ferent countries. The parameter a measures theattractiveness of population size as a determinantof destination choice. In most circumstances, awill be greater than zero and empirical estimatestend to be close to 1.0: larger places are moreattractive to migrants than are smaller placesbecause the former offer more opportunities foremployment; are more likely to contain family orfriends; are more likely to be known throughvarious information networks; and offer greateropportunities for entertainment. A value of 1.0
422 K. Yano et al.
Copyright © 2003 John Wiley & Sons, Ltd. Int. J. Popul. Geogr. 9, 419–431 (2003)
Tokyo
Keihanshin(Osaka-Kobe-Kyoto)
London
Birmingham
Liverpool- Manchester
500 500 km0
300 0 300 km
Destination CompetitionLow
High
Figure 2. The spatial distribution of the competition variable.
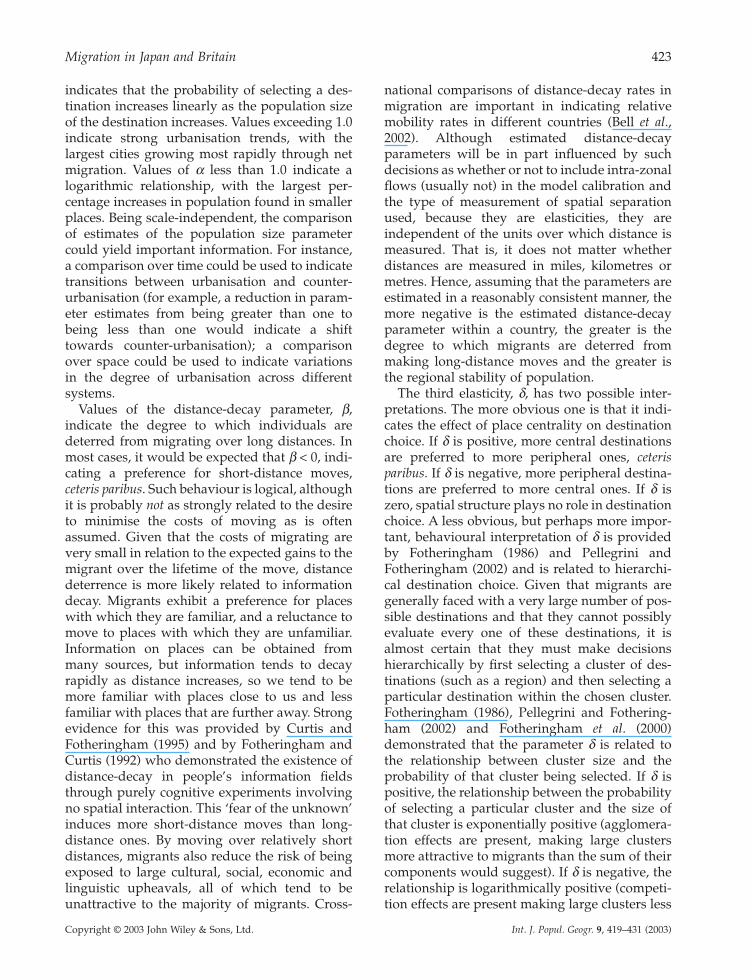
indicates that the probability of selecting a des-tination increases linearly as the population sizeof the destination increases. Values exceeding 1.0indicate strong urbanisation trends, with thelargest cities growing most rapidly through netmigration. Values of a less than 1.0 indicate a logarithmic relationship, with the largest per-centage increases in population found in smallerplaces. Being scale-independent, the comparisonof estimates of the population size parametercould yield important information. For instance,a comparison over time could be used to indicatetransitions between urbanisation and counter-urbanisation (for example, a reduction in param-eter estimates from being greater than one tobeing less than one would indicate a shifttowards counter-urbanisation); a comparisonover space could be used to indicate variations in the degree of urbanisation across differentsystems.
Values of the distance-decay parameter, b,indicate the degree to which individuals aredeterred from migrating over long distances. Inmost cases, it would be expected that b < 0, indi-cating a preference for short-distance moves,ceteris paribus. Such behaviour is logical, althoughit is probably not as strongly related to the desireto minimise the costs of moving as is oftenassumed. Given that the costs of migrating arevery small in relation to the expected gains to themigrant over the lifetime of the move, distancedeterrence is more likely related to informationdecay. Migrants exhibit a preference for placeswith which they are familiar, and a reluctance tomove to places with which they are unfamiliar.Information on places can be obtained frommany sources, but information tends to decayrapidly as distance increases, so we tend to bemore familiar with places close to us and lessfamiliar with places that are further away. Strongevidence for this was provided by Curtis andFotheringham (1995) and by Fotheringham andCurtis (1992) who demonstrated the existence ofdistance-decay in people’s information fieldsthrough purely cognitive experiments involvingno spatial interaction. This ‘fear of the unknown’induces more short-distance moves than long-distance ones. By moving over relatively shortdistances, migrants also reduce the risk of beingexposed to large cultural, social, economic andlinguistic upheavals, all of which tend to be unattractive to the majority of migrants. Cross-
national comparisons of distance-decay rates inmigration are important in indicating relativemobility rates in different countries (Bell et al.,2002). Although estimated distance-decay parameters will be in part influenced by suchdecisions as whether or not to include intra-zonalflows (usually not) in the model calibration andthe type of measurement of spatial separationused, because they are elasticities, they are independent of the units over which distance ismeasured. That is, it does not matter whether distances are measured in miles, kilometres ormetres. Hence, assuming that the parameters areestimated in a reasonably consistent manner, themore negative is the estimated distance-decayparameter within a country, the greater is thedegree to which migrants are deterred frommaking long-distance moves and the greater isthe regional stability of population.
The third elasticity, d, has two possible inter-pretations. The more obvious one is that it indi-cates the effect of place centrality on destinationchoice. If d is positive, more central destinationsare preferred to more peripheral ones, ceterisparibus. If d is negative, more peripheral destina-tions are preferred to more central ones. If d iszero, spatial structure plays no role in destinationchoice. A less obvious, but perhaps more impor-tant, behavioural interpretation of d is providedby Fotheringham (1986) and Pellegrini andFotheringham (2002) and is related to hierarchi-cal destination choice. Given that migrants aregenerally faced with a very large number of pos-sible destinations and that they cannot possiblyevaluate every one of these destinations, it isalmost certain that they must make decisionshierarchically by first selecting a cluster of des-tinations (such as a region) and then selecting aparticular destination within the chosen cluster.Fotheringham (1986), Pellegrini and Fothering-ham (2002) and Fotheringham et al. (2000)demonstrated that the parameter d is related tothe relationship between cluster size and theprobability of that cluster being selected. If d ispositive, the relationship between the probabilityof selecting a particular cluster and the size ofthat cluster is exponentially positive (agglomera-tion effects are present, making large clustersmore attractive to migrants than the sum of theircomponents would suggest). If d is negative, therelationship is logarithmically positive (competi-tion effects are present making large clusters less
Migration in Japan and Britain 423
Copyright © 2003 John Wiley & Sons, Ltd. Int. J. Popul. Geogr. 9, 419–431 (2003)
attractive than the sum of their componentswould suggest),4 and if d is zero the relationshipis positive and linear. Clearly, this argument issimilar to that made above regarding the inter-pretation of the parameter a, but, whereas a isrelated to the relationship between the attrac-tiveness of an individual destination and its size,d is related to the attractiveness of a cluster of destinations and the size of this cluster. One mightsuspect the two to be related so that if a is greaterthan 1, d is likely to be positive, and if a is lessthan 1, a is likely to be negative. We will examinethis relationship in both Japan and Britain andshow that it does not always hold.
In order to maximise the amount of informa-tion on migration behaviour obtained from thedata, the model in equation (2) is calibrated separately for each origin in both countries. Themodel calibrated is then:
(4)
where each parameter is now specific to origin i.The calibration of such a model thus allows thespatial variation of origin-specific parameter esti-mates to be mapped, and these spatial patternscan indicate variations in migration behaviourwithin countries. We now describe the results ofthis model calibration for both the Japanese andBritish migration data.
CALIBRATION RESULTS
The calibration of the migration destinationchoice in equation (4) was undertaken bymaximum likelihood estimation based on theassumption that the migration data are Poissondistributed (Flowerdew and Aitkin, 1982). Thecalibration yields three sets of origin-specificparameter estimates for both countries: for Japanthere are 727 origins; for Britain there are 459.Because of the large volume of information onmigration behaviour obtained in both countries,the parameter estimates are presented in threeformats: as maps, on scatterplots, and in a tableof summary statistics. Table 1 depicts the averageparameter estimates for each origin in both coun-tries along with information on the variance ofthe estimates within each country and the per-formance of the models. The latter is measuredby two goodness-of-fit statistics: the percentagedeviance explained, and the coefficient of deter-mination (Amrhein and Flowerdew, 1992). Both
p P A d P A dij ji
ji
iji
j ji
ji
iji= ( ) ( ) ( ) ( ) ( ) ( )Âa d b a d b
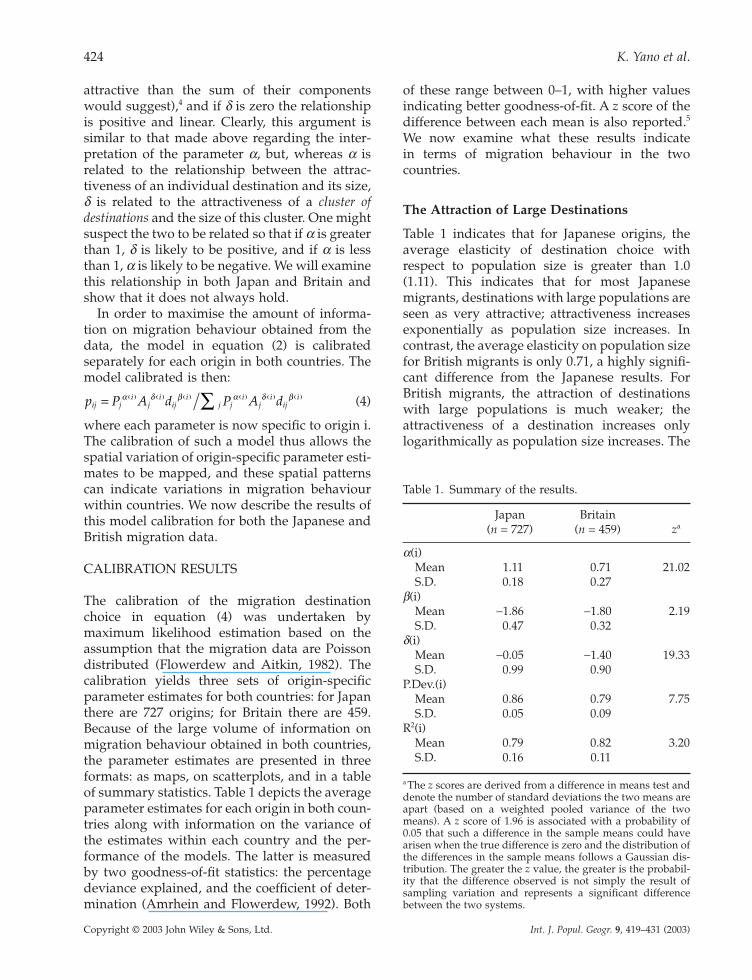
of these range between 0–1, with higher valuesindicating better goodness-of-fit. A z score of thedifference between each mean is also reported.5
We now examine what these results indicate in terms of migration behaviour in the two countries.
The Attraction of Large Destinations
Table 1 indicates that for Japanese origins, theaverage elasticity of destination choice withrespect to population size is greater than 1.0(1.11). This indicates that for most Japanesemigrants, destinations with large populations areseen as very attractive; attractiveness increasesexponentially as population size increases. Incontrast, the average elasticity on population sizefor British migrants is only 0.71, a highly signifi-cant difference from the Japanese results. ForBritish migrants, the attraction of destinationswith large populations is much weaker; theattractiveness of a destination increases only logarithmically as population size increases. The
424 K. Yano et al.
Copyright © 2003 John Wiley & Sons, Ltd. Int. J. Popul. Geogr. 9, 419–431 (2003)
Table 1. Summary of the results.
Japan Britain(n = 727) (n = 459) za
a(i)Mean 1.11 0.71 21.02S.D. 0.18 0.27
b(i)Mean -1.86 -1.80 2.19S.D. 0.47 0.32
d(i)Mean -0.05 -1.40 19.33S.D. 0.99 0.90
P.Dev.(i)Mean 0.86 0.79 7.75S.D. 0.05 0.09
R2(i)Mean 0.79 0.82 3.20S.D. 0.16 0.11
a The z scores are derived from a difference in means test anddenote the number of standard deviations the two means areapart (based on a weighted pooled variance of the twomeans). A z score of 1.96 is associated with a probability of0.05 that such a difference in the sample means could havearisen when the true difference is zero and the distribution ofthe differences in the sample means follows a Gaussian dis-tribution. The greater the z value, the greater is the probabil-ity that the difference observed is not simply the result ofsampling variation and represents a significant differencebetween the two systems.
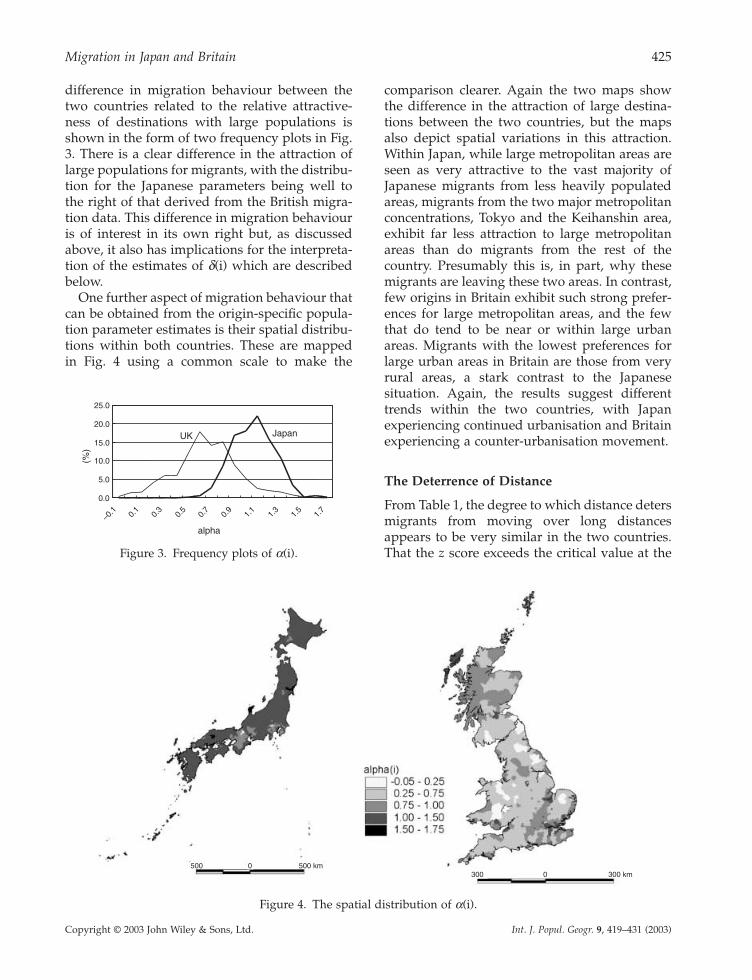
difference in migration behaviour between thetwo countries related to the relative attractive-ness of destinations with large populations isshown in the form of two frequency plots in Fig.3. There is a clear difference in the attraction oflarge populations for migrants, with the distribu-tion for the Japanese parameters being well to the right of that derived from the British migra-tion data. This difference in migration behaviouris of interest in its own right but, as discussedabove, it also has implications for the interpreta-tion of the estimates of d(i) which are describedbelow.
One further aspect of migration behaviour thatcan be obtained from the origin-specific popula-tion parameter estimates is their spatial distribu-tions within both countries. These are mapped in Fig. 4 using a common scale to make the
comparison clearer. Again the two maps showthe difference in the attraction of large destina-tions between the two countries, but the mapsalso depict spatial variations in this attraction.Within Japan, while large metropolitan areas areseen as very attractive to the vast majority ofJapanese migrants from less heavily populatedareas, migrants from the two major metropolitan concentrations, Tokyo and the Keihanshin area,exhibit far less attraction to large metropolitanareas than do migrants from the rest of thecountry. Presumably this is, in part, why thesemigrants are leaving these two areas. In contrast,few origins in Britain exhibit such strong prefer-ences for large metropolitan areas, and the fewthat do tend to be near or within large urbanareas. Migrants with the lowest preferences forlarge urban areas in Britain are those from veryrural areas, a stark contrast to the Japanese situation. Again, the results suggest differenttrends within the two countries, with Japan experiencing continued urbanisation and Britainexperiencing a counter-urbanisation movement.
The Deterrence of Distance
From Table 1, the degree to which distance detersmigrants from moving over long distancesappears to be very similar in the two countries.That the z score exceeds the critical value at the
Migration in Japan and Britain 425
Copyright © 2003 John Wiley & Sons, Ltd. Int. J. Popul. Geogr. 9, 419–431 (2003)
alpha
0.0
5.0
10.0
15.0
20.0
25.0
–0.1 0.
10.
30.
50.
70.
91.
11.
31.
51.
7
(%)
UK Japan
Figure 3. Frequency plots of a(i).
500 0 500 km300 0 300 km
Figure 4. The spatial distribution of a(i).
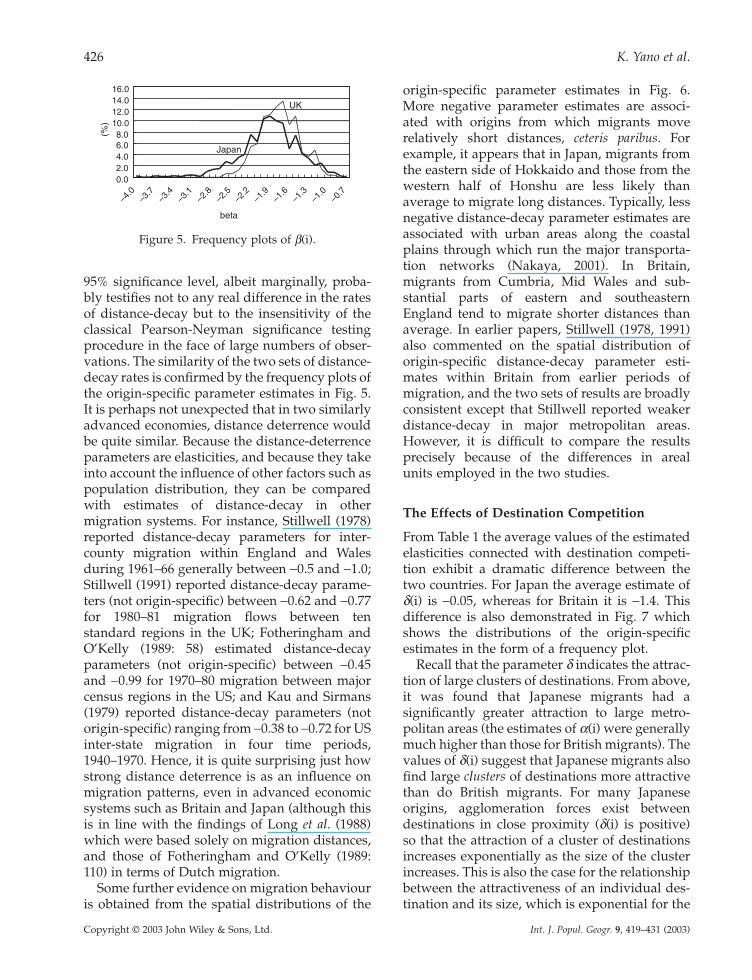
95% significance level, albeit marginally, proba-bly testifies not to any real difference in the ratesof distance-decay but to the insensitivity of theclassical Pearson-Neyman significance testingprocedure in the face of large numbers of obser-vations. The similarity of the two sets of distance-decay rates is confirmed by the frequency plots ofthe origin-specific parameter estimates in Fig. 5.It is perhaps not unexpected that in two similarlyadvanced economies, distance deterrence wouldbe quite similar. Because the distance-deterrenceparameters are elasticities, and because they takeinto account the influence of other factors such aspopulation distribution, they can be comparedwith estimates of distance-decay in other migration systems. For instance, Stillwell (1978)reported distance-decay parameters for inter-county migration within England and Walesduring 1961–66 generally between -0.5 and -1.0;Stillwell (1991) reported distance-decay parame-ters (not origin-specific) between -0.62 and -0.77for 1980–81 migration flows between ten standard regions in the UK; Fotheringham andO’Kelly (1989: 58) estimated distance-decay parameters (not origin-specific) between -0.45and -0.99 for 1970–80 migration between majorcensus regions in the US; and Kau and Sirmans(1979) reported distance-decay parameters (notorigin-specific) ranging from -0.38 to -0.72 for USinter-state migration in four time periods,1940–1970. Hence, it is quite surprising just howstrong distance deterrence is as an influence onmigration patterns, even in advanced economicsystems such as Britain and Japan (although thisis in line with the findings of Long et al. (1988)which were based solely on migration distances,and those of Fotheringham and O’Kelly (1989:110) in terms of Dutch migration.
Some further evidence on migration behaviouris obtained from the spatial distributions of the
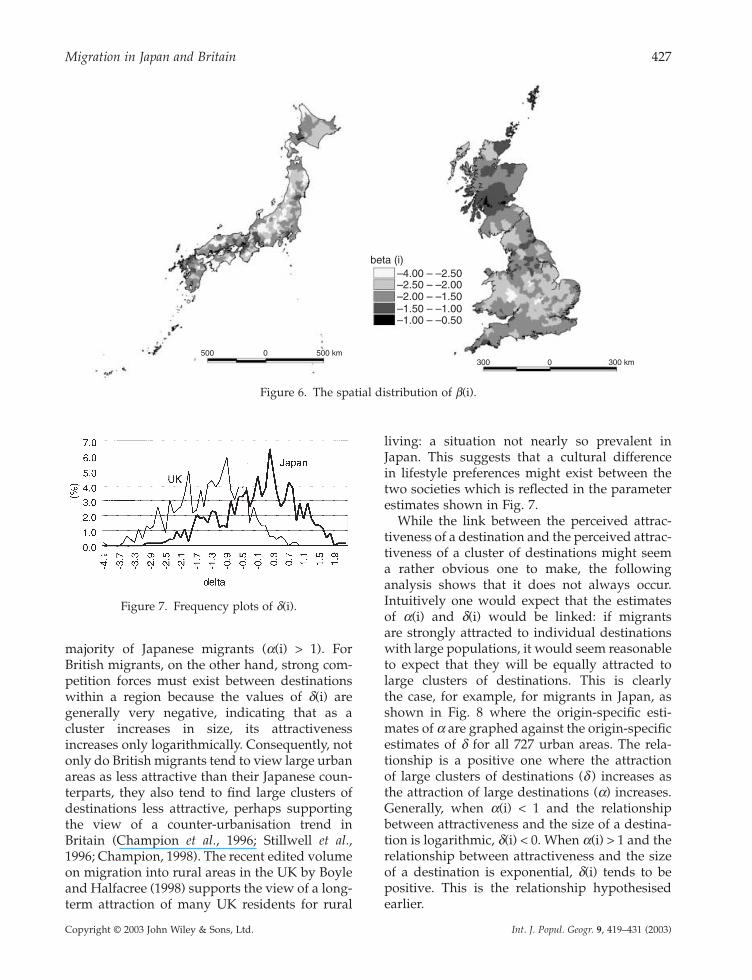
origin-specific parameter estimates in Fig. 6.More negative parameter estimates are associ-ated with origins from which migrants move relatively short distances, ceteris paribus. Forexample, it appears that in Japan, migrants fromthe eastern side of Hokkaido and those from thewestern half of Honshu are less likely thanaverage to migrate long distances. Typically, lessnegative distance-decay parameter estimates areassociated with urban areas along the coastalplains through which run the major transporta-tion networks (Nakaya, 2001). In Britain,migrants from Cumbria, Mid Wales and sub-stantial parts of eastern and southeasternEngland tend to migrate shorter distances thanaverage. In earlier papers, Stillwell (1978, 1991)also commented on the spatial distribution oforigin-specific distance-decay parameter esti-mates within Britain from earlier periods ofmigration, and the two sets of results are broadlyconsistent except that Stillwell reported weakerdistance-decay in major metropolitan areas.However, it is difficult to compare the results precisely because of the differences in areal units employed in the two studies.
The Effects of Destination Competition
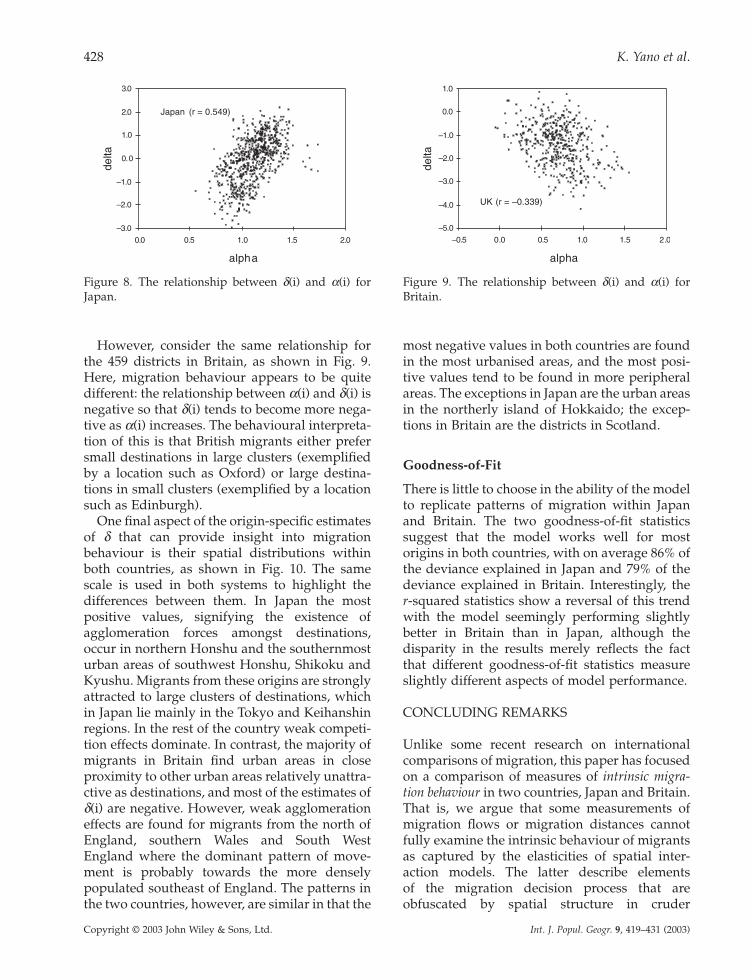
From Table 1 the average values of the estimatedelasticities connected with destination competi-tion exhibit a dramatic difference between thetwo countries. For Japan the average estimate ofd(i) is -0.05, whereas for Britain it is -1.4. This difference is also demonstrated in Fig. 7 whichshows the distributions of the origin-specific estimates in the form of a frequency plot.
Recall that the parameter d indicates the attrac-tion of large clusters of destinations. From above,it was found that Japanese migrants had a significantly greater attraction to large metro-politan areas (the estimates of a(i) were generallymuch higher than those for British migrants). Thevalues of d(i) suggest that Japanese migrants alsofind large clusters of destinations more attractivethan do British migrants. For many Japaneseorigins, agglomeration forces exist between destinations in close proximity (d(i) is positive) so that the attraction of a cluster of destinationsincreases exponentially as the size of the clusterincreases. This is also the case for the relationshipbetween the attractiveness of an individual des-tination and its size, which is exponential for the
426 K. Yano et al.
Copyright © 2003 John Wiley & Sons, Ltd. Int. J. Popul. Geogr. 9, 419–431 (2003)
beta
0.02.04.06.08.0
10.012.014.016.0
–4.0
–3.7
–3.4
–3.1
–2.8
–2.5
–2.2
–1.9
–1.6
–1.3
–1.0
–0.7
(%)
Japan
UK
Figure 5. Frequency plots of b(i).
majority of Japanese migrants (a(i) > 1). ForBritish migrants, on the other hand, strong com-petition forces must exist between destinationswithin a region because the values of d(i) are generally very negative, indicating that as acluster increases in size, its attractivenessincreases only logarithmically. Consequently, notonly do British migrants tend to view large urbanareas as less attractive than their Japanese coun-terparts, they also tend to find large clusters ofdestinations less attractive, perhaps supportingthe view of a counter-urbanisation trend inBritain (Champion et al., 1996; Stillwell et al.,1996; Champion, 1998). The recent edited volumeon migration into rural areas in the UK by Boyleand Halfacree (1998) supports the view of a long-term attraction of many UK residents for rural
living: a situation not nearly so prevalent inJapan. This suggests that a cultural difference in lifestyle preferences might exist between thetwo societies which is reflected in the parameterestimates shown in Fig. 7.
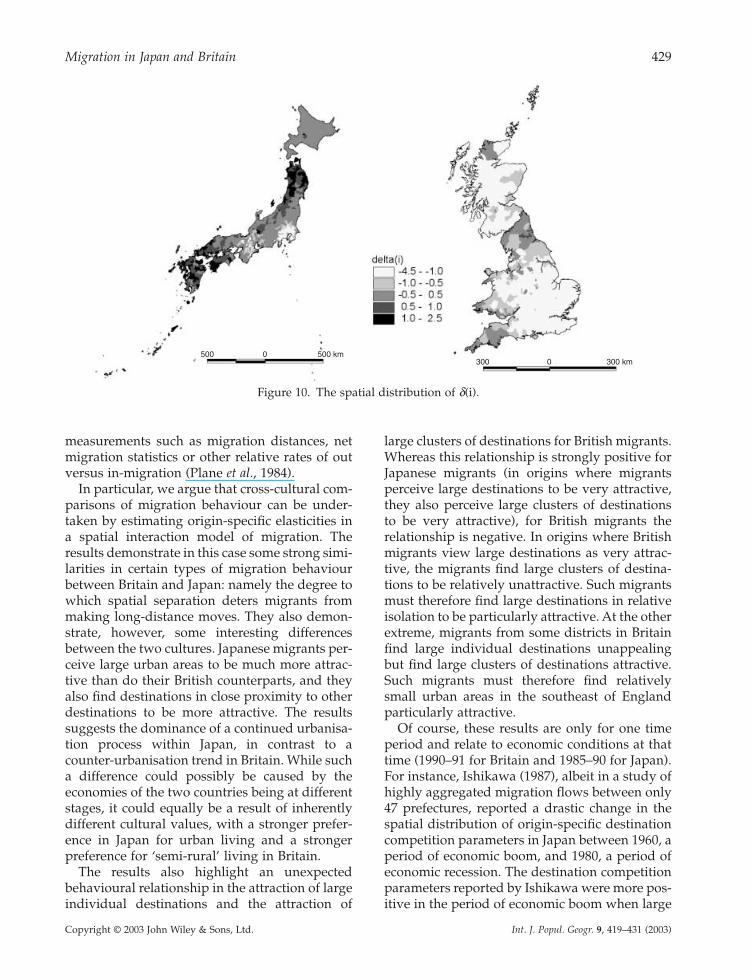
While the link between the perceived attrac-tiveness of a destination and the perceived attrac-tiveness of a cluster of destinations might seem a rather obvious one to make, the followinganalysis shows that it does not always occur.Intuitively one would expect that the estimates of a(i) and d(i) would be linked: if migrants are strongly attracted to individual destinationswith large populations, it would seem reasonableto expect that they will be equally attracted tolarge clusters of destinations. This is clearly the case, for example, for migrants in Japan, asshown in Fig. 8 where the origin-specific esti-mates of a are graphed against the origin-specificestimates of d for all 727 urban areas. The rela-tionship is a positive one where the attraction of large clusters of destinations (d ) increases asthe attraction of large destinations (a) increases.Generally, when a(i) < 1 and the relationshipbetween attractiveness and the size of a destina-tion is logarithmic, d(i) < 0. When a(i) > 1 and therelationship between attractiveness and the sizeof a destination is exponential, d(i) tends to bepositive. This is the relationship hypothesisedearlier.
Migration in Japan and Britain 427
Copyright © 2003 John Wiley & Sons, Ltd. Int. J. Popul. Geogr. 9, 419–431 (2003)
500 500 km0300 0 300 km
beta (i)–4.00 – –2.50–2.50 – –2.00
–1.50 – –1.00–1.00 – –0.50
–2.00 – –1.50
Figure 6. The spatial distribution of b(i).
Figure 7. Frequency plots of d(i).
However, consider the same relationship forthe 459 districts in Britain, as shown in Fig. 9.Here, migration behaviour appears to be quitedifferent: the relationship between a(i) and d(i) isnegative so that d(i) tends to become more nega-tive as a(i) increases. The behavioural interpreta-tion of this is that British migrants either prefersmall destinations in large clusters (exemplifiedby a location such as Oxford) or large destina-tions in small clusters (exemplified by a locationsuch as Edinburgh).
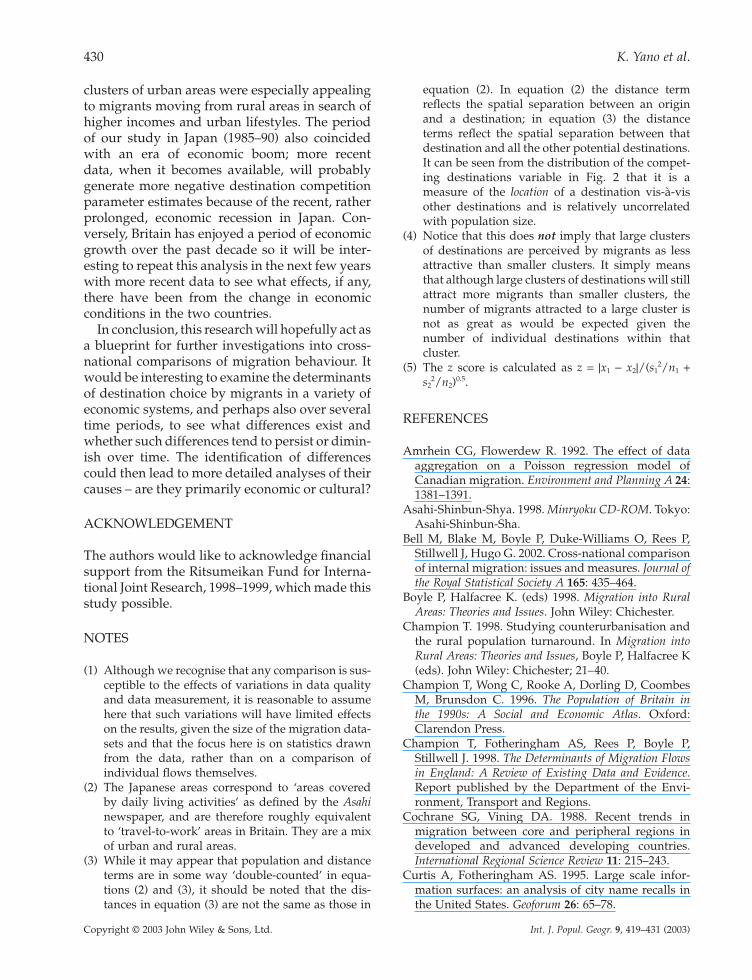
One final aspect of the origin-specific estimatesof d that can provide insight into migrationbehaviour is their spatial distributions withinboth countries, as shown in Fig. 10. The samescale is used in both systems to highlight the differences between them. In Japan the most positive values, signifying the existence ofagglomeration forces amongst destinations,occur in northern Honshu and the southernmosturban areas of southwest Honshu, Shikoku andKyushu. Migrants from these origins are stronglyattracted to large clusters of destinations, whichin Japan lie mainly in the Tokyo and Keihanshinregions. In the rest of the country weak competi-tion effects dominate. In contrast, the majority ofmigrants in Britain find urban areas in close proximity to other urban areas relatively unattra-ctive as destinations, and most of the estimates ofd(i) are negative. However, weak agglomerationeffects are found for migrants from the north ofEngland, southern Wales and South WestEngland where the dominant pattern of move-ment is probably towards the more densely populated southeast of England. The patterns inthe two countries, however, are similar in that the
most negative values in both countries are foundin the most urbanised areas, and the most posi-tive values tend to be found in more peripheralareas. The exceptions in Japan are the urban areasin the northerly island of Hokkaido; the excep-tions in Britain are the districts in Scotland.
Goodness-of-Fit
There is little to choose in the ability of the modelto replicate patterns of migration within Japanand Britain. The two goodness-of-fit statisticssuggest that the model works well for mostorigins in both countries, with on average 86% of the deviance explained in Japan and 79% of thedeviance explained in Britain. Interestingly, the r-squared statistics show a reversal of this trendwith the model seemingly performing slightlybetter in Britain than in Japan, although the disparity in the results merely reflects the factthat different goodness-of-fit statistics measureslightly different aspects of model performance.
CONCLUDING REMARKS
Unlike some recent research on internationalcomparisons of migration, this paper has focusedon a comparison of measures of intrinsic migra-tion behaviour in two countries, Japan and Britain.That is, we argue that some measurements ofmigration flows or migration distances cannotfully examine the intrinsic behaviour of migrantsas captured by the elasticities of spatial inter-action models. The latter describe elements of the migration decision process that are obfuscated by spatial structure in cruder
428 K. Yano et al.
Copyright © 2003 John Wiley & Sons, Ltd. Int. J. Popul. Geogr. 9, 419–431 (2003)
Japan (r = 0.549)
–3.0
–2.0
–1.0
0.0
1.0
2.0
3.0
0.0 0.5 1.0 1.5 2.0
alpha
delta
Figure 8. The relationship between d(i) and a(i) forJapan.
UK (r = –0.339)
–5.0
–4.0
–3.0
–2.0
–1.0
0.0
1.0
–0.5 0.0 0.5 1.0 1.5 2.0
alpha
delta
Figure 9. The relationship between d(i) and a(i) forBritain.
measurements such as migration distances, netmigration statistics or other relative rates of outversus in-migration (Plane et al., 1984).
In particular, we argue that cross-cultural com-parisons of migration behaviour can be under-taken by estimating origin-specific elasticities ina spatial interaction model of migration. Theresults demonstrate in this case some strong simi-larities in certain types of migration behaviourbetween Britain and Japan: namely the degree towhich spatial separation deters migrants frommaking long-distance moves. They also demon-strate, however, some interesting differencesbetween the two cultures. Japanese migrants per-ceive large urban areas to be much more attrac-tive than do their British counterparts, and theyalso find destinations in close proximity to otherdestinations to be more attractive. The resultssuggests the dominance of a continued urbanisa-tion process within Japan, in contrast to acounter-urbanisation trend in Britain. While sucha difference could possibly be caused by theeconomies of the two countries being at differentstages, it could equally be a result of inherentlydifferent cultural values, with a stronger prefer-ence in Japan for urban living and a strongerpreference for ‘semi-rural’ living in Britain.
The results also highlight an unexpectedbehavioural relationship in the attraction of largeindividual destinations and the attraction of
large clusters of destinations for British migrants.Whereas this relationship is strongly positive forJapanese migrants (in origins where migrantsperceive large destinations to be very attractive,they also perceive large clusters of destinationsto be very attractive), for British migrants therelationship is negative. In origins where Britishmigrants view large destinations as very attrac-tive, the migrants find large clusters of destina-tions to be relatively unattractive. Such migrantsmust therefore find large destinations in relativeisolation to be particularly attractive. At the otherextreme, migrants from some districts in Britainfind large individual destinations unappealingbut find large clusters of destinations attractive.Such migrants must therefore find relativelysmall urban areas in the southeast of Englandparticularly attractive.
Of course, these results are only for one timeperiod and relate to economic conditions at thattime (1990–91 for Britain and 1985–90 for Japan).For instance, Ishikawa (1987), albeit in a study ofhighly aggregated migration flows between only47 prefectures, reported a drastic change in thespatial distribution of origin-specific destinationcompetition parameters in Japan between 1960, aperiod of economic boom, and 1980, a period ofeconomic recession. The destination competitionparameters reported by Ishikawa were more pos-itive in the period of economic boom when large
Migration in Japan and Britain 429
Copyright © 2003 John Wiley & Sons, Ltd. Int. J. Popul. Geogr. 9, 419–431 (2003)
500 0 500 km300 0 300 km
Figure 10. The spatial distribution of d(i).
clusters of urban areas were especially appealingto migrants moving from rural areas in search ofhigher incomes and urban lifestyles. The periodof our study in Japan (1985–90) also coincidedwith an era of economic boom; more recent data, when it becomes available, will probablygenerate more negative destination competitionparameter estimates because of the recent, ratherprolonged, economic recession in Japan. Con-versely, Britain has enjoyed a period of economicgrowth over the past decade so it will be inter-esting to repeat this analysis in the next few yearswith more recent data to see what effects, if any,there have been from the change in economicconditions in the two countries.
In conclusion, this research will hopefully act asa blueprint for further investigations into cross-national comparisons of migration behaviour. Itwould be interesting to examine the determinantsof destination choice by migrants in a variety ofeconomic systems, and perhaps also over severaltime periods, to see what differences exist andwhether such differences tend to persist or dimin-ish over time. The identification of differencescould then lead to more detailed analyses of theircauses – are they primarily economic or cultural?
ACKNOWLEDGEMENT
The authors would like to acknowledge financialsupport from the Ritsumeikan Fund for Interna-tional Joint Research, 1998–1999, which made thisstudy possible.
NOTES
(1) Although we recognise that any comparison is sus-ceptible to the effects of variations in data qualityand data measurement, it is reasonable to assumehere that such variations will have limited effectson the results, given the size of the migration data-sets and that the focus here is on statistics drawnfrom the data, rather than on a comparison of individual flows themselves.
(2) The Japanese areas correspond to ‘areas covered by daily living activities’ as defined by the Asahinewspaper, and are therefore roughly equivalentto ‘travel-to-work’ areas in Britain. They are a mixof urban and rural areas.
(3) While it may appear that population and distanceterms are in some way ‘double-counted’ in equa-tions (2) and (3), it should be noted that the dis-tances in equation (3) are not the same as those in
equation (2). In equation (2) the distance termreflects the spatial separation between an originand a destination; in equation (3) the distanceterms reflect the spatial separation between thatdestination and all the other potential destinations.It can be seen from the distribution of the compet-ing destinations variable in Fig. 2 that it is ameasure of the location of a destination vis-à-visother destinations and is relatively uncorrelatedwith population size.
(4) Notice that this does not imply that large clustersof destinations are perceived by migrants as lessattractive than smaller clusters. It simply meansthat although large clusters of destinations will stillattract more migrants than smaller clusters, thenumber of migrants attracted to a large cluster isnot as great as would be expected given thenumber of individual destinations within thatcluster.
(5) The z score is calculated as z = |x1 - x2|/(s12/n1 +
s22/n2)0.5.
REFERENCES
Amrhein CG, Flowerdew R. 1992. The effect of dataaggregation on a Poisson regression model of Canadian migration. Environment and Planning A 24:1381–1391.
Asahi-Shinbun-Shya. 1998. Minryoku CD-ROM. Tokyo:Asahi-Shinbun-Sha.
Bell M, Blake M, Boyle P, Duke-Williams O, Rees P,Stillwell J, Hugo G. 2002. Cross-national comparisonof internal migration: issues and measures. Journal ofthe Royal Statistical Society A 165: 435–464.
Boyle P, Halfacree K. (eds) 1998. Migration into RuralAreas: Theories and Issues. John Wiley: Chichester.
Champion T. 1998. Studying counterurbanisation andthe rural population turnaround. In Migration intoRural Areas: Theories and Issues, Boyle P, Halfacree K(eds). John Wiley: Chichester; 21–40.
Champion T, Wong C, Rooke A, Dorling D, CoombesM, Brunsdon C. 1996. The Population of Britain in the 1990s: A Social and Economic Atlas. Oxford:Clarendon Press.
Champion T, Fotheringham AS, Rees P, Boyle P, Stillwell J. 1998. The Determinants of Migration Flowsin England: A Review of Existing Data and Evidence.Report published by the Department of the Envi-ronment, Transport and Regions.
Cochrane SG, Vining DA. 1988. Recent trends in migration between core and peripheral regions indeveloped and advanced developing countries.International Regional Science Review 11: 215–243.
Curtis A, Fotheringham AS. 1995. Large scale infor-mation surfaces: an analysis of city name recalls inthe United States. Geoforum 26: 65–78.
430 K. Yano et al.
Copyright © 2003 John Wiley & Sons, Ltd. Int. J. Popul. Geogr. 9, 419–431 (2003)
Flowerdew R, Aitkin M. 1982. A method of fitting thegravity model based on the Poisson distribution.Journal of Regional Science 22: 191–202.
Fotheringham AS. 1983. A new set of spatial interac-tion models: the theory of competing destinations.Environment and Planning A 15: 15–36.
Fotheringham AS. 1986. Further discussion on distance-deterrence parameters and the competingdestinations model. Environment and Planning A 18:553–556.
Fotheringham AS. 1991. Migration and spatial struc-ture: the development of the competing destinationsmodel. In Migration Models: Macro and MicroApproaches, Stillwell J, Congdon P (eds). Belhaven:London; 57–72.
Fotheringham AS, O’Kelly ME. 1989. Spatial InteractionModels: Formulations and Applications. Kluwer Academic: London.
Fotheringham AS, Curtis A. 1992. Encoding spatialinformation: the evidence for hierarchical process-ing. In Theories and Methods of Spatio-Temporal Reasoning in Geographic Space, Frank AU, Campari I,Formentini U (eds). Lecture Notes in ComputerScience. Springer-Verlag: Dortmund; 269–287.
Fotheringham AS, Champion T, Wymer C, CoombesM. 2000. Measuring destination attractivity: a migration example. International Journal of PopulationGeography 6: 391–421.
Fotheringham AS, Nakaya T, Yano K, Openshaw S,Ishikawa Y. 2001. Hierarchical destination choiceand spatial interaction modelling: a simulationexperiment. Environment and Planning A 33: 901–920.
Fotheringham AS, Barmby T, Brunsdon C, ChampionT, Charlton M, Kalogirou S, Tremayne A, Rees P,Eyre H, Macgill J, Stillwell J, Bramley G, Hollis J.2002. Development of a Migration Model: Analytical andPractical Enhancements. Office of the Deputy PrimeMinister.
Frey WH. 1988. Migration and metropolitan decline indeveloped countries: a comparative study. Popula-tion and Development Review 14: 595–628.
Haynes KE, Fotheringham AS. 1984. Gravity and SpatialInteraction Models. Sage: Beverly Hills.
Ishikawa Y. 1987. An empirical study of the competingdestinations model using Japanese Interaction Data.Environment and Planning A 19: 1359–1373.
Ishikawa Y. 1989. Explorations into the two-stage destination choice. Geographical Review of Japan 62B:75–85.
Ishikawa Y, Fielding AJ. 1998. Explaining the recentmigration trends of the Tokyo Metropolitan Area.Environment and Planning A 30: 1797–1814.
Isoda Y. 1997. Migration research during economic and social fluctuations: a review of British internalmigration. Quarterly Journal of Geography 49: 262–285.
Isoda Y. 2000. When do people live and where are theygoing: net migration by age in Great Britain. Journalof Population Studies 26: 35–44.
Kau JB, Sirmans CF. 1979. A recursive model of thespatial allocation of migrants. Journal of RegionalScience 19: 47–56.
Liaw KL, Otomo A. 1991. Interprectural migration pat-terns of young adults in Japan: An explanation usinga nested logit model. Jinkogaku-Kenkyu (Journal ofPopulation Studies) 14: 1–20.
Long L, Tucker CJ, Urton WL. 1988. Migration dis-tances: an international comparison. Demography 25:633–640.
Nakaya T. 2001. Local spatial interaction modellingbased on the geographically weighted regressionapproach. Geo Journal 53: 347–358.
Pellegrini PA, Fotheringham AS. 2002. Modellingspatial choice: a review and synthesis in a migrationcontext. Progress in Human Geography 26: 487–510.
Plane DA, Rogerson P, Rosen A. 1984. The cross-regional variation of in-migration and out-migration. Geographical Analysis 16: 162–175.
Rees PH, Kupiszewski M. 1999. Internal migration:what data are available in Europe? Journal of OfficialStatistics 15: 551–586.
Rees PH, Stillwell JCH, Convey A, Kupiszewski M.(eds) 1996. Population Migration in the EuropeanUnion. John Wiley: Chichester.
Rees P, Fotheringham AS, Champion T. 2003. Model-ling migration for policy analysis. In Applied GIS andSpatial Analysis, Clarke G, Stillwell J (eds). JohnWiley: Chichester; 259–296.
Rogers A, Willekens F. 1986. Migration and Settlement:A Multiregional Comparative Study. Dordrecht: D.Reidel.
Roy JR. 1990. Spatial interaction modelling: some interpretations and challenges. Environment andPlanning A 22: 712–716.
Stillwell J. 1978. Interzonal migration: some historicaltests of spatial interaction models. Environment andPlanning A 10: 1187–1200.
Stillwell J. 1991. Spatial interaction models and thepropensity to migrate over distance. In MigrationModels: Macro and Micro Approaches, Stillwell J,Congdon P (eds). Belhaven Press: London; 34–56.
Stillwell J, Rees P, Duke-Williams O. 1996. Migrationbetween NUTS level 2 regions in the UnitedKingdom. In Population Migration in the EuropeanUnion, Rees P, Stillwell J, Convey A, Kupiszewski M(eds). John Wiley: Chichester; 275–307.
Yano K, Nakaya T, Ishikawa Y. 2000 An analysis ofinter-municipal migration flows in Japan using GISand spatial interaction modeling. GeographicalReview of Japan 73B: 165–177.
Migration in Japan and Britain 431
Copyright © 2003 John Wiley & Sons, Ltd. Int. J. Popul. Geogr. 9, 419–431 (2003)
Related Documents


