A Comparison of Mandibular Transverse Dimensions of a Class I Normal and Class II Patient Population using Anterior to Posterior Measurement Ratios A THESIS Presented to the Faculty of Uniform Services University of the Health Sciences In Partial Fulfillment Of the Requirements For the Degree of MASTER OF SCIENCE By Michael Joel Stewart, BS, DMD San Antonio, TX April 13, 2012

Welcome message from author
This document is posted to help you gain knowledge. Please leave a comment to let me know what you think about it! Share it to your friends and learn new things together.
Transcript

A Comparison of Mandibular Transverse Dimensions of a Class I Normal and Class II Patient Population using Anterior to Posterior Measurement Ratios
A THESIS
Presented to the Faculty of
Uniform Services University of the Health Sciences
In Partial Fulfillment
Of the Requirements
For the Degree of
MASTER OF SCIENCE
By
Michael Joel Stewart, BS, DMD
San Antonio, TX
April 13, 2012

A COMPARISON OF MANDIBULAR TRANSVERSE DIMENSIONS OF A CLASS I
NORMAL AND CLASS II PATIENT POPULATION USING ANTERIOR TO POSTERIOR
MEASUREMENT RATIOS
Michael Joel Stewart
APPROVED:
Zri~N rz_ Date
APPROVED:
Tilomas R Schneid , D.M.D. , M.S. Dean, Air Force Post-Graduate Dental School
ii

iii
DEDICATION
This thesis is dedicated to my children, who have had to live with me and without me through both school and work over the past 10 years. To my father and mother who convinced me that staying in school wasn’t the prison sentence I was convinced it was in childhood. And to my wife, who has been my encouragement and motivation in my life since the day I met her.

iv
ACKNOWLEDGEMENTS
I would like to thank Dr. Callegari for his help and patience during the last two years on multiple projects and research.

v
ABSTRACT
The transverse dimension of the craniofacial complex has long been suspected of following the deficiencies and excesses of the anteroposterior (AP) dimension. While the AP and even vertical dimensions of the maxilla and mandible have for years been easily assessed with the lateral cephalogram, the relative lack of posterior/anterior (PA) cephs in routine clinical use and a paucity of transverse analyses have made evaluation of the width of the mandible more subjective than the other dimensions. Since earlier analyses by Ricketts and Grummon evaluated the entire mandibular width measured only at the antegonial notch, the addition of more reliable landmarks in both the posterior and anterior mandible offers more information to analyze and a gives a better understanding of the mandible’s taper from posterior to anterior. With reliable bilateral anterior and posterior landmarks, an anterior to posterior width ratio can be constructed to quickly assess the transverse dimension of the mandible.
This study’s main objectives were, first, to identify bilateral landmarks in both the anterior and posterior mandible that could be reliably located using Cone Beam Computed Tomogaphy (CBCT) slices. Once these landmarks were determined in a Class I control population (n=49), a mean and standard deviation for the width at each landmark was determined and an AP width ratio was created. The second part of this study was to compare these data to the transverse measurements in a Class II population both at the individual landmarks and through the created width ratios. This should shed light on the long held notion that deficiencies identified in one plane often occur in all three planes of space. The most reliable landmarks identified in the anterior mandible were the canine root apices and the mental foramen, while the most reliable landmarks in the posterior were the alveolar ridge at the first molar and the lingula.
The results of the study demonstrated a statistically significant difference in transverse dimension between the Class I controls and class II subjects at the canine root apices. In the posterior mandible, the lingula (L) proved to be more reliable than the traditionally used antegonial notch (AG) for a skeletal landmark with interrater reliability of 0.845 for L vs. 1.83 for AG, though there was not a statistically significant difference between the class I and II subjects at either posterior landmark. Using the two most reliable landmarks in both the anterior and posterior mandible, four different width ratios were calculated.

vi

vii
TABLE OF CONTENTS
Title
Approval
Dedication
Acknowledgements
Abstract
Table of Contents
Literature Cited
List of Figures
List of Tables
I. BACKGROUND AND LITERATURE REVIEW
A. Background
II. OBJECTIVES
A. Overall Objective B. Specific Hypothesis
III. MATERIALS AND METHODS
IV. RESULTS
V. DISCUSSION
VI. CONCLUSION
VII. Appendex A

viii
LITERATURE CITED
1. Adams C.P. The measurement of bizygomatic width on cephalometric x-ray films. Dental Practioner 14: 58-63.
2. Alhqvist J. Eliasson S, Welander V. The Cephalometric projection: Part II. Principles of image distortion in cephalometry. Dento Maxillof Radiol. 1983(12):101-108.
3. Azita Madjidi, MD, MS, Patrick Cole, MD, and Terry D. Taylor, DDS, MS A Novel Occlusographic Analysis for Assessment of Mandibular Narrowing. 2009 J of Craniofac Surg. 20:2 509-511.
4. Berco M a, Rigali PH, Miner RM, DeLuca S, Anderson NK. and Will LA.. Accuracy and reliability of linear cephalometric measurements from cone-beam computed tomography scans of a dry human skull. American Journal of Orthodontics and Dentofacial Orthopedics. Volume 136, Issue 1, July 2009, Pages 17.e1-17.e9.
5. Bernardes RA, de Paulo RS, Pereira LO, Duarte MA, Ordinola-Zapata R, de Azevedo JR. Comparative study of cone beam computed tomography and intraoral periapical radiographs in diagnosis of lingual-simulated external root resorptions. Dent Traumatol. 2012 11: doi: 10.1111/j.1600-9657.2011.01113.x. [Epub ahead of print]
6. Bjerin, R. A comparison between the Frankfort horizontal and the sella turcica–nasion as reference planes in cephalometric analysis, Acta Odontologica Scandinavia. 1957 15: 1–12.
7. Burke SP, Silveira AM, Goldsmith LJ, Yancey JM, Van Stewart A, Scarfe WC, A meta-analysis of mandibular intercanine width in treatment and postretention. Angle Orthod 1998. 68:53-60.
8. Cevidanes LHS, Styner MA, Proffit WR. Image analysis and superimpostition of 3-dimensional cone-beam computed tomography models. Am J Orthod Dentofacial Orthop 2006 May;129(5):611-18.
9. Cho HJ. A three-dimensional cephalometric analysis. J Clinical Orthod. 2009 Apr;43(4):235-52.
10. De Oliveira AEF, Cevidanes LH, Phillips C, Motta A, Burke B, Tyndall D. Observer reliability of three-dimensional cephalometric landmark identification on cone-beam computerized tomography. Oral Surgery, Oral Medicine, Oral Pathology, Oral Radiology, and Endodontology. Volume 107, Issue 2, February 2009, Pages 256-265.
11. Durack C, Patel S, Davies J, Wilson R, Mannocci F. Diagnostic accuracy of small volume cone beam computed tomography and intraoral periapical radiography for the detection of simulated external inflammatory root resorption. Int Endod J 2011: 44:136–47.

ix
12. El-Mangoury NH, Shaheen SI, Mostafa YA. Landmark identification in computerized posteroanterior cephalometrics. Am J Orthod Dentofacial Orthop. 1987:Jan 91(1):57-61.
13. Gottlieb EL, Nelson AH, Vogels DS. JCO study of orthodontic diagnosis and treatment procedures: part 1, results and trends. J Clin Orthod 1990;25:145-56.
14. Grummons D, Kappeyne van de Coppelo MA. A frontal asymmetry analysis. J CLin Orthod. 1987;21:448-465.
15. Grummons D, Ricketts RM. Frontal cephalometrics: practical applications, part 2. World J Orthodontics. 2004, summer 5(2):99-119.
16. Gunbay T, Akay MC, Aras A, Gomel M. Effects of Transmandibular Symphyseal Distraction on teeth, bone, and Temporomandibular Joint. J Oral Maxillofac Surg 2009. 67:2254-65
17. Haas A. Rapid expansion of the maxillary dental arch and nasal cavity by opening the mid-palatal suture. Angle Orthod 1961; 31:73-90
18. Haas A. The treatment of maxillary deficiency by opening the mid-palatal suture. Angle Orthod. 1965; 65:200-217.
19. Hasan T. Characteristics Of The Mental Foramen In Different Populations. The Internet Journal of Biological Anthropology. 2011. 4 (2).
20. Huth, J. , R. N. Staley , R. Jacobs , H. Bigelow , and J. Jakobsen . Arch widths in Class II-2 adults compared to adults with Class II-1 and normal occlusion. Angle Orthod 2007. 77:837–844.
21. Kahl-Nieke B, Fischbach H, Schwarze, CW. . Treatment cofactors. and postretention changes in dental arch width dimensions—a long-term evaluation of influencing. American Journal of Orthodontics & Dentofacial Orthopedics 1996: 1099(4) 368-378.
22. King JW, Wallace JC, Winter DL, Niculescu JA. Long-term skeletal and dental stability of mandibular symphyseal distraction osteogenesis with a hybrid distractor. AJODO 2012. 141:60-70.
23. Kuntz, T. R. , R. N. Staley , H. F. Bigelow , C. R. Kremenak , F. J. Kohout , and J. R. Jakobsen . Arch widths in adults with Class I crowded and Class III malocclusions compared with normal occlusions. Angle Orthod 2008. 78:597–603.
24. Ludlow JB. A manufacturer's role in reducing the dose of cone beam computed tomography examinations: effect of beam filtration. Dentomaxillofac Radiol. 2011 40(2):115-22.
25. Lux D, Conradt C, Burden D, Komposh G. Transverse development of the craniofacial skeleton and dentition between 7and 15 years of age-a longitudinal posterior-anterior cephalometric study. Eur J Orthod, 2004 Feb;26(1):31-42.
26. Ricketts R. Perspectives in the clinical application of cephalometrics, the first fifty years. Angle Orthod 1981 Apr;51(2):115-50.
27. Major PW, Johnson DE, Hesse KL, Glover KE. Effect of head orientation on posterior anterior cephalometric landmark identification. Angle Orthod. 1996.66(1):51-60.
28. McNamara JA, Brudon WL. Orthodontics and Dentofacial Orthopedics. Ann Arbor: Needham Press, 2001. Print.

x
29. Miracle AC, Mukheji SK. Conebeam CT of the Head and Neck, Part 2: Clinical applications. Am J Neuroradiology 2009:Aug 30:1285-92.
30. Moorrees, CFA, Kean MR. Natural head position, a basic consideration in the interpretation of cephalometric radiographs, American Journal of Physical Anthropology. 1958 16: 213–214.
31. Periago DR, Scarfe WC, Moshiri M, Scheetz JP, Silveira AM, Farman AG. Linear Accuracy and Reliability of Cone Beam CT Derived 3-Dimensional Images Constructed Using an Orthodontic Volumetric Rendering Program. The Angle Orthodontist. 2008. 78(3): 387-395.
32. Proffit W R., DDS, PhD, Fields HW., Jr., DDS, MS, MSD Sarver DM., DMD, MS. Contemporary Orthodontics 4th ed. St. Louis: Mosby, 2007. Print.
33. Quintero J.C, Trosien A, Hatcher D, Kapil, S. Craniofacial imaging in orthodontics: Historical perspective/ current status, and future development. The Angle Orthodontist 69:491-505.
34. Sandstrom RA. Klapper L. Papaconstantinou S. Expansion of the lower arch concurrent with rapid maxillary expansion. AJODO. 94(4):296-302.
35. Sayin, M. O. and H. Turkkahraman . Comparison of dental arch and alveolar widths of patients with Class II division 1 malocclusion and subjects with Class I ideal occlusion. Angle Orthod 2004. 74:356–360.
36. Schwarze CW. Expansion and relapse in long term followup studies. Trans Eur Orthod Soc 1972 48:275-284.
37. Shapiro PA. Mandibular arch form and dimension. Am J Orthod. 1974 (66):58-70. 38. Steinbacher DM, Gougoutas A, Bartlett SP. An analysis of mandibular volume in
hemifacial microsomia. Plast Reconstr Surg. 2011: 127(6):2407-12. 39. Sukovic, P. Cone Beam Computed Tomography in Dentomaxillofacial Imaging.
AADMRT. 2004 Winter. 40. Suri L, Parul T. Surgically assisted Rapid Palatal Expansion: A literature review.
2008: 133: 290-302. 41. TulleyWJ, Campbell AC. A Manual of Practical Orthodontics. Bristol: J Wright
and Sons, 1960. 42. Uhde MD, Sadowsky C, BeGole EA. Long-term stability of dental relationships
after orthodontic treatment. Angle Orthod 1983. 53:240-52. 43. Uysal, T. , B. Memili , S. Usumez , and Z. Sari . Dental and alveolar arch widths
in normal occlusion, Class II division 1 and Class II division 2. Angle Orthod 2005. 75:756–762.
44. Wei, S H Y. Crainofacial width dimensions. Angle Orthodontists 40: 141-147.

xi
LIST OF FIGURES
Figures 1- 3 CBCT slices of anterior landmarks
Figures 2- 3 CBCT slices of posterior landmarks
Figure 3- Class I mandibular transverse measurement box plot
Figure 4- Class II mandibular transverse measurement box plot
Figure 5- Class I/II mandibular transverse measurement box plot

xii
LIST OF TABLES
Table 1. Seven different width measurements for Class I patients (used for initial 20 Class I patients). Concordance determined through the calculation of interclass correlation coefficients and their 95% confidence interval
Table 2. Anterior:posterior width ratios evaluated, pilot study
Table 3: Anterior:posterior actual width ratios generated
Table 4: Pilot study landmark identification and intra-rater correlation
Table 5: Class I transverse measurements
Table 6: Class II transverse measurements
Table 7: Class I anterior:posterior width ratio Table 8: Class II anterior:posterior width ratio

1
I. BACKGROUND AND LITERATURE REVIEW
A. Background
Transverse measurements of the craniofacial complex have received
renewed interest in the field of orthodontics with the advent of 3-dimensional imaging
capabilities (Cho 2009). Posterior-anterior (PA) cephalogram analysis, while not new
to the field of orthodontics, often focuses on the identification of craniofacial
asymmetries. (Quintero1999) Historically, mandibular transverse measurements
played a minor role in the radiographic analysis of orthodontic patients with analyses
such as Grummons’ and Rickett’s Rocky Mountain, using jugal point and antegonial
notch mainly to relate the posterior mandible and maxilla (Grummons 1987, Ricketts
1981). Grummons used these points in combination with midline and lateral skeletal
landmarks to identify asymmetry (Grummons 1987, 2004), while Ricketts used them
to identify discrepancies between respective jaws comparing the ratios created to an
age adjusted index (Ricketts 1981) or as reference points in creating lateral borders
with which to judge jugal point in the maxilla. Both advanced the clinically useful
information obtained from frontal cephalometric analysis working within the
constraints of a traditional imaging.
Skeletal mandibular anterior landmarks have never been a part of a PA ceph
analysis. While Grummons and Ricketts both incorporated the anterior dental
landmark of the mandibular canine as the most reliable landmark with traditional PA
cephalometry (El-Mangoury et al. 1987), their lack of anterior skeletal landmarks
leaves the possibility of undiagnosed transverse discrepancies mesial to the
antegonial notch. In addition, these analyses marked the incisal tip of the mandibular
2
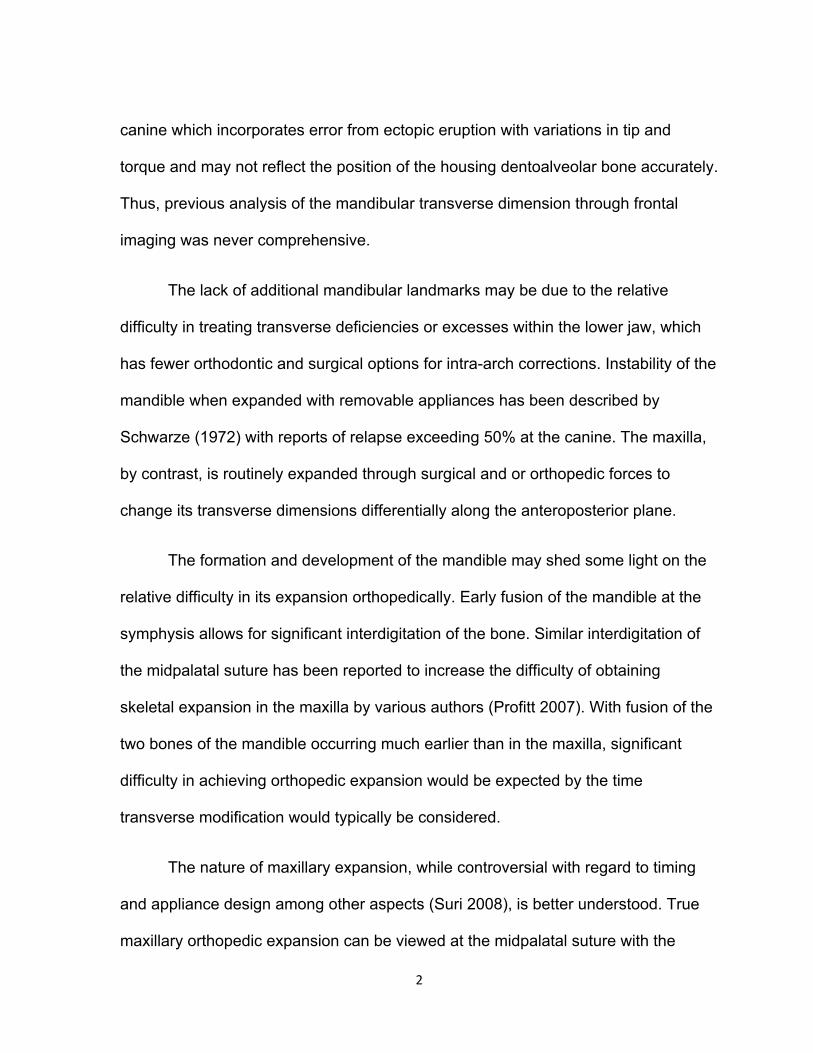
canine which incorporates error from ectopic eruption with variations in tip and
torque and may not reflect the position of the housing dentoalveolar bone accurately.
Thus, previous analysis of the mandibular transverse dimension through frontal
imaging was never comprehensive.
The lack of additional mandibular landmarks may be due to the relative
difficulty in treating transverse deficiencies or excesses within the lower jaw, which
has fewer orthodontic and surgical options for intra-arch corrections. Instability of the
mandible when expanded with removable appliances has been described by
Schwarze (1972) with reports of relapse exceeding 50% at the canine. The maxilla,
by contrast, is routinely expanded through surgical and or orthopedic forces to
change its transverse dimensions differentially along the anteroposterior plane.
The formation and development of the mandible may shed some light on the
relative difficulty in its expansion orthopedically. Early fusion of the mandible at the
symphysis allows for significant interdigitation of the bone. Similar interdigitation of
the midpalatal suture has been reported to increase the difficulty of obtaining
skeletal expansion in the maxilla by various authors (Profitt 2007). With fusion of the
two bones of the mandible occurring much earlier than in the maxilla, significant
difficulty in achieving orthopedic expansion would be expected by the time
transverse modification would typically be considered.
The nature of maxillary expansion, while controversial with regard to timing
and appliance design among other aspects (Suri 2008), is better understood. True
maxillary orthopedic expansion can be viewed at the midpalatal suture with the

3
greatest amount occurring anteriorly and inferiorly (Profitt 4th ed.). However, most
clinicians appreciate the expansion needed and gained through study models and
clinical impression, not obtaining a PA cephalogram to appreciate skeletal change.
Growth and mandibular transverse development is modified through the
interplay of resorption and apposition. Changes in the width of the mandible occur
largely through resorption on the infero-medial surfaces with deposition of bone on
the lateral aspect of the mandible (Basavaraj 2011). This allows the mandible to
widen as it extends sagittaly through deposition at the posterior ramus. While this
may be appreciated through anthropological studies it is difficult to quantify these
changes in the mandible particularly when there is currently only one landmark for
transverse evaluation. Changes with adolescent growth of interdental widths also
make this difficult to appreciate as they show little change beyond seven years of
age (Lux 2004)
The justification for an additional radiograph to assess the transverse
dimension with minimal diagnostic value left only 13% of orthodontists routinely
using PA cephs (Gotlieb 1990) as compared to 69-82% for lateral cephs. (Gottlieb
1990). This disparity in use of PA radiographs when compared to lateral
cephalograms can be explained by three specific barriers: 1) historical difficulties in
handling differential magnification with traditional two-dimensional images, (Cho
2009) in combination with error arising from head orientation relative to the film
(Quintero et al. 1999). 2) a shortage of accepted landmarks within the craniofacial
region (Ricketts 1981) and 3) additional radiation dosage. All of these issues have

4
hindered widespread use of mandibular transverse imaging and analysis. These
barriers are undoubtedly interconnected, but most likely begin with the lack of
accepted landmarks and the resulting lack of perceived benefit from additional
imaging.
The attempt to analyze PA cephalograms has been complicated clinically by
the varying distances of the structures from the film. The differential magnification
created by the depth of the imaged head necessitates additional mathematical
corrective measures, such as the method of similar triangles proposed by Wei and
Adams (1963, 1970). Without adjustment using these protocols, the structures more
distant from the film or sensor will appear larger and the distances separating two
landmarks in that plane would appear greater than normal. This creates difficulties
and adds complicated steps for clinicians that would use these images.
Use of the antegonial notch (or gonia) as the sole landmark with which to
evaluate the width of the mandible fails to demonstrate transverse discrepancies at
other points along the length of the mandible. This leaves mandibular width analysis
defined by only two planes of space. In addition, problems are encoutered with the
consistent location of the antegonial notch landmark which is subject to
interpretation from different clinicians. If the landmark is placed significantly anterior
or posterior due to the lack of a defined point along the curvature of the inferior
border, the determined width would vary with the taper of the mandible and
incorrectly estimate its width when compared to a maxillary skeletal landmark.

5
While some knowledge of the posterior aspect of the lower jaw is obtained in
this way, the 3-dimensional mandible is left completely without quantification of the
anterior aspect where the majority of the teeth lie (Ricketts 1981). Transverse
deficiencies or excesses in the mandible may be undiagnosed since the tools for
measurement have never been fully used or even developed. Identifying
discrepancies along the length of the mandible could provide the clinician with
information to impact treatment decisions and ultimately open new possibilities in
treatment modalities. Incorporating anterior landmarks in the transverse analysis of a
2D image, however, is complicated by overlap of structures and limited research of
norms for this area. Imaging techniques have changed rapidly over the past decade
and provide new opportunities for investigation of the craniofacial complex in all
dimensions. The growing prevalence of these advanced imaging techniques offers
the opportunity to quantify the measures cephalometrically and develop norms to
add to anteroposterior and vertical measures and norms (Cho 2009).
Treatment of transverse deficiencies within the mandible has been attempted
for quite some time. McNamara, in his text (2001) and others have advocated the
use of a removable expansion device, such as the Schwartz appliance, in an attempt
to correct occlusal relationships and increase space available within the dental arch.
Claims of true skeletal expansion with this or other appliances have met great
skepticism with various authors citing over-expansion of the mandibular arch leading
to relapse of intercanine width on long term follow-up (Tulley et al 1960,Schwarze
1972). Both Schwarze and Brust (1992) report significant relapse following

6
mandibular intercanine expansion. One explanation for this relates to the lack of an
immature suture within the corpus of the mandible to split with orthopedic force.
Without a split of the body of the mandible the dentoalveolar segments are left as
the point of least resistance. This leads to buccal tipping of the mandiblular teeth
with an increased possibility for relapse if the buccal segments were initially upright
or buccaly inclined. Other studies did; however, find that the mandibular intercanine
width might be slightly expanded when maxillary expansion accompanied this
change (Haas 1961, 1965, Sandstrom 1988) as well as when a pre-existing Class II
div 2 dental relationship exists (Shapiro 1974).
Distraction osteogenesis (DO) has received increasing attention in the
medical and orthodontic fields within the last ten years. This technique requires a
surgical split at the symphysis followed by slow expansion, which allows hard and
soft tissue adaptation, thus increasing the range of possible movements as well as
decreasing the amount of expected relapse. DO, as described by Ilizarov (DO
reference) in the 1950s, increases long bone length through slow and continuous
movement of two segments of bone away from each other following a controlled and
stabilized fracture. The potential advantage when considering transverse changes in
the mandible is the opportunity for adaptation of the soft tissues within the
temporomandibular joint. Gunbay (2009) reported well tolerated expansion of the
mandible and no lasting dysfunction of the temporomandibular joint with a bone born
distractor achieving a mean of 6.48mm of expansion. With this much potential for
change in the mandibular transverse dimension, guidelines outside of dental

7
measures could prove helpful. Mandibular transverse ideals need to be identified so
that the clinician may know the end point in treating with expansion or constriction.
Historically, many assessments examining both pre- and post-treatment
analysis of transverse changes were accomplished through study models and dial
type calipers or more recently digitally scanned models. Several of these studies
evaluated pre-treatment factors that influenced post-retention stability (Kahl-Nieke
et al. 1996, Suri 2008). Notably, increased initial constriction of the intermolar and
intercanine widths as well as severe crowding were included as an indicators for
increased incidences of relapse post-expansion (Kahl-Nieke et al. 1996). That is, the
greater the anomaly pre-treatment, the greater the tendency toward relapse post-
treatment. However, measurements made from dental casts may allow only
inferences about the skeletal relationships and their changes. Increases in arch
width with treatment and decreases in arch width post-treatment are assessed only
through the dental relationships.
These types of measurements are a convenient approach to assessing the
changes in tooth position, both absolute width and inclination. However, skeletal
changes cannot be measured directly from this information. The problem with relying
on dental measurements in determining transverse information is they leave the
skeletal changes underreported or unreliable. Madjidi et al. (2009) described a
method for evaluating transverse changes within the mandible following mandibular
narrowing that removed the reliance on axial inclinations of the teeth or the need for
additional radiographic exposure. Using semitransparent occlusal tracings of the

8
mandibular dentition marked with a sagittal, posterior and angular line, overlays of
different time points allowed measurement of the angular changes from anterior to
posterior. This method also accounted for the sagittal changes seen from rotation
about the symphseal osteotomy which could easily go unnoticed. While the Madjidi
method removes the error from dental movement, similar to other dental evaluations,
the measurements cannot differentiate between skeketal and dental alterations.
Mandibular deficiency in the antero/posterior dimension may have been
recognized from the earliest times and quantified since the advent of the lateral
cepholagram. The lateral ceph and its measures have guided orthodontic analysis
and treatment of class II skeletal discrepancies since the middle of the 20th century.
While a concomitant transverse deficiency in those patients presenting with an
anterior/posterior deficiency has been suspected, it has been difficult to document
through skeletal measures and analyses. Recent research with computed
tomography examining patients with hemifacial microsomia for example has shown
corresponding volumetric deficiencies even of the unaffected hemimandible.
(Steinbacher et. al 2011). This is suggestive of the three dimensional nature of
mandibular hypoplasia, and demonstrates the need for a fresh look at mandibular
transverse analysis.
The volumetric studies required a more sophisticated model and view of the
imaged structures. The ability to isolate areas of interest in three dimensions creates
an opportunity to view skeletal structures without the need for surgical exposure or
estimations from two dimensional images. With cone beam computed tomography,

9
CBCT, the number of barriers to transverse analysis is significantly reduced and it
potentially provides a better platform to construct the measurements for analysis of
mandibular transverse deficiencies or excesses.
CBCT has emerged from the culmination of years of refinement of the
scanning technologies initially developed for medical use. Its immediate forerunner,
the conventional CT, suffered from many negatives, making it difficult to justify its
use in dentistry. Beyond the cost to the provider to obtain a machine or, more likely,
the necessity to source out the imaging, the large amount of radiation required and
the time needed to capture the image hindered its adoption by dental professionals.
The improved image produced by these medical grade CT scanners is undeniable.
Incorporating the third dimension in records acquisition permits an evaluation of the
depth of the image where overlapping structures can be segmented separately and
viewed individually.
Far from a scaled down version of the conventional CT, CBCT represents an
improvement for head and neck imaging in many ways over the third generation
conventional CTs most commonly seen in medical use today (Sukovic 2004). CBCT
devices emit a conical array of beams which are captured on two dimensional
scanners. This conical beam of electrons increases the captured amount of
information from one rotation about the subject. Movement artifact and radiation
exposure can be minimized without the need for expensive fast moving pieces
necessary to accelerate image acquisition in conventional CTs designed for the
whole body (Sukovic 2004). This is possible because the larger two dimensional

10
detector obviates the need for multiple slices (ie. exposures) that must then be
stacked to create three dimensional images. Thus, the image can be obtained faster
and with minimal motion artifact which enhances image quality while decreasing
radiation exposure.
The emergence of 3-D imaging into orthodontics has removed the need for an
additional image to be acquired for transverse analysis. While concerns remain
relating to the potential increase in exposure when comparing lateral cephalograms
to cone beam CTs, it is important to note that additional information, like the frontal
ceph equivalent, is made available to the practitioner. With increased interest in
reducing patient exposure to radiation, this is indeed a large step forward in
increasing demand for, and usage of, a transverse analysis. The method of
acquisition and reconstruction of the CBCT eliminates the differential magnification
that complicated the two dimensional image analysis and current machines offer
various modes to reduce radiation exposure (Durack 2011). This may involve more
focused or smaller viewing areas or settings that adjust the resolution so that
adequate analysis doesn’t require overexposure. Incorporating copper filtration
would also reduce exposure when using CBCT and has been shown to reduce
radiation exposure by >40% (Ludlow 2011). The ability to remove fore- and
background clutter through slices simplifies the location of many points and
eliminates the need for shift shot techniques or multiple exposures for location of
points of interest (Bernardes et al 2012). Current scanners have a range of possible
exposure settings and resultant radiation exposure. However, the majority of scans

11
used for orthodontics expose the patient to between 30 – 80 µSv, for whole head
images as compared to the roughly 24µSv required for a digital panoramic and
lateral cephalogram (Miracle 2009). These exposure amounts also do not
incorporate an additional PA cephalogram or various anterior periapical films for
adult patients which can help when evaluating the initial periodontal status.
CBCT offers a larger data set from each acquired image. Image acquisition
occurs through a process that produces a three dimensional image from one rotation
about the subject with computer software algorithms that build the image from voxels
(the volumetric base image unit) (Cevidanes 2006). These renderings can be
viewed and manipulated in three dimensions to quickly assess the patient. Images
can also be sliced at any point in the coronal, sagital, or axial planes eliminating the
overlap that complicates traditional or digital two dimensional PA films (Quintero
1999). These slices offer undistorted information and images at any point along the
mandible which allows true three dimensional evaluation rather than a scan of the
computer generated renderings (Berco 2009, Periago 2008). However, use of the
information obtained from CBCT requires complex software to manipulate the data
into a more intuitive format for clinical use (Cevidanes 2006, De Oliveira 2009). The
computing power necessary to manipulate the data generated from these type of
scanners has only recently been available at costs that allow for easy incorporation
into smaller medical or dental practices (Sukovic 2004). Cheaper memory and faster
processors made the migration into routine dental practice a reality and have
provided valuable insight in implant dentistry and orthodontics in particular.

12
Moreover, the wealth of information obtained from a single scan makes it possible to
fully evaluate a patient in three dimensions using comprehensive imaging for
comprehensive orthodontics.
Our research aims to establish reliable anterior and posterior landmarks for
the mandible in an initial pilot study which provides a basis for construction of a
width ratio for the mandible of a normal class I patient population. Once Class I
normal ratios are identified, a separate Class II population, due to mandibular
deficiency, were evaluated. The AP width ratio measures were then compared
against the norms from the Class I population to determine if a mandibular
transverse deficiency in the class II population accompanies the AP deficiency.

13
II. OBJECTIVES
A. Overall Objective
The purpose of this study was to first identify reliable landmarks within the
mandible for a Class I sample, then utilize these landmarks to create
anteroposterior width ratios. During this initial or pilot study, both posterior
and anterior landmarks were evaluated in a Class I control group. This
enabled the creation of an anteroposterior (A-P) width differential for a Class I
population in the main focus of the study. A Class II sample due to
mandibular A-P deficiency was then identified and an AP width differential
created for comparison to the Class I group.
B. Specific Hypotheses
There is no difference in mandibular transverse measurements between
Class I and Class II patients due to anteroposterior hypoplasia of the
mandible.

14
III. MATERIALS AND METHODS
PART 1- Class I subjects
This retrospective study included patients who were evaluated at the Tri-Service
Orthodontic Residency Program with pretreatment CBCTs on file, taken on Classic i-
CAT machines (Imaging Sciences International, Hatfield, PA). After a search of the
program’s Dolphin Management database, 49 subjects were selected based on
inclusion criteria to comprise the Class I normal group. These met the following
criteria:
1. Be at least 14 years old for female or 16 years old for male subjects
2. Skeletal Class I with bilateral Class I molars and canines, with an ANB of
2°-5°.
3. Non-ectopic canines (no impactions)
4. No crossbites or transverse dental compensations (as diagnosed by the
treating resident/staff doctor)
5. Have mandibular plane value (SN-MP) less than 38 degrees
6. Have less than 8mm crowding.
A faculty member not associated with the study then approved all study patients
from the Tri Service Orthodontic Residency Program (TORP) archived patient

15
database. Patient name, age, and any other personal information were de-identified.
Each patient’s CBCT was then identified by “MAN-I” and an identification number “1-
49”, and resaved in the patient database for the examiner to view. The examiner
oriented and saved each radiograph in simulated natural head position, with
Frankfort horizontal parallel to the floor and the line connecting midpoints of Christa
Galli (CG) and Anterior Nasal Spine (ANS) perpendicular to the floor. All landmarks
were labeled using the Dolphin 3D software application (Dolphin Imaging, and
Management, Chatsworth, CA) and measured in the transverse plane. The
investigator utilized measurement tools in Dolphin Imaging Software, (Dolphin
Imaging Software, California) and after measuring at three separate time points,
these values were averaged and standard deviation derived.
As a pilot study, the first 20 images were used to measure bilateral landmarks.
Three anterior and four posterior landmarks in the mandible were identified by one
investigator directly on slices made from these pre-existing CBCTs. The landmarks
identified are shown in Figures 1 and 2 and described below:
Anterior bilateral landmarks identified are: 1. Mental foramena (MF) 2. Canine root
apex (CA) 3. Anterior alveolar ridge (AvRCa) measured at the greatest alveolar
convexity below the canine. Posterior bilateral landmarks are: 1. Antegonial notches
(AN) 2. Lingula (L) 3. Intermolar width at mandibular first molar (central fossa of the
mandibular first molars or Man 6) 4. Alveolar ridge at mandibular first molar (AvRM)
at the greatest alveolar convexity below the mesial buccal cusp of the first molar.

16
All landmarks were labeled using the Dolphin 3D software application (Dolphin
Imaging, and Management, Chatsworth, CA) and measured in the transverse plane
on the initial 20 images. Measurement tools of Dolphin Imaging Software (Dolphin
Imaging Software, California) were utilized. Landmarks were located and resulting
widths measured three times separated by one week between each timepoint, and
averaged by the one examiner. Standard deviations were also determined. The
examiner then identified the landmarks providing the best ease of location and with
the most consistent reproducibility before beginning Part II of the study. ( Table 1)
Table 1. Seven different width measurements for Class I patients (used for initial 20 Class I patients). Concordance determined through the calculation of interclass correlation coefficients and their 95% confidence interval
Widths Measurement 1 Measurement 2 Measurement 3 Mean Standard Deviation
MF-‐MF
CA-‐CA
AvRCa-‐AvRCa
AN-‐AN
Man 6-‐Man 6
L-‐L
AvRM-‐AvRM

17
After the most reliable anterior and posterior transverse landmarks were identified,
Part 2 of the study was initiated.
PART 2- The remaining 29 Class I normal subjects were evaluated at the points
identified from the pilot study and combined with the 20 pilot study subjects to
determine the anterior to posterior width ratio in the Class I normal group. Once
completed evaluation of the Class II patients was initiated.
Class II subjects were selected based on the inclusion criteria for the Class II group
due to mandibular A-P deficiency which included:
1. Be at least 14 years old for female, and 16 years old for male subjects. 2. Skeletal Class II with bilateral Class II molars and ANB ≥ 5°.
3. No ectopic canines (no impactions)
4. No crossbites or transverse dental compensations (as diagnosed by the treating resident/staff doctor).
5. Have a mandibular plane value (SN-MP) lower than 38°.
6. Less than 8mm crowding in either arch
CBCTs were reviewed, landmarks identified, mean widths and standard deviations
noted, these were identified by “MAN II” followed by an identification number “1-30”.
Anterior and posterior width ratios were determined based on the landmarks
identified in Part I. A summary of possible calculated ratios to be measured in the
study is summarized in Table 2. Based on the results of the pilot study and a desire
to incorporate both skeletal and dental landmarks, two anterior and two posterior

18
locations were chosen and the final ratios summarized in Table 3. This, in turn, will
allow comparison of the anterior to posterior width ratios of the Class I normal and
the Class II mandibular deficient groups.

19
Table 2. Anterior:posterior width ratios evaluated, pilot study
POSTERIOR AN L Man 6 AvRM ANTERIOR MF RATIO RATIO RATIO RATIO CA RATIO RATIO RATIO RATIO AvRCa RATIO RATIO RATIO RATIO

20
Table 3: Anterior:posterior actual width ratios generated
POSTERIOR AvRM L ANTERIOR MF RATIO RATIO CA RATIO RATIO

21
Fig. 1: CBCT slices of anterior landmarks
Anterior Landmarks: 1. Mental Foramen (MF), 2. Canine Apex (CA) 3. Anterior Alveolar Ridge at Canine (AvRCA).
MF-MF CA-CA

22
AvRCA-AvRCA

23
Fig. 2: CBCT slices of posterior landmarks
Posterior Landmarks:1. Antegonial Notch (AN), 2. Lingula (L) 3. Alveolar Ridge at Mesial Buccal Cusp of First Molar (AvRM) 4. Central Fossa of Mandibular First Molar (Man 6)
AN-AN L-L

24
AvRM-AvRM Man 6- Man6

25
IV. RESULTS
Table 4: Pilot study landmark identification and intra-rater correlation
PILOT STUDY - CLASS I PATIENTS (1-20 OF 49)
Raw Average
Std Dev of means
Intrarater reliability (avg std dev/pt)
ANTERIOR MF-MF 49.90821 2.495265 0.705593
CA-CA
20.29833 2.995971 0.730941
AvRCA-AvRCA 28.95667 2.756069 0.886714
POSTERIOR AN-AN 81.04545 4.794471 1.826352
L-L
78.02917 3.390514 0.844762
AvRM-AvRM
51.7 3.071535 0.441906
Man6-Man6
41.32333 3.099615 0.551425
In Table 4 the pilot study results are categorized. The general location and individual
landmarks are listed in the first two columns. From the twenty Class I subjects
evaluated in the pilot study, the means of the transverse measurements are listed in
column three with their standard deviation in column four. The fifth column
represents the statistic evaluated to deduce intra-rater reliability. Since each
landmark was located at three different time points, the mean of the standard
deviations was used as an indicator of reproducibility.

26
Table 5: Class I transverse measurements
CLASS I PATIENTS (n=49)
Raw Average
Std Dev of mean Avg st dev/pt
ANTERIOR CA-CA 20.23 2.682 0.598
MF-MF 46.82 3.04 0.706
POSTERIOR AvRM-AvRM 52.68 2.51 0.414
L-L 78.67 4.45 0.547
Table 5 displays the data accumulated once the landmarks deemed to have the
lowest reproducibility in the pilot study were excluded. Here again the means,
standard deviations and intra-rater reliability are displayed in the third, forth, and fifth
column respectively. While some of the reproducibility figures varied from those in
the pilot study every landmark had less variability.

27
Figure 3: Class I mandibular transverse measurement box plot
0
10
20
30
40
50
60
70
80
90
100
MF-‐MF CA-‐CA L-‐L AvRM-‐AvRM
Mandibular Landmarks
Class I Transverse Measurements

28
Figure 3 above demonstrates the distribution of the data in quartiles about the
median for each landmark. The midline or color break for each block represents the
median with the lower block representing the 1st quartile and the upper block
representing the 3rd quartile of values. The lines extending beyond the colored boxes
identify the maximum and minimum values for each measurement.
Table 6: Class II transverse measurements
CLASS II PATIENTS (n=30)
Raw Average Std Dev
Intrarater reliability (avg std dev/pt)
ANTERIOR CA-CA 18.01 2.19 0.366035036 MF-MF 45.83 2.59 0.358668458 POSTERIOR AvRM-AvRM 51.7 3.14 0.269364922 L-L 76.84 3.64 0.331660755
Similar to the table 5 above, table 6 displays the data collected for the Class II
subjects. Again, the third, fourth, and fifth columns list the means, standard
deviations, and intra-rater reliabililty. The intra-rater reliability values once again
showed improvements over the pilot study.

29
Figure 4: Class II mandibular transverse measurement box plot
Figure 4 above demonstrates the distribution of the data in quartiles about the
median for each landmark in the class II group. The midline or color break for each
block represents the median with the lower block representing the 1st quartile and
0
10
20
30
40
50
60
70
80
90
MF-‐MF CA-‐CA L-‐L AvRM-‐AvRM
Mandibular Landmarks
Class II Transverse Measurements

30
the upper block representing the 3rd quartile of values. The lines extending beyond
the colored boxes identify the maximum and minimum values for each
measurement.
Figure 5: Class I/II mandibular transverse measurement box plot
0
10
20
30
40
50
60
70
80
90
100
MF-‐I MF-‐II CA-‐I CA-‐II L-‐I L-‐II AvRM-‐I AvRM-‐II
Mandibular Landmarks
Class I/II Transverse Measurements

31
In Figure 5 above the distribution of the data from the Class I and Class II subjects
are placed together for easier comparison of the medians and quartiles. The T test
values included at the end of the results section verify that only the canine apex
demonstrated a statistically significant difference between Class I and Class II
subjects (P=.0003) among the landmarks analyzed.
Table 7: Class I anterior:posterior width ratio
Anterior to Posterior Width ratios
Raw Average Std Dev
ANTERIOR MF-LL
0.601423 0.040283
MF-AvRM
0.889766 0.055678
POSTERIOR CA-LL
0.257651 0.034128
CA-AvRM
0.383987 0.04723
Combining the anterior and posterior landmarks to create a ratio of the anterior to
posterior transverse dimensions provided the data charted in Tables 7 and 8. The
means were obtained from all 49 class I subjects in Table 7 and all 30 subjects in
Table 8 with standard deviations included. A skeletal (mental foramen to lingual, MF-
LL) and dental (canine apex to alveolar ridge at the 1st molar, CA-AvRM) ratio were
constructed. Combined skeletal and dental ratios were also established to complete
the data in Tables 7 and 8.

32
Table 8: Class II anterior:posterior width ratio
Anterior to Posterior Width ratios
Raw Average Std Dev
ANTERIOR MF-LL
0.597442 0.039699
MF-AvRM
0.888493 0.059006
POSTERIOR CA-LL
0.234872 0.030154
CA-AvRM
0.349614 0.047362
Comparing the Class I with the Class II subjects ratios revealed a statistically
significant difference (P=..0024) in the dental ratio ( CA-AvRM on pg 37). This also
revealed a statistically significant difference (P=.0036) in the combined
skeletal/dental ratio (CA-LL on pg 37) involving the canine apex. Neither the
established skeletal ratio (MF-LL) nor the combined skeletal/dental ratio (MF-AvRM)
provided a statistically significant difference between the two groups with P values of
.9029 and .09234 respectively.

33
-‐-‐-‐-‐-‐-‐-‐-‐-‐-‐-‐-‐-‐-‐-‐-‐-‐-‐-‐-‐-‐-‐-‐-‐-‐-‐-‐-‐-‐-‐-‐-‐-‐-‐-‐-‐-‐-‐-‐-‐-‐ landmark=AVRM -‐-‐-‐-‐-‐-‐-‐-‐-‐-‐-‐-‐-‐-‐-‐-‐-‐-‐-‐-‐-‐-‐-‐-‐-‐-‐-‐-‐-‐-‐-‐-‐-‐-‐-‐-‐-‐-‐-‐-‐-‐-‐ The TTEST Procedure Variable: AVGMEAS (AVGMEAS) Class N Mean Std Dev Std Err Minimum Maximum 1 49 52.6796 2.5118 0.3588 46.1333 59.6000 2 30 51.7000 3.1440 0.5740 46.6333 60.1667 Diff (1-‐2) 0.9796 2.7669 0.6414 Class Method Mean 95% CL Mean Std Dev 95% CL Std Dev 1 52.6796 51.9581 53.4011 2.5118 2.0946 3.1380 2 51.7000 50.5260 52.8740 3.1440 2.5039 4.2266 Diff (1-‐2) Pooled 0.9796 -‐0.2977 2.2568 2.7669 2.3905 3.2851 Diff (1-‐2) Satterthwaite 0.9796 -‐0.3792 2.3384 Method Variances DF t Value Pr > |t| Pooled Equal 77 1.53 0.1308 Satterthwaite Unequal 51.355 1.45 0.1540 Equality of Variances Method Num DF Den DF F Value Pr > F Folded F 29 48 1.57 0.1651

34
-‐-‐-‐-‐-‐-‐-‐-‐-‐-‐-‐-‐-‐-‐-‐-‐-‐-‐-‐-‐-‐-‐-‐-‐-‐-‐-‐-‐-‐-‐-‐-‐-‐-‐-‐-‐-‐-‐-‐-‐-‐ landmark=CA-‐CA -‐-‐-‐-‐-‐-‐-‐-‐-‐-‐-‐-‐-‐-‐-‐-‐-‐-‐-‐-‐-‐-‐-‐-‐-‐-‐-‐-‐-‐-‐-‐-‐-‐-‐-‐-‐-‐-‐-‐-‐-‐ The TTEST Procedure Variable: AVGMEAS (AVGMEAS) Class N Mean Std Dev Std Err Minimum Maximum 1 49 20.2286 2.6825 0.3832 13.8000 26.1000 2 30 18.0133 2.1860 0.3991 14.6333 22.7000 Diff (1-‐2) 2.2152 2.5071 0.5812 Class Method Mean 95% CL Mean Std Dev 95% CL Std Dev 1 20.2286 19.4581 20.9991 2.6825 2.2370 3.3513 2 18.0133 17.1971 18.8296 2.1860 1.7409 2.9386 Diff (1-‐2) Pooled 2.2152 1.0579 3.3725 2.5071 2.1660 2.9766 Diff (1-‐2) Satterthwaite 2.2152 1.1119 3.3185 Method Variances DF t Value Pr > |t| Pooled Equal 77 3.81 0.0003 Satterthwaite Unequal 70.777 4.00 0.0002 Equality of Variances Method Num DF Den DF F Value Pr > F Folded F 48 29 1.51 0.2415

35
-‐-‐-‐-‐-‐-‐-‐-‐-‐-‐-‐-‐-‐-‐-‐-‐-‐-‐-‐-‐-‐-‐-‐-‐-‐-‐-‐-‐-‐-‐-‐-‐-‐-‐-‐-‐-‐-‐-‐-‐-‐-‐ landmark=L-‐L -‐-‐-‐-‐-‐-‐-‐-‐-‐-‐-‐-‐-‐-‐-‐-‐-‐-‐-‐-‐-‐-‐-‐-‐-‐-‐-‐-‐-‐-‐-‐-‐-‐-‐-‐-‐-‐-‐-‐-‐-‐-‐ The TTEST Procedure Variable: AVGMEAS (AVGMEAS) Class N Mean Std Dev Std Err Minimum Maximum 1 49 78.6701 4.4596 0.6371 67.5333 88.2333 2 30 76.8367 3.6436 0.6652 71.2333 85.3333 Diff (1-‐2) 1.8334 4.1711 0.9669 Class Method Mean 95% CL Mean Std Dev 95% CL Std Dev 1 78.6701 77.3891 79.9510 4.4596 3.7190 5.5714 2 76.8367 75.4761 78.1972 3.6436 2.9018 4.8981 Diff (1-‐2) Pooled 1.8334 -‐0.0920 3.7588 4.1711 3.6036 4.9523 Diff (1-‐2) Satterthwaite 1.8334 -‐0.00334 3.6701 Method Variances DF t Value Pr > |t| Pooled Equal 77 1.90 0.0617 Satterthwaite Unequal 70.674 1.99 0.0504 Equality of Variances Method Num DF Den DF F Value Pr > F Folded F 48 29 1.50 0.2475

36
-‐-‐-‐-‐-‐-‐-‐-‐-‐-‐-‐-‐-‐-‐-‐-‐-‐-‐-‐-‐-‐-‐-‐-‐-‐-‐-‐-‐-‐-‐-‐-‐-‐-‐-‐-‐-‐-‐-‐-‐-‐ landmark=MF-‐MF -‐-‐-‐-‐-‐-‐-‐-‐-‐-‐-‐-‐-‐-‐-‐-‐-‐-‐-‐-‐-‐-‐-‐-‐-‐-‐-‐-‐-‐-‐-‐-‐-‐-‐-‐-‐-‐-‐-‐-‐-‐ The TTEST Procedure Variable: AVGMEAS (AVGMEAS) Class N Mean Std Dev Std Err Minimum Maximum 1 49 46.8252 3.0391 0.4342 40.8333 53.7000 2 30 45.8300 2.5926 0.4733 41.3667 49.8333 Diff (1-‐2) 0.9952 2.8791 0.6674 Class Method Mean 95% CL Mean Std Dev 95% CL Std Dev 1 46.8252 45.9522 47.6981 3.0391 2.5344 3.7968 2 45.8300 44.8619 46.7981 2.5926 2.0648 3.4853 Diff (1-‐2) Pooled 0.9952 -‐0.3339 2.3242 2.8791 2.4874 3.4183 Diff (1-‐2) Satterthwaite 0.9952 -‐0.2862 2.2766 Method Variances DF t Value Pr > |t| Pooled Equal 77 1.49 0.1400 Satterthwaite Unequal 68.87 1.55 0.1259 Equality of Variances Method Num DF Den DF F Value Pr > F Folded F 48 29 1.37 0.3641

37
The TTEST Procedure Variable: CA_AVRM (CA/AVRM) Class N Mean Std Dev Std Err Minimum Maximum 1 49 0.3840 0.0472 0.00675 0.2692 0.4869 2 30 0.3496 0.0474 0.00865 0.2837 0.4389 Diff (1-‐2) 0.0344 0.0473 0.0110 Class Method Mean 95% CL Mean Std Dev 95% CL Std Dev 1 0.3840 0.3704 0.3976 0.0472 0.0394 0.0590 2 0.3496 0.3319 0.3673 0.0474 0.0377 0.0637 Diff (1-‐2) Pooled 0.0344 0.0125 0.0562 0.0473 0.0408 0.0561 Diff (1-‐2) Satterthwaite 0.0344 0.0124 0.0563 Method Variances DF t Value Pr > |t| Pooled Equal 77 3.14 0.0024 Satterthwaite Unequal 61.328 3.13 0.0026 Equality of Variances Method Num DF Den DF F Value Pr > F Folded F 29 48 1.01 0.9648 Variable: CA_LL (CA/LL) Class N Mean Std Dev Std Err Minimum Maximum 1 49 0.2577 0.0341 0.00488 0.1730 0.3218 2 30 0.2349 0.0302 0.00551 0.1841 0.2926 Diff (1-‐2) 0.0228 0.0327 0.00758 Class Method Mean 95% CL Mean Std Dev 95% CL Std Dev 1 0.2577 0.2478 0.2675 0.0341 0.0285 0.0426 2 0.2349 0.2236 0.2461 0.0302 0.0240 0.0405 Diff (1-‐2) Pooled 0.0228 0.00769 0.0379 0.0327 0.0282 0.0388 Diff (1-‐2) Satterthwaite 0.0228 0.00810 0.0375 Method Variances DF t Value Pr > |t| Pooled Equal 77 3.01 0.0036 Satterthwaite Unequal 67.311 3.10 0.0028

38
The TTEST Procedure Variable: CA_LL (CA/LL) Equality of Variances Method Num DF Den DF F Value Pr > F Folded F 48 29 1.28 0.4816 Variable: MF_AVRM (MF/AVRM) Class N Mean Std Dev Std Err Minimum Maximum 1 49 0.8898 0.0557 0.00795 0.7698 1.0100 2 30 0.8885 0.0590 0.0108 0.7742 1.0286 Diff (1-‐2) 0.00127 0.0570 0.0132 Class Method Mean 95% CL Mean Std Dev 95% CL Std Dev 1 0.8898 0.8738 0.9058 0.0557 0.0464 0.0696 2 0.8885 0.8665 0.9105 0.0590 0.0470 0.0793 Diff (1-‐2) Pooled 0.00127 -‐0.0250 0.0276 0.0570 0.0492 0.0676 Diff (1-‐2) Satterthwaite 0.00127 -‐0.0255 0.0281 Method Variances DF t Value Pr > |t| Pooled Equal 77 0.10 0.9234 Satterthwaite Unequal 58.697 0.10 0.9246 Equality of Variances Method Num DF Den DF F Value Pr > F Folded F 29 48 1.12 0.7070 Variable: MF_LL (MF/LL) Class N Mean Std Dev Std Err Minimum Maximum 1 49 0.5963 0.0403 0.00575 0.5016 0.6776 2 30 0.5974 0.0397 0.00725 0.5141 0.6734 Diff (1-‐2) -‐0.00114 0.0401 0.00929

39
The TTEST Procedure Variable: MF_LL (MF/LL) Class Method Mean 95% CL Mean Std Dev 95% CL Std Dev 1 0.5963 0.5847 0.6079 0.0403 0.0336 0.0503 2 0.5974 0.5826 0.6123 0.0397 0.0316 0.0534 Diff (1-‐2) Pooled -‐0.00114 -‐0.0196 0.0174 0.0401 0.0346 0.0476 Diff (1-‐2) Satterthwaite -‐0.00114 -‐0.0196 0.0174 Method Variances DF t Value Pr > |t| Pooled Equal 77 -‐0.12 0.9029 Satterthwaite Unequal 62.162 -‐0.12 0.9026 Equality of Variances Method Num DF Den DF F Value Pr > F Folded F 48 29 1.03 0.9524
V. DISCUSSION

40
This study first demonstrated that there are anterior and posterior landmarks
in the mandible that are more consistently located through coronal and axial CBCT
slices than the antegonial notch. Both a skeletal and dental landmark in the anterior
and posterior were chosen following the pilot study to assess the width of the
mandible. In the anterior the mental foramen and canine apices were selected (with
intrarater reliability measurements of 0.70 and 0.73 respectively) while in the
posterior the lingula and alveolar ridge at the mesial buccal cusp of the first molar
were selected based on the intra-rater reliability assessment (with intra-rater
reliability measurements of 0.84 and 0.44 respectively) and an desire to include
skeletal components both anteriorly and posteriorly.
Mental foramen, had the best intra-rater reliability scores of the all anterior
landmarks chosen. It is a point that could prove difficult to locate in traditional PA
cephalograms due to overlap of other mandibular structures, However as a point of
initial ossification as the mandible develops lateral to Meckel’s cartilage in utero, it
should prove relatively stable during growth and development. With CBCT, this
important structure is much more easily located and provides information not often
utilized to assess the width of the anterior mandible. Beyond simple location,
evaluating this and other landmarks within the craniofacial complex with CBCT, the
true distance between two points may be measured since sagittal asymmetries are
accounted for.
Antegonial notch, in the posterior, proved difficult to locate in three
dimensions, due to the continuous curve of gonia in many patients along the inferior

41
border of the mandible. With two dimensional PA cephalograms antegonial notch
could be localized essentially along the curve of one line. Adding depth to the image
made localization difficult due to the thickness of the inferior border and the
additional curve this created. This may help to explain the intra-rater reliability scores
that it received when compared to the other posterior landmarks in this study.
The individual transverse measurements were statistically compared using
Student’s T-test for samples with normal distribution. Once these were compared
ratios were calculated combing anterior and posterior transverse measurements.
These ratios were then compared, once again utilizing Student’s T-test for samples
with a normal distribution to determine if a difference exists in the mandibular
transverse dimension between Class I and Class II populations.
The findings of this study demonstrated that Class II patients had statistically
significant differences in transverse measurements at the canine root apices when
compared with Class I normal subjects (18.0, 20.2mm respectively). This contrasts
somewhat with findings of other investigators who found only slight differences in
intercanine width within the mandible among different malocclusions and more
significant differences in the premolar and molar regions (Sayin, Uysal and Kuntz,
Huth) However, class III patients exhibited a wider alveolar width while Class II
patients exhibited a narrower width than a class I normal population according to
Slaj (Slaj et al. 2010). In this study, the transverse measures at mental foramen,
lingula and the molar alveolar ridge measured in the second half of the study
demonstrated smaller values for class II patients when compared with Class I,

42
though they were not found to be statistically significant. This would lend some merit
to the assumption that there is a corresponding transverse deficiency in patients with
mandibular AP hypoplasia. However, the lack of an absolute difference outside of
the canine apices certainly hints at the limited information provided by the transverse
measurement at gonia that has been used in previous analysis. With Ricketts and
Grummons analysis, where only the antegonial notch was used; differences
between the Class I and Class II populations might have been hidden by either the
poor reproducibility noted in the pilot study or the lack of a significant difference
between the populations in the posterior mandible.
There are difficulties when basing an analysis of the width of the mandible on
non-skeletal structures. Teeth may be malposed in individuals and do not have to
reflect the width of the skeletal structures they are housed in. It is important to note
that teeth are not the only landmarks presenting with such anomalies or variance in
location. The mental foramen is a skeletal landmark yet varies in its relative AP and
veritical position in the jaw, with either dimension potentially affecting the resulting
transverse difference (Hasan 2011).
The use of canine apex in the transverse analysis incorporates the possibility
of bias with tooth position. While canine apex is not a skeletal landmark, it is a focal
point which lends itself to easier identification in comparison with a point located
along a longer curved surface, such as antegonial notch. This might explain the
relatively low scores it received in intra-rater readings as compared to the mental
foramen and the alveolar ridge at mid canine, which had intra-rater reliability scores

43
of .73, .70 and .88 repectively. Also, the significant difference noticed between
groups (mean intercanine distance of 20.2mm for the class I sample and 18.0mm for
the Class II sample with P<.05) carries additional weight with a landmark that is
proven easier to identify. Significantly displaced or impacted canines were excluded
from the samples to increase the reliable placement of the canine within the
dentoalveolar bone.
The presence of a significant difference between the transverse measures at
canine apex would lead one to suspect a difference between groups when this
measurement is included in the construction of a ratio. The combination of canine
apex with either posterior landmark yielded ratios with a statistically significant
difference between the Class I and Class II groups. Canine apex compared with the
alveolar ridge at the mandibular 1st molar (CA: AvRM) and canine apex compared to
the Lingula (CA:LL) both had P<.05 (P=.0024, and P=.0036 respectively). Mental
foramen however, failed to create a statistically significant difference when combined
with either anterior landmark (MF:AvRM P=.9234, MF-LL P=.9029). Thus the canine
apices were selected as the anterior reference in construction of the anteroposterior
width ratio.
The process of selecting the posterior landmark for inclusion in the AP width
ratio required first, evaluation of the most reliable landmark from the pilot study
(Alveolar ridge at first mandibular molar with a .44 intra-rater reliability score was the
most reproducible point in the posterior or anterior mandible). In combination with
Lingula, this satisfied our original aim of identifying a skeletal landmark to assess

44
mandibular width. It was concluded that the wide variation found in posterior
landmark identification made use of the most reproducible landmark more
appropriate for inclusion in this ratio.
These findings suggest that there may be an actual difference in the
transverse dimension, or taper, of the mandible between Class I and Class II
populations. Use of lingula, which fell just outside the level of significance with
P=.06, and the alveolar ridge at the first molar, in combination with the mandibular
canine apex can be used to create an AP width ratio. These ratios both
demonstrated a statistically significant difference from the Class I population with
smaller ratios indicative of mandibular anterior narrowing.

45
VI. CONCLUSION
Significant changes with treatment in the width of the mandible either
skeletally or dentally are often viewed with much skepticism from the orthodontic and
surgical communities. Indeed, there are definite limitations to corrections in this
dimension and jaw. With this in mind, little focus has been placed on assessing the
lateral excesses and deficiencies radiographically. As the lateral ceph gained
popularity in use during the second half of the last century for diagnosis and
treatment planning, the PA ceph, if taken at all, was often looked at mainly for
asymmetrical surgical cases. However, critical and objective assessment of any
dimension should proceed the methods for correction. Hopefully the introduction of
CBCT into orthodontics around 10 years ago will ultimately provide the platform to
better understand and evaluate the craniofacial complex in all dimensions so that
treatment may follow accordingly.
Improved surgical techniques may yet allow increased manipulation of the
mandible in treatment. While orthodontic limitations (ie. intercanine and alveolar
bone width) seem to have been reinforced with the passage of time and extensive
research, surgical considerations have been adjusted continually through the years
with the introduction of new and varying orthognathic procedures including
distraction to the midface and mandible. Utilizing an AP width ratio would potentially
allow the clinician to analyze prior to treating the mandible at the point of deficiency.
Antegonial notch would no longer be the sole point of reference when evaluating the
width of the mandible.

46
The results of the study demonstrated that there is a statistically significant
difference between canine root apices in Class I and Class II patients. The Class II
group had a mean intercanine distance 2.2 mm less than their Class I counterparts.
While no significant differences were found between the two groups in either of the
posterior landmarks analyzed, the ratios generated indicated significant differences
between Class I and Class II groups regardless of the posterior landmark used. This
would indicate that there may well be an increased in taper for the Class II
hypoplastic mandible when compared with a Class I normal population.
There were conflicting data, however, with mental foramen and the alveolar
ridge at the canine failing to demonstrate significant differences between groups.
Without collaboration of an anterior constriction in Class II patients from the alternate
landmarks, the intercanine distance must be viewed with suspicion. Future research
may help to identify additional landmarks in the anterior and posterior mandible with
which to analyze its transverse dimensions. This could support or refute the
conclusion that there is a difference in the transverse dimensions of Class I and
Class II patients with mandibular AP hypoplasia.
The AP width ratios that demonstrated a greater constriction in the anterior
mandible can be useful however. Further subdividing Class II patients between Div I
and Div II might demonstrate a more significant
Further investigation may yield additional points with which transverse ratios
could be established. Reliable anterior skeletal landmarks should be more indicative
of the taper of the mandible itself and thus would be of interest in future studies.

47
Identification of these landmarks may improve with future improvements in the
imaging technique or machines. The high spatial resolution offered by CBCT is
offset by the low contrast resolution. This may make the image extremely accurate
dimensionally but present problems in areas of similar density in close
approximation.

48
Appendix A: Cl I Pilot Study (Seven Landmarks, n=20), Raw Data
MAN 1-01 Time 1 Time 2 Time 3 SD Mean MF-MF 48.7 48.8 48.4 0.208167 48.63333 CA-CA 24.9 23.3 22.3 1.311488 23.5 AvRCA 32.3 30.8 30.4 1.001665 31.16667 AN-AN 75.8 77 76.1 0.6245 76.3 L-L 76.6 78 78.5 0.984886 77.7 AvRM 53.9 54.1 53.9 0.11547 53.96667
Man6-6 43.3 42.5 43.4 0.493288 43.06667
MAN 1-02 MF-MF 48 47.9 45.5 1.415392 47.13333 CA-CA 14.6 13.4 13.4 0.69282 13.8 AvRCA 27.2 20.1 19.8 4.188476 22.36667 AN-AN 82.4 75.5 74.4 4.336281 77.43333 L-L 78.1 75.7 72.8 2.653928 75.53333 AvRM 51.3 51.7 50.8 0.450925 51.26667
Man6-6 41.5 40 40.2 0.814453 40.56667
MAN 1-03 MF-MF 49.7 47.9 49.6 1.011599 49.06667 CA-CA 22.3 21.4 21.7 0.458258 21.8 AvRCA 34.3 29.7 28.3 3.139002 30.76667 AN-AN 88.5 86.8 89 1.153256 88.1 L-L 84.2 86.4 84.2 1.270171 84.93333 AvRM 56.2 57 56.4 0.416333 56.53333
Man6-6 43.4 42.3 41.5 0.953939 42.4
MAN 1-04 MF-MF 50.1 50.7 50.7 0.34641 50.5 CA-CA 18.7 16.9 16.9 1.03923 17.5 AvRCA 33.3 30.4 29.7 1.908752 31.13333 AN-AN 82.9 88.5 85.4 2.805352 85.6 L-L 75.1 75.6 75.2 0.264575 75.3 AvRM 54.4 54.2 53.1 0.7 53.9
Man6-6 41.8 42.3 41.5 0.404145 41.86667

49
MAN 1-05 MF-MF 47.2 49.3 48.4 1.053565 48.3 CA-CA 23.5 22.7 23.6 0.493288 23.26667 AvRCA 31.8 31.7 31.5 0.152753 31.66667 AN-AN 83.9 85.8 84.6 0.960902 84.76667 L-L 79.6 79 79.6 0.34641 79.4 AvRM 55.9 55.4 55.3 0.321455 55.53333
Man6-6 45.3 46.6 45.2 0.781025 45.7
MAN 1-06 MF-MF 47 46.3 48.4 1.069268 47.23333 CA-CA 16.3 15.9 17.3 0.72111 16.5 AvRCA 27.1 27.4 25.9 0.793725 26.8 AN-AN 82.9 82.6 81.7 0.6245 82.4 L-L 84.6 82.4 82.1 1.36504 83.03333 AvRM 54.6 54.3 54.1 0.251661 54.33333
Man6-6 44.2 44.3 44.5 0.152753 44.33333
MAN 1-07 MF-MF 46.1 46.7 47.3 0.6 46.7 CA-CA 23 22.7 23.3 0.3 23 AvRCA 35.3 35.3 32.8 1.443376 34.46667 AN-AN 90.7 87.2 87.7 1.892969 88.53333 L-L 81.3 82.6 81.7 0.665833 81.86667 AvRM 60.7 58.6 59.5 1.053565 59.6
Man6-6 46 46.1 45.9 0.1 46
Man-08 MF-MF 42.6 42.4 42.1 0.251661 42.36667 CA-CA 18 17.4 17.9 0.321455 17.76667 AvRCA 28.6 27.3 29.1 0.929157 28.33333 AN-AN 78.2 77.8 78.3 0.264575 78.1 L-L 78.5 78.9 78.9 0.23094 78.76667 AvRM 46.3 45.7 46.4 0.378594 46.13333
Man6-6 34.2 34.8 33.7 0.550757 34.23333
Man MF-MF 45 43.5 43.5 0.866025 44

50
1-09 CA-CA 18.5 18 19.1 0.550757 18.53333 AvRCA 24.1 24.7 24.2 0.321455 24.33333 AN-AN 71.5 70.9 69.3 1.137248 70.56667 L-L 72.8 72.5 72.3 0.251661 72.53333 AvRM 50.3 49.8 49.4 0.450925 49.83333
Man6-6 36.4 38.4 37 1.02632 37.26667
Man-10 MF-MF 46.7 45.5 45.7 0.64291 45.96667 CA-CA 21.4 22.3 21.3 0.550757 21.66667 AvRCA 29 27.6 27.2 0.945163 27.93333 AN-AN 80.5 78.8 79.8 0.8544 79.7 L-L 76.2 75.5 75.8 0.351188 75.83333 AvRM 53.7 54.1 53.2 0.450925 53.66667
Man6-6 41.3 42.1 41.5 0.416333 41.63333
Man-11 MF-MF 45.7 46.1 46.3 0.305505 46.03333 CA-CA 24.8 27.2 26.3 1.212436 26.1 AvRCA 32.8 32.2 31 0.916515 32 AN-AN 89.8 87 86 1.969772 87.6 L-L 80.6 82.4 80.3 1.135782 81.1 AvRM 55.9 55.9 54.8 0.635085 55.53333
Man6-6 46.5 44.2 44.6 1.228821 45.1
Man-12 MF-MF 45.7 47.2 44.5 1.352775 45.8 CA-CA 22 22.8 22.2 0.416333 22.33333 AvRCA 28.3 27.3 28.5 0.64291 28.03333 AN-AN 84.3 82.4 77.6 3.453018 81.43333 L-L 81.8 78.2 77.4 2.343786 79.13333 AvRM 50.8 51.6 50.8 0.46188 51.06667
Man6-6 41.8 41.3 41.3 0.288675 41.46667
Man-13 MF-MF 44.7 43 44.1 0.862168 43.93333 CA-CA 17.4 17.8 17.6 0.2 17.6

51
AvRCA 27.2 27.6 27.7 0.264575 27.5 AN-AN 82.6 83.9 82.9 0.680686 83.13333 L-L 74.6 77 75.9 1.201388 75.83333 AvRM 51.4 50.1 50 0.781025 50.5
Man6-6 39.3 37.2 38.2 1.050397 38.23333
Man-14 MF-MF 44 42.9 42.4 0.818535 43.1 CA-CA 22.9 21.6 21.4 0.814453 21.96667 AvRCA 30.1 30.3 29.9 0.2 30.1 AN-AN 80.6 75.8 78.4 2.402776 78.26667 L-L 81.5 81.3 80.9 0.305505 81.23333 AvRM 55.3 54.8 54.8 0.288675 54.96667
Man6-6 43.3 43.7 44.2 0.450925 43.73333
Man-15 MF-MF 49.3 49 48.4 0.458258 48.9 CA-CA 19.7 17.8 17.2 1.305118 18.23333 AvRCA 26.8 27.3 26.8 0.288675 26.96667 AN-AN 80.1 78.5 81 1.266228 79.86667 L-L 77.7 76.9 76.7 0.52915 77.1 AvRM 50.4 50.8 50.6 0.2 50.6
Man6-6 38.7 39.4 39.3 0.378594 39.13333
Man-16 MF-MF 45 45.5 45.9 0.450925 45.46667 CA-CA 22.1 21.2 22.1 0.519615 21.8 AvRCA 30.1 29.9 29.9 0.11547 29.96667 AN-AN 77.8 80.6 77.3 1.778576 78.56667 L-L 78 77.3 76.7 0.650641 77.33333 AvRM 51.7 50.7 51.1 0.503322 51.16667
Man6-6 39.2 37.9 39 0.7 38.7
Man-17 MF-MF 47.6 46.6 46.5 0.608276 46.9 CA-CA 22.5 20.1 19.8 1.479865 20.8 AvRCA 27.5 27.5 27.5 0 27.5 AN-AN 80.9 78.3 77.5 1.777639 78.9

52
L-L 79.7 79.8 80.1 0.208167 79.86667 AvRM 54 52.7 53 0.680686 53.23333
Man6-6 42.2 41.6 41.4 0.416333 41.73333
Man-18 MF-MF 40.1 41.5 40.9 0.702377 40.83333 CA-CA 23.3 21.5 21.1 1.171893 21.96667 AvRCA 30.4 29.9 30.2 0.251661 30.16667 AN-AN 84.1 87.8 86.3 1.861003 86.06667 L-L 81 82.2 81 0.69282 81.4 AvRM 52.1 52.2 52.1 0.057735 52.13333
Man6-6 43.5 43.1 43 0.264575 43.2
Man-19 MF-MF 45.2 45.3 44.6 0.378594 45.03333 CA-CA 17.4 17.1 17.6 0.251661 17.36667 AvRCA 29.5 29.5 29.7 0.11547 29.56667 AN-AN 78.5 78 77.6 0.450925 78.03333 L-L 76.3 76.5 76.3 0.11547 76.36667 AvRM 51.4 51.7 51 0.351188 51.36667
Man6-6 41 40.4 40.6 0.305505 40.66667
Man-20 MF-MF 44.3 42.9 43.4 0.70946 43.53333 CA-CA 21.4 20 20 0.80829 20.46667 AvRCA 28.3 28.5 28.3 0.11547 28.36667 AN-AN 81.5 74.2 69.1 6.232442 74.93333 L-L 73.5 71.2 71.2 1.327906 71.96667 AvRM 48.5 48 48.5 0.288675 48.33333
Man6-6 37.2 37.7 37.4 0.251661 37.43333
Appendix B: Cl I Results (Four Landmarks, n=50), Raw Data
MAN 1-01
Time 1 Time 2 Time 3 SD Mean
MF-MF 48.7 48.8 48.4 0.208167 48.63333 CA-CA 24.9 23.3 22.3 1.311488 23.5

53
AvRCA 32.3 30.8 30.4 1.001665 31.16667 AN-AN 75.8 77 76.1 0.6245 76.3 L-L 76.6 78 78.5 0.984886 77.7 AvRM 53.9 54.1 53.9 0.11547 53.96667 Man6-6 43.3 42.5 43.4 0.493288 43.06667 MAN 1-02 MF-MF 48 47.9 45.5 1.415392 47.13333 CA-CA 14.6 13.4 13.4 0.69282 13.8 AvRCA 27.2 20.1 19.8 4.188476 22.36667 AN-AN 82.4 75.5 74.4 4.336281 77.43333 L-L 78.1 75.7 72.8 2.653928 75.53333 AvRM 51.3 51.7 50.8 0.450925 51.26667 Man6-6 41.5 40 40.2 0.814453 40.56667 MAN 1-03 MF-MF 49.7 47.9 49.6 1.011599 49.06667 CA-CA 22.3 21.4 21.7 0.458258 21.8 AvRCA 34.3 29.7 28.3 3.139002 30.76667 AN-AN 88.5 86.8 89 1.153256 88.1 L-L 84.2 86.4 84.2 1.270171 84.93333 AvRM 56.2 57 56.4 0.416333 56.53333 Man6-6 43.4 42.3 41.5 0.953939 42.4 MAN 1-04 MF-MF 50.1 50.7 50.7 0.34641 50.5 CA-CA 18.7 16.9 16.9 1.03923 17.5 AvRCA 33.3 30.4 29.7 1.908752 31.13333 AN-AN 82.9 88.5 85.4 2.805352 85.6 L-L 75.1 75.6 75.2 0.264575 75.3 AvRM 54.4 54.2 53.1 0.7 53.9 Man6-6 41.8 42.3 41.5 0.404145 41.86667 MAN 1-05 MF-MF 47.2 49.3 48.4 1.053565 48.3 CA-CA 23.5 22.7 23.6 0.493288 23.26667 AvRCA 31.8 31.7 31.5 0.152753 31.66667 AN-AN 83.9 85.8 84.6 0.960902 84.76667 L-L 79.6 79 79.6 0.34641 79.4 AvRM 55.9 55.4 55.3 0.321455 55.53333 Man6-6 45.3 46.6 45.2 0.781025 45.7

54
MAN 1-06 MF-MF 47 46.3 48.4 1.069268 47.23333 CA-CA 16.3 15.9 17.3 0.72111 16.5 AvRCA 27.1 27.4 25.9 0.793725 26.8 AN-AN 82.9 82.6 81.7 0.6245 82.4 L-L 84.6 82.4 82.1 1.36504 83.03333 AvRM 54.6 54.3 54.1 0.251661 54.33333 Man6-6 44.2 44.3 44.5 0.152753 44.33333 MAN 1-07 MF-MF 46.1 46.7 47.3 0.6 46.7 CA-CA 23 22.7 23.3 0.3 23 AvRCA 35.3 35.3 32.8 1.443376 34.46667 AN-AN 90.7 87.2 87.7 1.892969 88.53333 L-L 81.3 82.6 81.7 0.665833 81.86667 AvRM 60.7 58.6 59.5 1.053565 59.6 Man6-6 46 46.1 45.9 0.1 46 Man-08 MF-MF 42.6 42.4 42.1 0.251661 42.36667 CA-CA 18 17.4 17.9 0.321455 17.76667 AvRCA 28.6 27.3 29.1 0.929157 28.33333 AN-AN 78.2 77.8 78.3 0.264575 78.1 L-L 78.5 78.9 78.9 0.23094 78.76667 AvRM 46.3 45.7 46.4 0.378594 46.13333 Man6-6 34.2 34.8 33.7 0.550757 34.23333 Man 1-09 MF-MF 45 43.5 43.5 0.866025 44 CA-CA 18.5 18 19.1 0.550757 18.53333 AvRCA 24.1 24.7 24.2 0.321455 24.33333 AN-AN 71.5 70.9 69.3 1.137248 70.56667 L-L 72.8 72.5 72.3 0.251661 72.53333 AvRM 50.3 49.8 49.4 0.450925 49.83333 Man6-6 36.4 38.4 37 1.02632 37.26667 Man-10 MF-MF 46.7 45.5 45.7 0.64291 45.96667 CA-CA 21.4 22.3 21.3 0.550757 21.66667 AvRCA 29 27.6 27.2 0.945163 27.93333

55
AN-AN 80.5 78.8 79.8 0.8544 79.7 L-L 76.2 75.5 75.8 0.351188 75.83333 AvRM 53.7 54.1 53.2 0.450925 53.66667 Man6-6 41.3 42.1 41.5 0.416333 41.63333 Man-11 MF-MF 45.7 46.1 46.3 0.305505 46.03333 CA-CA 24.8 27.2 26.3 1.212436 26.1 AvRCA 32.8 32.2 31 0.916515 32 AN-AN 89.8 87 86 1.969772 87.6 L-L 80.6 82.4 80.3 1.135782 81.1 AvRM 55.9 55.9 54.8 0.635085 55.53333 Man6-6 46.5 44.2 44.6 1.228821 45.1 Man-12 MF-MF 45.7 47.2 44.5 1.352775 45.8 CA-CA 22 22.8 22.2 0.416333 22.33333 AvRCA 28.3 27.3 28.5 0.64291 28.03333 AN-AN 84.3 82.4 77.6 3.453018 81.43333 L-L 81.8 78.2 77.4 2.343786 79.13333 AvRM 50.8 51.6 50.8 0.46188 51.06667 Man6-6 41.8 41.3 41.3 0.288675 41.46667 Man-13 MF-MF 44.7 43 44.1 0.862168 43.93333 CA-CA 17.4 17.8 17.6 0.2 17.6 AvRCA 27.2 27.6 27.7 0.264575 27.5 AN-AN 82.6 83.9 82.9 0.680686 83.13333 L-L 74.6 77 75.9 1.201388 75.83333 AvRM 51.4 50.1 50 0.781025 50.5 Man6-6 39.3 37.2 38.2 1.050397 38.23333 Man-14 MF-MF 44 42.9 42.4 0.818535 43.1 CA-CA 22.9 21.6 21.4 0.814453 21.96667 AvRCA 30.1 30.3 29.9 0.2 30.1 AN-AN 80.6 75.8 78.4 2.402776 78.26667 L-L 81.5 81.3 80.9 0.305505 81.23333 AvRM 55.3 54.8 54.8 0.288675 54.96667 Man6-6 43.3 43.7 44.2 0.450925 43.73333

56
Man-15 MF-MF 49.3 49 48.4 0.458258 48.9 CA-CA 19.7 17.8 17.2 1.305118 18.23333 AvRCA 26.8 27.3 26.8 0.288675 26.96667 AN-AN 80.1 78.5 81 1.266228 79.86667 L-L 77.7 76.9 76.7 0.52915 77.1 AvRM 50.4 50.8 50.6 0.2 50.6 Man6-6 38.7 39.4 39.3 0.378594 39.13333 Man-16 MF-MF 45 45.5 45.9 0.450925 45.46667 CA-CA 22.1 21.2 22.1 0.519615 21.8 AvRCA 30.1 29.9 29.9 0.11547 29.96667 AN-AN 77.8 80.6 77.3 1.778576 78.56667 L-L 78 77.3 76.7 0.650641 77.33333 AvRM 51.7 50.7 51.1 0.503322 51.16667 Man6-6 39.2 37.9 39 0.7 38.7 Man-17 MF-MF 47.6 46.6 46.5 0.608276 46.9 CA-CA 22.5 20.1 19.8 1.479865 20.8 AvRCA 27.5 27.5 27.5 0 27.5 AN-AN 80.9 78.3 77.5 1.777639 78.9 L-L 79.7 79.8 80.1 0.208167 79.86667 AvRM 54 52.7 53 0.680686 53.23333 Man6-6 42.2 41.6 41.4 0.416333 41.73333 Man-18 MF-MF 40.1 41.5 40.9 0.702377 40.83333 CA-CA 23.3 21.5 21.1 1.171893 21.96667 AvRCA 30.4 29.9 30.2 0.251661 30.16667 AN-AN 84.1 87.8 86.3 1.861003 86.06667 L-L 81 82.2 81 0.69282 81.4 AvRM 52.1 52.2 52.1 0.057735 52.13333 Man6-6 43.5 43.1 43 0.264575 43.2 Man-19 MF-MF 45.2 45.3 44.6 0.378594 45.03333 CA-CA 17.4 17.1 17.6 0.251661 17.36667 AvRCA 29.5 29.5 29.7 0.11547 29.56667 AN-AN 78.5 78 77.6 0.450925 78.03333

57
L-L 76.3 76.5 76.3 0.11547 76.36667 AvRM 51.4 51.7 51 0.351188 51.36667 Man6-6 41 40.4 40.6 0.305505 40.66667 Man-20 MF-MF 44.3 42.9 43.4 0.70946 43.53333 CA-CA 21.4 20 20 0.80829 20.46667 AvRCA 28.3 28.5 28.3 0.11547 28.36667 AN-AN 81.5 74.2 69.1 6.232442 74.93333 L-L 73.5 71.2 71.2 1.327906 71.96667 AvRM 48.5 48 48.5 0.288675 48.33333 Man6-6 37.2 37.7 37.4 0.251661 37.43333 Man -21 MF-MF 50.7 50.1 52.1 50.96667 CA-CA 20.5 20.1 19.6 20.06667 L-L 80.5 80.7 81.2 80.8 AVRM 54.4 53.7 53.9 54 Man-22 MF-MF 49.7 50.1 48.8 49.53333 CA-CA 18.7 18.1 18.9 18.56667 L-L 85.4 85.6 85.8 85.6 AVRM 54.5 53.7 53.7 53.96667 Man-23 MF-MF 48 49.6 49.3 48.96667 CA-CA 22.8 23.3 22.9 23 L-L 79.6 79 79.6 79.4 AVRM 56.3 54.5 55.2 55.33333 Man-24 MF-MF 46 46.5 46.2 46.23333 CA-CA 21.1 20.2 20.9 20.73333 L-L 81.8 82.5 82 82.1 AVRM 52.5 52.3 53 52.6 Man-25 MF-MF 45.1 45 46.7 45.6 CA-CA 24 24.1 23.8 23.96667 L-L 84 83.5 83.7 83.73333

58
AVRM 54.8 54.2 54.1 54.36667 Man-26 MF-MF 43.1 44.2 43.5 43.6 CA-CA 19.5 18.2 19.3 19 L-L 67.2 67.9 67.5 67.53333 AVRM 49.9 49.1 49.3 49.43333 Man-27 MF-MF 48.9 48.2 48.6 48.56667 CA-CA 22.9 22.6 21.1 22.2 L-L 80.2 80.1 80 80.1 AVRM 54.5 55 54.3 54.6 Man-28 MF-MF 52.6 55 53.5 53.7 CA-CA 15.4 15.6 14.8 15.26667 L-L 88 88.2 88.5 88.23333 AVRM 52.8 53.7 53 53.16667 Man-29 MF-MF 51 51.5 51.9 51.46667 CA-CA 18.1 18 18.9 18.33333 L-L 83 82.3 82.7 82.66667 AVRM 55.4 55.7 54.6 55.23333 Man-30 MF-MF 42.4 44.2 43.5 43.36667 CA-CA 20.4 19.3 19.5 19.73333 L-L 74.5 73.8 74.3 74.2 AVRM 49.8 49.1 49.5 49.46667 Man-31 MF-MF 44.2 44.3 38.9 42.46667 CA-CA 15.3 14.8 19.4 16.5 L-L 83 82.1 84.6 83.23333 AVRM 54.5 56.1 54.9 55.16667 Man-32 MF-MF 43.5 45 45.2 44.56667 CA-CA 21 21.1 20.5 20.86667

59
L-L 74.7 74.4 74.4 74.5 AVRM 52.9 52.6 52.4 52.63333 Man-33 MF-MF 50.9 50.7 50.2 50.6 CA-CA 23.7 24.3 23.9 23.96667 L-L 85.8 85.9 85.8 85.83333 AVRM 55.5 56 55 55.5 Man-34 MF-MF 43.3 45.7 46.6 45.2 CA-CA 24.2 23.7 22.7 23.53333 L-L 81.9 81.8 81.7 81.8 AVRM 48.3 48.4 48.3 48.33333 Man-35 MF-MF 47.8 48.8 48.9 48.5 CA-CA 18.9 18.9 18.9 18.9 L-L 75.8 75.2 76.3 75.76667 AVRM 50.3 50.4 49.9 50.2 Man-36 MF-MF 51 51.3 52.2 51.5 CA-CA 24 24 22.1 23.36667 L-L 81.3 82.9 81.8 82 AVRM 53.3 51.3 52.6 52.4 Man-37 MF-MF 46.1 46.1 45.8 46 CA-CA 17.3 17 17 17.1 L-L 78.5 78.8 78.4 78.56667 AVRM 47.8 47.5 47.4 47.56667 Man-38 MF-MF 43.6 44 44 43.86667 CA-CA 20.2 19.2 19.5 19.63333 L-L 71.6 70.9 71.4 71.3 AVRM 50.9 50.5 50.9 50.76667 Man-39 MF-MF 46.1 45.6 44.5 45.4

60
CA-CA 21.8 22.6 22.2 22.2 L-L 74.6 74.6 74.8 74.66667 AVRM 52.7 52.5 52.5 52.56667 Man-40 MF-MF 49.7 50.4 49.3 49.8 CA-CA 19.8 19.4 19.6 19.6 L-L 78.8 78.1 78.1 78.33333 AVRM 53.1 53.1 52.9 53.03333 Man-41 MF-MF 43.3 43.5 44 43.6 CA-CA 21.4 21.6 21.4 21.46667 L-L 82.7 82.5 82.5 82.56667 AVRM 54.3 53.7 53.9 53.96667 Man-42 MF-MF 50.2 50 50 50.06667 CA-CA 24.6 24.8 24.8 24.73333 L-L 79.7 79.5 79.5 79.56667 AVRM 53.9 53.7 54.6 54.06667 Man-43 MF-MF 41.8 43.9 45 43.56667 CA-CA 15.7 16.7 16.4 16.26667 L-L 84 83.2 84 83.73333 AVRM 52.3 52.3 51.9 52.16667 Man-44 MF-MF CA-CA L-L AVRM Man-45 MF-MF 50.9 51.7 51 51.2 CA-CA 17.7 17.1 18.2 17.66667 L-L 80.9 81.3 81.4 81.2 AVRM 52.9 52.9 53.1 52.96667 Man- MF-MF 43.6 43.1 43.4 43.36667

61
46 CA-CA 18 18.2 18.5 18.23333 L-L 67.6 67.9 68.3 67.93333 AVRM 51.5 51 50.4 50.96667 Man-47 MF-MF 51.5 50.3 51.1 50.96667 CA-CA 19.3 19.8 20.1 19.73333 L-L 77.2 77.4 78 77.53333 AVRM 53.2 53.6 53.8 53.53333 Man-48 MF-MF 50.5 51 51.1 50.86667 CA-CA 18.5 19 19.2 18.9 L-L 75.5 75.1 74.6 75.06667 AVRM 52.6 52.6 52.1 52.43333 Man-49 MF-MF 46.5 46 46.7 46.4 CA-CA 21.4 21.5 20.4 21.1 L-L 75.8 75.3 76 75.7 AVRM 53.9 53 52.5 53.13333 Man-50 MF-MF 45.1 45.2 44.9 45.06667 CA-CA 21.2 20.1 20.5 20.6 L-L 75.4 74.7 74.7 74.93333 AVRM 53.8 54.2 54.2 54.06667
Appendix C: Cl II Results (Four Landmarks, n=30), Raw Data
Time 1
Time 2
Time 3 St Dev Mean
Man2-01 MF-MF 47.5 47.7 46.7 0.52915 47.3 CA-CA 19.4 19.2 19.4 0.11547 19.33333 L-L 77.9 77.7 77.2 0.360555 77.6

62
AvRM 48.9 49.1 49.1 0.11547 49.03333 Man2-02 MF-MF 47.8 46.3 46.3 0.866025 46.8 CA-CA 17.9 18.8 19.1 0.6245 18.6 L-L 83.5 82.9 83.8 0.458258 83.4 AvRM 53.9 53.9 53.7 0.11547 53.83333 Man2-03 MF-MF 44.5 45.1 44.7 0.305505 44.76667 CA-CA 18 17.8 17.7 0.152753 17.83333 L-L 78.6 78.7 78.8 0.1 78.7 AvRM 53 52.6 52.6 0.23094 52.73333 Man2-04 MF-MF 41.9 43.5 43.7 0.986577 43.03333 CA-CA 16.2 16.1 16.1 0.057735 16.13333 L-L 75.4 75.4 75 0.23094 75.26667 AvRM 49.4 50.1 49.7 0.351188 49.73333 Man2-05 MF-MF 41.6 41.2 42.7 0.776745 41.83333 CA-CA 15.7 15.7 16.5 0.46188 15.96667 L-L 75.7 76.4 75.7 0.404145 75.93333 AvRM 49.5 48.7 49.1 0.4 49.1 Man2-06 MF-MF 49.6 47.8 47.8 1.03923 48.4 CA-CA 21.5 21.7 21.7 0.11547 21.63333 L-L 74 73.8 74 0.11547 73.93333 AvRM 50.4 50.8 50 0.4 50.4 Man2-07 MF-MF 41.6 42.5 40 1.266228 41.36667 CA-CA 16.5 17 16.3 0.360555 16.6 L-L 76.2 76.4 76.7 0.251661 76.43333 AvRM 53.2 53.4 53.7 0.251661 53.43333 Man2-08 MF-MF 41.8 41.1 41.6 0.360555 41.5 CA-CA 20.2 19.7 19.5 0.360555 19.8

63
L-L 71.5 71.1 71.8 0.351188 71.46667 AvRM 47.7 47.2 47.2 0.288675 47.36667 Man2-09 MF-MF 48.5 48.9 47.9 0.503322 48.43333 CA-CA 18.8 19.1 18.6 0.251661 18.83333 L-L 78.2 77.7 78.2 0.288675 78.03333 AvRM 51.5 51.7 51.7 0.11547 51.63333 Man2-10 MF-MF 48.3 47 47.1 0.723418 47.46667 CA-CA 16.7 16.6 16.2 0.264575 16.5 L-L 73.3 73.1 73 0.152753 73.13333 AvRM 51.7 51.5 52 0.251661 51.73333 Man2-11 MF-MF 48 47.2 47.4 0.416333 47.53333 CA-CA 19.8 19.8 19.7 0.057735 19.76667 L-L 75.3 75.1 75.7 0.305505 75.36667 AvRM 55.1 54.4 54.1 0.51316 54.53333 Man2-12 MF-MF 49.7 49.8 48.1 0.953939 49.2 CA-CA 16.7 16.9 17.4 0.360555 17 L-L 74.6 73.9 74.4 0.360555 74.3 AvRM 59 59 59.5 0.288675 59.16667 Man2-13 MF-MF 48 47.8 48 0.11547 47.93333 CA-CA 15.1 15.5 14.7 0.4 15.1 L-L 75.8 76.9 76.7 0.585947 76.46667 AvRM 51.9 53 51.9 0.635085 52.26667 Man2-14 MF-MF 43.7 42.1 42.3 0.87178 42.7 CA-CA 15.1 14.6 14.8 0.251661 14.83333 L-L 73.5 73.1 72.8 0.351188 73.13333 AvRM 51.7 51.7 51.9 0.11547 51.76667 Man2-15 MF-MF 45.4 45.3 45.4 0.057735 45.36667

64
CA-CA 19.7 19.3 19 0.351188 19.33333 L-L 75.7 75.3 74.9 0.4 75.3 AvRM 50.7 50.7 50 0.404145 50.46667 Man2-16 MF-MF 49.8 48.6 48.4 0.757188 48.93333 CA-CA 18.7 18.9 18.9 0.11547 18.83333 L-L 85 85.7 85.3 0.351188 85.33333 AvRM 55 54.7 54.5 0.251661 54.73333 Man2-17 MF-MF 47.4 46.9 46.6 0.404145 46.96667 CA-CA 19.1 19 19.2 0.1 19.1 L-L 72.9 72.1 72.3 0.416333 72.43333 AvRM 49.6 49.3 49.4 0.152753 49.43333 Man2-18 MF-MF 42.2 42 43.9 1.044031 42.7 CA-CA 16.8 16.6 16.1 0.360555 16.5 L-L 73.5 72.6 73.1 0.450925 73.06667 AvRM 50.8 50.9 51.1 0.152753 50.93333 Man2-19 MF-MF 46.3 45.2 47 0.907377 46.16667 CA-CA 21.4 21.7 21.1 0.3 21.4 L-L 78.6 78.9 78.9 0.173205 78.8 AvRM 52.1 51.5 51.7 0.305505 51.76667 Man2-20 MF-MF 42.8 43.5 43 0.360555 43.1 CA-CA 18.4 18.1 18.6 0.251661 18.36667 L-L 84.1 83.6 83.8 0.251661 83.83333 AvRM 47.6 47.6 47.6 0 47.6 Man2-21 MF-MF 44.4 44.5 46.2 1.011599 45.03333 CA-CA 16 15.8 15.6 0.2 15.8 L-L 73.5 73.7 73.5 0.11547 73.56667 AvRM 47.5 47.7 47.3 0.2 47.5 Man2- MF-MF 47.4 47.2 47 0.2 47.2

65
22 CA-CA 14.2 15.1 14.6 0.450925 14.63333 L-L 79.7 79.7 79.1 0.34641 79.5 AvRM 49.2 48.8 48.8 0.23094 48.93333 Man2-23 MF-MF 48.1 48.6 47.2 0.70946 47.96667 CA-CA 20.6 20.6 20.2 0.23094 20.46667 L-L 71.4 70.9 71.4 0.288675 71.23333 AvRM 46.3 46.5 47.1 0.416333 46.63333 Man2-24 MF-MF 50 49.5 50 0.288675 49.83333 CA-CA 14.5 15 14.7 0.251661 14.73333 L-L 78.4 78.4 78.9 0.288675 78.56667 AvRM 51.5 51.7 51.5 0.11547 51.56667 Man2-25 MF-MF 42 42.2 42.6 0.305505 42.26667 CA-CA 18.2 18.6 18.2 0.23094 18.33333 L-L 75.6 75.6 75.8 0.11547 75.66667 AvRM 52.3 52.7 52.1 0.305505 52.36667 Man2-26 MF-MF 47.5 47.3 46.9 0.305505 47.23333 CA-CA 23.3 22 22.8 0.655744 22.7 L-L 79.4 79.4 78.9 0.288675 79.23333 AvRM 52.8 53 52.6 0.2 52.8 Man2-27 MF-MF 47.2 46.6 44.1 1.644182 45.96667 CA-CA 17.9 17.7 17.4 0.251661 17.66667 L-L 74.7 75 74.6 0.208167 74.76667 AvRM 54.3 54.5 53.4 0.585947 54.06667 Man2-28 MF-MF 47.8 48.5 46.9 0.802081 47.73333 CA-CA 16.5 17.7 17 0.602771 17.06667 L-L 80.4 80.6 81.1 0.360555 80.7 AvRM 59.7 60.4 60.4 0.404145 60.16667

66
Man2-29 MF-MF 42.3 42.7 42.7 0.23094 42.56667 CA-CA 16.2 17.2 16.2 0.57735 16.53333 L-L 80.6 80.4 80.4 0.11547 80.46667 AvRM 50.2 50.4 50.4 0.11547 50.33333 Man2-30 MF-MF 47.6 48 47.2 0.4 47.6 CA-CA 21.1 21.3 20.6 0.360555 21 L-L 79.6 79.4 79.4 0.11547 79.46667 AvRM 55 54.7 55.2 0.251661 54.96667

67
Related Documents