The Southern African Institute of Mining and Metallurgy 6 th Southern African Base Metals Conference 2011 B McKevitt, P Abbasi, and D Dreisinger Page 337 A COMPARISON OF LARGE BEAD ION EXCHANGE RESINS FOR THE RECOVERY OF BASE METALS IN A RESIN-IN-PULP (RIP) CIRCUIT B McKevitt, P Abbasi, and D Dreisinger Department of Materials Engineering, The University of British Columbia Abstract This paper presents a comparison of various iminodiacetic chelating ion exchange resins for nickel recovery. In particular, the possibility of using these resins for base metal resin-in-pulp applications has become topical in recent years, and resin manufacturers have developed new large bead products for this potential market. The size distribution, loading rate of nickel from synthetic solutions, and stripping of six different ion exchange resins are compared. 1.0 Introduction The possibility of recovering base metals using a resin-in-pulp (RIP) process has become topical in recent years. The advantage of RIP is that it can allow for recovery of metals via ion exchange (IX), without the need of removing solids from the feed stream. This makes RIP particularly attractive for applications with slurries that are difficult or cost-prohibitive to filter. RIP has been implemented successfully on a commercial scale for both uranium and gold recovery, but has not yet been proven on an industrial scale for base metals. One system that has been studied extensively for RIP is the recovery of nickel with an iminodiacetic chelating resin. Several researchers have demonstrated that such a process should be technically viable [1-6] and a comparison of various commercially available resins has been recently published [7]. However, since the work for this recent publication was done, several resin manufacturers have developed large bead products, specifically for use in base metals RIP applications. The purpose of this study is to evaluate these new large bead resins (Ambersep XE818, Lewatit MonoPlus TP207XL, Purolite S930+/4888) and compare their performance to several of the traditional resins evaluated in the study of Zainol and Nicol (Amberlite 748, Lewatit TP207, Lewatit MonoPlus TP207 {designated here as “TP207MP”}, Purolite S930). Additionally, the traditional size of the new Purolite S930+ is included in this study. 2.0 Size Distributions of Resins Resin bead size is an important factor for RIP circuits. It is well known that loading rates decrease as resin bead sizes increase, so that a smaller resin bead will load much quicker than a large one. However, for RIP, the resin beads need to be separated from the solids present in the slurry, and so the larger the bead, the easier the separation of the two phases. Consequently, in RIP applications, large bead products are generally preferred.

Welcome message from author
This document is posted to help you gain knowledge. Please leave a comment to let me know what you think about it! Share it to your friends and learn new things together.
Transcript

The Southern African Institute of Mining and Metallurgy
6th Southern African Base Metals Conference 2011
B McKevitt, P Abbasi, and D Dreisinger
Page 337
A COMPARISON OF LARGE BEAD ION EXCHANGE
RESINS FOR THE RECOVERY OF BASE METALS
IN A RESIN-IN-PULP (RIP) CIRCUIT
B McKevitt, P Abbasi, and D Dreisinger
Department of Materials Engineering, The University of British Columbia
Abstract
This paper presents a comparison of various iminodiacetic chelating ion exchange resins
for nickel recovery. In particular, the possibility of using these resins for base metal
resin-in-pulp applications has become topical in recent years, and resin manufacturers
have developed new large bead products for this potential market. The size distribution,
loading rate of nickel from synthetic solutions, and stripping of six different ion
exchange resins are compared.
1.0 Introduction
The possibility of recovering base metals using a resin-in-pulp (RIP) process has
become topical in recent years. The advantage of RIP is that it can allow for recovery
of metals via ion exchange (IX), without the need of removing solids from the feed
stream. This makes RIP particularly attractive for applications with slurries that are
difficult or cost-prohibitive to filter.
RIP has been implemented successfully on a commercial scale for both uranium and
gold recovery, but has not yet been proven on an industrial scale for base metals. One
system that has been studied extensively for RIP is the recovery of nickel with an
iminodiacetic chelating resin. Several researchers have demonstrated that such a
process should be technically viable [1-6] and a comparison of various commercially
available resins has been recently published [7]. However, since the work for this
recent publication was done, several resin manufacturers have developed large bead
products, specifically for use in base metals RIP applications. The purpose of this study
is to evaluate these new large bead resins (Ambersep XE818, Lewatit MonoPlus
TP207XL, Purolite S930+/4888) and compare their performance to several of the
traditional resins evaluated in the study of Zainol and Nicol (Amberlite 748, Lewatit
TP207, Lewatit MonoPlus TP207 {designated here as “TP207MP”}, Purolite S930).
Additionally, the traditional size of the new Purolite S930+ is included in this study.
2.0 Size Distributions of Resins
Resin bead size is an important factor for RIP circuits. It is well known that loading
rates decrease as resin bead sizes increase, so that a smaller resin bead will load much
quicker than a large one. However, for RIP, the resin beads need to be separated from
the solids present in the slurry, and so the larger the bead, the easier the separation of
the two phases. Consequently, in RIP applications, large bead products are generally
preferred.

The Southern African Institute of Mining and Metallurgy
6th Southern African Base Metals Conference 2011
B McKevitt, P Abbasi, and D Dreisinger
Page 338
The resins under evaluation were converted to hydrogen form and wet-screened to
determine the cumulative fraction passing curves. Note that all volumes in this work
correspond to the wet-settled volume of resin in the hydrogen form, and all resin bead
diameters correspond to the diameter of the resin in the hydrogen form.
Results from wet-screening are plotted in Figure 1:
0.0
0.1
0.2
0.3
0.4
0.5
0.6
0.7
0.8
0.9
1.0
500 600 700 800 900 1000 1100 1200 1300 1400
Cu
mu
lati
ve
Fra
cti
on
Pa
ssin
g
Screen Size [um]
Cumulative Fraction Passing Curves: H-Form
TP207
TP207 MP
TP207 XL
S930
S930+
S930+/4888
IRC748
XE818
Figure 1: Cumulative Fraction Passing –Hydrogen Form
Of interest from Figure 1 is that the resin with the largest beads is the Ambersep XE818,
followed by the Purolite S930+/4888. The size distribution of the new Purolite S930+
is very similar to the Lewatit TP207. Also note how the Lewatit MonoPlus TP207 was
mostly retained on a single screen size, and that this was also observed, to a slightly
lesser degree for the Lewatit MonopPus TP207XL.
The Southern African Institute of Mining and Metallurgy
6th Southern African Base Metals Conference 2011
B McKevitt, P Abbasi, and D Dreisinger
Page 339
3.0 Loading Rate and Capacities
Loading rate and capacity of various size fractions of each resin was determined using
synthetic solutions of nickel sulphate at pH 4. Capacity of the resins can be inferred
from the final loading value obtained at the end of the 20 hour loading rate tests.
Each resin was evaluated at both 500 ppm nickel and 2500 ppm nickel. No comparison
tests were carried out at low nickel feed concentrations (e.g. 50 ppm), because film
diffusion control would be expected to play a large role at low concentrations, making it
difficult to discern the effect of diffusion through the actual resin beads.
3.1 Experimental Method
The experimental method used for the loading rate tests was developed by modifying
the pH-stat method developed by Babjak [8]. In Babjak’s pH-stat method, a resin in
hydrogen form is placed into a solution and the pH is held constant by automatic
addition of base (sodium hydroxide was used in this work). By tracking the rate at
which the base is added, one can determine the rate at which the resin is loading. This
method has been previously applied to nickel loading onto an iminodiacetic resin at pH
4; however, significant mass balance errors were encountered due to the co-loading of
sodium onto the resin [9].
To minimize the effect of sodium co-loading onto the resin, it was decided to maintain
constant nickel concentrations in the beaker. This was achieved by mounting a second
pumphead onto the motor used for sodium hydroxide addition to deliver a nickel stock
solution. The concentration of the nickel stock solution was calculated to maintain
essentially constant nickel concentration in the test beaker, taking into account the
additional volume being added and the slight variation in flowrates between the two
pumpheads. Samples were taken after one, four, and twenty hours to ensure that
constant nickel concentrations were maintained over the course of the test.
To further minimize the effect of sodium co-loading, the resin was equilibrated to pH 4
through the addition of sodium hydroxide, prior to being added to the test beaker.
Additionally, a high solution to resin ratio of 100:1 at the start of the test was used.
To determine the worst possible co-loading of sodium under these conditions, a blank
test was run in which the initial feed solution contained no nickel and a sodium
concentration of 0.0187 M. This corresponds to the expected sodium concentration in
the test beaker after fully loading a 2.2 eq/L resin, using 0.25M sodium hydroxide as the
neutralizing base. Under these worst-case conditions approximately 0.07 eq/L of
sodium loaded.
To get a sense of the actual sodium co-loading on the resin, strip results from a loading
test run at 250 ppm nickel were analyzed by ICP. Under these conditions, only 0.004
eq/L of sodium was stripped from the resin. Therefore, it is believed that the results
obtained in this work incurred minimal interference from the sodium co-loading onto
the resin.
The Southern African Institute of Mining and Metallurgy
6th Southern African Base Metals Conference 2011
B McKevitt, P Abbasi, and D Dreisinger
Page 340
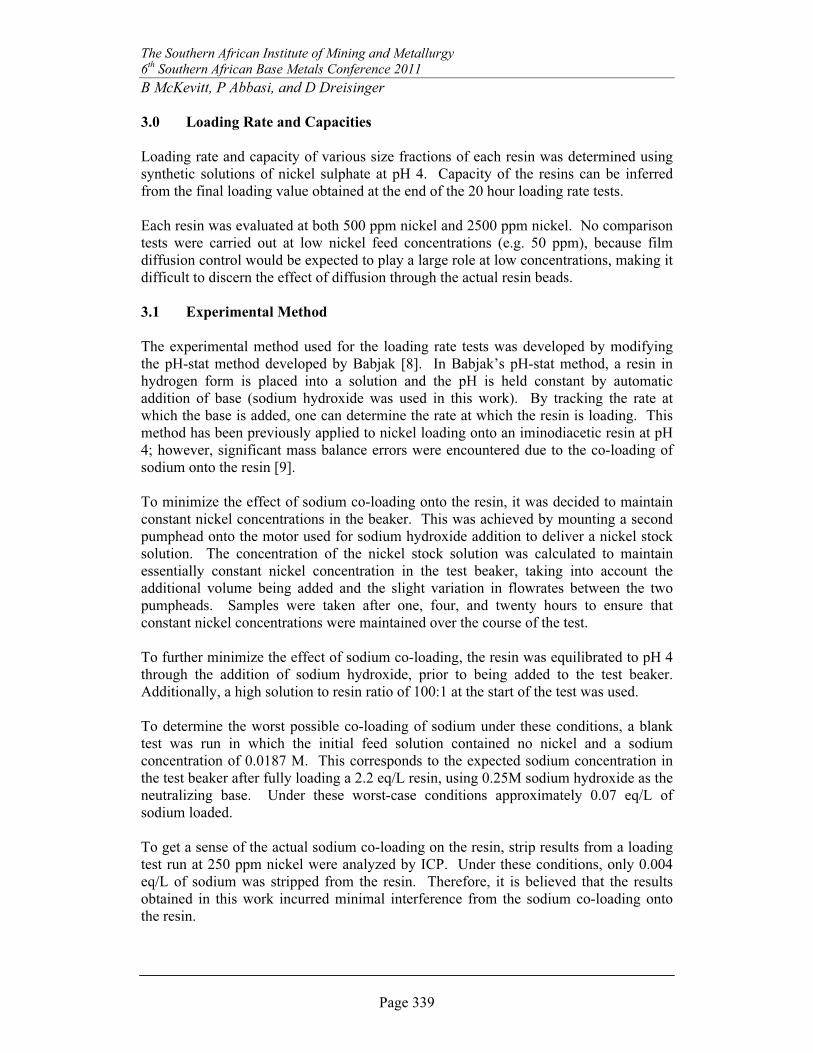
3.2 Loading Rate at 500 ppm Nickel
Loading rate curves were generated for nickel loading onto the 500 – 600 micron size
fraction, the 710 – 850 micron size fraction, and the 1000 – 1180 micron size fraction
Note that due to the size distributions of the resins, many samples could only be tested
at one size fraction, and no resin was tested at all size fractions.
Results for the 500 – 600 micron size fraction are displayed in Figure 2, which contains
an inset with the first four hours of loading:
0
10
20
30
40
50
60
70
0 2 4 6 8 10 12 14 16 18 20
Nic
kel L
oa
de
d
[g N
i /
L R
esi
n]
Time [hrs]
Comparison of Loading Rates: 500 ppm Nickel, 500-600um
IRC748 S930 S930+ TP207 TP207MP
Figure 2: Loading of 500-600 micron beads at 500 ppm Nickel
The results in Figure 2 clearly illustrate the large variation in resin capacities (final
loading values). It also shows that the new Purolite S930+ product has a much larger
capacity than the old Purolite S930 and loads at a similar rate as the Lewatit TP207.
Most of the resins in Figure 2 were previously tested by Zainol and Nicol in a four hour
batch loading test with a sample of CCD tails obtained from industry. In their work, it
was found that the rate of resin loading followed the following order: TP207MP >>
IRC748 > S930 > TP207 (see Table 6, ref [7]). The results presented in Figure 2
confirm that the rate of loading of the TP207MP is noticeably faster than the other
resins tested. This makes sense in terms of data published by this resin manufacturer,
which states that the MonoPlus TP207 has a larger internal surface area and more
porosity than the traditional TP207 product [10].
0
10
20
30
40
50
60
0 0.5 1 1.5 2 2.5 3 3.5 4
First Four Hours:
The Southern African Institute of Mining and Metallurgy
6th Southern African Base Metals Conference 2011
B McKevitt, P Abbasi, and D Dreisinger
Page 341
On the other hand, these results do not indicate that the rate of loading of TP207 is
slower than the other resins. This is likely reflective of the fact that these tests were
done under constant nickel composition, in the absence of impurities that would co-load
onto the resin. In the case of the work reported by Zainol and Nicol, the nickel loading
after four hours followed the approximate order: TP207MP > IRC748 ~S930 ~ TP207,
despite the differences in resin capacities. Of note from the assays in their work, was
that the manganese content of the TP207 was significantly higher than the IRC748 and
S930 resins. This suggests that in the presence of high levels of impurities (as one
would expect to see in an actual RIP slurry), the impurities initially load onto the resin
and are then displaced by nickel. It is reasonable to expect that the rates associated with
this displacement process could be different from the rates of nickel loading directly
onto a resin in the hydrogen form. This highlights the importance of testing ion
exchange resins under conditions that are reflective of their actual anticipated operating
conditions.
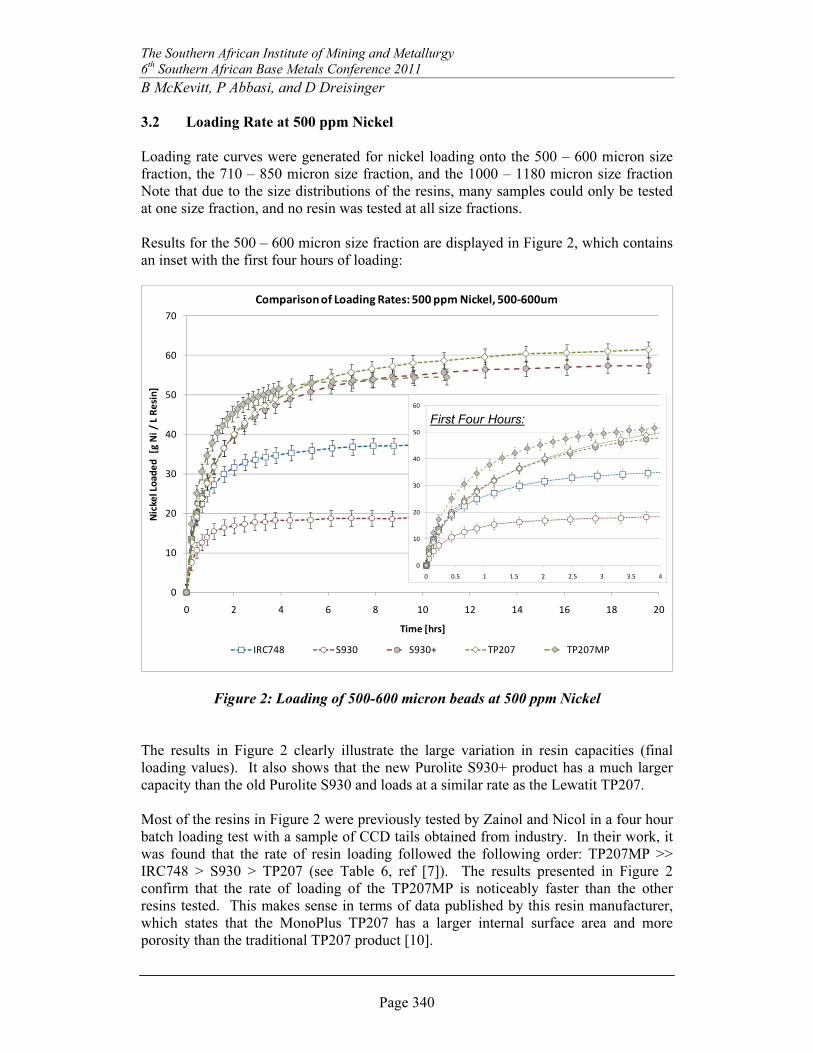
Results for loading onto resins in the 710 – 850 micron size fraction are displayed in
Figure 3:
0
10
20
30
40
50
60
70
0 2 4 6 8 10 12 14 16 18 20
Nic
kel L
oa
de
d
[g N
i /
L R
esi
n]
Time [hrs]
Comparison of Loading Rates: 500 ppm Nickel, 710-850um
S930 S930+ S930+/4888 TP207 TP207XL
Figure 3: Loading of 710-850 micron beads at 500 ppm Nickel
In Figure 3, the new TP207XL is shown to have a faster loading rate than the other
resins tested. This is not surprising as this resin is considered a larger version of the
TP207MP. In this test, the new S930+ performs almost identically as the TP207, and
the large RIP product S930+/4888 is slightly lower than these two curves; however, the
results from all three of these curves are within experimental error.
0
5
10
15
20
25
30
35
40
45
50
0 0.5 1 1.5 2 2.5 3 3.5 4
First Four Hours:

The Southern African Institute of Mining and Metallurgy
6th Southern African Base Metals Conference 2011
B McKevitt, P Abbasi, and D Dreisinger
Page 342
Results for loading onto resins in the 1000 – 1180 micron size fraction are displayed in
Figure 4:
0
10
20
30
40
50
60
70
0 2 4 6 8 10 12 14 16 18 20
Nic
kel L
oa
de
d [
g N
i /
L R
esi
n]
Time [hrs]
Comparison of Loading Rates: 500 ppm Nickel, 1000-1180um
XE818 S930+4888
Figure 4: Loading of 1000-1180 micron beads at 500 ppm Nickel
In Figure 4, the new S930+/4888 resin is shown to load to a higher capacity than the
new XE818 resin.
After loading, all resins were stripped using 100 gpL sulphuric acid and the strip
solution was assayed to provide a mass balance. Early tests showed incomplete
stripping of resins, so a 20-hour acid hold step was incorporated into the stripping
procedure. Strip assays were obtained as either the average of three separate dilutions
assayed by AA or are the average of two indirect EDTA titrations using zinc sulphate.
One sample was assayed using both methods and assay results between the two methods
were within 2%.
Mass balance results are displayed in Table 1:

The Southern African Institute of Mining and Metallurgy
6th Southern African Base Metals Conference 2011
B McKevitt, P Abbasi, and D Dreisinger
Page 343
Table 1: Mass Balances and Capacities at 500 ppm Nickel
Resin +500 -600 µm +710 -850 µm +1000 -1180 µm
Load Strip Load Strip Load Strip
IRC 748 41.2 40.3 - - - -
XE 818 - - - - 37.6 38.0
S930 19.6 20.8 20.8 21.1 - -
S930+ 57.8 55.8 58.2 52.7* - -
S930+4888 - - 55.6 55.1 51.9 49.4
TP207 61.7 61.0 58.1 57.6 - -
TP207MP 55.5 54.8 - - - -
TP207XL - - 55.6 50.0* - -
* indicates samples without a 20-hr acid hold step
3.3 Loading Rate at 2500 ppm Nickel
Loading rate tests were repeated, using fresh resin samples, at a feed concentration of
2500 ppm nickel. Figure 5 displays the results for the 500 – 600 micron size fraction:
0
10
20
30
40
50
60
70
0 2 4 6 8 10 12 14 16 18 20
Nic
ke
l Lo
ad
ed
[g
Ni
/ L
Re
sin
]
Time [hrs]
Comparison of Loading Rates: 2500 ppm Nickel, 500-600 um
IRC748 S930 S930+ TP207 TP207MP
Figure 5: Loading of 500-600 micron beads at 2500 ppm Nickel
0
10
20
30
40
50
60
0 0.5 1 1.5 2 2.5 3 3.5 4
First Four Hours:
The Southern African Institute of Mining and Metallurgy
6th Southern African Base Metals Conference 2011
B McKevitt, P Abbasi, and D Dreisinger
Page 344
Results from Figure 5 are quite interesting in that, under these conditions, the TP207MP
does not appear to be loading nickel any faster than the TP207 or the S930+. This was
unexpected, and so the test for the TP207MP was repeated and gave virtually the same
loading rate. This suggests that for this size of resin bead in a feed solution of 2500
ppm nickel, the rate of ligand exchange may be contributing significantly to the overall
resin loading rate. Further work would be required to verify this possibility.
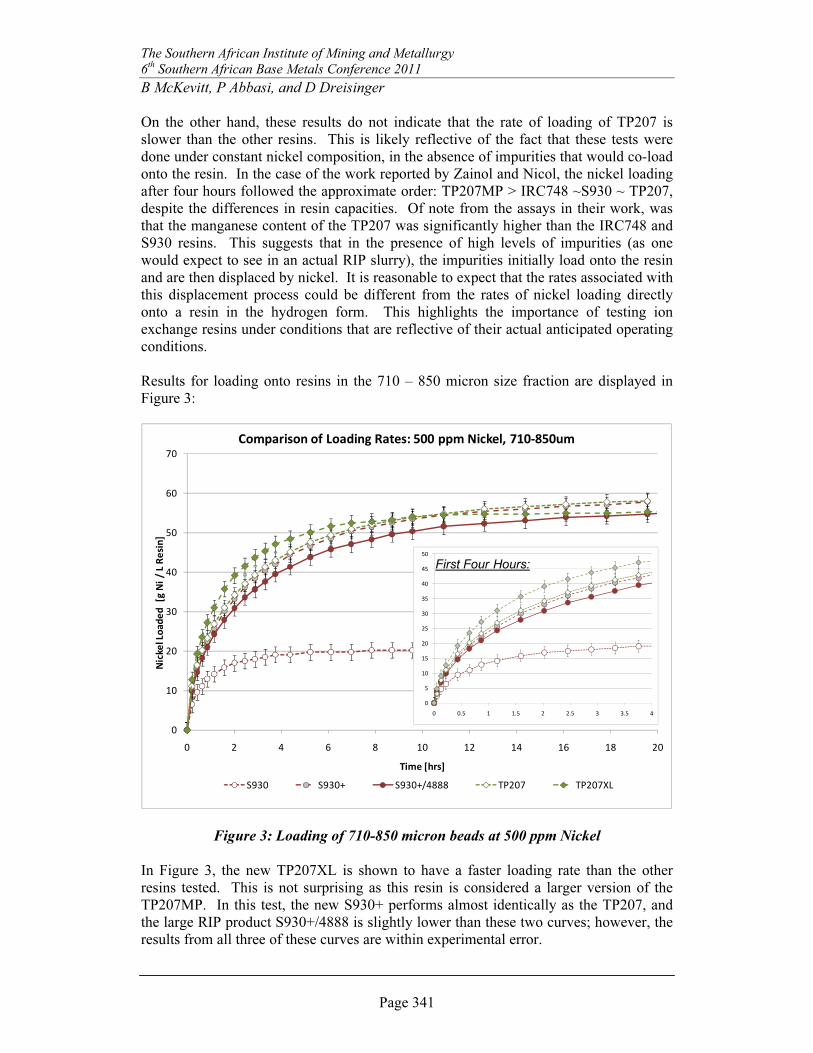
Results for loading onto resins in the 710 – 850 micron size fraction are displayed in
Figure 6:
0
10
20
30
40
50
60
70
0 2 4 6 8 10 12 14 16 18 20
Nic
kel L
oa
de
d [
g N
i /
L R
esi
n]
Time [hrs]
Comparison of Loading Rates: 2500 ppm Nickel, 710-850um
S930 S930+ S930+4888 TP207 TP207XL TP207XXXL
Figure 6: Loading of 710-850 micron beads at 2500 ppm Nickel
Results in Figure 6 are more in-line with the observations made at 500 ppm nickel. The
TP207XL is once again loading at a significantly higher rate than the other resins tested.
However, since loading rate is known to decrease as resin diameter increases, these
results in no way invalidate the observations made with the smaller resin beads (Figure
5).
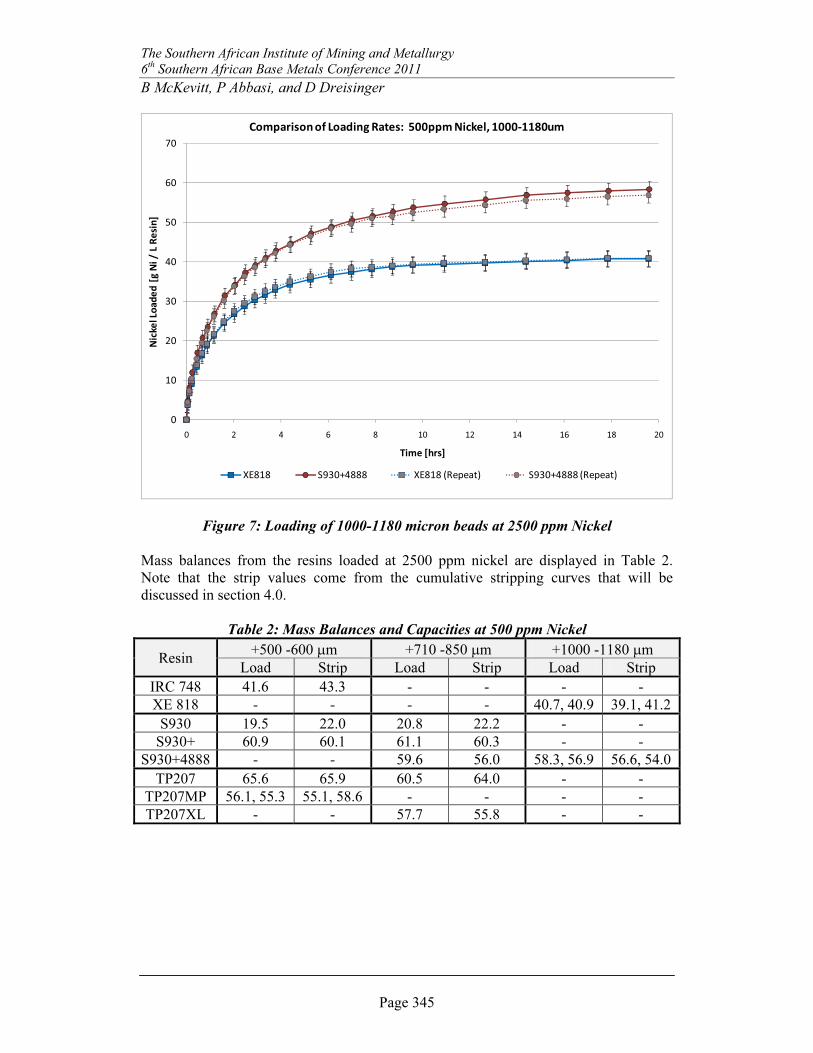
Results for the 1000 – 1180 micron size fraction are displayed in Figure 7. Note that
repeat loading tests for each resin were performed and both results are displayed in this
graph to demonstrate the repeatability of the method used.
0
10
20
30
40
50
60
0 0.5 1 1.5 2 2.5 3 3.5 4
First Four Hours:
The Southern African Institute of Mining and Metallurgy
6th Southern African Base Metals Conference 2011
B McKevitt, P Abbasi, and D Dreisinger
Page 345
0
10
20
30
40
50
60
70
0 2 4 6 8 10 12 14 16 18 20
Nic
kel L
oa
de
d [
g N
i /
L R
esi
n]
Time [hrs]
Comparison of Loading Rates: 500ppm Nickel, 1000-1180um
XE818 S930+4888 XE818 (Repeat) S930+4888 (Repeat)
Figure 7: Loading of 1000-1180 micron beads at 2500 ppm Nickel
Mass balances from the resins loaded at 2500 ppm nickel are displayed in Table 2.
Note that the strip values come from the cumulative stripping curves that will be
discussed in section 4.0.
Table 2: Mass Balances and Capacities at 500 ppm Nickel
Resin +500 -600 µm +710 -850 µm +1000 -1180 µm
Load Strip Load Strip Load Strip
IRC 748 41.6 43.3 - - - -
XE 818 - - - - 40.7, 40.9 39.1, 41.2
S930 19.5 22.0 20.8 22.2 - -
S930+ 60.9 60.1 61.1 60.3 - -
S930+4888 - - 59.6 56.0 58.3, 56.9 56.6, 54.0
TP207 65.6 65.9 60.5 64.0 - -
TP207MP 56.1, 55.3 55.1, 58.6 - - - -
TP207XL - - 57.7 55.8 - -
The Southern African Institute of Mining and Metallurgy
6th Southern African Base Metals Conference 2011
B McKevitt, P Abbasi, and D Dreisinger
Page 346
4.0 Stripping Comparison
The stripping comparison of the resins was conducted on the resins loaded at 2500 ppm
nickel. Five bed volumes (BV) of wash water were passed over the resin at 10 BV/hr,
followed by 5 BV of 100 gpL sulphuric acid. Cumulative nickel stripped curves were
obtained by collecting strip solutions after 1.0, 2.0, 2.6, 3.2, 3.8, 4.4, and 5.0 BV. A 20
hour acid hold was initiated and then deionized water was used for a 10 BV strip wash.
In the graphs that follow, the strip wash is plotted as the 6th
BV of acid to pass over the
resin. All assays for this portion of the work are based on a single sample dilution
analyzed by AA.
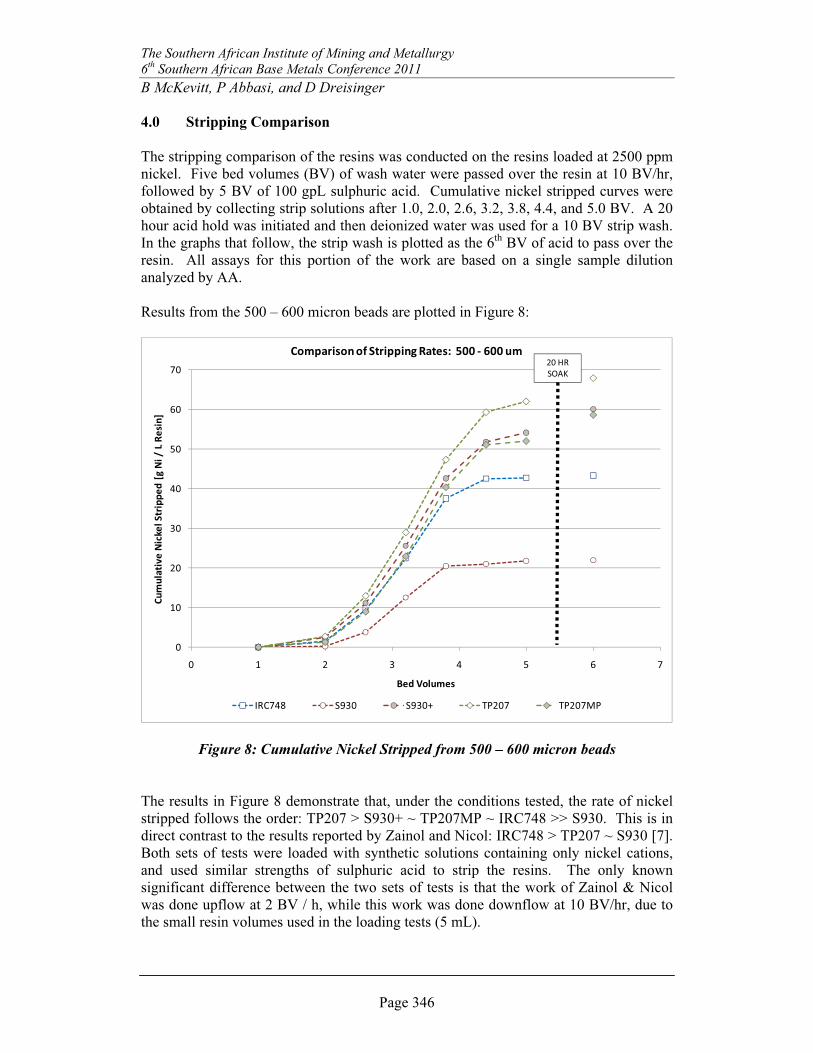
Results from the 500 – 600 micron beads are plotted in Figure 8:
0
10
20
30
40
50
60
70
0 1 2 3 4 5 6 7
Cu
mu
lati
ve
Nic
kel
Str
ipp
ed
[g
Ni
/ L
Re
sin
]
Bed Volumes
Comparison of Stripping Rates: 500 - 600 um
IRC748 S930 S930+ TP207 TP207MP
20 HR
SOAK
Figure 8: Cumulative Nickel Stripped from 500 – 600 micron beads
The results in Figure 8 demonstrate that, under the conditions tested, the rate of nickel
stripped follows the order: TP207 > S930+ ~ TP207MP ~ IRC748 >> S930. This is in
direct contrast to the results reported by Zainol and Nicol: IRC748 > TP207 ~ S930 [7].
Both sets of tests were loaded with synthetic solutions containing only nickel cations,
and used similar strengths of sulphuric acid to strip the resins. The only known
significant difference between the two sets of tests is that the work of Zainol & Nicol
was done upflow at 2 BV / h, while this work was done downflow at 10 BV/hr, due to
the small resin volumes used in the loading tests (5 mL).
The Southern African Institute of Mining and Metallurgy
6th Southern African Base Metals Conference 2011
B McKevitt, P Abbasi, and D Dreisinger
Page 347
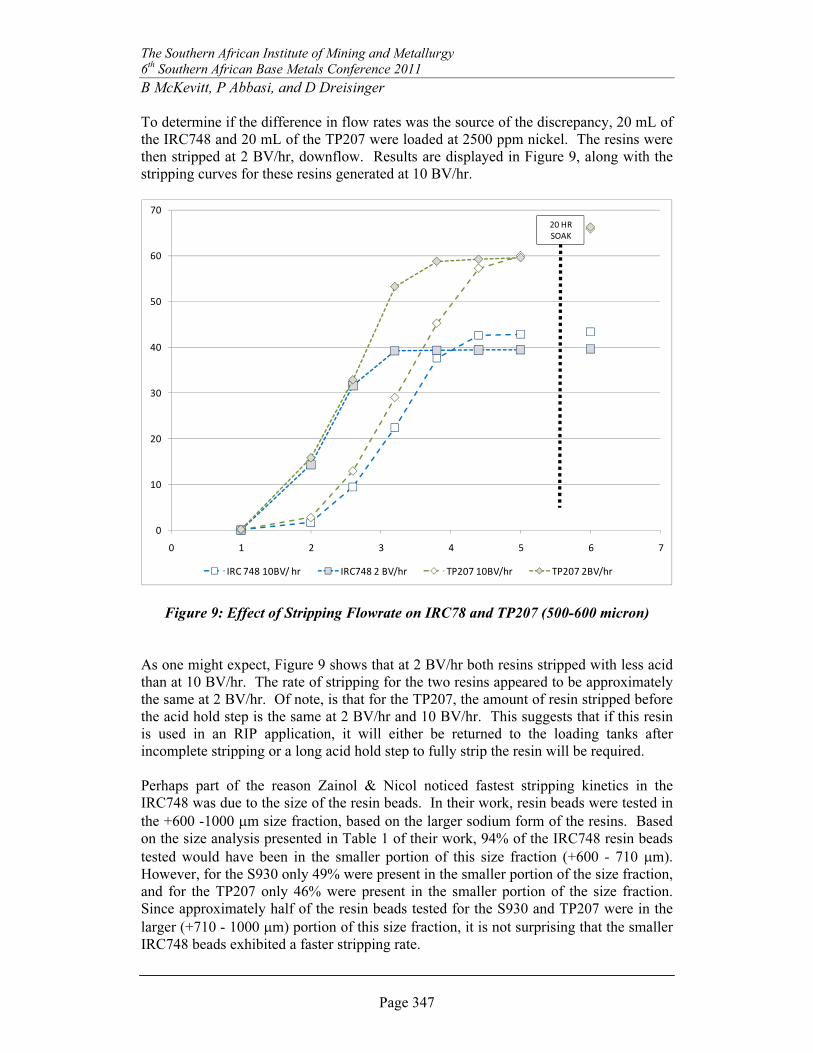
To determine if the difference in flow rates was the source of the discrepancy, 20 mL of
the IRC748 and 20 mL of the TP207 were loaded at 2500 ppm nickel. The resins were
then stripped at 2 BV/hr, downflow. Results are displayed in Figure 9, along with the
stripping curves for these resins generated at 10 BV/hr.
0
10
20
30
40
50
60
70
0 1 2 3 4 5 6 7
IRC 748 10BV/ hr IRC748 2 BV/hr TP207 10BV/hr TP207 2BV/hr
20 HR
SOAK
Figure 9: Effect of Stripping Flowrate on IRC78 and TP207 (500-600 micron)
As one might expect, Figure 9 shows that at 2 BV/hr both resins stripped with less acid
than at 10 BV/hr. The rate of stripping for the two resins appeared to be approximately
the same at 2 BV/hr. Of note, is that for the TP207, the amount of resin stripped before
the acid hold step is the same at 2 BV/hr and 10 BV/hr. This suggests that if this resin
is used in an RIP application, it will either be returned to the loading tanks after
incomplete stripping or a long acid hold step to fully strip the resin will be required.
Perhaps part of the reason Zainol & Nicol noticed fastest stripping kinetics in the
IRC748 was due to the size of the resin beads. In their work, resin beads were tested in
the +600 -1000 µm size fraction, based on the larger sodium form of the resins. Based
on the size analysis presented in Table 1 of their work, 94% of the IRC748 resin beads
tested would have been in the smaller portion of this size fraction (+600 - 710 µm).
However, for the S930 only 49% were present in the smaller portion of the size fraction,
and for the TP207 only 46% were present in the smaller portion of the size fraction.
Since approximately half of the resin beads tested for the S930 and TP207 were in the
larger (+710 - 1000 µm) portion of this size fraction, it is not surprising that the smaller
IRC748 beads exhibited a faster stripping rate.
The Southern African Institute of Mining and Metallurgy
6th Southern African Base Metals Conference 2011
B McKevitt, P Abbasi, and D Dreisinger
Page 348
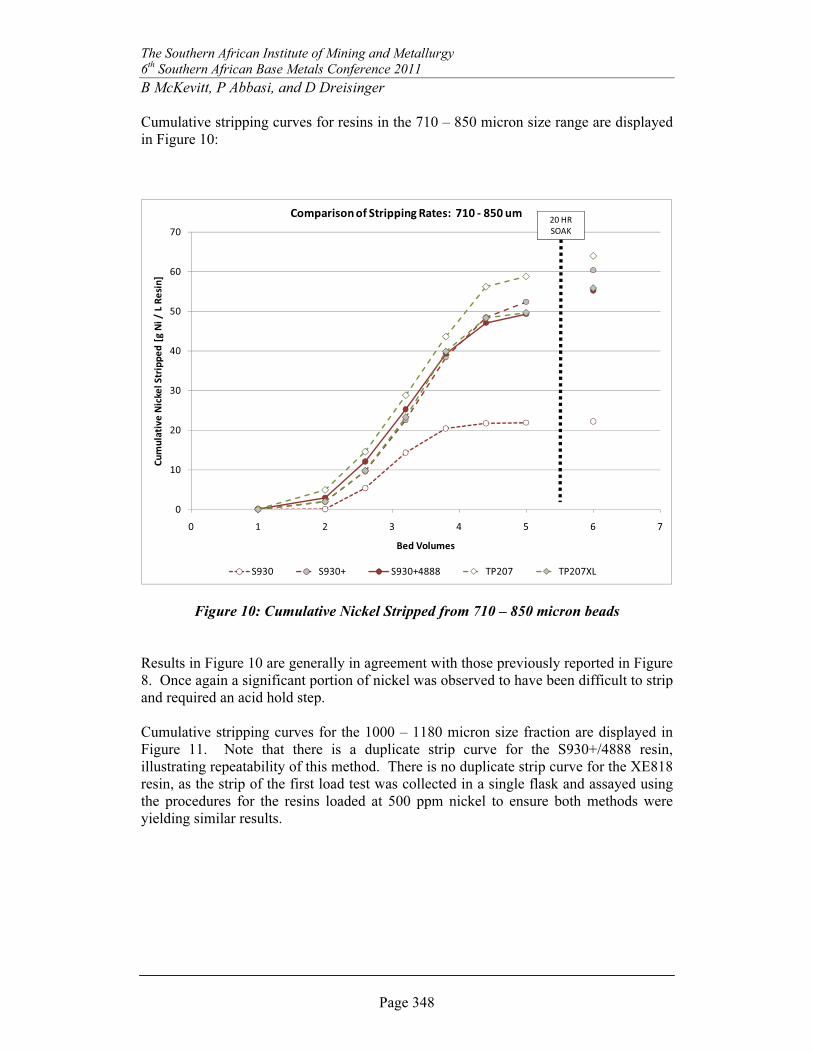
Cumulative stripping curves for resins in the 710 – 850 micron size range are displayed
in Figure 10:
0
10
20
30
40
50
60
70
0 1 2 3 4 5 6 7
Cu
mu
lati
ve
Nic
kel
Str
ipp
ed
[g
Ni
/ L
Re
sin
]
Bed Volumes
Comparison of Stripping Rates: 710 - 850 um
S930 S930+ S930+4888 TP207 TP207XL
20 HR
SOAK
Figure 10: Cumulative Nickel Stripped from 710 – 850 micron beads
Results in Figure 10 are generally in agreement with those previously reported in Figure
8. Once again a significant portion of nickel was observed to have been difficult to strip
and required an acid hold step.
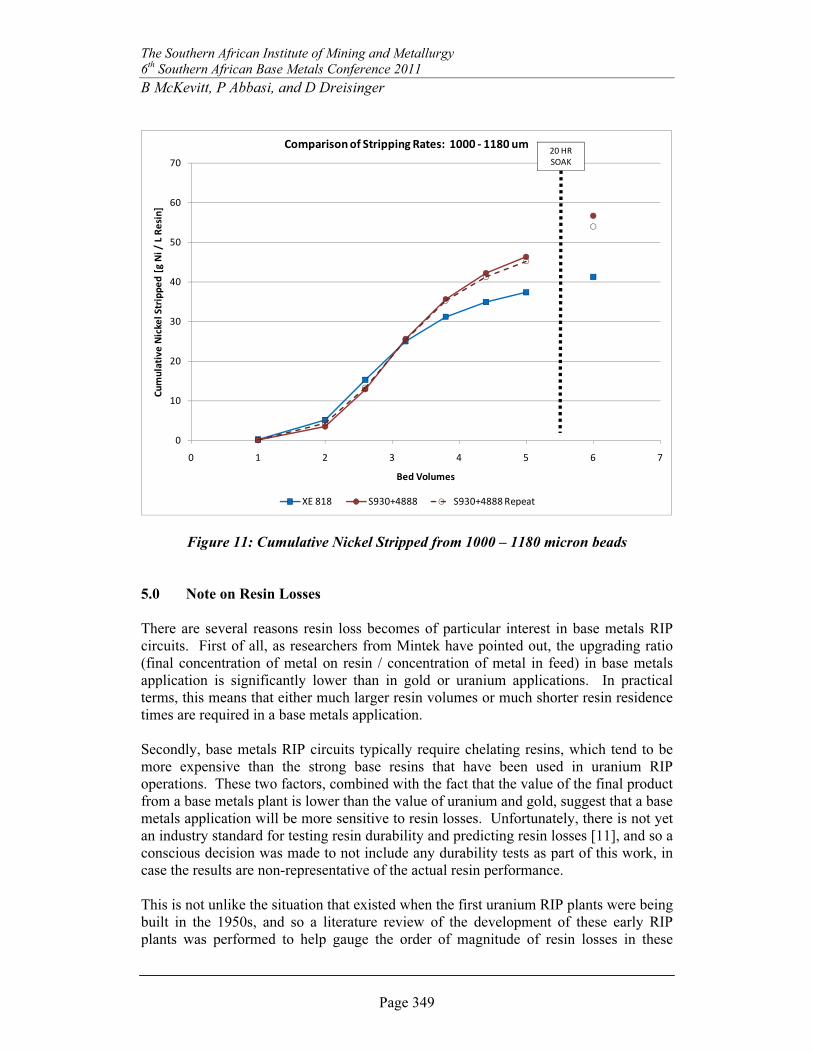
Cumulative stripping curves for the 1000 – 1180 micron size fraction are displayed in
Figure 11. Note that there is a duplicate strip curve for the S930+/4888 resin,
illustrating repeatability of this method. There is no duplicate strip curve for the XE818
resin, as the strip of the first load test was collected in a single flask and assayed using
the procedures for the resins loaded at 500 ppm nickel to ensure both methods were
yielding similar results.
The Southern African Institute of Mining and Metallurgy
6th Southern African Base Metals Conference 2011
B McKevitt, P Abbasi, and D Dreisinger
Page 349
0
10
20
30
40
50
60
70
0 1 2 3 4 5 6 7
Cu
mu
lati
ve
Nic
kel
Str
ipp
ed
[g
Ni
/ L
Re
sin
]
Bed Volumes
Comparison of Stripping Rates: 1000 - 1180 um
XE 818 S930+4888 S930+4888 Repeat
20 HR
SOAK
Figure 11: Cumulative Nickel Stripped from 1000 – 1180 micron beads
5.0 Note on Resin Losses
There are several reasons resin loss becomes of particular interest in base metals RIP
circuits. First of all, as researchers from Mintek have pointed out, the upgrading ratio
(final concentration of metal on resin / concentration of metal in feed) in base metals
application is significantly lower than in gold or uranium applications. In practical
terms, this means that either much larger resin volumes or much shorter resin residence
times are required in a base metals application.
Secondly, base metals RIP circuits typically require chelating resins, which tend to be
more expensive than the strong base resins that have been used in uranium RIP
operations. These two factors, combined with the fact that the value of the final product
from a base metals plant is lower than the value of uranium and gold, suggest that a base
metals application will be more sensitive to resin losses. Unfortunately, there is not yet
an industry standard for testing resin durability and predicting resin losses [11], and so a
conscious decision was made to not include any durability tests as part of this work, in
case the results are non-representative of the actual resin performance.
This is not unlike the situation that existed when the first uranium RIP plants were being
built in the 1950s, and so a literature review of the development of these early RIP
plants was performed to help gauge the order of magnitude of resin losses in these
The Southern African Institute of Mining and Metallurgy
6th Southern African Base Metals Conference 2011
B McKevitt, P Abbasi, and D Dreisinger
Page 350
historical systems. In the United States, two RIP processes were developed and
implemented commercially. The first process was the Basket system, in which resin
was placed inside baskets which were oscillated up and down in a “tea-bag-like
movement”. The circuit operated in a carousel fashion, meaning that the resin always
stayed in the same tank, and the order of the tanks processing the feed changed with
time (similar to a typical IX column operation). Later, a continuous counter-current RIP
circuit was developed. This operated in a cascade fashion, meaning that both resin and
pulp were continually being moved in opposite directions (similar to a traditional
carbon-in-pulp operation).
There was considerable research done to attempt to predict resin losses for the counter-
current RIP circuit [12] as this was considered a major concern for implementation of
this technology. These fears of high resin losses were not realized, as results from the
1967 survey of United States uranium producers showed lower resin consumption per
tonne of ore processed for a continuous circuit than for the Basket circuits. Himsley
suggests that the reason for the excessive resin losses in the Basket process was
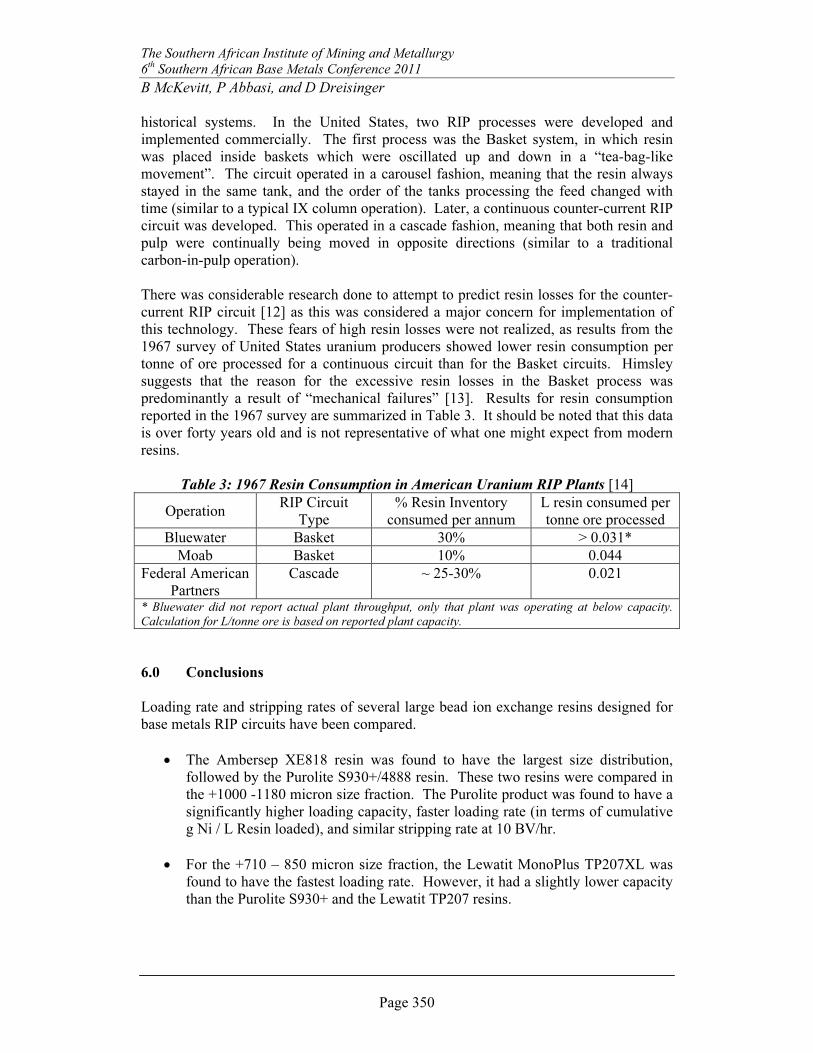
predominantly a result of “mechanical failures” [13]. Results for resin consumption
reported in the 1967 survey are summarized in Table 3. It should be noted that this data
is over forty years old and is not representative of what one might expect from modern
resins.
Table 3: 1967 Resin Consumption in American Uranium RIP Plants [14]
Operation RIP Circuit
Type
% Resin Inventory
consumed per annum
L resin consumed per
tonne ore processed
Bluewater Basket 30% > 0.031*
Moab Basket 10% 0.044
Federal American
Partners
Cascade ~ 25-30% 0.021
* Bluewater did not report actual plant throughput, only that plant was operating at below capacity.
Calculation for L/tonne ore is based on reported plant capacity.
6.0 Conclusions
Loading rate and stripping rates of several large bead ion exchange resins designed for
base metals RIP circuits have been compared.
• The Ambersep XE818 resin was found to have the largest size distribution,
followed by the Purolite S930+/4888 resin. These two resins were compared in
the +1000 -1180 micron size fraction. The Purolite product was found to have a
significantly higher loading capacity, faster loading rate (in terms of cumulative
g Ni / L Resin loaded), and similar stripping rate at 10 BV/hr.
• For the +710 – 850 micron size fraction, the Lewatit MonoPlus TP207XL was
found to have the fastest loading rate. However, it had a slightly lower capacity
than the Purolite S930+ and the Lewatit TP207 resins.
The Southern African Institute of Mining and Metallurgy
6th Southern African Base Metals Conference 2011
B McKevitt, P Abbasi, and D Dreisinger
Page 351
• For the +500 – 600 micron size fraction, the Lewatit MonoPlus TP207MP was
found to have the fastest loading rate at 500 ppm nickel, but at 2500 ppm nickel,
it had a loading rate similar to the Lewatit TP207 and Purolite S930+ products.
The old Purolite S930 product and the Amberlite IRC748 products were found
to have significantly lower capacities.
References
[1] Green, B.R.; Kotze, M.H.; Engelbrecht, J.P. Resin-in-pulp –After gold, where
next? In: Extraction & Processing Division Congress, Mishra, B. (ed.), The Minerals,
Metals, and Materials Society, 1998, pp. 119-136.
[2] Zontov, N. Potential benefits of resin-in-pulp for PAL plants. Proceedings of
ALTA 2001, ALTA Metallurgical Services, Melbourne.
[3] Wyethe, J.P.; Kotze, M.H.; Greager, I.P.; Swarts, A.C. Cobalt, nickel, and copper
recovery with resin-in-pulp. Proceedings of ALTA 2002, ALTA Metallurgical
Services, Melbourne.
[4] Nicol, M.J.; Zainol, Z. The development of a resin-in-pulp process for the recovery
of nickel and cobalt from laterite leach slurries. International Journal of Mineral
Processing, vol. 72, no. 1-4, September 2003, pp. 407-415.
[5] Mendes, F.D.; Martins, A.H. Recovery of nickel and cobalt from acid leach pulp by
ion exchange using chelating resin. Mineral Engineering, vol. 18, 2005, pp. 945-954.
[6] Wassink, B.; Neufeld, M., Dreisinger, D., Freeman, G.K.W. Towards a resin-in-
pulp process for recovery of nickel and cobalt from laterite leach tailings: an
iminodiacetic acid ion exchange resin as a prospective resin. Paper IWC-06-33,
presented at the 67th
International Water Conference, Pittsburgh, October 24-26, 2006.
[7] Zainol, Z.; Nicol, M.J. Comparative study of chelating ion exchange resins for the
recovery of nickel and cobalt from laterite leach tailings. Hydrometallurgy, vol. 96, no.
4, May 2009, pp. 283-287.
[8] Babjak, J. A study on ion exchange kinetics involving chelating resin. PhD Thesis,
The University of Waterloo, Department of Chemical Engineering, 1982.
[9] Zainol, Z. The development of a resin-in-pulp process for the recovery of nickel
and cobalt from laterite leach slurries. Murdoch University PhD Thesis, School of
Mineral Science, January 2005.
[10] Halle, O.; Rossoni, D. A new (monodisperse) chelating resin designed for mining
application: Lewatit MonoPlus TP207. Proceedings of ALTA 2005, ALTA
Metallurgical Services, Melbourne.
The Southern African Institute of Mining and Metallurgy
6th Southern African Base Metals Conference 2011
B McKevitt, P Abbasi, and D Dreisinger
Page 352
[11] Yahorava, V.; Scheepers, J.; Kotze, M.H.; Auerswald, D. Evaluation of various
durability tests to assess resins for in-pulp applications. Proceedings of the Fifth
Southern African Base Metals Conference, Kasane, Botswanna, July 27-31, 2009. The
South African Institute of Mining and Metallurgy, Johannesburg, pp. 341-358.
[12] Breymann, J.B.; Hollis, E.T.; Lynch, J.T. A continuous countercurrent resin-in-
pulp process. United States Atomic Energy Commission Raw Materials Development
Laboratory, Winchester, MA, WIN-102, July 18, 1958.
[13] Himsley, A. Uranium extraction from turbid liquids by continuous ion exchange
process. Canadian Institute of Mining Bulletin, vol. 70, no. 785, September 1977, pp.
148-154.
[14] Merritt, R.C. Chapter 15: Descriptions of active uranium milling plants in the
United States -1967. In: The Extractive Metallurgy of Uranium, Colorado School of
Mines, 1971, pp. 379-525.
The Author
Bethan McKevitt, Graduate Student, University of British Columbia
1) Engineer in Training Program at Inco (now Vale) Operations in Sudbury, Ontario,
Canada
2) Process Engineer at the Copper Cliff Copper Refinery and the Port Colborne Cobalt
Refinery
3) Returned to UBC in 2009 to study resin-in-pulp circuits for base metals applications
Related Documents