Suwanee River Project A Comparison of Grain Textures as Grains Travel Downstream, Suwannee River D. C. Gilmore Abstract For meandering streams it is common knowledge that as grains are transported downstream they become finer, better sorted and rounder. This study focuses on the Suwannee River and its characteristic textural maturity and texture with supplements from mean grain sizes. Because of the geographic location of the Suwannee in the southeastern coastal plains, the river does not exhibit a very high gradient through its course. A stream with a low gradient usually has a much lower variability of energy fluctuations so this variable can be treated as a secondary variable and for this study will not be the focus. This means that velocity of the stream and volume of water are the primary variable effecting local sedimentation along the Suwannee River. By using technical sampling techniques at strategic locations downstream along with computer data analysis and satellite imagery we can make interpretations about the processes 1

A Comparison of Grain Sizes
Aug 09, 2015
Welcome message from author
This document is posted to help you gain knowledge. Please leave a comment to let me know what you think about it! Share it to your friends and learn new things together.
Transcript
Suwanee River Project
A Comparison of Grain Textures as Grains Travel Downstream, Suwannee River
D. C. Gilmore
Abstract
For meandering streams it is common knowledge that as grains are transported
downstream they become finer, better sorted and rounder. This study focuses on the
Suwannee River and its characteristic textural maturity and texture with supplements from
mean grain sizes. Because of the geographic location of the Suwannee in the southeastern
coastal plains, the river does not exhibit a very high gradient through its course. A stream with a
low gradient usually has a much lower variability of energy fluctuations so this variable can be
treated as a secondary variable and for this study will not be the focus. This means that velocity
of the stream and volume of water are the primary variable effecting local sedimentation along
the Suwannee River.
By using technical sampling techniques at strategic locations downstream along with
computer data analysis and satellite imagery we can make interpretations about the processes
at work. From the White Springs sampling site to the river mouth/delta we observe a mean
grain size decrease and better sorted sediments upon deposition in the delta, but for the
locations located between White Springs and the river mouth experience fluctuations of grain
maturity. The texture of the grains appear to vary considerably among sample sites and end the
process in the delta with more angular grains.
1 - Introduction
1

Suwanee River Project
Florida resident, undoubtedly live on rock and sediment that was in one way or another
transported by or precipitated out of water. The trick to understanding where sediment has
come from and why it exhibits the properties of its current state is that you must understand
present day geologic processes and how they affect the rock and sediment and you also must
assume that the same processes have always happened in the past leading to the present day
landscape. For the state of Florida, water is an especially important variable in the creation of
the landscape. Because of this we must understand the processes of fluvial morphology and its
effects on sediment deposition.
The Suwanee River is like any other stream on earth in that it flows from higher
elevations to lower elevations and transport grains downstream to a base level (usually sea
level but can also be lakes or other rivers) where grains are able to settle over time. Its
headwaters are located just off the study area (~ 60 km NE of the White Springs Gauge in
Southeastern Georgia) in the Okefenokee Swamp at an elevation of ~ 42 m (all estimated values
for elevation from Google Earth). The mouth of the Suwanee River is at sea level just north of
Cedar Key, Florida. Because of the geographical location of the Suwanee River it has a low
gradient and relatively low variability in velocity. The Suwanee River is a meandering stream
and does the majority of its erosion into Hawthorne Group in the northern reaches,
unconsolidated sediments and Suwannee Limestone in the middle and finally the Ocala
Limestone in the southern reaches until it reaches the Gulf of Mexico (figure 3.1). All of these
geologic formations are primarily limestone with sands and clays. A tiny sliver of Holocene
sediments are at the mouth of the Suwanee River just landward of the Suwanee delta (figure
3.1). Along the length of the Suwanee throughout the study area are small settlements that
2
Suwanee River Project
undoubtedly effect the rivers in one way or another. What this paper does not take into
account is the effects of water use, agricultural organic pollution, dock dredging, bioturbation
etc. Human interaction with the environment can play a very important role in the current day
processes of stream development. For example, dredging along the bottom of a stream can
increase stream volume and slow velocity, therefore allowing smaller particles to settle easier.
For this paper it is best to ignore human interference and focus primarily on fluvial morphology
and take direct observations and interpret them as though the Suwanee, its tributaries, and its
springs are an isolated fluvial system.
By using previous geological and fluvial morphological findings and “laws” an
interpretation of sediment maturity at specified sampling sites in relation to its downstream
distance can be made. The further sediment travels downstream, the better sorted and
rounded grains become, which geologically this means that grains become more mature as they
travel downstream, (Knighton, 1980). This article will give a clear indication whether or not that
for the Suwanee River, grains have become more mature as they travel further downstream.
2 - Background
In order to understand the processes at work in North Central Florida we need to
understand a key fundamental law of geology. Nicolas Steno’s law of superposition that states,
Sedimentary layers are deposited in a time sequence, with the oldest layers on the bottom and
younger sediments deposited on top. Whether the sediment is transported as a grain or a
solution does not matter, because over time sediment builds over top of sediment below
creating layers that vary in parameters such as grain size, sorting, composition, etc.
3
Suwanee River Project
Distinguishing the differences between the layers of sediment can give geologists a good idea
about what the geologic history of the region has been. The geology of the source rock a stream
travels through can alter the weathering pattern of rocks and the grains that are transported
downstream. In this paper, the focus is on fluvial morphology and the processes differentiating
grain sorting and texture relevant to a sediments distance traveled downstream.
The Suwannee River has its headwaters in the Okefenokee Swamp located in south
eastern Georgia. The swamp has a surface geology containing mostly unconsolidated sediments
expected of a swamp (peat). The swamp owes its existence to its subsurface rocks. The area
was below sea level in both the Cretaceous and more recently the Eocene (Gelbart, 2010).
During the Eocene limestone deposition was occurring indicating elevation below sea level. As
sea level fell, the limestone underwent karstification from water erosion and was eventually
overlain by an impermeable clay layer of Pliocene age. The limestone beneath the clay
continued to erode as ground water flowed out of the area due to sea level drop. The
Okefenokee Swamp was formed when the limestone subsided and formed a basin (Gelbart,
2010). The impermeable clay layer prevented water from draining into the subsurface,
essentially trapping the water and forming the Swamp (Gelbart, 2010). As sea level continued
to fall the swamp began draining to the Gulf of Mexico via the Suwannee River.
From the Okefenokee Swamp and its unconsolidated sediments, the Suwannee then
flows into the Miocene Hawthorne Group which consists of carbonates, sands, clays and
phosphates (fig 3.1). The first sampling site is located along the Suwannee in Hawthorne Group
sediment. From the White Springs gauge, the Suwannee continues meandering northwest and
enters the Oligocene Suwannee Limestone which is the surface geology at Ellaville Gauge, the
4
Suwanee River Project
second sampling site. The Suwannee Limestone is only a surface rock near the river itself, once
out of the Suwannee floodplain on either side of the river, you go upsection into
Pleistocene/Holocene unconsolidated sediments. The Suwannee then meanders southward
through Eocene Ocala Limestone, passing out last two gauging locations and empties into the
Gulf of Mexico some 396 km from its headwaters in the Okefenokee Swamp.
3 - Methods and Materials
3.1 Study Area
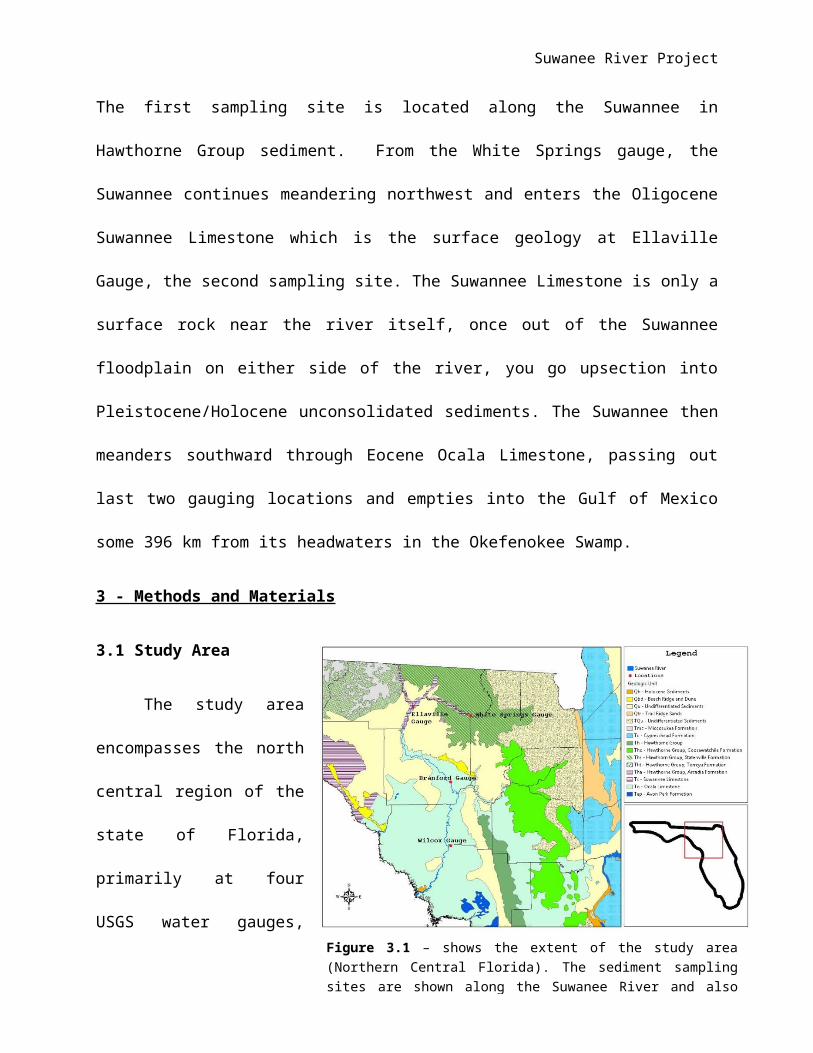
The study area
encompasses the north central
region of the state of Florida,
primarily at four USGS water
gauges, managed by the
Suwannee River Water
Management District, located
along the Suwanee River.
From furthest upstream working downstream the sediment sampling locations were:
1. White Springs Gauge, on the eastern bank, south of US Highway 41 in White Springs,
Florida.
a. GPS Coordinates (30◦19’29.95” N, 82◦44’18.77” W), Elevation: ~ 17 m.
2. Ellaville Gauge, on the south-eastern bank, northeast of railway tracks that are
northeast of US highway 90 in Ellaville, Florida.
5
Figure 3.1 – shows the extent of the study area (Northern Central Florida). The sediment sampling sites are shown along the Suwanee River and also the surface Geology of the region is shown. (Scott et al.)
Suwanee River Project
a. GPS Coordinates (30◦23’05.16” N, 83◦10’18.57” W), Elevation: ~ 15 m.
3. Branford Gauge, on eastern bank, just south of US Highway 27 in Branford, Florida.
a. GPS Coordinates (29◦57’18.07” N, 82◦55’44.92” W), Elevation: ~ 3 m.
4. Wilcox Gauge, on eastern bank, just south of US Highway 98, Fanning Springs, Florida.
a. GPS Coordinates: (2935’24.15: N, 8256’12.03” W), Elevation: ~ 2 m.
3.2 Methods
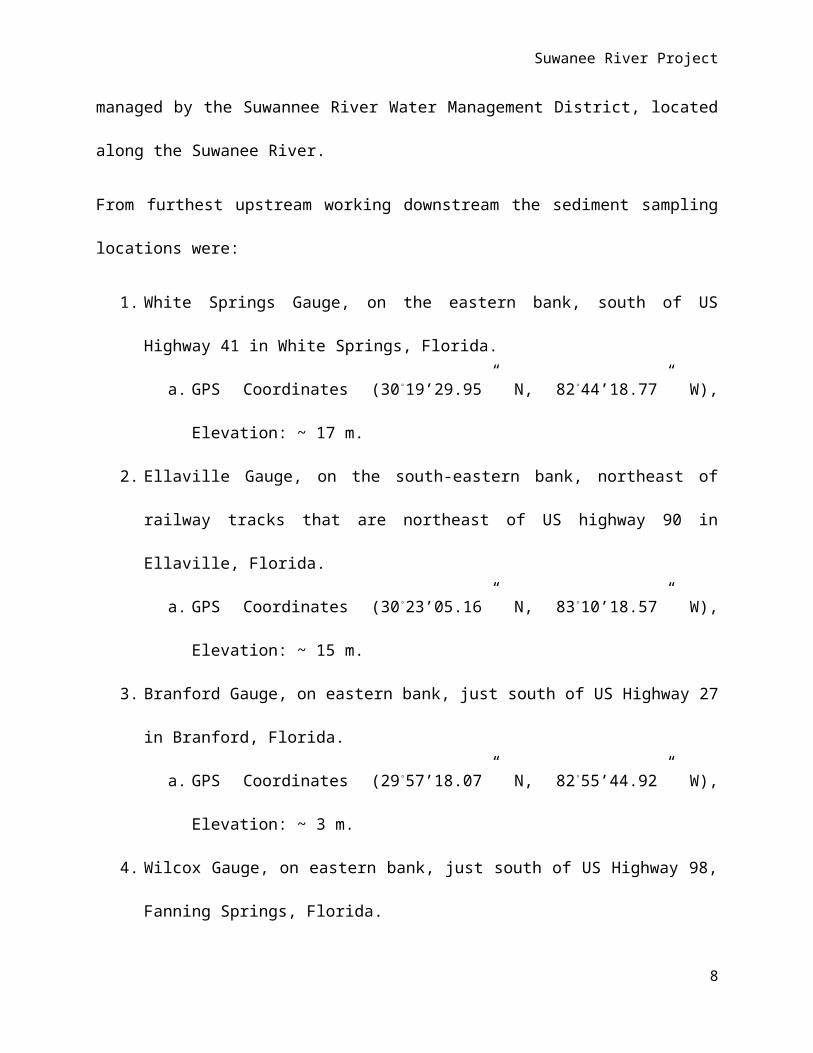
At each of these sites, five samples of the sediment were collected in strategic locations
(Figure 3.2). Theses samples follow a specific set of parameters. Each sample was collected on
February 6, 2014 between 12:30 and 5:50 pm. By using a spade to dig ~ 10 cm in depth below
the sediment surface, samples of ~ 500 ml were collected at each specified location at each
water gauge.
Descriptions of sample collection at each site are as follows:
BW1: Sample was collected ~ 30-50 cm out into the river below the water line.
BW2: Sample collected ~ 30-50 cm out into the river below the water line at a distance from
BW1 along the shoreline of ~ 3 m.
6
Figure 3.2 – shows the sediment sampling technique at each gauge siteFigure 3.2 – shows the sediment sampling technique at each gauge siteFigure 3.2 – shows the sediment sampling technique at each gauge siteFigure 3.2 – shows the sediment sampling technique at each gauge siteFigure 3.2 – shows the sediment sampling technique at each gauge siteFigure 3.2 – shows the sediment sampling technique at each gauge site
Suwanee River Project
AW1: Sample collected ~ 30 cm above the water line at the top of the erosional scarp as well as
~ 10 cm of the face of the scarp.
AW2: Sample collected ~ 30 cm above the water line at the top of the erosional scarp as well as
~ 10 cm of the face of the scarp at a distance from AW1 along the shoreline at ~ 3 m.
HAW: Sample collected at ~ 1 m above the water level at a lateral distance between 1 and 2 m
from the shoreline.
The final sediment samples were collected in May 2013 near the mouth of the Suwanee
River on delta deposits. All samples were ~ 1 m below the water level. Samples collected were
transported to the lab where each underwent random selection of grains to a total mass weight
of 2-4 grams. These samples were then sieved (63 µm) to remove clay sized particles. The
samples were then dried for 1 day and then the grain size distributions were measured in a
settling column. Using the settling column gives a grain size distribution that can be imported to
Microsoft Excel for data analysis and manipulation. I will suggest that for any questions on
processes and techniques used in laboratory analysis be forwarded to Dr. Jaeger of the
University of Florida, who performed the settling velocity analysis on all samples and generated
grain size.
7
Suwanee River Project
4 - Results
4.1 Grain Sorting
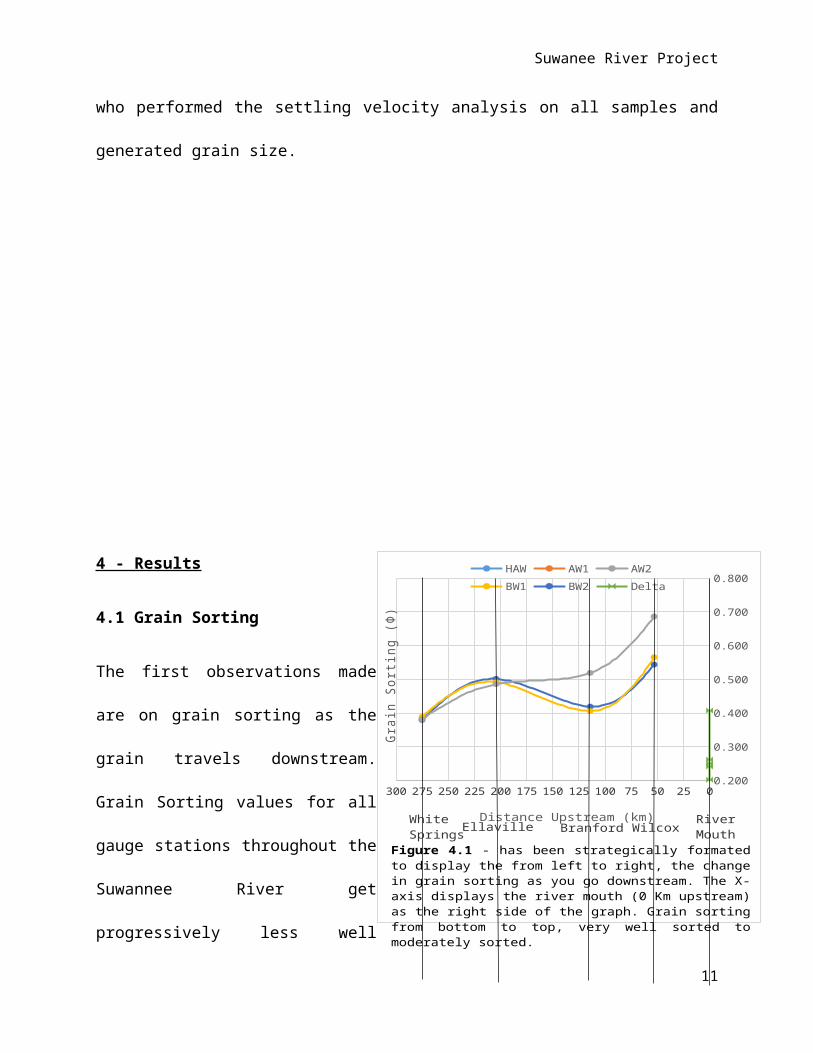
The first observations made are on grain
sorting as the grain travels downstream.
Grain Sorting values for all gauge stations
throughout the Suwannee River get
progressively less well sorted as they travel
downstream (figure 4.1). Grain sorting for
the HAW (~ 1 m above the water line)
samples show the least amount of
variation in grain sorting among all the
other samples. Over the course of 225 km from White
Springs gauge to Wilcox gauge the AW samples (~ 30
cm above water line at erosional escarpment) showed
the greatest amount of variation from well sorted to moderately sorted. Finally for the two BW
samples (~ 30 cm below water line) the samples experience variation between the four gauging
stations. From White Springs to Ellaville the sorting gets poorer then gets more well sorted at
Branford gauge while seeing the poorest sorting at the Wilcox location. The only very well
8
Table 4.1 – shows terminology for sorting standard deviation values. (Folk, 1974)
02550751001251501752002252502753000.200
0.300
0.400
0.500
0.600
0.700
0.800HAW AW1 AW2BW1 BW2 Delta
Distance Upstream (km)
Grai
n So
rting
(Ф)
Figure 4.1 - has been strategically formated to display the from left to right, the change in grain sorting as you go downstream. The X-axis displays the river mouth (0 Km upstream) as the right side of the graph. Grain sorting from bottom to top, very well sorted to moderately sorted.
WhiteSprings Ellaville Branford Wilcox
RiverMouth
Sorting< 0.35Ф very well sorted
0.35 - 0.50Ф well sorted0.50 - 0.72Ф moderately well sorted0.71 - 1.00Ф moderately sorted1.00 - 2.00Ф poorly sorted2.00 - 4.00Ф very poorly sorted
> 4.00Ф extremely poorly sorted
Suwanee River Project
sorted samples came from the delta deposits located at the mouth of the river (average sorting
of 0.27Ф).
4.2 Texture
The following is an observation of the texture of grains as grains traveled downstream in
the Suwannee River. In some cases it appears that grain roundness becomes more angular. For
example the HAW samples at White Springs Gauge display subangularity while samples 225 km
downstream at Wilcox gauge also display subangular grains. The grains on the delta are even
more angular, and are described as subangular to angular. The AW samples at White Springs
gauge are described as subrounded/subangular and are described as AW1 subrounded and
AW2 angular at Branford gauge, ~ 150 km downstream. Another ~ 60 km downstream to
Wilcox gauge AW1 is described as subangular and AW2 subrounded. The BW samples are
generally described as subangular to subrounded throughout the 225 km of downstream
movement. The Composition throughout the system remains relatively constant at an average
of 97% quartz.
9
Suwanee River Project
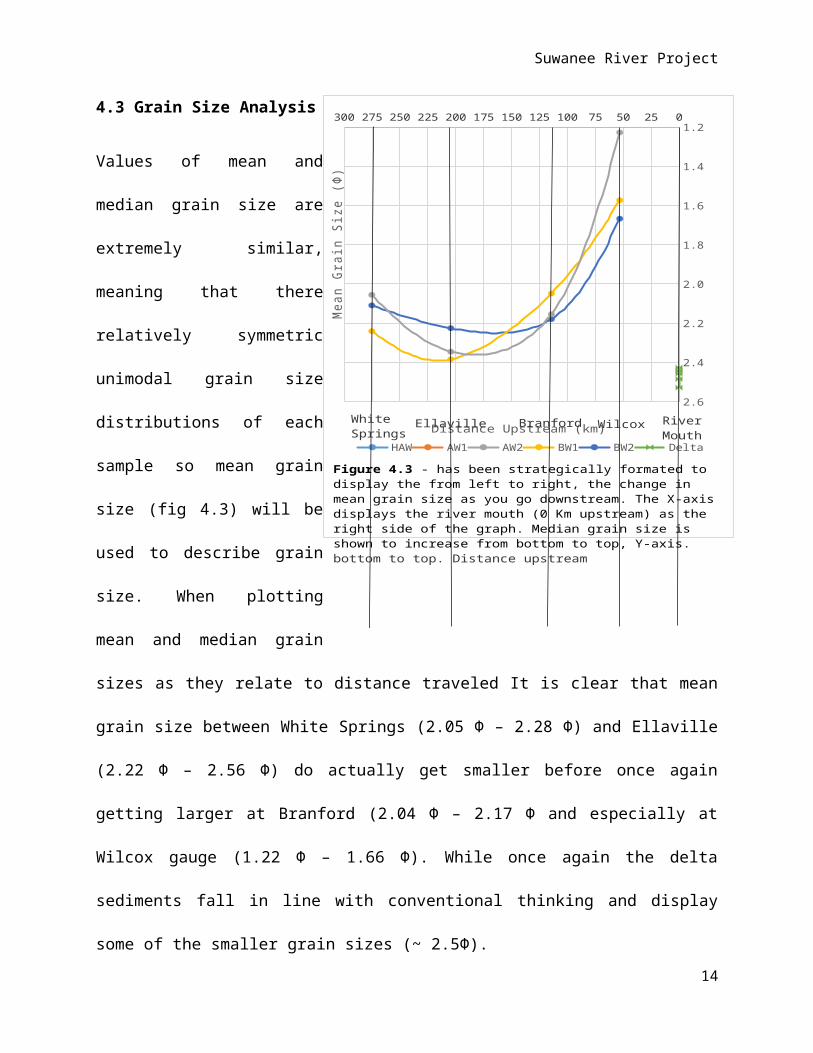
4.3 Grain Size Analysis
Values of mean and median grain
size are extremely similar,
meaning that there relatively
symmetric unimodal grain size
distributions of each sample so
mean grain size (fig 4.3) will be
used to describe grain size. When
plotting mean and median grain
sizes as they relate to distance
traveled It is clear that mean grain
size between White Springs (2.05
Ф – 2.28 Ф) and Ellaville (2.22 Ф –
2.56 Ф) do actually get smaller
before once again getting larger at Branford (2.04 Ф – 2.17 Ф and especially at Wilcox gauge
(1.22 Ф – 1.66 Ф). While once again the delta sediments fall in line with conventional thinking
and display some of the smaller grain sizes (~ 2.5Ф).
5 - Discussion
10
02550751001251501752002252502753001.2
1.4
1.6
1.8
2.0
2.2
2.4
2.6
HAW AW1 AW2 BW1 BW2
Distance Upstream (km)
Mea
n Gr
ain
Size
(Ф)
Figure 4.3 - has been strategically formated to display the from left to right, the change in mean grain size as you go downstream. The X-axis displays the river mouth (0 Km upstream) as the right side of the graph. Median grain size is shown to increase from bottom to top, Y-axis.bottom to top. Distance upstream
WhiteSprings Ellaville Branford Wilcox River
Mouth
Suwanee River Project
From the results gathered, I suspect that there must be some change in properties of the rock
that the
Suwannee River meanders through to create such
unconventional grain size, grain sorting and textural
properties as grains travel downstream. There
must be a reason why grain sorting gets poorer
between the White Springs and Ellaville gauge
then seems to progress towards a more better
sorted sediment at Branford gauge. Between Branford and Wilcox the sorting once again
become poorer before becoming very well sorted in the delta deposits.
11
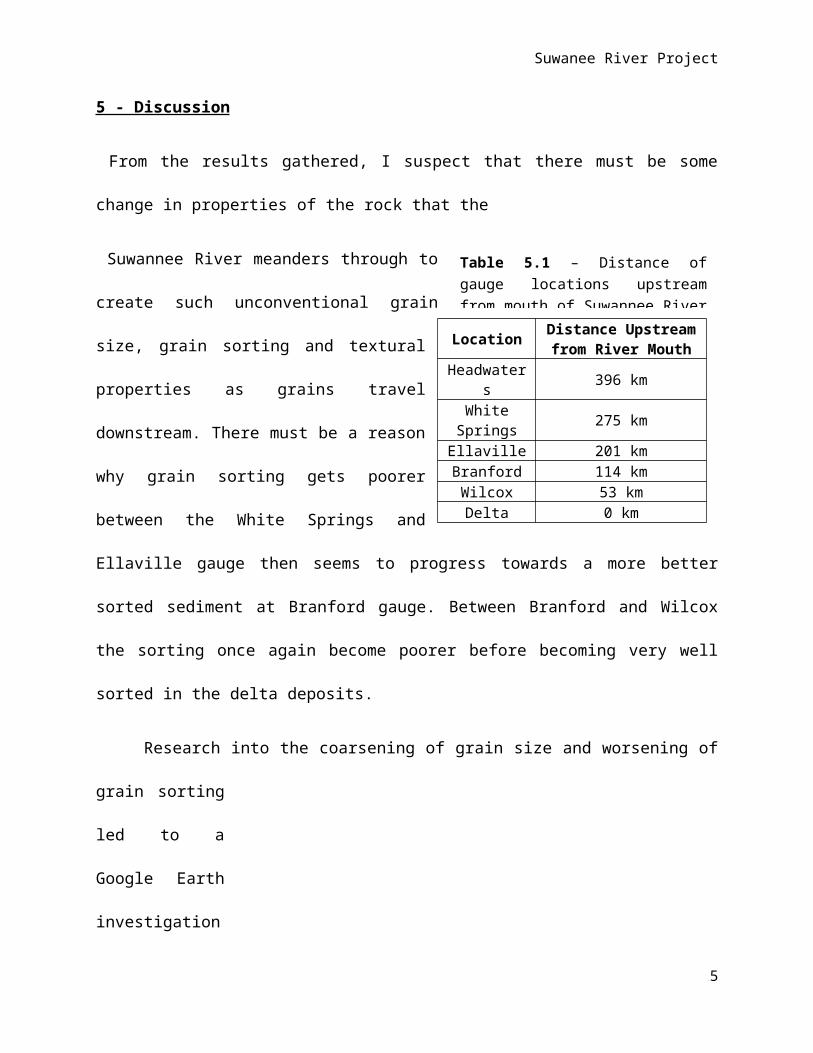
Table 5.1 – Distance of gauge locations upstream from mouth of Suwannee River in km. (USGS, 2014)
Location Distance Upstream from River Mouth
Headwaters 396 kmWhite Springs 275 km
Ellaville 201 kmBranford 114 kmWilcox 53 kmDelta 0 km
Suwanee River Project
Research into the coarsening of grain size and worsening of grain sorting led to a Google
Earth investigation
of the region.
Following the river
looking for changes
in Suwannee River
discharge or some
other reason why
grain sorting would
get poorer over the
74 km stretch
between White Springs gauge and Ellaville gauge. The Ellaville gauge is located just downstream
and across on the other side of the Suwannee from the confluence of the Suwannee River and
the Withlacoochee River. The Withlacoochee River originates just northwest of Valdosta, Ga,
185 km upstream from its confluence with the Suwannee. That is an additional 64 km of the
12
0 25 50 75 100 12502468
101214161820
Distance from arbitrary location beyond left bank (m)
Elev
ation
abo
ve S
ea Le
vel (
m)
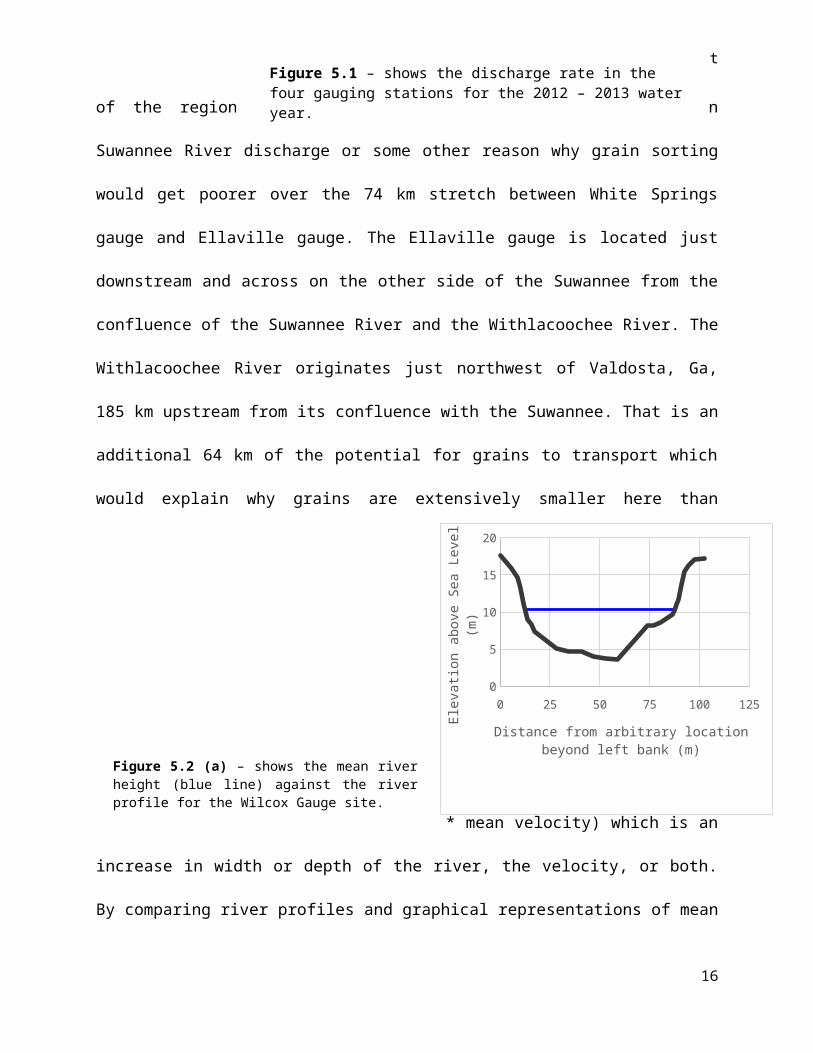
Figure 5.2 (a) – shows the mean river height (blue line) against the river profile for the Wilcox Gauge site.
Figure 5.2 (b) – shows the mean river height (blue line) against the river profile for the Ellaville Gauge site.
Figure 5.1 – shows the discharge rate in the four gauging stations for the 2012 – 2013 water year. Figure 5.1 – shows the discharge rate in the four gauging stations for the 2012 – 2013 water year. Figure 5.1 – shows the discharge rate in the four gauging stations for the 2012 – 2013 water year. Figure 5.1 – shows the discharge rate in the four gauging stations for the 2012 – 2013 water year. Figure 5.1 – shows the discharge rate in the four gauging stations for the 2012 – 2013 water year. Figure 5.1 – shows the discharge rate in the four gauging stations for the 2012 – 2013 water year. Figure 5.1 – shows the discharge rate in the four gauging stations for the 2012 – 2013 water year. Figure 5.1 – shows the discharge rate in the four gauging stations for the 2012 – 2013 water year. Figure 5.1 – shows the discharge rate in the four gauging stations for the 2012 – 2013 water year. Figure 5.1 – shows the discharge rate in the four gauging stations for the 2012 – 2013 water year. Figure 5.1 – shows the discharge rate in the four gauging stations for the 2012 – 2013 water year. Figure 5.1 – shows the discharge rate in the four gauging stations for the 2012 – 2013 water year.
Figure 5.2 (a) – shows the mean river height (blue line) against the river profile for the Wilcox Gauge site.Figure 5.2 (a) – shows the mean river height (blue line) against the river profile for the Wilcox Gauge site.Figure 5.2 (a) – shows the mean river height (blue line) against the river profile for the Wilcox Gauge site.Figure 5.2 (a) – shows the mean river height (blue line) against the river profile for the Wilcox Gauge site.Figure 5.2 (a) – shows the mean river height (blue line) against the river profile for the Wilcox Gauge site.Figure 5.2 (a) – shows the mean river height (blue line) against the river profile for the Wilcox Gauge site.Figure 5.2 (a) – shows the mean river height (blue line) against the river profile for the Wilcox Gauge site.Figure 5.2 (a) – shows the mean river height (blue line) against the river profile for the Wilcox Gauge site.Figure 5.2 (a) – shows the mean river height (blue line) against the river profile for the Wilcox Gauge site.Figure 5.2 (a) – shows the mean river height (blue line) against the river profile for the Wilcox Gauge site.Figure 5.2 (a) – shows the mean river height (blue line) against the river profile for the Wilcox Gauge site.Figure 5.2 (a) – shows the mean river height (blue line) against the river profile for the Wilcox Gauge site.
Suwanee River Project
potential for grains to transport which would explain why grains are extensively smaller here
than anywhere else in the Suwannee system. The increase in volume of water also increases
the discharge rate (area of cross section * mean velocity) which is an increase in width or depth
of the river, the velocity, or both. By comparing river profiles and graphical representations of
mean discharge rates between the White Springs and Ellaville gauge it is obvious that just
downstream from the confluence of the Withlacoochee River, the Suwannee has a much larger
river profile and much higher stream discharge rates, especially during times of higher rainfall
values. Ribeiro et al. (2012) suggests that at river confluences the tributary enters the main
channel and only penetrates the upper portions of the water column while the main river water
column is hardly hindered. This would be true here assuming that the Withlacoochee River has
a higher bed discordance (channel elevation) than the Suwannee River. Ribeiro et al , further
explains that sediment transport capacity is increased due to an increase in stream velocity.
This conforms to the data and observations made at the Ellaville gauge just south of the
confluence. As the higher portion of the water column flows across the top of the Suwannee, it
is possible that its effect on the opposite bank (where Ellaville gauge is located) creates a
deposition bar that reduces the flow area and causes flow acceleration that contributes to an
increase in sediment transport capacity.” (Ribeiro et al, 2012). This explains why there is a
decrease of sorting at Ellaville and a decrease in mean grain size. The sorting gets worse
because the finer material from the Withlacoochee is building up along the bank of the Ellaville
gauge essentially becoming more of the sediment percentage along the bank while river
velocity increases because of the thinning of the river profile compared to just before the
confluence.
13
Suwanee River Project
Between the Ellaville gauge and Branford gauge exhibited no visible evidence water
injection or any other additional
change to water volume and
velocity other than the obvious
accumulation of rain water. By
using samples that were below
water line for both Ellaville and
Branford locations and looking
at their graphs, grain sorting
once again becomes well sorted
but mean grain size coarsens for all samples. According to convention, an increase in stream
velocity conforms to an increase in grain size. Therefore the Suwannee River must be
accumulating large amounts of water between these two gauge sites. A look at the river profile
reveals that the stream cross section is even larger than the Ellaville gauge which means that in
order for velocity to increase, an injection of water must occur between the Ellaville and
Branford gauges. The only viable explanation is of aquifer spring injection into the river and rain
accumulation.
By examining the length of the Suwannee between Branford and Wilcox it is clear that
another tributary flows into the Suwannee. Only this time it is ~ 47 km upstream from the
Wilcox gauge (~ 15 km downstream from the Branford gauge). This obviously further increases
the stream discharge. By looking at the river profile, we see that the stream has become
significantly lower gradient throughout its travel from the Okefenokee to the Wilcox location.
14
0 20 40 60 80 100 120-2
0
2
4
6
8
10
Distance from arbitrary location beyond left bank (m)
Elev
ation
abo
ve S
ea Le
vel (
m)
Figure 5.2 (c) – shows the mean river height (blue line) against the river profile for the Branford Gauge site.
Suwanee River Project
The stream bed has also become smoother across the section. Between Branford and Wilcox
gauges the grains of all samples get more poorly sorted and progressively coarser. This suggests
that the mass of water at Wilcox is moving at an even quicker velocity than anywhere else on
the stream, which conforms
to discharge rates
throughout most of the year
(fig 5.1).
Finally at the delta
we have the smallest mean
grain sizes (2.5 Ф) and its
average sorting is very well
sorted (0.27 Ф). From common
knowledge it makes sense that the smallest grains would accumulate here where the Suwannee
fans out and loses the majority of its velocity as it empties into the Gulf of Mexico. So this is
where all the small grains that were missing from the majority of the Suwannee River ended up.
In the end grain size fines downstream while sorting follows suit and becomes more well sorted
downstream. The last parameter, angularity, is the only outlier that showed no specific pattern
throughout the system. In the end texture remained subangular to angular at the last place of
possible deposition for the Suwannee River, the delta.
6 - Conclusions
15
0 20 40 60 80 100 120 140 160-8
-6
-4
-2
0
2
4
6
8
Distance from arbitrary location beyond left bank (m)
Elev
ation
abo
ve S
ea Le
vel (
m)
Figure 5.2 (d) – shows the mean river height (blue line) against the river profile for the Branford Gauge site.
Suwanee River Project
It is concluded that a variety of factors (tributary injection and rainfall runoff) led to
increases in stream velocity effectively increasing the grain entrainment potential to carry
larger and larger grains as they travel downstream the Suwannee River. Sediment grain sizes
did get smaller from White Springs gauge to the river mouth but at locations in between the
grain sizes were dependent on the presence of an increase in water, either from a tributary
confluence or possible spring injection from the aquifer. Grain sorting also became more well
sorted overall from headwaters to mouth, but once again the local sorting depended on a
variety of variables, even which side of the bank samples were taken from can affect the results
of the study. Finally grain texture failed to become rounder as they moved downstream. I have
no hypothesis why other than because of their extremely small sizes they have become more
tabular in shape like clays and silts tend to be.
Bibliography
District, S. R. W. M., SRWMD River Stations: http://www.mysuwanneeriver.org/rivers.htm, SRWMD, USGS.
16
Suwanee River Project
Folk, R. L., 1974, Petrology of Sedimentary Rocks, Austin, Tx, Hemphill, . 182
Gelbart, M., 2010, The Geological and Ecological History of the Okefenokee Swamp, Volume 2014: http://markgelbart.wordpress.com/2010/11/19/the-geological-and-ecological-history-of-the-okenfenokee-swamp-part-one/, p. Provides a brief Geologic History of the Okefenokee Swamp.
Knighton, A. D., 1980, Longitudinal changes in size and sorting of stream-bed material in four English rivers.: Geological Society of America Bulletin, v. 91, no. 1, p. 55-62.
Ribeiro, M. L., Blanckaert, K., Roy, A. G., and Schleiss, A. J., 2012, Flow and sediment dynamics in channel confluences: Journal of Geophysical Research-Earth Surface, v. 117.
Scott, T. M., Campbell, K. M., Rupert, F. R., Arthur, J. D., Missimer, T. M., Lloyd, J. M., Yon, J. W., and Duncan, J. G., Geologic Map of the State of Florida: Florida Geological SocietyFlorida Department of Environmental Protection.
Snelder, T. H., Lamouroux, N., and Pella, H., 2011, Empirical modelling of large scale patterns in river bed surface grain size: Geomorphology, v. 127, no. 3-4, p. 189-197.
USGS, National Water Information System: Web Interface, Volume 2014: http://waterdata.usgs.gov/nwis, USGS, p. Provides location and water data for a variety of water gauges operated by the USGS.
17
Related Documents


