A comparison of DNA- and RNA-based clone libraries from the same marine bacterioplankton community Markus M. Moeseneder * , Jesus M. Arrieta, Gerhard J. Herndl Department of Biological Oceanography, Royal Netherlands Institute for Sea Research (NIOZ), P.O. Box 59, NL-1790 AB Den Burg, The Netherlands Received 8 June 2004; received in revised form 15 September 2004; accepted 22 September 2004 First published online 28 October 2004 Abstract Clones from the same marine bacterioplankton community were sequenced, 100 clones based on DNA (16S rRNA genes) and 100 clones based on RNA (16S rRNA). This bacterioplankton community was dominated by a-Proteobacteria in terms of repetitive DNA clones (52%), but c-Proteobacteria dominated in terms of repetitive RNA clones (44%). The combined analysis led to a char- acterization of phylotypes otherwise uncharacterized if only the DNA or RNA libraries would have been analyzed alone. Of the DNA clones, 25.5% were found only in this library and no close relatives were detected in the RNA library. For clones from the RNA library, 21.5% of RNA clones did not indicate close relatives in the DNA library. Based on the comparisons between DNA and RNA libraries, our data indicate that the characterization of the bacterial community based on RNA has the potential to characterize distinct phylotypes from the marine environment, which remain undetected on the DNA level. Ó 2004 Federation of European Microbiological Societies. Published by Elsevier B.V. All rights reserved. Keywords: 16S rRNA gene; 16S rRNA; Bacterioplankton; Phylogeny; Aegean Sea 1. Introduction Molecular techniques as tools in aquatic microbial ecology brought new insights into the community struc- ture and dynamics of marine Bacteria [1–3]. Most of these studies used 16S rRNA gene approaches and re- vealed a complex bacterial community structure with novel gene lineages in the sea [4,5]. However, the inter- pretation of 16S rRNA gene approaches has been com- plicated in the last years, because microorganisms harbor multiple, heterogeneous rRNA operons [6,7]. Bacteria have 1–15 rRNA operons, reflecting different ecological strategies of growth and activity [7]. Klappen- bach et al. [7] showed that soil Bacteria rapidly forming colonies upon exposure to complex medium had, on average, a higher copy number of rRNA operons (5.5 copies) than slowly growing colonies (1.4 copies), which has been interpreted as a higher fitness of Bacteria with repetitive rRNA operons in environments with periodic resource fluctuations. Bacteria from environments with a more constant supply of resources seem to have a low number of rRNA operons within the genome. For example, a bacterium isolated from the oligotrophic marine environment exhibited slow growth rates in the lab and only 1 rRNA operon [8]. Still, high in situ met- abolic rates of these Bacteria with a single rRNA operon could also indicate that keeping the cell volume, the gen- ome and the number of rRNA operons small, might al- low higher metabolic rates and faster reproduction in an oligotrophic environment [8–10]. Bacteria also have to sustain prolonged periods of starvation in the marine environment when available re- sources do not support bacterial growth [11–13]. On the 0168-6496/$22.00 Ó 2004 Federation of European Microbiological Societies. Published by Elsevier B.V. All rights reserved. doi:10.1016/j.femsec.2004.09.012 * Corresponding author. Present address: Department of Microbi- ology, Oregon State University, 220 Nash Hall, Corvallis, OR 97331, USA. Tel.: +541 737 1889; fax: +541 737 0496. E-mail address: [email protected] (M.M. Moeseneder). www.fems-microbiology.org FEMS Microbiology Ecology 51 (2005) 341–352

Welcome message from author
This document is posted to help you gain knowledge. Please leave a comment to let me know what you think about it! Share it to your friends and learn new things together.
Transcript
www.fems-microbiology.org
FEMS Microbiology Ecology 51 (2005) 341–352
A comparison of DNA- and RNA-based clone libraries fromthe same marine bacterioplankton community
Markus M. Moeseneder *, Jesus M. Arrieta, Gerhard J. Herndl
Department of Biological Oceanography, Royal Netherlands Institute for Sea Research (NIOZ), P.O. Box 59, NL-1790 AB Den Burg, The Netherlands
Received 8 June 2004; received in revised form 15 September 2004; accepted 22 September 2004
First published online 28 October 2004
Abstract
Clones from the same marine bacterioplankton community were sequenced, 100 clones based on DNA (16S rRNA genes) and
100 clones based on RNA (16S rRNA). This bacterioplankton community was dominated by a-Proteobacteria in terms of repetitive
DNA clones (52%), but c-Proteobacteria dominated in terms of repetitive RNA clones (44%). The combined analysis led to a char-
acterization of phylotypes otherwise uncharacterized if only the DNA or RNA libraries would have been analyzed alone. Of the
DNA clones, 25.5% were found only in this library and no close relatives were detected in the RNA library. For clones from the
RNA library, 21.5% of RNA clones did not indicate close relatives in the DNA library. Based on the comparisons between
DNA and RNA libraries, our data indicate that the characterization of the bacterial community based on RNA has the potential
to characterize distinct phylotypes from the marine environment, which remain undetected on the DNA level.
� 2004 Federation of European Microbiological Societies. Published by Elsevier B.V. All rights reserved.
Keywords: 16S rRNA gene; 16S rRNA; Bacterioplankton; Phylogeny; Aegean Sea
1. Introduction
Molecular techniques as tools in aquatic microbial
ecology brought new insights into the community struc-
ture and dynamics of marine Bacteria [1–3]. Most of
these studies used 16S rRNA gene approaches and re-
vealed a complex bacterial community structure with
novel gene lineages in the sea [4,5]. However, the inter-pretation of 16S rRNA gene approaches has been com-
plicated in the last years, because microorganisms
harbor multiple, heterogeneous rRNA operons [6,7].
Bacteria have 1–15 rRNA operons, reflecting different
ecological strategies of growth and activity [7]. Klappen-
bach et al. [7] showed that soil Bacteria rapidly forming
0168-6496/$22.00 � 2004 Federation of European Microbiological Societies
doi:10.1016/j.femsec.2004.09.012
* Corresponding author. Present address: Department of Microbi-
ology, Oregon State University, 220 Nash Hall, Corvallis, OR 97331,
USA. Tel.: +541 737 1889; fax: +541 737 0496.
E-mail address: [email protected] (M.M. Moeseneder).
colonies upon exposure to complex medium had, on
average, a higher copy number of rRNA operons (5.5
copies) than slowly growing colonies (1.4 copies), which
has been interpreted as a higher fitness of Bacteria with
repetitive rRNA operons in environments with periodic
resource fluctuations. Bacteria from environments with
a more constant supply of resources seem to have a
low number of rRNA operons within the genome. Forexample, a bacterium isolated from the oligotrophic
marine environment exhibited slow growth rates in the
lab and only 1 rRNA operon [8]. Still, high in situ met-
abolic rates of these Bacteria with a single rRNA operon
could also indicate that keeping the cell volume, the gen-
ome and the number of rRNA operons small, might al-
low higher metabolic rates and faster reproduction in an
oligotrophic environment [8–10].Bacteria also have to sustain prolonged periods of
starvation in the marine environment when available re-
sources do not support bacterial growth [11–13]. On the
. Published by Elsevier B.V. All rights reserved.

342 M.M. Moeseneder et al. / FEMS Microbiology Ecology 51 (2005) 341–352
RNA level during starvation, ribosomes and ultimately
rRNA decrease to minimal levels within the cell [8,14]
and several studies point to a linear relationship between
rRNA content and the growth rate of bacterial cells [15–
18]. On a per cell base, ribosomes are much more abun-
dant than rRNA operons. Depending on the growthrate of the bacterium, between 6800 and 72,000 ribo-
somes cell�1 have been found for Escherichia coli [19]
and between 200 and 2000 for an oligotrophic ultra-
microbacterium [8]. Exceptions to these observations
also exist as a marine Vibrio sp. strain contained a
higher number of ribosomes during starvation periods,
which has been attributed to the ability of this strain
to immediately regain high activity as soon as starvationis ceased [20]. Still, because of the generally higher num-
ber of ribosomes in metabolically active Bacteria than in
dormant cells, it is assumed that the analysis of rRNA
rather than genomic DNA provides a tool to determine
the metabolically active cells [21,22]. Thus, under oligo-
trophic marine conditions, the RNA content per cell
might be low, which could also explain the lower fluores-
cence in situ (FISH) hybridization counts with Bacteria-specific probes compared to the overall abundance [23].
As an alternative, the analysis of �bulk� RNA with tech-
niques like quantitative hybridization seems to be a
much more promising tool to analyze microorganisms
with low per cell RNA content, although compared to
sequencing, the use of a single hybridization probe
might drastically decrease the phylogenetic resolution
[24]. Most of the molecular studies on marine bacterio-plankton are based on the analysis of DNA or RNA and
comprehensive results on the simultaneous analysis of
marine bacterioplankton on their DNA and RNA level
with the same experimental approach are still missing.
From previous T-RFLP and DGGE fingerprinting
results [25,26], we expected differences between DNA
and RNA clone libraries. Because of the lower number
of rRNA operons compared to ribosomes per cell, thedetection of Bacteria based on 16S rRNA genes might
be mainly determined by the cellular abundance of the
organisms in the environment. In contrast, Bacteria
present in low cellular abundance and therefore prob-
ably not detectable on the DNA level, but with a high-
er ribosome content might be still detectable with
RNA clone analysis. Thus, with DNA and RNA
sequencing, new insights into the total bacterial com-munity and in its potentially active fraction should
be a first step to a better understanding of different
bacterial phylotypes in the oligotrophic marine
environment.
2. Materials and methods
Details about sample collection, extraction/purifica-
tion of nucleic acids, cDNA synthesis for reverse
transcription-PCR (RT-PCR), PCR and RT-PCR con-
ditions can be found elsewhere [25].
2.1. Sample collection, extraction and purification of
nucleic acids
In brief, the complex bacterial community used in this
study originated from 200 m depth of the North Aegean
Sea (39�13.45N, 25�00.00E). Five liter seawater was pre-filtered and prokaryotes passing the Whatman GF/C fil-
ter were concentrated onto 0.22 lmpolycarbonate filters.
The microorganisms on these filters were suspended in 2
ml lysis buffer, incubated with lysozyme followed by an
incubation with sodium dodecyl sulfate and ProteinaseK. The lysate was extracted with an equal volume
of phenol:chlorform:isoamylalcohol (25:24:1) and subse-
quently with an equal volume of chloroform:
isoamylalcohol (24:1). The nucleic acids were precipi-
tated, re-suspended in 200 ll diethyl pyrocarbonate-
treated water and stored at �80� C. RNA was removed
from DNA with DNase-free RNase and purified using
the Qiaex II Kit. For RNA purification, DNA wasremoved with 20U RNase-free DNase. RNA was phenol
extracted and precipitated as described above for the
nucleic acids. The efficiency of the DNA removal from
RNA was checked as previously described [25].
2.2. cDNA synthesis for reverse-transcription
polymerase chain reaction (RT-PCR), PCR and
RT-PCR conditions
The transcription of 16S rRNA into cDNA was per-
formed with �first-strand-reaction-mix-beads� using a
pd(N)6-primer. The primers used for PCR and RT-
PCR were the Bacteria specific primer 27F and the uni-
versal primer 1492R. After (RT-) PCR for 30 cycles, the
(RT-) PCR products were purified with the Qiaquick
PCR Purification Kit and quantified by comparing theband intensity of the PCR product with a Smart Ladder
(Eurogentec, Searing, Belgium) as a concentration
standard in a 1% agarose gel.
2.3. Cloning and sequencing
Fifty ng PCR product (insert:vector molar ratio of
3:1) was used for cloning reactions using the pGEMcloning kit (pGEM-T Easy Vector Systems, Promega,
Leiden, The Netherlands) following the recommenda-
tions of the manufacturer. Insert-containing colonies
were re-suspended in 200 ll ultrapure water (Sigma,
Zwijndrecht, The Netherlands). Cell suspensions of
individual bacterial clones were pelleted at 3200g for
20 min. Pure plasmids from the cell pellets were ob-
tained with the Qiaprep miniprep kit (Qiagen).Sequencing reactions were performed using the Big-
Dye Terminator Cycle Sequencing Kit (PE Applied

M.M. Moeseneder et al. / FEMS Microbiology Ecology 51 (2005) 341–352 343
Biosystems). Each cycle sequencing reaction contained
500 ng cleaned plasmid, 4 ll 5 · BigDye Terminator
buffer (400 mM Tris–HCl (pH 9.0), 10 mM MgCl2),
2 ll Ready Reaction Mix from the BigDye Kit, 0.8
ll of the primer (5 lM, 27F, 518F (5 0-CCAG-
CAGCCGCGGTAAT-3 0) or 1492R) adjusted withultrapure water (Sigma) to a final volume of 20 ll.All clones were sequenced with the 27F primer for 2
h, giving a �300 bp sequence. For the sequences
where full length inserts (�1500 bp) were analyzed,
additional sequencing reactions were performed with
the primers 27F, 518F and 1492R. Alignment was per-
formed as described below. Cycling conditions started
with an initial denaturation at 96 �C for 1 s, followedby 25 cycles of denaturation at 96 �C for 10 s, anneal-
ing at 55 �C (50 �C for primer 518F) for 5 s and
extension at 60 �C for 4 min. Samples were precipi-
tated with 80 ll of 75% isopropanol (vol./vol.) and
re-suspended in 12 ll TSR (Template Suppression
Reagent, PE Applied Biosystems). Sequencing was
performed in an ABI Prism 310 capillary sequencer
(PE Applied Biosystems) using POP 6 and the proto-col supplied by the manufacturer.
2.4. Phylogenetic analysis
Partial or full length sequences for selected clones
were combined by pre-alignment with SeqApp
(http://iubio.bio.indiana.edu/soft/molbio/seqapp/). Se-
quences were imported into ARB [27]. Alignmentwas performed using the automatic aligner in ARB
and pre-aligned sequences were checked manually for
small sequencing errors, instrument reading errors,
correct alignment, secondary structure and correct
group consensus alignments. Chimeric structures from
PCR amplification should be detectable as changes in
the secondary structure of the sequence. Our clones
indicated two 16S rRNA gene sequences of chimericorigin, which were removed from analysis. Addition-
ally, all sequences were checked using the online anal-
ysis CHECK_CHIMERA [28]. However, we found the
manual control of the secondary structure superior
over the CHECK_CHIMERA, as this analysis gives
occasionally contradictory results. The phylogenetic
tree was constructed with PAUP [29] using neighbor-
joining and parsimony methods. Neighbor joining(calculated with a distance matrix using a Kimura 2-
parameter model and assuming a transition/transver-
sion ratio of 2) and parsimony trees were inferred by
the heuristic search option. Maximum likelihood trees
were constructed with fastDNAml [30]. To evaluate
the neighbor-joining and parsimony trees, 100 boot-
strap re-samplings were performed to support the
topology of these trees. Instead of bootstrap analysisof maximum likelihood trees, posterior probability dis-
tributions were calculated using Baysian interference
and Markov chain Monte Carlo (MCMC) techniques
for phylogenetic tree reconstruction and comparison
[31]. The sequences have been submitted to the Gen-
Bank database [32] under the accession numbers
AF406316–AF406553.
2.5. Reliability of the cDNA approach
Marine bacterial strains (MS20, MS21, MS23) were
isolated from marine snow aggregates collected in the
Northern Adriatic Sea (3 km off the coast of Rovinj,
Croatia). Marine snow was collected [33] and strains iso-
lated as described previously [34]. Two ml liquid culture
grown overnight at 20 �C was centrifuged at 3200g for20 min and washed twice with STE buffer (100 mM
NaCl, 50 mM Tris–HCl [pH 7.4], 1 mM EDTA). Cell
pellets were stored at �80 �C until nucleic acid extrac-
tion (as described above). The DNA sequences obtained
from these strains were submitted to GenBank and are
available under the accession numbers AF237975–
AF237977. Reliability of the cDNA synthesis for subse-
quent reactions was first tested in experiments by mixingpure RNA, obtained by the same protocol as described
here, from the three strains with the following propor-
tions: 25 ng ll�1 RNA from strain MS20, 50 ng ll�1
from strain MS21 and 25 ng ll�1 from strain MS23.
RNA was quantified with the RiboGreen RNA quanti-
fication kit according the recommendations of the man-
ufacturer (Molecular Probes, Eugene, USA). After
cDNA synthesis of this mixture, the RT-PCR productwas cloned and the whole inserts (>1300 bp) of 37 ran-
domly picked clones were sequenced (as described
above).
2.6. Coverage values and phylotype definition
Coverage values were calculated to determine how
efficient our clone libraries described the complexity ofa theoretical community of infinite size, i.e., the original
community. The coverage [35] of the clone library is gi-
ven as C = 1 � (n1/N), where n1 is the number of clones
which occurred only once in the library and N is the to-
tal number of clones examined. For phylotype defini-
tion, we assumed a clone with a sequence similarity of
>97% over the first (using the 27F primer) �300 bp
sequenced to be an identical phylotype as suggestedpreviously [36,37].
3. Results and discussion
3.1. Reliability of rRNA reverse-transcription and
phylogenetic reconstruction
After cDNA synthesis, all RT-PCR products were
in the expected size (�1500 bp) and sequence analysis

344 M.M. Moeseneder et al. / FEMS Microbiology Ecology 51 (2005) 341–352
from the 37 RT-PCR products were >99% similar to
the corresponding strains when DNA was used as
template (data not shown). All 198 clones in our li-
brary (2 clones from the DNA library were of chi-
meric origin and therefore excluded) were
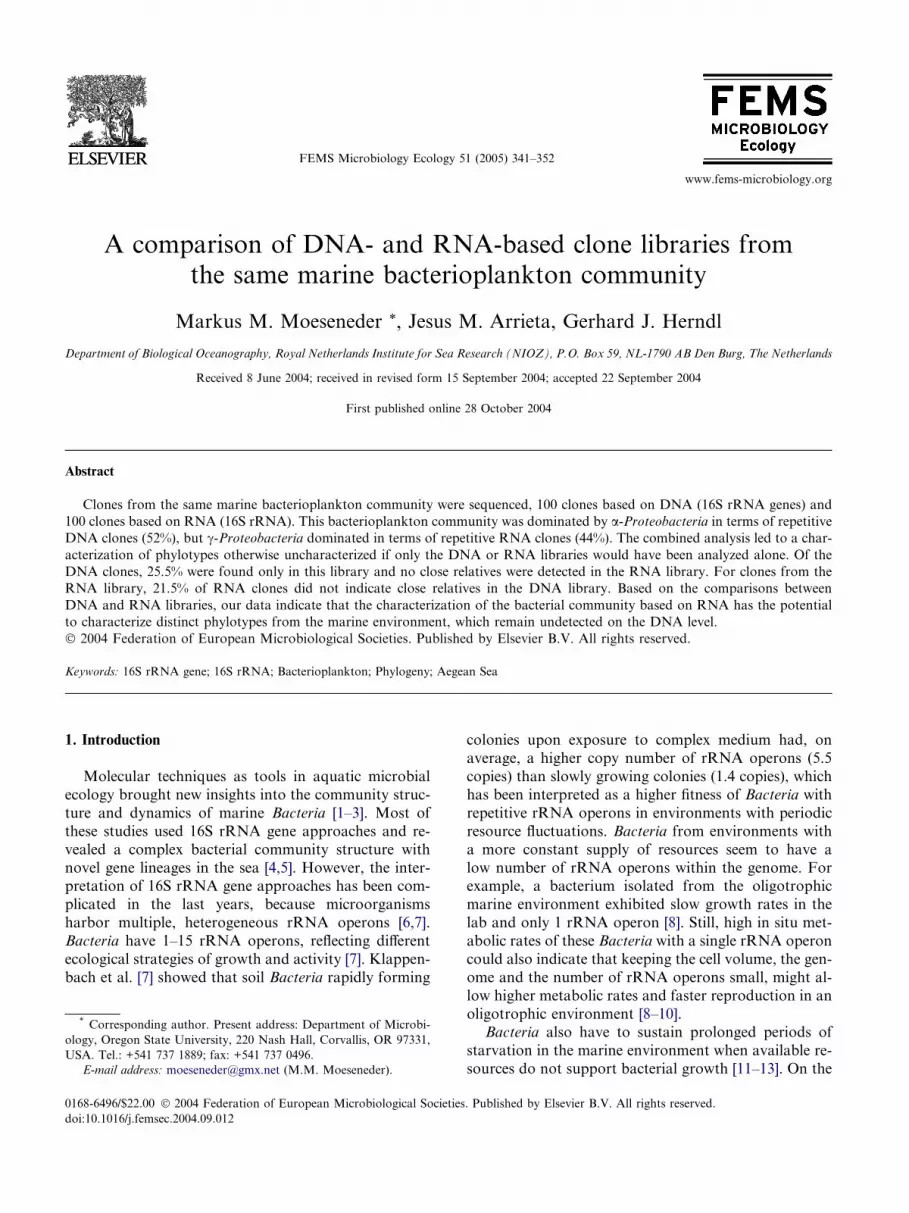
Fig. 1. Maximum likelihood tree inferred from 91 to 1460 bp (E. coli numb
neighbor joining, parsimony and maximum likelihood analysis are indicated
representative bootstrap support. The prefix �env.� denotes an environmen
accession numbers for clones presented in this study are provided in the expe
scores. The scale bar indicates 0.10 changes per site. (a) a-Proteobacteria, (b
characterized based on the first �300 bp to determine
their phylogenetic affiliation. Additionally, we se-
quenced >1300 bp from 40 representative clones
and clones with low BLAST scores. Separate trees
were constructed including partial and full-length se-
ering), bootstrap values or posterior probabilities (percentages) for the
above and below the corresponding nodes, respectively. �–� indicates notal gene clone and organisms in culture are in italics. The GenBank
rimental procedures section. Asterisks indicate clones with low BLAST
) c-Proteobacteria, (c) other groups.

Fig. 1 (continued)
M.M. Moeseneder et al. / FEMS Microbiology Ecology 51 (2005) 341–352 345
quences from all clones. Partial sequences always
formed clusters (>99% similarity) with full-length se-
quences from the same clones (data not shown).
Therefore, the full-length sequence trees shown in
Fig. 1 are representative for all clones found in the
DNA/RNA library.

Fig. 1 (continued)
346 M.M. Moeseneder et al. / FEMS Microbiology Ecology 51 (2005) 341–352
3.2. Clones from the DNA (16S rRNA gene) and RNA
(16S rRNA) library and their distribution in different
bacterial phyla
Most DNA and RNA clones (72.5%) fell into the
major phyla a- and c-Proteobacteria. The remaining
55 clones (27.5%) were related to the D-Proteobacteria,
green non-sulfur Bacteria, Cyanobacteria, plastids,
Bacteroidetes, Actinobacteria-Firmicutes, Chlorobium-
Fibrobacter and grouped together as shown in Table
1. DNA clones alone indicated that 52% were affiliated
to a-Proteobacteria and 22.44% to the c-Proteobacte-ria. The remaining DNA clones (25.51%) were distrib-
uted over distinct bacterial phyla, where only 1–7
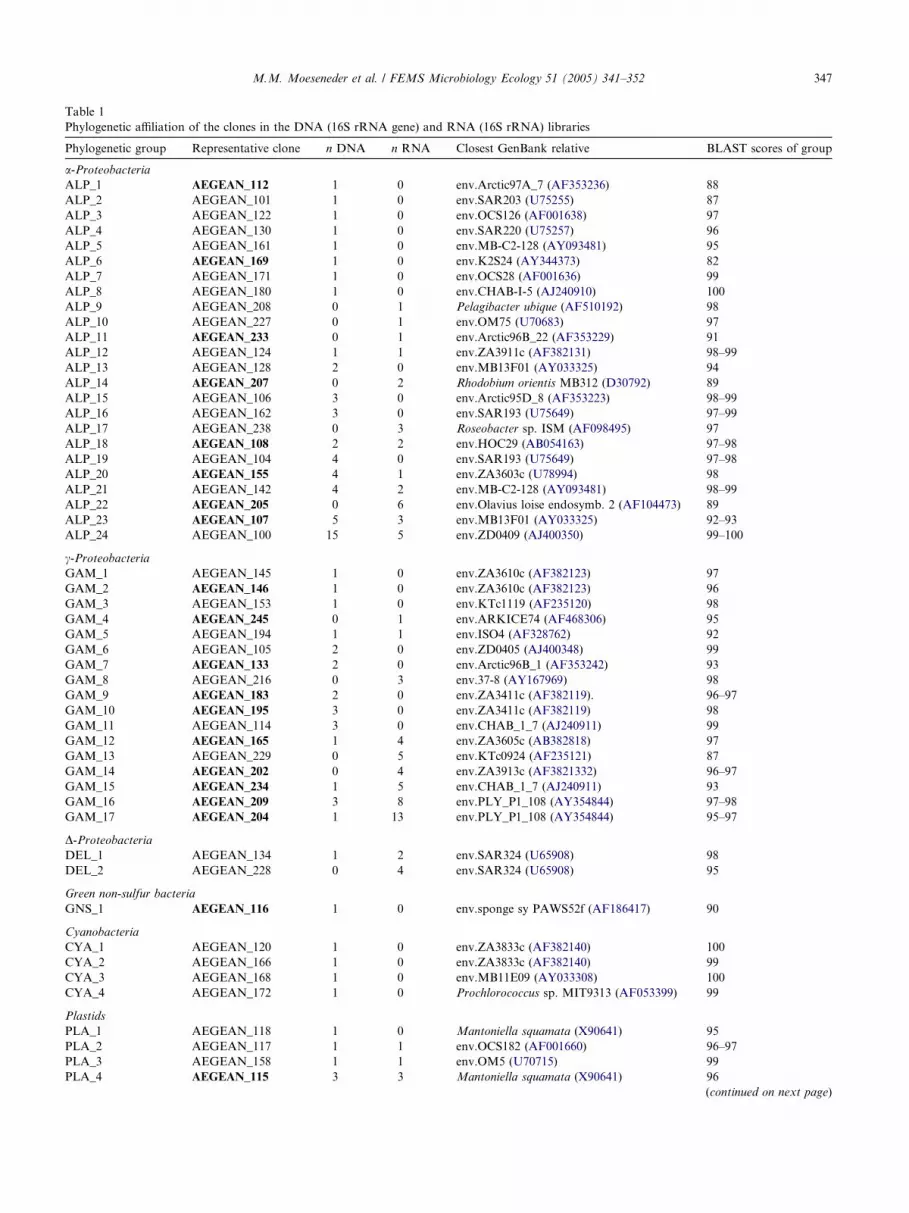
Table 1
Phylogenetic affiliation of the clones in the DNA (16S rRNA gene) and RNA (16S rRNA) libraries
Phylogenetic group Representative clone n DNA n RNA Closest GenBank relative BLAST scores of group
a-ProteobacteriaALP_1 AEGEAN_112 1 0 env.Arctic97A_7 (AF353236) 88
ALP_2 AEGEAN_101 1 0 env.SAR203 (U75255) 87
ALP_3 AEGEAN_122 1 0 env.OCS126 (AF001638) 97
ALP_4 AEGEAN_130 1 0 env.SAR220 (U75257) 96
ALP_5 AEGEAN_161 1 0 env.MB-C2-128 (AY093481) 95
ALP_6 AEGEAN_169 1 0 env.K2S24 (AY344373) 82
ALP_7 AEGEAN_171 1 0 env.OCS28 (AF001636) 99
ALP_8 AEGEAN_180 1 0 env.CHAB-I-5 (AJ240910) 100
ALP_9 AEGEAN_208 0 1 Pelagibacter ubique (AF510192) 98
ALP_10 AEGEAN_227 0 1 env.OM75 (U70683) 97
ALP_11 AEGEAN_233 0 1 env.Arctic96B_22 (AF353229) 91
ALP_12 AEGEAN_124 1 1 env.ZA3911c (AF382131) 98–99
ALP_13 AEGEAN_128 2 0 env.MB13F01 (AY033325) 94
ALP_14 AEGEAN_207 0 2 Rhodobium orientis MB312 (D30792) 89
ALP_15 AEGEAN_106 3 0 env.Arctic95D_8 (AF353223) 98–99
ALP_16 AEGEAN_162 3 0 env.SAR193 (U75649) 97–99
ALP_17 AEGEAN_238 0 3 Roseobacter sp. ISM (AF098495) 97
ALP_18 AEGEAN_108 2 2 env.HOC29 (AB054163) 97–98
ALP_19 AEGEAN_104 4 0 env.SAR193 (U75649) 97–98
ALP_20 AEGEAN_155 4 1 env.ZA3603c (U78994) 98
ALP_21 AEGEAN_142 4 2 env.MB-C2-128 (AY093481) 98–99
ALP_22 AEGEAN_205 0 6 env.Olavius loise endosymb. 2 (AF104473) 89
ALP_23 AEGEAN_107 5 3 env.MB13F01 (AY033325) 92–93
ALP_24 AEGEAN_100 15 5 env.ZD0409 (AJ400350) 99–100
c-ProteobacteriaGAM_1 AEGEAN_145 1 0 env.ZA3610c (AF382123) 97
GAM_2 AEGEAN_146 1 0 env.ZA3610c (AF382123) 96
GAM_3 AEGEAN_153 1 0 env.KTc1119 (AF235120) 98
GAM_4 AEGEAN_245 0 1 env.ARKICE74 (AF468306) 95
GAM_5 AEGEAN_194 1 1 env.ISO4 (AF328762) 92
GAM_6 AEGEAN_105 2 0 env.ZD0405 (AJ400348) 99
GAM_7 AEGEAN_133 2 0 env.Arctic96B_1 (AF353242) 93
GAM_8 AEGEAN_216 0 3 env.37-8 (AY167969) 98
GAM_9 AEGEAN_183 2 0 env.ZA3411c (AF382119). 96–97
GAM_10 AEGEAN_195 3 0 env.ZA3411c (AF382119) 98
GAM_11 AEGEAN_114 3 0 env.CHAB_1_7 (AJ240911) 99
GAM_12 AEGEAN_165 1 4 env.ZA3605c (AB382818) 97
GAM_13 AEGEAN_229 0 5 env.KTc0924 (AF235121) 87
GAM_14 AEGEAN_202 0 4 env.ZA3913c (AF3821332) 96–97
GAM_15 AEGEAN_234 1 5 env.CHAB_1_7 (AJ240911) 93
GAM_16 AEGEAN_209 3 8 env.PLY_P1_108 (AY354844) 97–98
GAM_17 AEGEAN_204 1 13 env.PLY_P1_108 (AY354844) 95–97
D-ProteobacteriaDEL_1 AEGEAN_134 1 2 env.SAR324 (U65908) 98
DEL_2 AEGEAN_228 0 4 env.SAR324 (U65908) 95
Green non-sulfur bacteria
GNS_1 AEGEAN_116 1 0 env.sponge sy PAWS52f (AF186417) 90
Cyanobacteria
CYA_1 AEGEAN_120 1 0 env.ZA3833c (AF382140) 100
CYA_2 AEGEAN_166 1 0 env.ZA3833c (AF382140) 99
CYA_3 AEGEAN_168 1 0 env.MB11E09 (AY033308) 100
CYA_4 AEGEAN_172 1 0 Prochlorococcus sp. MIT9313 (AF053399) 99
Plastids
PLA_1 AEGEAN_118 1 0 Mantoniella squamata (X90641) 95
PLA_2 AEGEAN_117 1 1 env.OCS182 (AF001660) 96–97
PLA_3 AEGEAN_158 1 1 env.OM5 (U70715) 99
PLA_4 AEGEAN_115 3 3 Mantoniella squamata (X90641) 96
(continued on next page)
M.M. Moeseneder et al. / FEMS Microbiology Ecology 51 (2005) 341–352 347

Table 1 (continued)
Bacteroidetes
B_1 AEGEAN_103 1 0 env.agg58 (L10946) 96
B_2 AEGEAN_179 1 0 env.GMD16C04 (AY162110) 88
B_3 AEGEAN_129 2 0 env.Arctic97A_13 (AF354618) 92
B_4 AEGEAN_150 2 0 env.NAC60_3 (AF245645) 95
Actinobacteria-Firmicutes
ACT_1 AEGEAN_163 1 0 env.MB11A03 (AY033296) 92
ACT_2 AEGEAN_173 1 0 env.ZA3111c (AF382115) 99
ACT_3 AEGEAN_113 1 1 env.ZA3635c (AF382139) 87
ACT_4 AEGEAN_193 2 0 env.ZA3111c (AF382115) 93
ACT_5 AEGEAN_182 1 3 env.ZA3409c (AF382122) 94
ACT_6 AEGEAN_241 0 7 env.ZA3612c (AF382135) 86
Chlorobium-Fibrobacter
CHL_1 AEGEAN_185 1 1 env.OCS307 (U41450) 91
CHL_2 AEGEAN_225 0 5 env.SAR406 (U34043) 94
Clones with a similarity of >97% were defined as the same phylotype and therefore grouped together. n = number of clones in the DNA and RNA
library, respectively. The prefix �env.� denotes an environmental gene clone and organisms in culture are in italics. Representative clones used for the
phylogenetic trees in Fig. 1 are in bold.
348 M.M. Moeseneder et al. / FEMS Microbiology Ecology 51 (2005) 341–352
clones were found per group (Table 2). For the RNA
library, 28% of the clones were affiliated to a-Proteo-bacteria, but 44% to the c-Proteobacteria. The remain-
Table 2
Distribution of the clones (n = number of clones) from the DNA (16S rRN
found in this study
Phylogenetic group Clones only in DNA or
RNA library n
Clon
RNA
a-Proteobacteria 34 45
ALP DNA 20 31
ALP RNA 14 14
c-Proteobacteria 28 38
GAM DNA 15 7
GAM RNA 13 31
Other groups 32 21
All DNA 16 9
All RNA 16 12
DEL DNA 0 1
DEL RNA 4 2
GNS DNA 1 0
GNS RNA 0 0
CYA DNA 4 0
CYA RNA 0 0
PLA DNA 1 5
PLA RNA 0 5
B DNA 6 0
B RNA 0 0
ACT DNA 4 2
ACT RNA 7 4
CHL DNA 0 1
CHL RNA 5 1
All clones 94 104
All DNA 51 47
All RNA 43 57
Removed clones
Chim. DNA 2 0
Chim. RNA 0 0
Clones from the DNA and RNA library were compared whether they were c
(i.e., clones with similarities >97% were found in the DNA and RNA libra
nd = not determined.
ing RNA clones (28%) were distributed over the
remaining phyla with 1–5 clones per group, except
for the clones affiliated to the Actinobacteria-Firmi-
A gene) and RNA (16S rRNA) among the main phylogenetic groups
es in DNA and
libraries n
Unique clones n Coverage values for
clones in this group %
14 82.3
9 82.4
5 82.2
9 86.4
7 68.2
2 95.5
20 62
16 36
4 86
1 nd
0 nd
1 nd
0 –
4 nd
0 –
3 nd
2 nd
2 nd
0 –
4 nd
1 nd
1 nd
1 nd
43 78.5
32 68
11 89
0 nd
0 –
haracteristic only for the DNA/RNA library or found in both libraries
ry). Coverage percentages were calculated as described in Section 2,

M.M. Moeseneder et al. / FEMS Microbiology Ecology 51 (2005) 341–352 349
cutes contributing 11% to the RNA clones (Table 2).
DNA clones in the a-Proteobacteria showed that
60% were >97% similar to the SAR11 clade, and
14% of these DNA clones clustered with SAR11
(SAR11 clustered, Fig. 1(a)). For the RNA clones,
36% fell into the SAR11 clade, and 14% clustered withSAR11. However, only 2 DNA clones and 1 RNA
clone fell into the SAR116 clade, and the remaining
clones grouped as shown in Table 1. Since 31% of
our DNA clones clustered within the SAR11 clade,
our results agree reasonably well with the �26% abun-
dance of SAR11 clones in DNA libraries from sea-
water and therefore potentially relate to oligotrophic
marine Bacteria [38,39]. Since our sample originatedfrom a depth of 200 m, only 10% of the clones in
the RNA library related to SAR11 and somehow
agreed with decreased FISH counts towards depth
for this clade [38]. On the other hand, 39% of the
RNA clones in the c-Proteobacteria fell into the
SAR86 clade (Fig. 1(b)). For the DNA clones, 23%
were related to the SAR86 clade and the remaining
RNA clones grouped as shown in Table 1. These re-sults indicate a well mixed water column since
SAR86 has been previously detected only in the sur-
face water column [3], where divergent proteorhodop-
sins light-driven proton pumps have been recently
detected in this group [40]. Furthermore, clones affili-
ated to Actinobacteria-Firmicutes (ACT_6) and Chloro-
bium-Fibrobacter (CHL_2) might also contribute to a
certain extent to the bacterial activity in the commu-nity, based on their occurrence only in the RNA li-
brary. A previous study confirmed the occurrence of
clones affiliated to Chlorobium-Fibrobacter at mesopel-
agic depths but rather on the DNA level [41], while we
detected these clones (e.g., Table 1 CHL_2) primarily
on the RNA level.
The combined analysis of DNA and RNA clones
from the same bacterial community leads to a character-ization of phylotypes otherwise uncharacterized when
the DNA or RNA clones would be analyzed alone. Ta-
ble 2 indicates that �25% of DNA clones are character-
istic only for this library, and no close relatives (>97%
similarity) in the RNA library were found. Comparable
values were also observed for clones from the RNA li-
brary, as �21% of RNA clones did not indicate close
relatives in the DNA library (Table 2). For example,clones related to ALP_19, GAM_10, GNS_1, CYA_1-4
and B_1-4 were only represented in the DNA library,
while clones related to ALP_22, GAM_14, DEL_2,
ACT_6 and CHL_2 only in the RNA library (Table 1).
Three aspects in the distribution pattern of clones in
the DNA and RNA libraries can be considered in an
ecological context. First, repetitive DNA clones (e.g.,
ALP_19, ALP_23, ALP_24, Table 1) might be repre-sentative for Bacteria high in cellular abundance and/
or with multiple operons within their cells. However,
the much lower number or absence of similar clones in
the RNA library could indicate that these DNA clones
are from Bacteria with less ribosomes and therefore,
probably representative for cells with reduced metabolic
activity. Secondly, a high number of repetitive clones in
the RNA library (e.g., GAM_17, Table 1) could repre-sent active members of the complex community with
more ribosomes present in their cells. Thirdly, clones
from Bacteria with low cellular abundance and/or low
operon numbers, which were not detected in the DNA
library, might indicate members in the complex commu-
nity that are not detectable on their DNA level (beyond
the detection threshold of our approach), but on their
RNA level (e.g., ALP_22, GAM_13, ACT_6, CHL_2).This observed mismatch between the DNA and RNA
libraries suggests that these clones originate from Bacte-
ria low in cellular abundance but with potentially high
metabolic activity as indicated by their clonal presence
in RNA libraries.
In our study, stringent controls in sample prepara-
tion, (RT-) PCR and sequencing were performed, how-
ever, we did not detect (RT-) PCR biases leading tosequencing artifacts, which could explain the observed
mismatch between our DNA and RNA libraries. In fact,
we found >97% sequence similarity between clones from
both libraries (�50% of all clones analyzed), indicating
that the often hypothesized increase in sequencing errors
and preferential chimera formation for RT-PCR prod-
ucts did not determine the outcome of our RNA library.
Only two sequences were chimeras and originated fromthe DNA library. Instead, we found well-aligned se-
quences for the DNA as well as the RNA library. We
are aware that our study does not address the possibility
that bacterial cells have to differ in numbers of rRNA
molecules as a function of size, physiology and even time
of the day. Furthermore large cells are likely to have
more rRNA even if growing at lower doubling times
than small (more) active cells. Besides these uncertain-ties, our study indicates that distinct microorganisms
with low BLAST scores (e.g., RNA clones ALP_22,
GAM_13 and CHL_2) might contribute to activity pat-
terns of marine microorganisms, which remained unde-
tected when 16S rRNA genes were analyzed.
Recent studies show that microheterogeneity ac-
counts for a large portion of the diversity (by means
of phylotype richness based on 16S rRNA genes) incomplex bacterial communities [42,43]. Most of the
diversity resulted from �50% of the sequences display-
ing <1% nucleotide difference to each other and it has
been hypothesized that �microdiversity� is a feature of
co-existing strains [42]. Since sequences with a similarity
>97% were considered the same phylotype and therefore
grouped together in our study, rRNA (gene) sequences
from different operons within the same cell would prob-ably fall within the same phylotype [6]. Higher similarity
values were used for phylotype characterization in

350 M.M. Moeseneder et al. / FEMS Microbiology Ecology 51 (2005) 341–352
microdiversity studies [42], thereby increasing the micro-
diversity tremendously. We applied the �common rule of
thumb�, which classifies organisms that are more than
3% different in 16S rRNA sequences as different phylo-
types [44]. This extrapolation has been used for the
majority of 16S rRNA gene clone libraries from variousenvironments, and seems therefore for the sake of com-
parison a valid phylotype detection threshold [45,46].
However, different �ecotypes� could share sequence sim-
ilarities >97% and would therefore group together with-
in the same phylotype [47]. Although our study does not
sample a bacterial community at such a high resolution
than these recent studies [42,43], our smaller clone
libraries indicate important differences between DNAand RNA libraries in (I) how clones from these 2 librar-
ies are repetitively distributed in different phyla and (II)
which phylotypes might be potentially important in
terms of metabolic activity and which are not. Thus,
our study contributes to the open question on the eco-
logical significance of this observed microdiversity when
RNA libraries are included in phylogenetic analysis.
This could reveal whether DNA or RNA microdiversityrepresents populations (�ecotypes�) that share similar
ecological niches and adaptations.
Still, because of the multiplicity and heterogeneity of
16S rRNA genes within bacterial strains [48,49], 16S
rRNA gene analysis is rather a proxy for sequence �di-versity� than for �diversity� of prokaryotic cells itself
[50]. Thus, multiple operons within the bacterial cell
could lead to a 2–15 times over-representation of certainclones, if we assume unbiased PCR amplification. Re-
cent analysis of bacterial genomes with multiple rRNA
operons indicated that a vast majority of interoperonic
sequence differences within 76 bacterial genomes showed
a <1% divergence, although the genomes under analysis
tend to have more operons since they were derived from
microorganisms in culture [6]. Taking these results into
consideration, there might be a 2.5 · overestimation ofbacterial diversity (by means of type richness) when
using cloning and sequencing approaches of 16S rRNA
genes. A recent study also indicates that a highly abun-
dant marine strain (Candidatus Pelagibacter ubique gen.
nov., sp. nov.) seems to have a single rRNA operon [42],
which has been previously found for another oligo-
trophic marine bacterium [8]. Whether this is a general
feature of marine microorganisms in the oligotrophicocean remains to be determined.
3.3. Unique clones in the DNA and RNA libraries and
coverage of these libraries
Unique clones (clones only once in the clone library)
were determined to evaluate the size of our clone librar-
ies. Since 72.5% of the clones in DNA and RNA librarieswere related to a- and c-Proteobacteria, high overall cov-
erage values within these groups indicate that the data
presented here are representative for the complex com-
munity, based on our combined DNA/RNA approach
(Table 2). For all clones in the DNA library, the coverage
was 68%, whereas for all clones in the RNA library the
coverage reached 89% (Table 2). Combining the DNA
and RNA libraries since they were derived from the nu-cleic acids of the same complex community, the coverage
was 78.5%. The observed lower coverage values for the
DNA library (68%) can be explained by the higher num-
ber of unique DNA clones (n = 16) affiliated to the �othergroups� cluster (Table 2). Unique clones were foundmore
often in the DNA library (32 clones) than in the RNA
library (11 clones), thereby contributing considerably
to the overall complexity (by lowering the coverage val-ues), while the RNA library seems less affected by unique
clones. Unique clones probably represent an insignificant
part of the community since they could originate from
Bacteria with low operon numbers and slow metabolism
[7] or Bacteria low in cellular abundance.
PCR (and cloning) biases [51] might explain the high
number of unique clones in our DNA library, because of
an inefficient amplification of template DNA, an uncer-tainty every PCR based approach is confronted with.
We do not know (and we are not aware of any study
that addresses this question) how many phylotypes are
actually excluded from molecular analysis because spe-
cific primers are used in 16S rRNA (gene) techniques.
Novel sensitive approaches [52,53] with specific FISH
probes for representative clones from the DNA and
RNA library could address many of the questions raisedabove. Also, the use of additional PCR primers with
other specificity might resolve some of PCR related
concerns [54].
Although we only analyzed a single free-living bacte-
rial community from the oligotrophic Aegean Sea, in-
sights into the bacterial community structure based on
DNA and RNA was obtained. The majority of our
clones indicated GenBank entries related to bacterio-plankton clones from major ocean provinces such as
the Sargasso Sea (22 clones), Atlanic Ocean (47 clones),
North Sea (53 clones), Arctic Ocean (10 clones), Pacific
Ocean (20 clones) as closest relatives. The remaining
clones were related to marine symbionts (11 clones),
deep sea microorganisms (7 clones), lake bacterioplank-
ton (1 clone), marine mesocosms (10 clones) and 17
clones could not be clearly affiliated where the clonesoriginated from. Although BLAST scores for our se-
quences were sometimes low, the dominance of related
sequences from various marine provinces as closest rela-
tives indicates that the DNA and RNA clone libraries
are representative for oceanic bacterioplankton. Inter-
estingly, RNA clones also showed low BLAST scores
to sequences from GenBank, indicating a potential char-
acterization of distinct phylotypes from the marine envi-ronment (Table 1). These results also indicate the
potential of this combined DNA/RNA approach for

M.M. Moeseneder et al. / FEMS Microbiology Ecology 51 (2005) 341–352 351
the characterization of the bacterial community and the
identification of members of the community on the
RNA level. Therefore, conservative estimates can be
made as abundant Bacteria, Bacteria with multiple oper-
ons per cell and Bacteria with higher ribosome numbers
per cell are likely to be repetitively more abundant inclone libraries.
Acknowledgements
We thank the captain and crew of the RV Aegaeo for
their help during sample collection and Christian Winter
for sample collection and nucleic acids extraction. Thismanuscript was supported by a grant from the Euro-
pean Union to G.J.H. (MAST-MTP II, MATER, No.
MAS3-CT96-0051).
References
[1] DeLong, E.F., Franks, D.G. and Alldredge, A.L. (1993) Phylo-
genetic diversity of aggregate-attached vs. free-living marine
bacterial assemblages. Limnol. Oceanogr. 38, 924–934.
[2] Fuhrman, J.A., McCallum, K. and Davis, A.A. (1993) Phylo-
genetic diversity of subsurface marine microbial communities
from the Atlantic and Pacific Oceans. Appl. Environ. Microbiol.
59, 1294–1302.
[3] Mullins, T.D., Britschgi, T.B., Krest, R.L. and Giovannoni, S.J.
(1995) Genetic comparisons reveal the same unknown bacterial
lineages in Atlantic and Pacific bacterioplankton communities.
Limnol. Oceanogr. 40, 148–158.
[4] Giovannoni, S.J., Britschgi, T.B., Moyer, C.L. and Field, K.G.
(1990) Genetic diversity in Sargasso Sea bacterioplankton. Nature
345, 60–63.
[5] Wright, T.D., Vergin, K.L., Boyd, P.W. and Giovannoni, S.J.
(1997) A novel delta-subdivision proteobacterial lineage from the
lower ocean surface layer. Appl. Environ. Microbiol. 63, 1441–
1448.
[6] Acinas, S.G., Marcelino, L.A., Klepac-Ceraj, V. and Polz, M.F.
(2004) Divergence and redundancy of 16S rRNA sequences in
genomes with multiple rrn operons. J. Bacteriol. 186, 2629–2635.
[7] Klappenbach, J.A., Dunbar, J.M. and Schmidt, T.M. (2000)
rRNA operon copy number reflects ecological strategies of
bacteria. Appl. Environ. Microbiol. 66, 1328–1333.
[8] Fegatella, F., Lim, J., Kjelleberg, S. and Cavicchioli, R. (1998)
Implications of rRNA operon copy number and ribosome
content in the marine oligotrophic ultramicrobacterium Sphingo-
monas sp. strain RB2256. Appl. Environ. Microbiol. 64, 4433–
4438.
[9] Button, D.K., Robertson, B.R., Lepp, P.W. and Schmidt, T.M.
(1998) A small, dilute-cytoplasm, high-affinity, novel bacterium
isolated by extinction culture and having kinetic constants
compatible with growth at ambient concentrations of dissolved
nutrients in seawater. Appl. Environ. Microbiol. 64, 4467–4476.
[10] Fegatella, F. and Cavicchioli, R. (2000) Physiological responses to
starvation in the marine oligotrophic ultramicrobacterium
Sphingomonas sp Strain RB2256. Appl. Environ. Microbiol. 66,
2037–2044.
[11] Kjelleberg, S., Flardh, K.B.G., Nystom, T. and Moriarty, D.J.W.
(1992) Growth limitation and starvation of bacteria In: Aquatic
Microbiology: An Ecological Approach (Ford, T., Ed.), pp. 289–
320. Blackwell Scientific Publications Inc., Boston.
[12] Morita, R.Y. (1985) Starvation and miniaturisation of hetero-
trophs, with special emphasis on maintenance of the starved
viable state. In: Bacteria in their Natural Environments (Fletcher,
M., Floodgate, G.D., Eds.), Vol. 16, pp. 111–130. Spec. Publ. Soc.
Gen. Microbiol., Symposium on Oligotrophic and Copiotrophic
Bacteria in Natural Environments. 99. Meeting of the Society for
General Microbiology, Reading (UK), 4–6 Jan 1984.
[13] Moyer, C.L. and Morita, R.Y. (1989) Effect of growth rate and
starvation-survival on cellular DNA, RNA, and protein of a
psychrophilic marine bacterium. Appl. Environ. Microbiol. 55,
2710–2716.
[14] Davis, B.D., Luger, S.M. and Tai, P.C. (1986) Role of ribosome
degradation in the death of starved Escherichia coli cells. J.
Bacteriol. 166, 439–445.
[15] DeLong, E.F., Wickham, G.S. and Pace, N.R. (1989) Phylo-
genetic stains: ribosomal RNA-based probes for the identification
of single cells. Science 243, 1360–1363.
[16] Kemp, P.F., Lee, S. and LaRoche, J. (1993) Estimating the
growth rate of slowly growing marine bacteria from RNA
content. Appl. Environ. Microbiol. 59, 2594–2601.
[17] Kerkhof, L. and Ward, B.B. (1993) Comparison of nucleic acid
hybridization and fluorometry for measurement of the relation-
ship between RNA/DNA ratio and the growth rate in a marine
bacterium. Appl. Environ. Microbiol. 59, 1303–1309.
[18] Lee, S.H. and Kemp, P.F. (1994) Single-cell RNA content of
natural marine planktonic bacteria measured by hybridization
with multiple 16S rRNA-targeted fluorescent probes. Limnol.
Oceanogr. 39, 869–879.
[19] Bremer, H. and Dennis, P.P. (1996) Modulation of chemical
composition and other parameters of the cell by growth rate In:
(Neidhardt, F.C., Curlus, R., Ingraham, J.L., Lin, E.C.C., Low,
B., Magasanik, B., Reznikoff, W.S., Riley, M., Schaechter, M.
and Umbarger, H.E., Eds.), pp. 1553–1569. ASM Press, Wash-
ington, DC.
[20] Flardh, K., Cohen, P.S. and Kjelleberg, S. (1992) Ribosomes exist
in large excess over the apparent demand for protein synthesis
during carbon starvation in marine Vibrio sp. strain CCUG
15956. J. Bacteriol. 174, 6780–6788.
[21] Poulsen, L.K., Ballard, G. and Stahl, D.A. (1993) Use of rRNA
fluorescence in situ hybridization for measuring the activity of
single cells in young and established biofilms. Appl. Environ.
Microbiol. 59, 1354–1360.
[22] Wawer, C., Jetten, M.S. and Muyzer, G. (1997) Genetic diversity
and expression of the [NiFe] hydrogenase large-subunit gene of
Desulfovibrio spp. in environmental samples. Appl. Environ.
Microbiol. 63, 4360–4369.
[23] Glockner, F.O., Fuchs, B.M. and Amann, R. (1999) Bacterio-
plankton compositions of lakes and oceans: a first comparison
based on fluorescence in situ hybridization. Appl. Environ.
Microbiol. 65, 3721–3726.
[24] Zheng, D., Alm, E.W., Stahl, D.A. and Raskin, L. (1996)
Characterization of universal small-subunit rRNA hybridization
probes for quantitative molecular microbial ecology studies.
Appl. Environ. Microbiol. 62, 4504–4513.
[25] Moeseneder, M.M., Winter, C. and Herndl, G.J. (2001) Hori-
zontal and vertical complexity of attached and free-living bacteria
of the eastern Mediterranean Sea determined by 16S rDNA and
16S rRNA fingerprints. Limnol. Oceanogr. 46, 95–107.
[26] Winter, C., Moeseneder, M.M. and Herndl, G.J. (2001) Impact of
ultraviolet radiation on bacterioplankton community composi-
tion. Appl. Environ. Microbiol. 67, 665–672.
[27] Ludwig, W., Strunk, O., Westram, R., Richter, L., Meier, H.,
Yadhukumar, A., Buchner, A., Lai, T., Steppi, S., Jobb, G.,
Forster, W., Brettske, I., Gerber, S., Ginhart, A.W., Gross, O.,
Grumann, S., Hermann, S., Jost, R., Konig, A., Liss, T.,
Lussmann, R., May, M., Nonhoff, B., Reichel, B., Strehlow, R.,
Stamatakis, A., Stuckmann, N., Vilbig, A., Lenke, M., Ludwig,
352 M.M. Moeseneder et al. / FEMS Microbiology Ecology 51 (2005) 341–352
T., Bode, A. and Schleifer, K.H. (2000) ARB: a software
environment for sequence data. Nucleic Acids Res. 32, 1363–1371.
[28] Maidak, B.L., Cole, J.R., Parker Jr., C.T., Garrity, G.M., Larsen,
N., Li, B., Lilburn, T.G., McCaughey, M.J., Olsen, G.J.,
Overbeek, R., Pramanik, S., Schmidt, T.M., Tiedje, J.M. and
Woese, C.R. (1999) A new version of the RDP (Ribosomal
Database Project). Nucleic Acids Res. 27, 171–173.
[29] Swofford, D.L. (2000) PAUP Phylogenetic analysis using
parsimony.
[30] Olsen, G.J., Matsuda, H., Hagstrom, R. and Overbeek, R. (1994)
A tool for contruction of phylogenetic trees of DNA sequences
using maximum likelihood. Comput. Appl. Biosci. 10, 41–48.
[31] Huelsenbeck, J.P. and Ronquist, F. (2001) MRBAYES: Bayesian
inference of phylogenetic trees. Bioinformatics 17, 754–755.
[32] Benson, D.A., Boguski, M.S., Lipman, D.J., Ostell, J. and
Ouellette, B.F. (1998) GenBank. Nucleic Acids Res. 26, 1–7.
[33] Muller-Niklas, G., Schuster, S., Kaltenbock, E. and Herndl, G.J.
(1994) Organic content and bacterial metabolism in amorphous
aggregations of the northern Adriatic Sea. Limnol. Oceanogr. 39,
58–68.
[34] Martinez, J., Smith, D.C., Steward, G.F. and Azam, F. (1996)
Variability in ectohydrolytic enzyme activities of pleagic marine
bacteria and its significance for substrate processing in the sea.
Aquat. Microb. Ecol. 10, 223–230.
[35] Good, I.J. (1953) The population frequencies of species and the
estimation of the population parameters. Biometrika 40, 237–
264.
[36] Rossello-Mora, R. and Amann, R. (2001) The species concept for
prokaryotes. FEMS Microbiol. Rev. 25, 39–67.
[37] Stackebrandt, E. and Goebel, B.M. (1994) Taxonomic note: a
place for DNA-DNA reassociation and 16S rRNA sequence
analysis in the present species definition in Bacteriology. Int. J.
Syst. Evol. Microbiol. 44, 846–849.
[38] Morris, R.M., Rappe, M.S., Connon, S.A., Vergin, K.L., Siebold,
W.A., Carlson, C.A. and Giovannoni, S.J. (2002) SAR11 clade
dominates ocean surface bacterioplankton communities. Nature
420, 806–810.
[39] Rappe, M.S., Connon, S.A., Vergin, K.L. and Giovannoni, S.J.
(2002) Cultivation of the ubiquitous SAR11 marine bacterio-
plankton clade. Nature 418, 630–633.
[40] Sabehi, G., Beja, O., Suzuki, M.T., Preston, C.M. and DeLong,
E.F. (2004) Different SAR86 subgroups harbour divergent pro-
teorhodopsins. Environ. Microbiol. 6, 903–910.
[41] Gordon, D.A. and Giovannoni, S.J. (1996) Detection of stratified
microbial populations related to Chlorobium and Fibrobacter
species in the Atlantic and Pacific Oceans. Appl. Environ.
Microbiol. 62, 1171–1177.
[42] Acinas, S.G., Klepac-Ceraj, V., Hunt, D.E., Pharino, C., Ceraj, I.,
Distel, D.L. and Polz, M.F. (2004) Fine-scale phylogenetic
architecture of a complex bacterial community. Nature 430,
551–554.
[43] Klepac-Ceraj, V., Bahr, M., Crump, B.C., Teske, A.P., Hobbie,
J.E. and Polz, M.F. (2004) High overall diversity and dominance
of microdiverse relationships in salt marsh sulphate-reducing
bacteria. Environ. Microbiol. 6, 686–698.
[44] Giovannoni, S. (2004) Evolutionary biology: oceans of bacteria.
Nature 430, 515–516.
[45] Kemp, P.F. and Aller, J.Y. (2004) Bacterial diversity in aquatic
and other environments: what 16S rDNA libraries can tell us.
FEMS Microbiol. Ecol. 47, 161–177.
[46] Kemp, P.F. and Aller, J.Y. (2004) Estimating prokaryotic
diversity: when are 16S rDNA libraries large enough. Limnol.
Oceanogr.: Methods 2, 114–125.
[47] Jaspers, E. and Overmann, J. (2004) Ecological significance of
microdiversity: identical 16S rRNA gene sequences can be found
in bacteria with highly divergent genomes and ecophysiologies.
Appl. Environ. Microbiol. 70, 4831–4839.
[48] Schmidt, T.M. (1994) Fingerprinting bacterial genomes using
ribosomal genes and operons. Methods Mol. Cell. Biol. 5, 3–
12.
[49] Schmidt, T.M. (1997) Multiplicity of ribosomal RNA operons in
prokaryotic genomes In: Bacterial Genomes Physical Structure
and Analysis (De Bruijn, F.J., Lupski, J.R. and Weinstock, G.M.,
Eds.), pp. 221–229. Chapman & Hall.
[50] Klappenbach, J.A., Saxman, P.R., Cole, J.R. and Schmidt, T.M.
(2001) rrndb: the ribosomal RNA operon copy number database.
Nucleic Acids Res. 29, 181–184.
[51] Suzuki, M.T. and Giovannoni, S.J. (1996) Bias caused by
template annealing in the amplification of mixtures of 16S rRNA
genes by PCR. Appl. Environ. Microbiol. 62, 625–630.
[52] Cottrell, M.T. and Kirchman, D.L. (2000) Natural assemblages
of marine proteobacteria and members of the cytophaga-
flavobacter cluster consuming low- and high-molecular-weight
dissolved organic matter. Appl. Environ. Microbiol. 66, 1692–
1697.
[53] Teira, E., Reinthaler, T., Pernthaler, A., Pernthaler, J. and
Herndl, G.J. (2004) Combining catalyzed reporter deposition-
fluorescence in situ hybridization and microautoradiography to
detect substrate utilization by bacteria and archaea in the deep
ocean. Appl. Environ. Microbiol. 70, 4411–4414.
[54] Dahllof, I., Baillie, H. and Kjelleberg, S. (2000) rpoB-based
microbial community analysis avoids limitations inherent in 16S
rRNA gene intraspecies heterogeneity. Appl. Environ. Microbiol.
66, 3376–3380.
Related Documents