A comparison of digital elevation models generated from different data sources S. Rayburg a , M. Thoms a, ⁎, M. Neave b a Riverine Landscapes Research Laboratory, University of Canberra, ACT 2601, Australia b Division of Geography, School of Geosciences, University of Sydney, NSW 2006, Australia abstract article info Article history: Received 4 August 2008 Received in revised form 2 November 2008 Accepted 4 November 2008 Available online 21 November 2008 Keywords: Landscape complexity Floodplain-wetland ecosystems Dryland LiDAR Narran ecosystem It can be challenging to accurately determine the topography of physically complex landscapes in remote areas. Ground-based surveys can be difficult, time consuming and may miss significant elements of the landscape. This study compares digital elevation models (DEMs) generated from three different data sources, of the physically complex Narran Lakes Ecosystem, a major floodplain wetland ecosystem in Australia. Topographic surfaces were generated from an airborne laser altimetry (LiDAR) survey, a ground-based differential GPS (DGPS) survey containing more than 20,000 points, and the 9″ DEM of Australia. The LiDAR- and DGPS-derived data generated a more thorough DEM than the 9″ DEM; however, LiDAR generated a surface topography that yielded significantly more detail than the DGPS survey, with no noticeable loss of elevational accuracy. Both the LiDAR- and the DGPS-derived DEMs compute the overall surface area and volume of the largest floodplain lake within the system to within 1% of each other. LiDAR is shown to be a highly accurate and robust technique for acquiring large quantities of topographic data, even in locations that are unsuitable for ground surveying and where the overall landscape is of exceptionally low relief. The results of this study highlight the potential for LiDAR surveys in the accurate determination of the topography of floodplain wetlands. These data can form an important component of water resource management decisions, particularly where environmental water allocations for these important ecosystems need to be determined. © 2008 Elsevier B.V. All rights reserved. 1. Introduction Digital elevation models (DEMs) are routinely created in geomor- phological studies from a variety of data sources. Commonly, DEMs are generated using spot heights or elevation data from contours, acquired from topographic maps or aerial photographs (Webster et al., 2006). Large quantities of low-cost data can be collected, spanning large areas; however, these data tend to be of a low accuracy (±1–10 m) and have a large spatial resolution (90–250 m), which is generally unsuitable for all but the coarsest interpretations of topography. Alternative data collection approaches, such as ground-based or airborne laser altimetry (LiDAR) surveys, are increasingly being used to generate DEMs of higher accuracy and resolution, but these have their own limitations. For example, ground-based surveys using differential global positioning system (DGPS) are difficult to under- take in highly vegetated areas or in inaccessible terrain, and can be time consuming. LiDAR surveys, which are relatively accurate (5– 11 cm with spatial resolutions of 1–5 m) and largely unaffected by vegetation or difficult terrain (Webster et al., 2006), can be prohibitively expensive. In addition, they do not penetrate water, making them less useful in perennially wet landscapes. Despite this, LiDAR surveys are becoming a more common approach because they provide data on topography and the height of the canopy and/or subcanopy of the vegetation simultaneously. Geomorphological applications that have used LiDAR surveys include hydraulic modeling (French, 2003) and investigations of coastal morphology (White and Wang, 2003), rivers and floodplains (Gomes Pereira and Wicherson, 1999; Charlton et al., 2003), rangelands (Ritchie et al., 1992), ice sheets (Abdalati and Krabill, 1999), landslides (McKean and Roering, 2004), active faults (Kondo et al., 2008), lava flows (Ventura and Vilardo, 2008), alluvial fans (Volker et al., 2007) and dunes (Woolard and Colby, 2002). It is unclear, however, whether LiDAR or other DEM-derivation methods are suitable or accurate enough for these applications. Moreover, physically complex environments can have an influence on the quality of the DEMs produced by LiDAR or other means. In lake and wetland research there is particularly limited under- standing of the accuracy and performance of different DEM generation techniques. In these environments, DEM creation may be used to estimate inundation levels, generate hydrodynamic models or simply to map lake and wetland topography. However, to date very few studies have investigated the utility of LiDAR in lake and wetland environments. Notable exceptions include Torya et al. (2003), who examined how various kriging algorithms had an impact on the overall accuracy of a LiDAR aerial survey, and Torya and Pietroniro (2005), who used these same data to elucidate links between flood inundation, elevation, and the type and structure of the dominant vegetation within a wetland environment. More commonly, LiDAR data have been used to assess the height and structure of wetland Geomorphology 106 (2009) 261–270 ⁎ Corresponding author. Tel.: +61 2 6201 2933; fax: +61 2 6201 2328. E-mail address: [email protected] (M. Thoms). 0169-555X/$ – see front matter © 2008 Elsevier B.V. All rights reserved. doi:10.1016/j.geomorph.2008.11.007 Contents lists available at ScienceDirect Geomorphology journal homepage: www.elsevier.com/locate/geomorph

Welcome message from author
This document is posted to help you gain knowledge. Please leave a comment to let me know what you think about it! Share it to your friends and learn new things together.
Transcript

Geomorphology 106 (2009) 261–270
Contents lists available at ScienceDirect
Geomorphology
j ourna l homepage: www.e lsev ie r.com/ locate /geomorph
A comparison of digital elevation models generated from different data sources
S. Rayburg a, M. Thoms a,⁎, M. Neave b
a Riverine Landscapes Research Laboratory, University of Canberra, ACT 2601, Australiab Division of Geography, School of Geosciences, University of Sydney, NSW 2006, Australia
⁎ Corresponding author. Tel.: +61 2 6201 2933; fax: +E-mail address: [email protected] (M.
0169-555X/$ – see front matter © 2008 Elsevier B.V. Adoi:10.1016/j.geomorph.2008.11.007
a b s t r a c t
a r t i c l e i n f oArticle history:
It can be challenging to ac Received 4 August 2008Received in revised form 2 November 2008Accepted 4 November 2008Available online 21 November 2008Keywords:Landscape complexityFloodplain-wetland ecosystemsDrylandLiDARNarran ecosystem
curately determine the topography of physically complex landscapes in remoteareas. Ground-based surveys can be difficult, time consuming and may miss significant elements of thelandscape. This study compares digital elevation models (DEMs) generated from three different data sources,of the physically complex Narran Lakes Ecosystem, a major floodplain wetland ecosystem in Australia.Topographic surfaces were generated from an airborne laser altimetry (LiDAR) survey, a ground-baseddifferential GPS (DGPS) survey containing more than 20,000 points, and the 9″ DEM of Australia. The LiDAR-and DGPS-derived data generated a more thorough DEM than the 9″ DEM; however, LiDAR generated asurface topography that yielded significantly more detail than the DGPS survey, with no noticeable loss ofelevational accuracy. Both the LiDAR- and the DGPS-derived DEMs compute the overall surface area andvolume of the largest floodplain lake within the system to within 1% of each other. LiDAR is shown to be ahighly accurate and robust technique for acquiring large quantities of topographic data, even in locations thatare unsuitable for ground surveying and where the overall landscape is of exceptionally low relief. The resultsof this study highlight the potential for LiDAR surveys in the accurate determination of the topography offloodplain wetlands. These data can form an important component of water resource management decisions,particularly where environmental water allocations for these important ecosystems need to be determined.
© 2008 Elsevier B.V. All rights reserved.
1. Introduction
Digital elevation models (DEMs) are routinely created in geomor-phological studies from a variety of data sources. Commonly, DEMs aregenerated using spot heights or elevation data from contours, acquiredfrom topographic maps or aerial photographs (Webster et al., 2006).Large quantities of low-cost data can be collected, spanning large areas;however, these data tend to be of a low accuracy (±1–10m) and have alarge spatial resolution (90–250m), which is generally unsuitable for allbut the coarsest interpretations of topography.
Alternative data collection approaches, such as ground-based orairborne laser altimetry (LiDAR) surveys, are increasingly being usedto generate DEMs of higher accuracy and resolution, but these havetheir own limitations. For example, ground-based surveys usingdifferential global positioning system (DGPS) are difficult to under-take in highly vegetated areas or in inaccessible terrain, and can betime consuming. LiDAR surveys, which are relatively accurate (5–11 cm with spatial resolutions of 1–5 m) and largely unaffected byvegetation or difficult terrain (Webster et al., 2006), can beprohibitively expensive. In addition, they do not penetrate water,making them less useful in perennially wet landscapes. Despite this,LiDAR surveys are becoming a more common approach because they
61 2 6201 2328.Thoms).
ll rights reserved.
provide data on topography and the height of the canopy and/orsubcanopy of the vegetation simultaneously.
Geomorphological applications that have used LiDAR surveysinclude hydraulic modeling (French, 2003) and investigations of coastalmorphology (White and Wang, 2003), rivers and floodplains (GomesPereira andWicherson,1999; Charlton et al., 2003), rangelands (Ritchieet al., 1992), ice sheets (Abdalati and Krabill, 1999), landslides (McKeanand Roering, 2004), active faults (Kondo et al., 2008), lava flows(Ventura andVilardo, 2008), alluvial fans (Volker et al., 2007) anddunes(Woolard and Colby, 2002). It is unclear, however, whether LiDAR orotherDEM-derivationmethods are suitable or accurate enough for theseapplications. Moreover, physically complex environments can have aninfluence on the quality of theDEMs produced by LiDARor othermeans.
In lake and wetland research there is particularly limited under-standing of the accuracy and performance of different DEM generationtechniques. In these environments, DEM creation may be used toestimate inundation levels, generate hydrodynamic models or simplyto map lake and wetland topography. However, to date very fewstudies have investigated the utility of LiDAR in lake and wetlandenvironments. Notable exceptions include Torya et al. (2003), whoexamined how various kriging algorithms had an impact on theoverall accuracy of a LiDAR aerial survey, and Torya and Pietroniro(2005), who used these same data to elucidate links between floodinundation, elevation, and the type and structure of the dominantvegetation within a wetland environment. More commonly, LiDARdata have been used to assess the height and structure of wetland
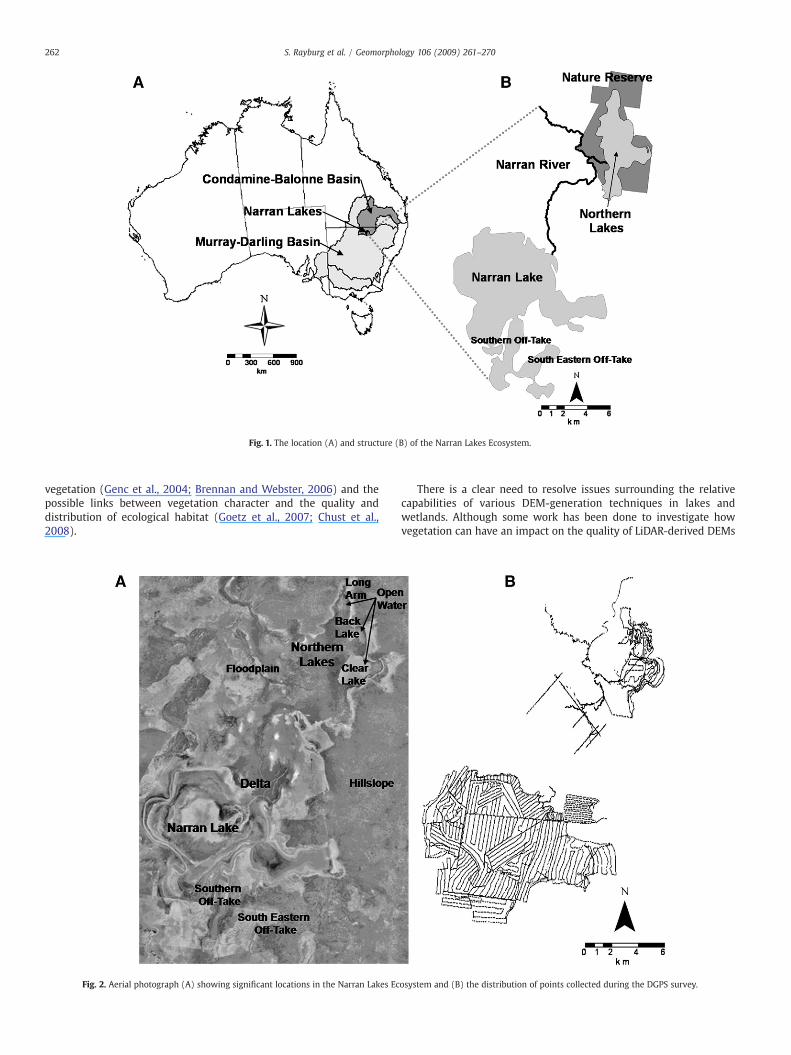
Fig. 1. The location (A) and structure (B) of the Narran Lakes Ecosystem.
262 S. Rayburg et al. / Geomorphology 106 (2009) 261–270
vegetation (Genc et al., 2004; Brennan and Webster, 2006) and thepossible links between vegetation character and the quality anddistribution of ecological habitat (Goetz et al., 2007; Chust et al.,2008).
Fig. 2. Aerial photograph (A) showing significant locations in the Narran Lakes Ec
There is a clear need to resolve issues surrounding the relativecapabilities of various DEM-generation techniques in lakes andwetlands. Although some work has been done to investigate howvegetation can have an impact on the quality of LiDAR-derived DEMs
osystem and (B) the distribution of points collected during the DGPS survey.

263S. Rayburg et al. / Geomorphology 106 (2009) 261–270
(Weishampel et al., 2000) there has been no systematic investigationinto the effects of morphologic complexity (including density of thevegetation cover) on a range of elevation data collection methods.
The objectives of this study are to:
• Investigate the comparative capabilities of LiDAR-, DGPS- and spot-derived surveys in determining the size, shape and morphologicalvariability (complexity) of a terminal wetland system.
• Explore how geomorphic complexity can have an impact on DEMquality for each of these three data sources.
The results of this study will be considered in terms of how thecorrect selection of a data source for DEM generation can have animpact on water resource management decisions, with specificreference to the provision of environmental water allocations.
2. Site description and methods
2.1. Study site
The Narran Lakes Ecosystem is a terminal floodplain–wetlandcomplex located in the dryland region of northwestern New SouthWales, Australia (Fig.1). It is composed of two lake systems (NarranLakein the south and a composite of “Northern Lakes” comprised of threesmaller interconnected lakes: Clear Lake, Back Lake and Long Arm), anextensive network of channels and a series of floodplains (Fig. 2A). Thetwo lake systems are different in morphological character — the largerNarran Lake is very flat, uniform in configuration and devoid of
Fig. 3. Morphologic complexity within the major stru
perennial vegetation, while the Northern Lakes is relatively complexwith several areas of open water interspersed with stands of trees andshrubs, and a series of interconnecting stream channels. Thus, the twolake systemsand the interveningfloodplain areas represent a gradientofgeomorphic complexity (Fig. 3). The soils in the Narran system arecomprised of clays with high shrink-swell potential. Consequently,when dry, the surfaces of the two lake systems are dissected by asignificant number of medium-to-large cracks ranging from severalcentimeters to several metres in width and depth.
TheNorthernLakes sectionof theNarranLakesEcosystem(Clear Lake,Back Lake and Long Arm and the adjacent floodplain — 5500 ha; Fig. 1)was designated as a Ramsar wetland of international importance in June1999 on the basis of its value tomigratorywaterbirds and the uniquenessof its floodplain vegetation. This section of the Narran Lakes Ecosystem ischaracterized by large areas of the flood-tolerant shrub Muehlenbeckiaflorulenta (tangled lignum) that provide important breeding habitat formany species of colonially breeding waterbirds. Upstream of the NarranLakes Ecosystem, large water resource developments have significantlychanged the hydrology of the Narran River— this is a major threat to theecological integrity of this ecosystem (Thoms, 2003). The pre develop-ment hydrology of the Narran Lakes Ecosystem was characterised by ahighly variable wetting and drying regime, and upstreamwater resourcedevelopments have significantly increased the frequency and duration ofdry periods (Thoms and Parsons, 2002). Consequently, a managementpriority is to determine adequate flows for maintaining the ecologicalintegrity and providing adequate waterbird breeding habitat. This willrequire accurate topographical information.
ctural elements of the Narran Lakes Ecosystem.

Table 1Summary characteristics and comparisons of each DEM.
9q DEM DGPS DEM LiDAR DEM
Northern Lakes Narran Lake Northern Lakes Narran Lake Northern Lakes Narran Lake
Resolution 250 m 250 m 1–200 m 1–1000 m 1 m 1 mAccuracy/precision N3 m N3 m b1 cm b1 cm 8–11 cm/2–3 cm 8–11 cm/2–3 cmGood representation of morphologic complexity No No No Yes Yes YesOverall representation of surface topography Poor Poor Moderate Good Excellent ExcellentPoint-to-point variability Very low Very low Low Low High HighEstimation of surface area Poor Poor Poor Moderate Good GoodEstimation of volume Poor Poor Moderate Good Good Good
264 S. Rayburg et al. / Geomorphology 106 (2009) 261–270
2.2. Data collection and analysis
The three data sources used in this study (Table 1) were:
• A nine-second DEM (9″ DEM) of Australia, derived from spot heightstaken from1:100 000 scale topographicmaps, with a spatial resolutionof 250 m and a positional and vertical accuracy greater than 3 m.
• A 20,000-point differential GPS (DGPS) survey conducted for theNarran Lakes Ecosystem in 2003 by the Queensland Department ofNatural Resources (Fig. 2B), with a variable spatial resolution,ranging from 1 m along survey lines to more than 200 m betweensurvey lines, and a positional and vertical accuracy of less than 1 cm.
• A LiDAR survey of the Narran Lakes Ecosystem taken in October 2004,when the floodplain was dry. This data set comprised approximately650,000,000 data points, with a spatial resolution of approximately1 m2, an absolute positional and vertical accuracy of 8–11 cm and aninternal (point-to-point within flight lines) accuracy of 2–3 cm.
• The LiDAR-derived data were supplemented by a small set of DGPSmeasurements (approximately 1000) to account for deep water-holes along the Narran River. These data were collected as apart ofanother study investigating the water balance of the Narran LakesEcosystem. Technical details about the operation, and the correctionand processing of the LiDAR data, are available in Wehr and Lohr(1999) and Cobby et al. (2001).
Fig. 4. DEMs for the Narran system derived from: (A) LiDAR, (B) DGPS and (
Each dataset was used to generate DEMs of the study site usingstandard krigingmethods. Initially, each DEMwas interrogated visuallyto determine how well the morphology of the study area had beencaptured. Thesedata are evaluated based on an independent verificationof the quality of the DEMs made through comparing the DEM derivedtopographywith that evident from a series of vertical and oblique aerialphotographs and from extensive ground reconnaissance surveys toidentify relevant geomorphic features in the landscape. The three DEMswere then overlain and topographical differences between them wereassessed using the raster calculator function in ArcGIS 8.2. Hypsometriccurves were generated for the surface area and volume for eachfloodplain lake, to determine how the method of topographic datacollection might have an impact on the representation of themorphology of each lake (hence the storage volume and potentialwater requirements). Finally, a series of landscape and local-scale cross-sectionswere constructed fromeach DEM, to determine their suitabilityfor capturing the geomorphic complexity of the study area and thepoint-to-point variability within each data set.
3. Results
DEMs constructed from the three data sources are shown in Fig. 4.The LiDAR-derived DEM (Fig. 4A) reveals a diverse topography inwhich the lakes, the network of channels and an extensive floodplain
C) spot heights taken from 1:100,000 scale topographic maps (9” DEM).

Fig. 5. Elevation differences between two of the three DEMs: (A) DGPS and 9q DEMs, (B) LiDAR and 9q DEMs, and (C) LiDAR and DGPS DEMs.
265S. Rayburg et al. / Geomorphology 106 (2009) 261–270
are all clearly distinguishable. Even relatively insignificant featureswith vertical extents of less than 10 cm are depicted. By comparison,the DGPS-derived DEM (Fig. 4B) displays considerably less detail in
Fig. 6. Detailed elevation differences between the LiDAR and DGPS
the Northern Lakes, but shows similar detail for the larger Narran Lakewhen compared to the LiDAR-derived DEM. The 9″ DEM covers theentire system (unlike the DGPS), including elevations in relatively
DEMs for: (A) the Narran Lake, and (B) the Northern Lakes.

266 S. Rayburg et al. / Geomorphology 106 (2009) 261–270
more complex areas of the landscape (Fig. 4C). However, the coarserspatial resolution of the 9″ DEM does not show the same geomorphiccomplexity of the area not being displayed (Table 1). Only the largestof the river channels can be identified using the 9″ DEM, and theNorthern Lakes are largely indistinct and poorly defined.
Direct comparison of the topography defined by each DEM (Fig. 5)shows the 9″DEM to be notably different from the DGPS- (Fig. 5A) andLiDAR-derived (Fig. 5B) DEMs. The 9″ DEM does not define the Narran
Fig. 7. Transects for: the Narran Lake from (A) the LiDAR DEM and (B) the DGPS DEM; the N(E) the LiDAR DEM and (F) the DGPS DEM.
or Northern Lakes well — differences range between 3–6 m (max.difference ±18 m) when compared to both the DGPS- and LiDAR-derived DEMs. The DGPS- and LiDAR-generated DEMs yield similaroutputs to each other (Fig. 5C). In the openwater areas of Narran Lakeand in parts of Clear Lake, Back Lake and Long Arm, the DGPS andLiDAR techniques yield almost same topographic information, withcommon differences less than ±25 cm. However, in the channelledsections of the Northern Lakes and in the intervening floodplains,
orthern Lake from (C) the LiDAR DEM and (D) the DGPS DEM; and the floodplain from

Fig. 8. Transects across Narran Lake showing point-to-point variability for: (A) the LiDAR, and (B) the DGPS DEMs.
267S. Rayburg et al. / Geomorphology 106 (2009) 261–270
differences between the LiDAR- and DGPS-derived DEMs are magni-fied and can reach several metres.
A detailed comparison of the LiDAR- and DGPS-generated DEMs forthe Narran and the Northern Lakes is presented in Fig. 6. In the NarranLake, particularly in areas with good DGPS coverage (Fig. 2B), thereare very small differences (less than 10 cm) between the two DEMs.However, where DGPS coverage is poor (Fig. 2B), such as the deltaregion of the southeastern intake to Narran Lake and the surroundinghillslopes, differences can exceed 1 m (Fig. 6A).
Cross-sections generated from the LiDAR and DGPS-derived DEMsare provided in Fig. 7. Both of the LiDAR and DGPS surveys of NarranLake (Fig. 7A,B) capture the main storage area and several overflowareas (although the last two overflowareas aremissing from the DGPS
Fig. 9. Hypsometric curves for: (A) the surface area and (B) volume of the N
survey, because they were not differentiated by this technique), thusproviding similar topographic information for capturing lake mor-phology. In addition, the point-to-point variability is quite low, whichis consistent with ground observations of this very flat lake (Table 1).For the Northern Lakes (Fig. 7 C,D), the LiDAR-generated DEM capturesthe two open-water areas and the complexity evident in thechannelised lake areas. The DGPS-generated DEM, in contrast, appearsto oversimplify the morphology of this section of the Northern Lakes,resulting in good definition of the two open-water areas only. Fig. 7Eshows the LiDAR-derived DEM of the channelised floodplain region ofthe Narran system, which highlights both the main Narran Riverchannel and the numerous anabranches and side channels. Fig. 7Femphasises the inadequacy of the DGPS-derived DEM in complex
orthern Lakes and (C) the surface area and (D) volume of Narran Lake.

268 S. Rayburg et al. / Geomorphology 106 (2009) 261–270
terrain— none of the side channels are evident and the Narran River ispoorly defined.
A comparison of the point-to-point variability inherent in theLiDAR- (Fig. 8 A) and DGPS-generated (Fig. 8B) DEMs shows greatervariability in the former DEM (Table 1). The DGPS-generated DEMshows very little variability from point to point, although this is partlydue to the limited number of points (less than 10) present along thecross-section. Meanwhile, the LiDAR survey (with nearly 1000 pointsalong the cross-section) shows point-to-point variability of the orderof 5–10 cm.
For the Northern Lakes, we compared the DEM-derived surfacearea and volume (Figs. 8B and 9A) and found that each DEM yielded adifferent result. The DGPS survey yielded the largest surface area andvolume, the 9″ DEM the smallest, and the LiDAR survey tended to fallin the middle. For Narran Lake (Fig. 9C,D), however, the DGPS- andLiDAR-derived DEMs yielded similar results for both surface area andvolume, while the 9″ DEM was different. The 9″ DEM overestimatedthe volume of Narran Lake, and overestimated surface areas at lowwater surface elevations and underestimated surface areas at highwater surface elevations.
4. Discussion
Digital elevation models can be generated from a variety of datasources and this study compared DEMs generated from three differentdata sources. The DGPS- and LiDAR-generated DEMs captured similarmorphologies of the study area. The 9″ DEMwas different— it failed tocapture the morphologic complexity of both the Narran and NorthernLakes, and did not clearly define the Narran River, which is aprominent feature of the study area (Fig. 4).
A direct comparison of the LiDAR- and DGPS-derived DEMssuggests that the latter is of variable quality (resolution and accuracy)as considerably less detail was captured in the Northern Lakes andsurrounding floodplains, although similar morphological detail wascaptured in the southern Narran Lake. This result is partly due tochallenges associated with ground surveying. In the northern sectionsof the study area, there are a large number of river channels (morethan 8000 have been identified from aerial photographs of the site)and a dense cover of perennial trees and shrubs. The terrain in thisarea is difficult to negotiate, which complicates ground surveying. Itwas much easier to collect ground survey points in the flatter NarranLake, and a relatively well-defined DGPS-generated DEMwas possible.
By comparison, LiDAR-generated DEMs are not restricted byground-level environmental conditions, and the geomorphic diversitywithin the study area could be captured with suitable coverage andspatial resolution. A wide range of morphologic structures wereshown with this technique, including macro- and microchannels,floodplains, clay pans, sand dunes and subtle variations in laketopography.
A direct comparison of the topographies generated from each datasource (Fig. 5) reveals that the 9″ DEM both over- and underestimatedthe elevation of the study area. Because the topographic informationincluded in this survey was limited, only a very coarse representationof the system was possible. The need to extrapolate elevations oververy long distances in the 9″ DEM limited the utility of this method foridentifying key morphologic structures.
The DGPS and LiDAR surveys, however, produced much betterrealisations of overall topography (Figs. 5 and 6). This is especially truein the southern region of the study area, where only small differencesare evident between the topography generated from the DGPS- andLiDAR-derived DEMs. The main difference between these two DEMs isthe failure of the DGPS survey process to include the lower portions(southern and southwestern offtakes of the Narran Lake).
In the Northern Lakes, there was close agreement between theDGPS and LiDAR topography in areas with good DGPS coverage(limited to open water areas). However, many areas of the lake could
not be ground surveyed due to the terrain, particularly thechannelised lake and floodplain areas — in these areas, the DGPStopography was considerably different from the LiDAR topography.
These differences also extended onto the midsystem floodplains(areas between the two lakes) and the surrounding hillslopes, whichwere only poorly defined by the DGPS survey. In order to generatedata to the boundaries of the Narran Lakes study area, data wereextrapolated out beyond the last survey points; thus, the resultingtopography is inferred rather than measured. This leads to an overallimpression that the DGPS-derived DEM is insufficiently detailed tocapture the morphology of the Northern Lakes, floodplains andsurrounding hillslopes, compared with the LiDAR-derived DEM.
Similar conclusions may be drawn when the three cross-sectionsextracted from the LiDAR- and DGPS-derived DEMs across theNorthern Lakes, Narran Lake and the floodplain and delta areconsidered (Fig. 7). In Narran Lake, the DGPS-derived DEM providesa cross-section similar to the LiDAR-derived DEM. In the NorthernLakes and the floodplain area, however, the DGPS-derived DEM is lesswell defined than the LiDAR-derived DEM and characterises arelatively less complex system. In the floodplain and delta, theDGPS-derived DEM shows only a crude representation of the NarranRiver and lacks any information on the additional smaller riverchannels evident from the LiDAR survey. This lack of detail is alsoapparent in the Northern Lakes cross-sections, which are relativelycomplex in the LiDAR-derived DEM and relatively simple (lacking thesmall- and medium-sized channels visible in the LiDAR cross-sections) in the DGPS-dervied DEM.
Point data also vary between the DEMs generated from thedifferent data sources. The point-to-point variability in the LiDAR-derived DEM is greater that the DGPS-derived DEM (Fig. 8). Thisresults from several factors. First, the DGPS survey had survey pointsspaced tens of metres apart; therefore, linear extrapolations betweenpoints yielded a smooth profile. The high accuracy of these points (lessthan 1 cm) means that even points close together were likely toexhibit only marginal variability along flat surfaces. By comparison,the LiDAR survey had survey points spaced every 1 m2, therebylimiting the smoothing effect of longer-distance interpolations. Inaddition, the lower accuracy (2–3 cm point-to-point) of the LiDARsurvey led to some point-to-point variability in elevation, even on flatsurfaces.
Second, each point in the DGPS survey was taken from the meanlake surface, thereby avoiding soil cracks, some of which can extendup to 40 cm in width. This is an important factor since the Narransystem is comprised of heavily cracking clay soils. In the LiDAR survey,only chance determines whether a point falls on the mean surface orwithin a soil crack, so this provides a measure of the true variability ofthe soil surface. The relatively high point-to-point variability in theLiDAR survey (up to 10 cm) means that this method can capture thefull spectrum of geomorphic complexity within the Narran Lakesstudy area. Both large-scale geomorphic structures and the microtopography of the study area were identified clearly by LiDAR.
The Narran Lakes ecosystem is a Ramsar wetland and appropriateenvironmental water allocation is a key management goal for the site.In order to determine the ecological outcomes of different inflows,volumes and inundation areas of the floodplain wetland need to becalculated. A comparison of hypsometric curves for the surface areaand volume of the Narran and Northern Lakes (Fig. 9) shows that the9″ DEM generally over- or underestimated the surface area andvolume of both lakes at most water surface elevations. This isparticularly evident for the volume of Narran Lake, for which the 9″DEM produced values that are several orders of magnitude larger thaneither the DGPS- or LiDAR-derived DEM.
The overestimation of lake storage would result in an over-estimation of the demand for environmental water — more than isactually required to fill the lake. In the Northern Lakes, the DGPS andLiDAR surveys also differ considerably in their estimates of both

269S. Rayburg et al. / Geomorphology 106 (2009) 261–270
surface area and volume across all water surface elevations, with theDGPS-derived DEM overestimating both values. The overestimation oflake volume is significant as 1.5–2 times more water would be neededto fill the lake if a water resource management decision was based onthe DGPS-derived DEM. In Narran Lake, however, both the DGPS- andLiDAR-derived DEMs yield very similar surface areas and volumesacross most water surface elevations, with deviations only occurringat the upper end of the curve. This is due to the relatively simplergeomorphology of this lake, which facilitated a dense net of groundsurvey points.
There was a close correlation in volume between the DGPS andLiDAR surveys. This highlights the precision of the LiDAR-derivedDEM, which is approximately 2–3 cm point-to-point compared to lessthan 1 cm for the DGPS-derived DEM (Note: although the accuracy ofthe LiDAR data is approximately 8–11 cm relative to the true elevationat each point, the precision between points can be considerably moreaccurate). The disparity between surface areas at higher elevations iscaused by a failure of the DGPS survey to include the entire lake (seeFig. 2B), rather than a true (elevation) difference between the twosurveys. Therefore, at the scale of Narran Lake as awhole, there is littledifference between the DGPS or LiDAR surveys in determining thevolume of water required to fill the lake.
These results show that the quality of the DEMs produced by thethree data sources is a function of the complexity of the system beingsurveyed (see Fig. 3). In geomorphically simple landscapes, likeNarran Lake, either DGPS or LiDAR data are of sufficient accuracy andresolution to provide reliable estimates of the surface area and volume(of the lake and the wetlands). However, in geomorphically complexlandscapes, such as the Northern Lakes and the floodplains, DGPSsurveys can fail to capture the relative extent of the feature underconsideration by either over- or underestimating the surface area andvolume. LiDAR, however, is able to capture the full extent andcomplexity of the topography, and provide better estimates of thesurface areas and volume of lakes and wetlands, than can be obtainedby DGPS surveys. These findings are further confirmed through aconsideration of the complexity of the DEMs with that actuallyobserved in the field. Only the LiDAR DEMwas able to capture the fullrange of geomorphic features present in the Narran Lakes Ecosystemwhile the other two techniques failed to capture many significantgeomorphic structures especially secondary channels, clay pans andsubtle variations in lake topography.
In addition, the high resolution and accuracy of LiDAR-derivedDEMs facilitate the use of these data for a range of other applications,such as hydrologic and hydraulic modeling, the determination of thesize and shape of morphologic structures (e.g. channels, lakes) and, ifrepeat surveys are flown, landscape change detection (e.g. erosion,sedimentation, channel migration) (Rosso et al., 2006). DGPS derivedDEMs are still of potential value, especially in simple morphologicsystems or where only very generalised topographic information isdesired. These techniques are comparatively cheap (when comparedto LiDAR data acquisition) and can provide highly accurate topo-graphic information when surveying challenges are limited. Spot-derived DEMs (e.g. the 9″ DEM) have been shown to be inadequate forboth complex and simple landscapes, and so should only be usedwhen no other alternatives are available.
5. Conclusion
Accurate topographic information is often required in environ-mental research programs. DEMs can be generated from a variety ofdata sources, but this variety can result in different degrees ofaccuracy and precision. In this study, we have shown that DEMsproduced from topographic maps are largely inadequate for deter-mining the morphology of relatively complex floodplain wetlands.They significantly over- or underestimated the surface area andvolume of the Narran lakes and wetlands, and generally failed to
capture the geomorphic complexity of these structures. In morpho-logically simple lakes and wetlands, DGPS surveys provide a simpleand cost-effective means of acquiring these data. However, thismethod fails in morphologically complex lakes and wetlands as thecomplexity inhibits the ability of surveyors to capture the fulldimensions.
Where water allocations are of critical importance for economicgain and the maintenance of ecological assets, it is vital to haveaccurate determinations of the size and storage capacity of ecologi-cally significant lakes and wetlands. In morphologically complex lakesand wetlands, such as the Narran Lakes Ecosystem, the LiDAR surveyproved to be the only reliable remote sensing method for obtainingaccurate measures of the surface area, volume and morphologicstructure of the system. These conclusions also likely apply to othercomplex wetlands within Australia (such as the Macquarie Marshesand Gwydir wetlands) and elsewhere. Although this technique can beexpensive, the quality of the data is high and it offers potential costsavings, in terms of efficiently managing water resources that in theend may exceed the actual cost of data acquisition.
Acknowledgements
The authors would like to thank the Murray Darling BasinCommission for providing the funding for this project. In addition,we would like to thank AAM Hatch for their assistance with thecollection and preparation of the LiDAR dataset.
References
Abdalati, W., Krabill, W.B., 1999. Calculation of ice velocities in the Jakobshan Isbrae areausing airborne laser altimetry. Remote Sensing of Environment 67, 194–204.
Brennan, R., Webster, T., 2006. Object-oriented land cover classification of lidar-derivedsurfaces. Canadian Journal of Remote Sensing 32, 162–172.
Charlton, M.E., Large, A.R.G., Fuller, I.C., 2003. Application of airborne LiDAR in riverenvironments: the River Coquet, Northumberland, UK. Earth Surface Processes andLandforms 28, 299–306.
Cobby, D.M., Mason, D.C., Davenport, I.J., 2001. Image processing of airborne laseraltimetry data for improved river floodmodeling. ISPRS Journal of Photogrammetry& Remote Sensing 56, 121–138.
Chust, G., Galparsoro, I., Borja, A., Franco, J., Uriarte, A., 2008. Coastal and estuarinehabitat mapping, using LIDAR height and intensity and multi-spectral imagery.Estuarine, Coastal and Shelf Science 78, 633–643.
French, J.R., 2003. Airborne LiDAR in support of geomorphological and hydraulicmodelling. Earth Surface Processes and Landforms 28, 321–335.
Genc, L., Dewitt, B., Smith, S., 2004. Determination of wetland vegetation height withLIDAR. Turkish Journal of Agriculture and Forestry 28, 63–71.
Goetz, S., Steinberg, D., Dubayah, D., Blair, B., 2007. Laser remote sensing of canopyhabitat heterogeneity as a predictor of bird species richness in an eastern temperateforest, USA. Remote Sensing of Environment 108, 254–263.
Gomes Pereira, L.M., Wicherson, R.J., 1999. Suitability of laser data for derivinggeographical information: a case study in the context of management of fluvialzones. ISPRS Journal of Photogrammetry & Remote Sensing 54, 105–114.
Kondo, H., Toda, S., Okumura, K., Takada, K., Chiba, T., 2008. A fault scarp in an urbanarea identified by LiDAR survey: a case study on the Itoigawa–Shizuoka TectonicLine, central Japan. Geomorphology 101, 731–739.
McKean, J., Roering, J., 2004. Objective landslide detection and surface morphologymapping using high-resolution airborne laser altimetry. Geomorphology 57,331–351.
Ritchie, J.C., Everitt, J.H., Escobar, D.E., Jackson, T.J., Davis, M.R., 1992. Airborne lasermeasurements of rangeland canopy cover and distribution. Journal of RangelandManagement 45, 189–193.
Rosso, P.H., Ustin, S.L., Hastings, A., 2006. Use of lidar to study changes associated withSpartina invasion in San Francisco Bay marshes. Remote Sensing of Environment100, 295–306.
Thoms, M.C., 2003. Floodplain-river ecosystems: lateral connections and the implica-tions of human interference. Geomorphology 56, 335–349.
Thoms, M.C., Parsons, M.E., 2002. Identifying spatial and temporal patterns in thehydrological character of the Condamine–Balonne River, Australia, using multi-variate statistics. River Research and Applications, vol. 19, pp. 443–457.
Torya, J., Pietroniro, A., 2005. Towards operational monitoring of a northern wetlandusing geomatics based techniques. Remote Sensing of Environment 97, 174–191.
Torya, J., Pietroniro, A., Hopkinson, C., Kalbfleisch, W., 2003. Assessment of airbornescanning laser altimetry (LiDAR) in a deltaic wetland environment. CanadianJournal of Remote Sensing 29, 718–728.
Ventura, G., Vilardo, G., 2008. Emplacement mechanism of gravity flows inferred fromhigh resolution Lidar data: the 1944 Somma–Vesuvius lava flow (Italy).Geomorphology 95, 223–235.

270 S. Rayburg et al. / Geomorphology 106 (2009) 261–270
Volker, X., Wasklewicz, T.A., Ellis, M.A., 2007. A topographic fingerprint to distinguishalluvial fan formative processes. Geomorphology 88, 34–45.
Webster, T.L., Murphy, J.B., Gosse, J.C., 2006. Mapping subtle structures with lightdetection and ranging (LIDAR): flow units and phreatomagmatic rootless cones inthe North Mountain Basalt, Nova Scotia. Canadian Journal of Earth Science 43,157–176.
Wehr, A., Lohr, U., 1999. Airborne laser scanning — an introduction and overview. ISPRSJournal of Photogrammetry & Remote Sensing 54, 68–82.
White, S.A., Wang, Y., 2003. Utilizing DEMs derived from LIDAR data to analyzemorphologic change in the North Carolina coastline. Remote Sensing of Environ-ment 85, 39–47.
Weishampel, J.F., Blair, J.B., Knox, R.G., Dubayah, R., Clark, D.B., 2000. Volumetric LIDARreturn patterns from an old-growth tropical rainforest canopy. International Journalof Remote Sensing 21, 409–415.
Woolard, J.W., Colby, J.D., 2002. Spatial characterization, resolution, and volumetricchange of coastal dunes using airborne LIDAR: Cape Hatteras, North Carolina.Geomorphology 48, 269–287.
Related Documents