Hydrol. Earth Syst. Sci., 18, 193–212, 2014 www.hydrol-earth-syst-sci.net/18/193/2014/ doi:10.5194/hess-18-193-2014 © Author(s) 2014. CC Attribution 3.0 License. Hydrology and Earth System Sciences Open Access Comparison of different evaporation estimates over the African continent P. Trambauer 1 , E. Dutra 2 , S. Maskey 1 , M. Werner 1,3 , F. Pappenberger 2 , L. P. H. van Beek 4 , and S. Uhlenbrook 1,5 1 UNESCO-IHE, Department of Water Science and Engineering, P.O. Box 3015, 2601 DA Delft, the Netherlands 2 ECMWF, Shinfield Park, RG2 9AX Reading, UK 3 Deltares, P.O. Box 177, 2600MH Delft, the Netherlands 4 Utrecht University, Dept. Physical Geography, Utrecht, the Netherlands 5 Delft University of Technology, WaterResources Section, P.O. Box 5048, 2600 GA Delft, the Netherlands Correspondence to: P. Trambauer ([email protected]) Received: 3 June 2013 – Published in Hydrol. Earth Syst. Sci. Discuss.: 2 July 2013 Revised: 13 November 2013 – Accepted: 2 December 2013 – Published: 15 January 2014 Abstract. Evaporation is a key process in the water cycle with implications ranging, inter alia, from water management to weather forecast and climate change assessments. The es- timation of continental evaporation fluxes is complex and typically relies on continental-scale hydrological models or land-surface models. However, it appears that most global or continental-scale hydrological models underestimate evap- orative fluxes in some regions of Africa, and as a result overestimate stream flow. Other studies suggest that land- surface models may overestimate evaporative fluxes. In this study, we computed actual evaporation for the African con- tinent using a continental version of the global hydrological model PCR-GLOBWB, which is based on a water balance approach. Results are compared with other independently computed evaporation products: the evaporation results from the ECMWF reanalysis ERA-Interim and ERA-Land (both based on the energy balance approach), the MOD16 evapo- ration product, and the GLEAM product. Three other alter- native versions of the PCR-GLOBWB hydrological model were also considered. This resulted in eight products of ac- tual evaporation, which were compared in distinct regions of the African continent spanning different climatic regimes. Annual totals, spatial patterns and seasonality were studied and compared through visual inspection and statistical meth- ods. The comparison shows that the representation of irri- gation areas has an insignificant contribution to the actual evaporation at a continental scale with a 0.5 ◦ spatial resolu- tion when averaged over the defined regions. The choice of meteorological forcing data has a larger effect on the evapo- ration results, especially in the case of the precipitation input as different precipitation input resulted in significantly differ- ent evaporation in some of the studied regions. ERA-Interim evaporation is generally the highest of the selected products followed by ERA-Land evaporation. In some regions, the satellite-based products (GLEAM and MOD16) show a dif- ferent seasonal behaviour compared to the other products. The results from this study contribute to a better understand- ing of the suitability and the differences between products in each climatic region. Through an improved understanding of the causes of differences between these products and their uncertainty, this study provides information to improve the quality of evaporation products for the African continent and, consequently, leads to improved water resources assessments at regional scale. 1 Introduction Evaporation is one of the most important fluxes in the hydro- logical cycle. Recently, there has been a wide interest in esti- mating evaporation fluxes on a continental and global scales for a variety of purposes (van der Ent et al., 2010; Teuling et al., 2009; Miralles et al., 2011a; Vinukollu et al., 2011; Mu et al., 2011; Mueller et al., 2011, 2013; Jiménez et al., 2011). The accurate estimation of these fluxes on large scales has, however, always been a difficult issue. Direct measurements of evaporation are only possible over small regions, e.g. us- ing flux towers, and are limited to only few sites, particularly Published by Copernicus Publications on behalf of the European Geosciences Union.

Welcome message from author
This document is posted to help you gain knowledge. Please leave a comment to let me know what you think about it! Share it to your friends and learn new things together.
Transcript

Hydrol. Earth Syst. Sci., 18, 193–212, 2014www.hydrol-earth-syst-sci.net/18/193/2014/doi:10.5194/hess-18-193-2014© Author(s) 2014. CC Attribution 3.0 License.
Hydrology and Earth System
SciencesO
pen Access
Comparison of different evaporationestimates over the African continent
P. Trambauer1, E. Dutra2, S. Maskey1, M. Werner1,3, F. Pappenberger2, L. P. H. van Beek4, and S. Uhlenbrook1,5
1UNESCO-IHE, Department of Water Science and Engineering, P.O. Box 3015, 2601 DA Delft, the Netherlands2ECMWF, Shinfield Park, RG2 9AX Reading, UK3Deltares, P.O. Box 177, 2600MH Delft, the Netherlands4Utrecht University, Dept. Physical Geography, Utrecht, the Netherlands5Delft University of Technology, Water Resources Section, P.O. Box 5048, 2600 GA Delft, the Netherlands
Correspondence to:P. Trambauer ([email protected])
Received: 3 June 2013 – Published in Hydrol. Earth Syst. Sci. Discuss.: 2 July 2013Revised: 13 November 2013 – Accepted: 2 December 2013 – Published: 15 January 2014
Abstract. Evaporation is a key process in the water cyclewith implications ranging, inter alia, from water managementto weather forecast and climate change assessments. The es-timation of continental evaporation fluxes is complex andtypically relies on continental-scale hydrological models orland-surface models. However, it appears that most global orcontinental-scale hydrological models underestimate evap-orative fluxes in some regions of Africa, and as a resultoverestimate stream flow. Other studies suggest that land-surface models may overestimate evaporative fluxes. In thisstudy, we computed actual evaporation for the African con-tinent using a continental version of the global hydrologicalmodel PCR-GLOBWB, which is based on a water balanceapproach. Results are compared with other independentlycomputed evaporation products: the evaporation results fromthe ECMWF reanalysis ERA-Interim and ERA-Land (bothbased on the energy balance approach), the MOD16 evapo-ration product, and the GLEAM product. Three other alter-native versions of the PCR-GLOBWB hydrological modelwere also considered. This resulted in eight products of ac-tual evaporation, which were compared in distinct regionsof the African continent spanning different climatic regimes.Annual totals, spatial patterns and seasonality were studiedand compared through visual inspection and statistical meth-ods. The comparison shows that the representation of irri-gation areas has an insignificant contribution to the actualevaporation at a continental scale with a 0.5◦ spatial resolu-tion when averaged over the defined regions. The choice ofmeteorological forcing data has a larger effect on the evapo-
ration results, especially in the case of the precipitation inputas different precipitation input resulted in significantly differ-ent evaporation in some of the studied regions. ERA-Interimevaporation is generally the highest of the selected productsfollowed by ERA-Land evaporation. In some regions, thesatellite-based products (GLEAM and MOD16) show a dif-ferent seasonal behaviour compared to the other products.The results from this study contribute to a better understand-ing of the suitability and the differences between productsin each climatic region. Through an improved understandingof the causes of differences between these products and theiruncertainty, this study provides information to improve thequality of evaporation products for the African continent and,consequently, leads to improved water resources assessmentsat regional scale.
1 Introduction
Evaporation is one of the most important fluxes in the hydro-logical cycle. Recently, there has been a wide interest in esti-mating evaporation fluxes on a continental and global scalesfor a variety of purposes (van der Ent et al., 2010; Teuling etal., 2009; Miralles et al., 2011a; Vinukollu et al., 2011; Muet al., 2011; Mueller et al., 2011, 2013; Jiménez et al., 2011).The accurate estimation of these fluxes on large scales has,however, always been a difficult issue. Direct measurementsof evaporation are only possible over small regions, e.g. us-ing flux towers, and are limited to only few sites, particularly
Published by Copernicus Publications on behalf of the European Geosciences Union.

194 P. Trambauer et al.: Comparison of different evaporation estimates over the African continent
in some developed regions. FLUXNET1 coordinates regionaland global analysis of observations (CO2, water and energyfluxes) from micrometeorological tower sites. Most of the ex-isting global products are verified only in particular regionswith available data, generally in North America and Europe(Mu et al., 2011; Alton et al., 2009; Zhang et al., 2010; Mi-ralles et al., 2011b). Some studies have evaluated the devel-oped global evaporation product with evaporation estimatesby subtracting runoff from the precipitation (Vinukollu etal., 2011; Zhang et al., 2010). Few studies have comparedthe results of different evaporation products. Vinukollu etal. (2011) compared results of six evaporation products (fromthree process-based models forced with two radiation datasets) by computing the ensemble mean and product rangeglobally, and by comparing the annual totals of each prod-uct over latitude bands. They found the highest uncertaintiesbetween the products in tropical and subtropical monsoonregions including the Sahel. They show that the model en-semble tends to overestimate the inferred evaporation values(inferred asP -Q). They indicate that no single model doesbetter than any other globally, and that overall all data sets arelikely to be high, which may be due to lack of soil moisturelimitation in the models.
The LandFlux initiative, supported by GEWEX (http://www.gewex.org/) is clearly dedicated to evapotranspiration.In the framework of this initiative, several global evapo-ration data sets were evaluated and compared (Jiménez etal., 2011; Mueller et al., 2011), and global merged bench-marking evaporation products were derived (Mueller et al.,2013). Mueller et al. (2013) derived their benchmark evap-oration product using 40 distinct data sets over a 17 yr pe-riod (1989–2005) and 14 data sets over a seven year pe-riod (1989–1995) derived from diagnostic data sets, land-surface models, and reanalysis data. Ghilain et al. (2011)present the instantaneous (MET) and daily (DMET) evapora-tion products developed in the framework of EUMETSAT’sLand Surface Analysis Satellite Application Facility (LSA-SAF). The MET and DMET products became operational inAugust 2009 and November 2010 respectively, and were sat-isfactorily validated against ground observations in Europe.The products were compared with models from ECMWF andfrom the Global Land Data Assimilation System (GLDAS) inAfrica and parts of South America. This comparison showedthat the spatial correlation of the products with ECMWF re-mained very high (85 to 95 %) and was constant through-out the whole year. However, they found that for northernand southern Africa their product (LSA SAF MET) exhibitedlower estimates than ECMWF and GLDAS, with the differ-ence with the ECMWF product being the largest (EUMET-SAT, 2011). To our knowledge, none of the existing studiesregarding large-scale evaporation has focused on the Africancontinent. This work introduces a thorough comparison of
1http://fluxnet.ornl.gov/.
different evaporation products over diverse African regionsand climates.
In most cases, estimations of actual evaporation at a con-tinental scale rely on complementary products such as (i) re-mote sensing, (ii) continental-scale hydrological models, or(iii) land-surface models. However, in some ways, these threedifferent data sources follow different theoretical basis or ap-proaches in estimating evaporation. For example there is asignificant difference in the model objective of land-surfacemodels and hydrological models. The former focus on pro-viding boundary conditions (turbulent fluxes) to the atmo-sphere (mainly focusing on the energy balance) whereas thelatter focus on closing the terrestrial water balance (Over-gaard et al., 2006). In this study the class of hydrologicalmodels is represented by PCR-GLOBWB (van Beek andBierkens, 2009). This model is based on the water balanceapproach that focuses on water availability and vertical andlateral transfer of water. The class of land-surface modelsis represented by the ECMWF reanalysis ERA-Land (Bal-samo et al., 2012, ERAL) and ERA-Interim (ERAI, Dee etal., 2011) using a land-surface model that describes the ver-tical exchanges of heat and water between the atmosphereand the land surface on a grid point scale (Balsamo et al.,2011a). The evaporation results of both are compared withthe remote-sensing-based data (i.e. the MOD16 product byMu et al. (2011, 2007), and the GLEAM product by Miralleset al. (2011a, b)). It is worth clarifying that PCR-GLOBWBand ERAL evaporation come from offline (or stand alone)simulations, while ERAI is a coupled land–atmosphere re-analysis product. The quality of the individual products canbe influenced by different climatic regions. Therefore, in thisstudy we differentiated the hydro-climatic regions in Africaand the comparison is carried out for each region.
The main aim of the present paper is to compare differentactual evaporation estimates for the African continent in or-der to gain a better understanding of the disparities betweenthe different products within defined regions and the possiblecauses of these differences (e.g. resulting from the meteoro-logical input data or from the model structure in the deriva-tion of actual evaporation). This comparison can serve as anindirect validation of methods or tools used in operationalwater resources assessments. In this study we do not intendto evaluate whether one product is better than the others butto discriminate areas where good consistency can be foundbetween the results of the selected models in contrast to re-gions where model results diverge. We seek to provide anuncertainty range in the expected actual evaporation valuesfor the defined regions. The understanding of this range canbe useful in, for example, water resources management whenestimating the water balance.
Hydrol. Earth Syst. Sci., 18, 193–212, 2014 www.hydrol-earth-syst-sci.net/18/193/2014/
P. Trambauer et al.: Comparison of different evaporation estimates over the African continent 195
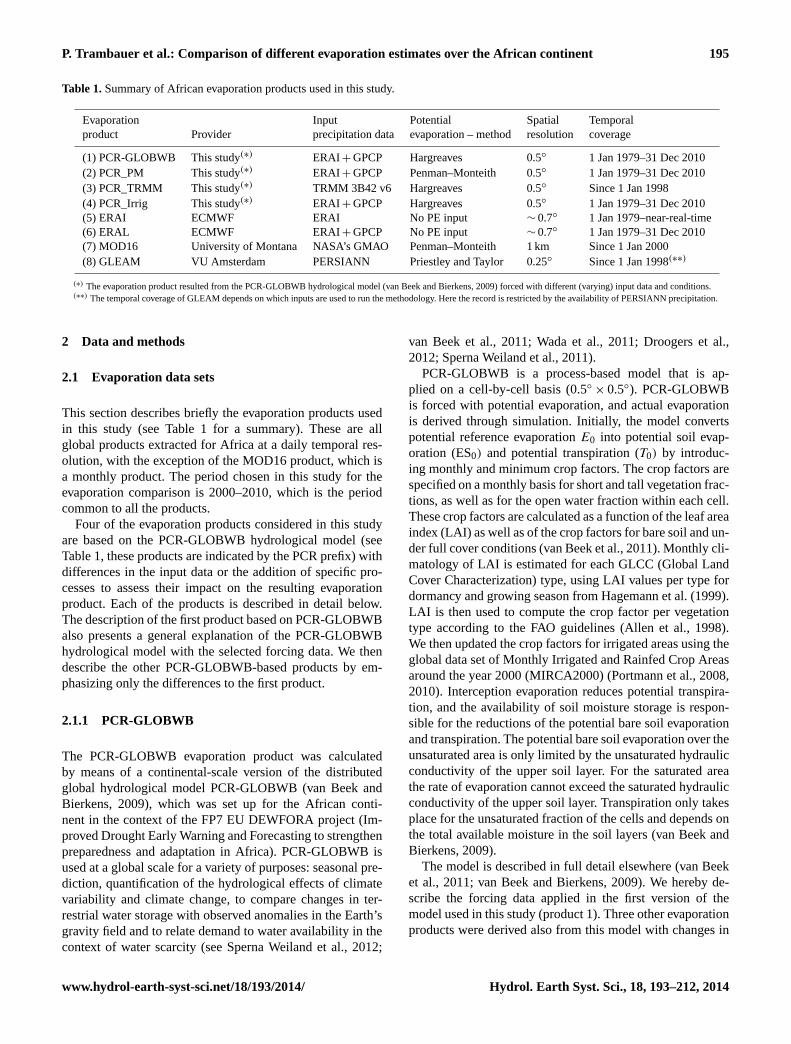
Table 1.Summary of African evaporation products used in this study.
Evaporation Input Potential Spatial Temporalproduct Provider precipitation data evaporation – method resolution coverage
(1) PCR-GLOBWB This study(∗) ERAI + GPCP Hargreaves 0.5◦ 1 Jan 1979–31 Dec 2010(2) PCR_PM This study(∗) ERAI + GPCP Penman–Monteith 0.5◦ 1 Jan 1979–31 Dec 2010(3) PCR_TRMM This study(∗) TRMM 3B42 v6 Hargreaves 0.5◦ Since 1 Jan 1998(4) PCR_Irrig This study(∗) ERAI + GPCP Hargreaves 0.5◦ 1 Jan 1979–31 Dec 2010(5) ERAI ECMWF ERAI No PE input ∼ 0.7◦ 1 Jan 1979–near-real-time(6) ERAL ECMWF ERAI+ GPCP No PE input ∼ 0.7◦ 1 Jan 1979–31 Dec 2010(7) MOD16 University of Montana NASA’s GMAO Penman–Monteith 1 km Since 1 Jan 2000(8) GLEAM VU Amsterdam PERSIANN Priestley and Taylor 0.25◦ Since 1 Jan 1998(∗∗)
(∗) The evaporation product resulted from the PCR-GLOBWB hydrological model (van Beek and Bierkens, 2009) forced with different (varying) input data and conditions.(∗∗) The temporal coverage of GLEAM depends on which inputs are used to run the methodology. Here the record is restricted by the availability of PERSIANN precipitation.
2 Data and methods
2.1 Evaporation data sets
This section describes briefly the evaporation products usedin this study (see Table 1 for a summary). These are allglobal products extracted for Africa at a daily temporal res-olution, with the exception of the MOD16 product, which isa monthly product. The period chosen in this study for theevaporation comparison is 2000–2010, which is the periodcommon to all the products.
Four of the evaporation products considered in this studyare based on the PCR-GLOBWB hydrological model (seeTable 1, these products are indicated by the PCR prefix) withdifferences in the input data or the addition of specific pro-cesses to assess their impact on the resulting evaporationproduct. Each of the products is described in detail below.The description of the first product based on PCR-GLOBWBalso presents a general explanation of the PCR-GLOBWBhydrological model with the selected forcing data. We thendescribe the other PCR-GLOBWB-based products by em-phasizing only the differences to the first product.
2.1.1 PCR-GLOBWB
The PCR-GLOBWB evaporation product was calculatedby means of a continental-scale version of the distributedglobal hydrological model PCR-GLOBWB (van Beek andBierkens, 2009), which was set up for the African conti-nent in the context of the FP7 EU DEWFORA project (Im-proved Drought Early Warning and Forecasting to strengthenpreparedness and adaptation in Africa). PCR-GLOBWB isused at a global scale for a variety of purposes: seasonal pre-diction, quantification of the hydrological effects of climatevariability and climate change, to compare changes in ter-restrial water storage with observed anomalies in the Earth’sgravity field and to relate demand to water availability in thecontext of water scarcity (see Sperna Weiland et al., 2012;
van Beek et al., 2011; Wada et al., 2011; Droogers et al.,2012; Sperna Weiland et al., 2011).
PCR-GLOBWB is a process-based model that is ap-plied on a cell-by-cell basis (0.5◦
× 0.5◦). PCR-GLOBWBis forced with potential evaporation, and actual evaporationis derived through simulation. Initially, the model convertspotential reference evaporationE0 into potential soil evap-oration (ES0) and potential transpiration (T0) by introduc-ing monthly and minimum crop factors. The crop factors arespecified on a monthly basis for short and tall vegetation frac-tions, as well as for the open water fraction within each cell.These crop factors are calculated as a function of the leaf areaindex (LAI) as well as of the crop factors for bare soil and un-der full cover conditions (van Beek et al., 2011). Monthly cli-matology of LAI is estimated for each GLCC (Global LandCover Characterization) type, using LAI values per type fordormancy and growing season from Hagemann et al. (1999).LAI is then used to compute the crop factor per vegetationtype according to the FAO guidelines (Allen et al., 1998).We then updated the crop factors for irrigated areas using theglobal data set of Monthly Irrigated and Rainfed Crop Areasaround the year 2000 (MIRCA2000) (Portmann et al., 2008,2010). Interception evaporation reduces potential transpira-tion, and the availability of soil moisture storage is respon-sible for the reductions of the potential bare soil evaporationand transpiration. The potential bare soil evaporation over theunsaturated area is only limited by the unsaturated hydraulicconductivity of the upper soil layer. For the saturated areathe rate of evaporation cannot exceed the saturated hydraulicconductivity of the upper soil layer. Transpiration only takesplace for the unsaturated fraction of the cells and depends onthe total available moisture in the soil layers (van Beek andBierkens, 2009).
The model is described in full detail elsewhere (van Beeket al., 2011; van Beek and Bierkens, 2009). We hereby de-scribe the forcing data applied in the first version of themodel used in this study (product 1). Three other evaporationproducts were derived also from this model with changes in
www.hydrol-earth-syst-sci.net/18/193/2014/ Hydrol. Earth Syst. Sci., 18, 193–212, 2014

196 P. Trambauer et al.: Comparison of different evaporation estimates over the African continent
either the forcing data or in the model structure (products 2,3 and 4, Table 1).
Meteorological forcing
The model is directly forced with daily precipitation, tem-perature and reference potential evaporation as calculatedfrom other meteorological variables (2 m temperature, 2 mdewpoint temperature, surface pressure, wind speed, and netradiation). Meteorological forcing was obtained from theERA-Interim (ERAI) reanalysis data of the past 32 yr (1979–2010). The ERAI precipitation data used in this study isavailable at a resolution of approximately 0.7◦ and was cor-rected with GPCP v2.1 (product of the Global PrecipitationClimatology Project) to reduce the bias when compared tomeasured products (Balsamo et al., 2010; Szczypta et al.,2011). The GPCP v2.1 is available globally at 2.5◦
× 2.5◦
resolution with a monthly frequency, covering the periodfrom 1979 to September 2009. It combines the precipitationinformation available from several sources (satellite data,rain gauge data, etc.) into a merged product (Szczypta etal., 2011; Huffman et al., 2009). From September 2009 toDecember 2010, the mean monthly ERAI precipitation wascorrected using a mean bias coefficient based on the clima-tology of the bias correction coefficients used for the period1979–2009. While this only corrects for systematic biases,this was the only option available at the time, as a new ver-sion of GPCP (version 2.2) was not available. The meteoro-logical forcing was applied with the same spatial resolutionof 0.5◦ as the model, using bilinear interpolation to down-scale from the ERAI grid to the model grid, and is assumedto be constant over the grid cell.
Reference potential evaporation from reanalysis data
The PCR-GLOBWB model requires reference potentialevaporation as a meteorological input, and this thereforeneeds to be estimated externally. There are several ap-proaches to estimate potential evaporation, with diverse lev-els of data requirements and complexity, with different tem-poral scales, physically based and empirical, developed un-der specific regions or climates. The Hargreaves equation (in-put parameters: daily minimum, maximum and mean temper-ature and extraterrestrial radiation) was used because it hasthe advantage that it can be applied in data scarce regions,which is the case for several regions in Africa. Droogersand Allen (2002) compared Penman–Monteith and Harg-reaves reference evaporation estimates on a global scale andfound very reasonable agreement between the two meth-ods (R2 = 0.895, RMSD= 0.81). They suggest that the Har-greaves formula should be considered in regions where ac-curate weather data cannot be expected. The Hargreavesmethod requires less parameterization, with the disadvantagethat it is less sensitive to climatic input data, with a possi-
bly reduction of dynamics and accuracy. However, it leadsto a notably smaller sensitivity to error in climatic inputs(Hargreaves and Allen, 2003). Moreover, Sperna Weiland etal. (2012) studied several methods to calculate daily globalreference potential evaporation from Climate Forecast Sys-tem Reanalysis (CFSR) data from the National Center for At-mospheric Research, for application in a hydrological modelstudy. They compared six different methods and found a re-calibrated form of the Hargreaves equation (increasing themultiplication factor of the equation from 0.0023 to 0.0031)to outperform the other alternatives.
2.1.2 PCR_PM
The PCR_PM evaporation product results from forcingthe PCR-GLOBWB hydrological model with Penman–Monteith reference potential evaporation. The Penman–Monteith method is one of the most widely used for the esti-mation of potential evaporation. Although this formula is ingeneral highly recommended by the FAO and is consideredto be one of the most physically based methods, it is im-pacted by the site aridity and is reported to underestimate thepotential evaporation in some regions of Africa and other aridregions (Sperna Weiland et al., 2012; Hargreaves and Allen,2003). Nevertheless, in this study we estimate the potentialevaporation with the Penman–Monteith method using inputvariables derived from the ERAI data. This is then used toforce the PCR-GLOBWB hydrological model to assess thedifference in the actual evaporation resulting from the dif-ferent inputs in reference potential evaporation. This productdiffers from the first product (PCR-GLOBWB) only in theforcing potential evaporation data set used.
2.1.3 PCR_TRMM
This evaporation product (PCR_TRMM) results from thePCR-GLOBWB hydrological model simulation, but forcedwith TRMM 3B42 v6 precipitation data, which has finerspatial resolution and is independent of the ERAI forecast-ing platform. Other meteorological inputs, including poten-tial evaporation are as in the product 1 version of the PCR-GLOBWB model. Including this product in the comparisonallows for assessing the impact that the precipitation forcinghas on the resulting actual evaporation. The TRMM 3B42v6 precipitation data was chosen from the available satellite-based rainfall estimates following the results of a recentstudy that validated six of these products and one reanalysisproduct (ERA-Interim) over four African basins (Thiemig etal., 2012), and found TRMM 3B42 together with RFE 2.0(NOAA African Precipitation Estimation Algorithm) to bethe most accurate products when compared to ground data.
Hydrol. Earth Syst. Sci., 18, 193–212, 2014 www.hydrol-earth-syst-sci.net/18/193/2014/

P. Trambauer et al.: Comparison of different evaporation estimates over the African continent 197
2.1.4 PCR_Irrig
This product (PCR_Irrig) is also the result of the PCR-GLOBWB hydrological model when irrigation is includedin the model structure. It was introduced in the study assome African countries such as Egypt, Morocco, Sudan andSouth Africa contain large irrigation areas. In South Africa,for example, there is a high density of small reservoirs forirrigation purposes (see McClain, 2012). The different com-ponents of evaporation (soil evaporation, transpiration andopen water evaporation from reservoirs) are expected to in-crease as a result of irrigation practices, reaching potentialevaporation rates under optimal irrigation practices. More-over, a recent study by van Beek et al. (2011) suggestedthat the PCR-GLOBWB hydrological model might under-estimate evaporation given that the default model does notexplicitly consider irrigated areas. They compared the PCR-GLOBWB evaporation results with the reanalyses ERA-40(reanalysis by ECMWF, a previous version of the ERA-Interim) evaporation and found ERA-40 evaporation to beconsistently higher than the evaporation data simulated byPCR-GLOBWB. They attributed these differences to irriga-tion, as they indicated that ERA-40 (which includes data as-similation) accounts implicitly for irrigation by decreasingthe temperature to compensate for the energy loss as latentheat. The original version of PCR-GLOBWB, on the otherhand, includes irrigated areas using crop factors, but actualevaporation cannot exceed the available soil moisture as theadditional contribution due to irrigation is not modelled. Thedifference between the two actual evaporation products rep-resent the transpiration of the water applied (van Beek et al.,2011).
To include the influence of irrigation the original PCR-GLOBWB hydrological model was adapted. The irrigationrequirement for the irrigated crop area within a cell is sup-plied through the storage of freshwater in the cell. For eachcell where irrigation takes place, it is assumed that at least asmall farm reservoir is included and that this provides suffi-cient storage to satisfy the demand. The irrigated area withineach cell, water requirements and irrigation cropping pat-terns are extracted from the “Global map of irrigated areas”from Siebert et al. (2007) and FAO (1997). This modifiedversion of the hydrological model serves to assess the im-pact of adding irrigation in the model structure on the actualevaporation results.
2.1.5 ERAI
ERA-Interim (ERAI) is a global atmospheric reanalysis pro-duced by the European Centre for Medium-Range WeatherForecasts (ECMWF) which covers the period from Jan-uary 1979 to present date with a horizontal resolution of ap-proximately 0.7 degrees and 62 vertical levels. A compre-hensive description of the ERAI product is available in Deeet al. (2011). The ERAI evaporation is the result from the
coupled land–atmosphere simulations. The ERAI land com-ponent is the model TESSEL (Van den Hurk et al., 2000) thatis coupled to the atmospheric model, therefore being forced(and providing fluxes to the atmosphere) with the ERAI fore-casts of near-surface conditions (temperature, humidity, pres-sure and wind speed) and downward energy and water fluxes(precipitation, solar and thermal radiation). In ERAI, the LAIis used as fixed fields with no inter-annual variability.
2.1.6 ERAL
ERA-Land (ERAL, Balsamo et al., 2012) is a global land-surface data set covering the period 1979–2010. ERALis a land-surface-only simulation (offline) carried out withHTESSEL (Balsamo et al., 2011a, b), an updated versionof TESSEL (that was used in ERAI), with meteorologicalforcing from ERAI and precipitation adjustments based onGPCP. HTESSEL computes the land-surface response to thenear-surface atmospheric conditions forcing, and estimatesthe surface water and energy fluxes and the temporal evo-lution of soil temperature, moisture content and snowpackconditions. At the interface to the atmosphere each grid boxis divided into fractions (tiles), with up to six fractions overland (bare ground, low and high vegetation, intercepted wa-ter, shaded and exposed snow). The grid box surface fluxesare calculated separately for each tile, leading to a sepa-rate solution of the surface energy balance equation and theskin temperature. The latter represents the interface betweenthe soil and the atmosphere. Below the surface, the verticaltransfer of water and energy is performed using four verticallayers to represent soil temperature and moisture. Soil heattransfer follows a Fourier law of diffusion, modified to takeinto account soil water freezing/melting. Water movement inthe soil is determined by Darcy’s Law, and surface runoff ac-counts for the sub-grid variability of orography (Balsamo etal., 2009). HTESSEL is part of the integrated forecast sys-tem at ECMWF with operational applications ranging fromshort-range to monthly and seasonal weather forecasts. TheLAI in ERAL was prescribed as a mean annual climatology,as described by Boussetta et al. (2012).
ERAI and ERAL differ mainly in three aspects: (i) land-surface model – TESSEL in ERAI and HTESSEL inERAL; (ii) coupling to the atmosphere – ERAI coupled andERAL land-surface-only simulations (no feedback to the at-mosphere forced with corrected precipitation); and (iii) dataassimilation – none in ERAL while ERAI soil moisture as-similation scheme corrects soil moisture in the first threelayers based on the 6 h atmospheric analysis increments ofspecific humidity and temperature at the lowest model level(Douville et al., 2000). While the first two points are difficultto evaluate, the impact of soil moisture data assimilation inERAI can be evaluated by calculating the assimilation incre-ments: i.e. the amount of soil moisture added (or removed)by the data assimilation system.
www.hydrol-earth-syst-sci.net/18/193/2014/ Hydrol. Earth Syst. Sci., 18, 193–212, 2014

198 P. Trambauer et al.: Comparison of different evaporation estimates over the African continent
2.1.7 MOD16
Remote sensing provides an indirect method to estimateglobal actual and potential evaporation. MOD16 is describedin detail by Mu et al. (2011, 2007), and computes potentialand actual evaporation using MODIS (Moderate resolutionImaging Spectroradiometer) land cover, albedo, LAI, an En-hanced Vegetation Index (EVI), and a daily meteorologicalreanalysis data set from NASA’s Global Modelling and As-similation Office (GMAO) as inputs for regional and globalevaporation mapping and monitoring (Mu et al., 2011). Thismethod is an adaptation of a previous version of the evapo-ration algorithm by Mu et al. (2007), which is based on theremotely sensed evaporation model developed by Cleugh etal. (2007).
Mu et al. (2011) computed potential evaporation with thePenman–Monteith method driven by GEOS-5 daily meteo-rological reanalysis inputs and MODIS derived vegetationdata: land-surface temperature, LAI, gross primary produc-tivity and vegetation indices were extracted from four differ-ent MODIS products. To derive actual from potential evap-oration, Mu et al. (2007) include multipliers to halt planttranspiration and soil evaporation as follows: low tempera-tures and water stress (due to high vapour pressure deficit)limit the transpiration flow, and soil evaporation is limitedby a complementary relationship hypothesis which definesland-atmospheric interactions from vapour pressure deficitand relative humidity (Mu et al., 2007).
This product has been validated against actual measure-ments in several regions. Mu et al. (2011) evaluated theiralgorithm using evaporation observations at 46 eddy covari-ance flux towers in the United States and Canada. In theirpaper they present the root mean square error (RMSE), cor-relation, and Taylor skill score for each flux tower, and theyreport that the average mean absolute bias values are 24.1 %of the evaporation measurements. Kim et al. (2012) vali-dated MOD16 global terrestrial evaporation products at 17flux tower locations in Asia and found good agreement onlyat five locations (r = 0.50 to 0.76, bias= −1.42 to 1.99 mm8d−1; RMSE= 1.99 to 8.96 mm 8d−1). They observed thebest performance of the MOD16 evaporation algorithm atsites with forested land cover. They observed poor perfor-mance at sites with grassland cover in arid and polar cli-mates. The MODIS derived potential and actual evapora-tion are available online (http://www.ntsg.umt.edu/project/mod16, data set retrieved in April 2012) with a resolutionof 1 km and as with most standard MODIS Land products,it uses the Sinusoidal grid tiling system in which the tilesare 10◦ × 10◦ at the equator (USGS, 2012). We created themosaic for each month obtaining one monthly map for theentire continent, and scaled it up to a resolution of 0.5◦
(∼ 50 km) using the cubic convolution resampling as sug-gested by Keys (1981) and Liu et al. (2007).
2.1.8 GLEAM
GLEAM (Global Land Evaporation: the AmsterdamMethodology) is a method to derive global evaporation froma wide range of satellite observations that was developed bythe VU University of Amsterdam (Miralles et al., 2011a,b). The version of the product used here has a spatial res-olution of 0.25 degrees latitude–longitude, and it is forcedwith PERSIANN (Precipitation Estimation from RemotelySensed Information using Artificial Neural Networks) pre-cipitation data, soil moisture and vegetation optical depthdata retrieved from the NASA-LPRM (Land Parameter Re-trieval Model2 – Owe et al., 2008), radiation fluxes fromERA-Interim, air temperature from AIRS (Atmospheric In-fraRed Sounder) gap-filled with ISCCP (International Satel-lite Cloud Climatology Project – Rossow and Schiffer, 1999),and snow water equivalents from NSIDC (National Snow andIce Data Center – Armstrong et al., 2007). GLEAM usesa modified Priestley and Taylor (PT) model, in combina-tion with an evaporative stress module and a Gash analyti-cal model of rainfall interception (Miralles et al., 2010), tocombine the above-mentioned satellite-observable variablesto derive evaporation. The GLEAM algorithm has been re-cently validated using measurements from 163 eddy covari-ance stations and 701 soil moisture sensors (Miralles et al.,2013).
2.2 Definition of regions
In this paper we aim to compare the different sets of evapo-ration results in defined African regions. With this purpose,we divided the African continent in regions based on simi-lar aridity conditions and annual precipitation cycles. First,we divided the African continent based on climatic classes.The classification of the different climates was done follow-ing the definition of the UNEP (1997) and the Global Arid-ity Index (Global-Aridity) data set produced by Zomer etal. (2008). This is published online in the Consultative Groupfor International Agriculture Research Consortium for Spa-tial Information (CGIAR-CSI) website (CGIAR CSI Con-sortium for Spatial Information, 2010). The Global-Ariditydata set is provided for non-commercial use in standardARC/INFO Grid format, at 30 arcsec (∼ 1 km at equator).Zomer et al. (2008) calculated a global map of the meanAridity Index (AI) from the 1950–2000 period at 0.5◦ spa-tial resolution as
AI = MAP/MAE (1)
where MAP is the Mean Annual Precipitation (mm yr−1) andMAE is the Mean Annual Potential Evaporation (mm yr−1).
2http://gcmd.nasa.gov/records/GCMD_GES_DISC_LPRM_AMSRE_SOILM2_V001.htmlThe data are derived from differentsatellite sensors: SSMI before mid-2002 and AMSR-E aftermid-2002.
Hydrol. Earth Syst. Sci., 18, 193–212, 2014 www.hydrol-earth-syst-sci.net/18/193/2014/
P. Trambauer et al.: Comparison of different evaporation estimates over the African continent 199
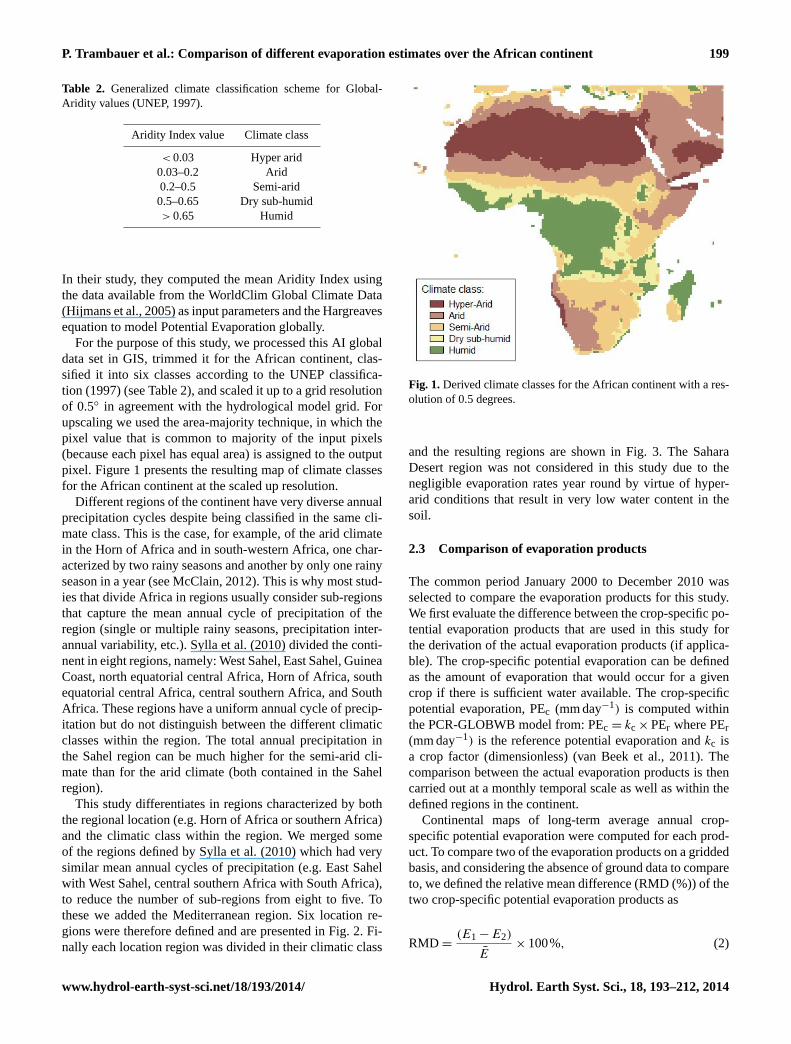
Table 2. Generalized climate classification scheme for Global-Aridity values (UNEP, 1997).
Aridity Index value Climate class
< 0.03 Hyper arid0.03–0.2 Arid0.2–0.5 Semi-arid0.5–0.65 Dry sub-humid> 0.65 Humid
In their study, they computed the mean Aridity Index usingthe data available from the WorldClim Global Climate Data(Hijmans et al., 2005) as input parameters and the Hargreavesequation to model Potential Evaporation globally.
For the purpose of this study, we processed this AI globaldata set in GIS, trimmed it for the African continent, clas-sified it into six classes according to the UNEP classifica-tion (1997) (see Table 2), and scaled it up to a grid resolutionof 0.5◦ in agreement with the hydrological model grid. Forupscaling we used the area-majority technique, in which thepixel value that is common to majority of the input pixels(because each pixel has equal area) is assigned to the outputpixel. Figure 1 presents the resulting map of climate classesfor the African continent at the scaled up resolution.
Different regions of the continent have very diverse annualprecipitation cycles despite being classified in the same cli-mate class. This is the case, for example, of the arid climatein the Horn of Africa and in south-western Africa, one char-acterized by two rainy seasons and another by only one rainyseason in a year (see McClain, 2012). This is why most stud-ies that divide Africa in regions usually consider sub-regionsthat capture the mean annual cycle of precipitation of theregion (single or multiple rainy seasons, precipitation inter-annual variability, etc.). Sylla et al. (2010) divided the conti-nent in eight regions, namely: West Sahel, East Sahel, GuineaCoast, north equatorial central Africa, Horn of Africa, southequatorial central Africa, central southern Africa, and SouthAfrica. These regions have a uniform annual cycle of precip-itation but do not distinguish between the different climaticclasses within the region. The total annual precipitation inthe Sahel region can be much higher for the semi-arid cli-mate than for the arid climate (both contained in the Sahelregion).
This study differentiates in regions characterized by boththe regional location (e.g. Horn of Africa or southern Africa)and the climatic class within the region. We merged someof the regions defined by Sylla et al. (2010) which had verysimilar mean annual cycles of precipitation (e.g. East Sahelwith West Sahel, central southern Africa with South Africa),to reduce the number of sub-regions from eight to five. Tothese we added the Mediterranean region. Six location re-gions were therefore defined and are presented in Fig. 2. Fi-nally each location region was divided in their climatic class
Fig. 1.Derived climate classes for the African continent with a res-olution of 0.5 degrees.
and the resulting regions are shown in Fig. 3. The SaharaDesert region was not considered in this study due to thenegligible evaporation rates year round by virtue of hyper-arid conditions that result in very low water content in thesoil.
2.3 Comparison of evaporation products
The common period January 2000 to December 2010 wasselected to compare the evaporation products for this study.We first evaluate the difference between the crop-specific po-tential evaporation products that are used in this study forthe derivation of the actual evaporation products (if applica-ble). The crop-specific potential evaporation can be definedas the amount of evaporation that would occur for a givencrop if there is sufficient water available. The crop-specificpotential evaporation, PEc (mm day−1) is computed withinthe PCR-GLOBWB model from: PEc = kc × PEr where PEr(mm day−1) is the reference potential evaporation andkc isa crop factor (dimensionless) (van Beek et al., 2011). Thecomparison between the actual evaporation products is thencarried out at a monthly temporal scale as well as within thedefined regions in the continent.
Continental maps of long-term average annual crop-specific potential evaporation were computed for each prod-uct. To compare two of the evaporation products on a griddedbasis, and considering the absence of ground data to compareto, we defined the relative mean difference (RMD (%)) of thetwo crop-specific potential evaporation products as
RMD =(E1 − E2)
E× 100%, (2)
www.hydrol-earth-syst-sci.net/18/193/2014/ Hydrol. Earth Syst. Sci., 18, 193–212, 2014

200 P. Trambauer et al.: Comparison of different evaporation estimates over the African continent
Fig. 2.Location regions in Africa based on similarity of annual pre-cipitation cycle (based on Sylla et al., 2010).
whereE1 andE2 is the annual crop-specific potential evapo-ration (mm yr−1) data set of 1 or 2, respectively, andE is themean crop-specific potential evaporation (mm yr−1) of prod-uctsE1 andE2.
RMD indicates which product is consistently higher thanthe other, and the relative magnitude of the difference be-tween them (compared with the average value). This indica-tor seems to be a fair way of estimating the relative differenceas none of the available products represents ground truth. In-dicators showing absolute differences are not useful as thesame absolute difference can be relatively large for areas withlow actual evaporation values (arid areas), and relatively lowfor areas with high actual evaporation values (humid areas).
We also computed continental maps of long-term averageactual evaporation for each product to allow for a visual per-ception of the spatial variability of the continental evapora-tion for each product, and between products. Moreover, tomake the analysis quantitative, we created an Evapotranspi-ration Multiproduct (EM) as the median of the consideredproducts and we computed the relative mean bias (RMB (%))between each product and the EM. In this case we consideredthe EM as the “observations”, and the RMB was defined sim-ilarly to the RMD as follows:
RMB =(Ei − EM)
EM× 100%, (3)
whereEi is the annual actual evaporation (mm yr−1) data seti and EM is the annual actual evapotranspiration multiprod-uct (mm yr−1).
Subsequently, for each region the annual totals of eachevaporation product were computed and the seasonality ofthe different products was studied and compared with theEM. The mean annual anomalies of each product with re-
Fig. 3. Derived “regions” characterized by both the regional loca-tion and the climatic class within the region.
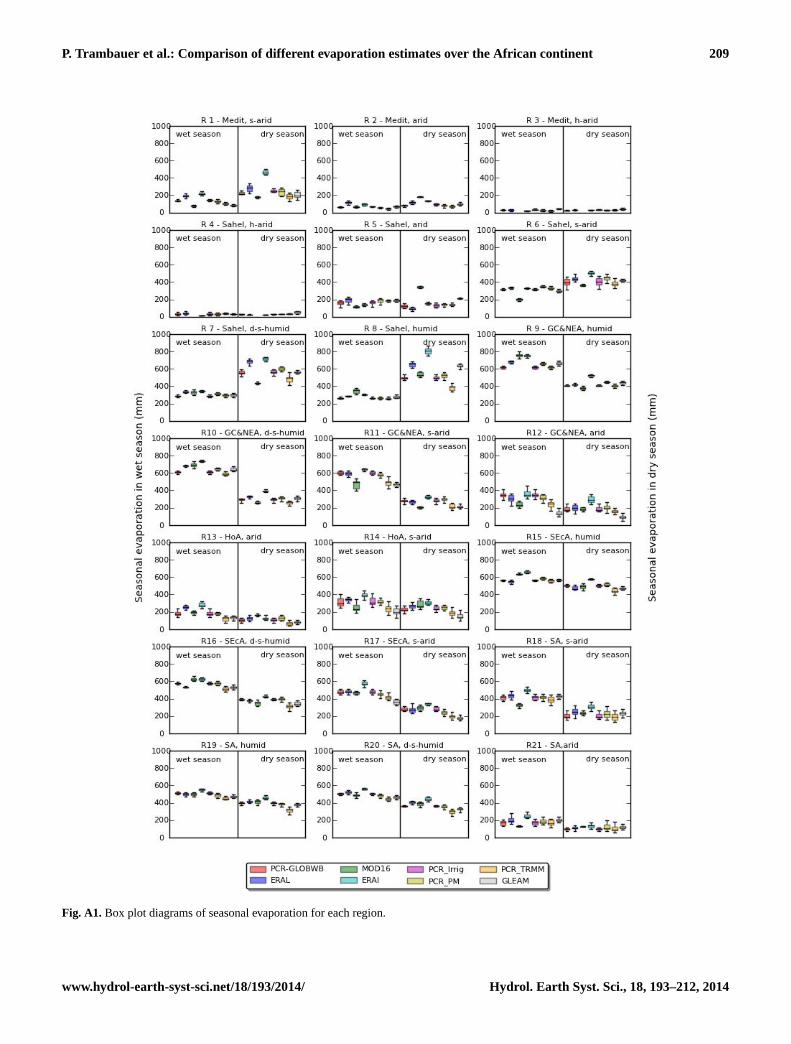
spect to the EM are presented for each region, and the vari-ation of mean monthly actual evaporation was plotted foreach product within each region and compared through vi-sual inspection. The statistics of each evaporation productwere then plotted for each region by means of Taylor dia-grams of monthly evaporation and a box plot diagram of sea-sonal evaporation. The box plots, presented in Appendix A,are displayed for the wet and the dry seasons.
3 Results
3.1 Comparison of potential evaporation products
PCR-GLOBWB model and MOD16 compute the actualevaporation fluxes from the crop-specific potential evapo-ration (PE) and limitations due to water availability and/orlow temperatures. We hereby present three potential evap-oration estimates. We computed the first two (for PCR-GLOBWB) from the ERA-Interim reanalysis data usingPenman–Monteith and Hargreaves methods. The third prod-uct, MOD16 PE, uses the Penman–Monteith method but isderived from NASA’s Global Modelling and AssimilationOffice (GMAO) meteorological data and MODIS maps.
Figure 4 presents the mean annual crop-specific poten-tial evaporation for the period 2000–2010 based on (a) thePenman–Monteith method, and (b) the Hargreaves method,both derived from the ERA-Interim reanalysis data. Figure 4cpresents the potential evaporation from the MOD16 product.The areas in grey in the MOD16 potential evaporation cor-respond to missing evaporation data in the MOD16 product.MOD16 does not include urban and barren areas since there
Hydrol. Earth Syst. Sci., 18, 193–212, 2014 www.hydrol-earth-syst-sci.net/18/193/2014/
P. Trambauer et al.: Comparison of different evaporation estimates over the African continent 201
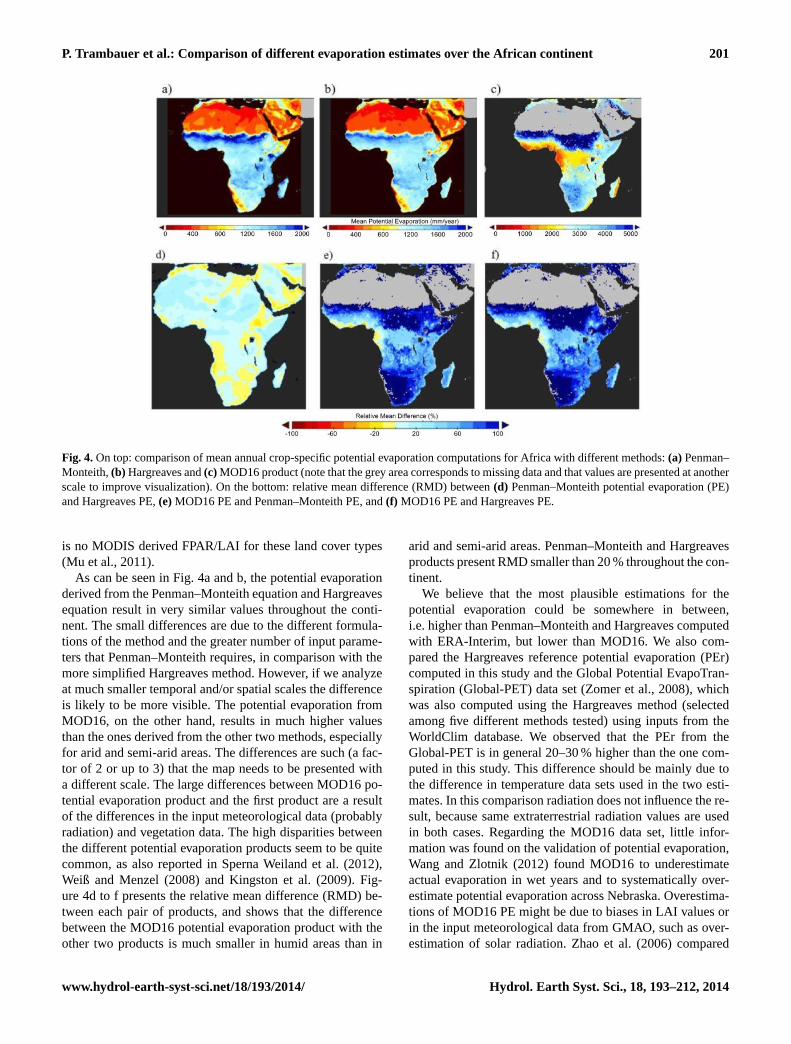
Fig. 4.On top: comparison of mean annual crop-specific potential evaporation computations for Africa with different methods:(a) Penman–Monteith,(b) Hargreaves and(c) MOD16 product (note that the grey area corresponds to missing data and that values are presented at anotherscale to improve visualization). On the bottom: relative mean difference (RMD) between(d) Penman–Monteith potential evaporation (PE)and Hargreaves PE,(e)MOD16 PE and Penman–Monteith PE, and(f) MOD16 PE and Hargreaves PE.
is no MODIS derived FPAR/LAI for these land cover types(Mu et al., 2011).
As can be seen in Fig. 4a and b, the potential evaporationderived from the Penman–Monteith equation and Hargreavesequation result in very similar values throughout the conti-nent. The small differences are due to the different formula-tions of the method and the greater number of input parame-ters that Penman–Monteith requires, in comparison with themore simplified Hargreaves method. However, if we analyzeat much smaller temporal and/or spatial scales the differenceis likely to be more visible. The potential evaporation fromMOD16, on the other hand, results in much higher valuesthan the ones derived from the other two methods, especiallyfor arid and semi-arid areas. The differences are such (a fac-tor of 2 or up to 3) that the map needs to be presented witha different scale. The large differences between MOD16 po-tential evaporation product and the first product are a resultof the differences in the input meteorological data (probablyradiation) and vegetation data. The high disparities betweenthe different potential evaporation products seem to be quitecommon, as also reported in Sperna Weiland et al. (2012),Weiß and Menzel (2008) and Kingston et al. (2009). Fig-ure 4d to f presents the relative mean difference (RMD) be-tween each pair of products, and shows that the differencebetween the MOD16 potential evaporation product with theother two products is much smaller in humid areas than in
arid and semi-arid areas. Penman–Monteith and Hargreavesproducts present RMD smaller than 20 % throughout the con-tinent.
We believe that the most plausible estimations for thepotential evaporation could be somewhere in between,i.e. higher than Penman–Monteith and Hargreaves computedwith ERA-Interim, but lower than MOD16. We also com-pared the Hargreaves reference potential evaporation (PEr)computed in this study and the Global Potential EvapoTran-spiration (Global-PET) data set (Zomer et al., 2008), whichwas also computed using the Hargreaves method (selectedamong five different methods tested) using inputs from theWorldClim database. We observed that the PEr from theGlobal-PET is in general 20–30 % higher than the one com-puted in this study. This difference should be mainly due tothe difference in temperature data sets used in the two esti-mates. In this comparison radiation does not influence the re-sult, because same extraterrestrial radiation values are usedin both cases. Regarding the MOD16 data set, little infor-mation was found on the validation of potential evaporation,Wang and Zlotnik (2012) found MOD16 to underestimateactual evaporation in wet years and to systematically over-estimate potential evaporation across Nebraska. Overestima-tions of MOD16 PE might be due to biases in LAI values orin the input meteorological data from GMAO, such as over-estimation of solar radiation. Zhao et al. (2006) compared
www.hydrol-earth-syst-sci.net/18/193/2014/ Hydrol. Earth Syst. Sci., 18, 193–212, 2014

202 P. Trambauer et al.: Comparison of different evaporation estimates over the African continent
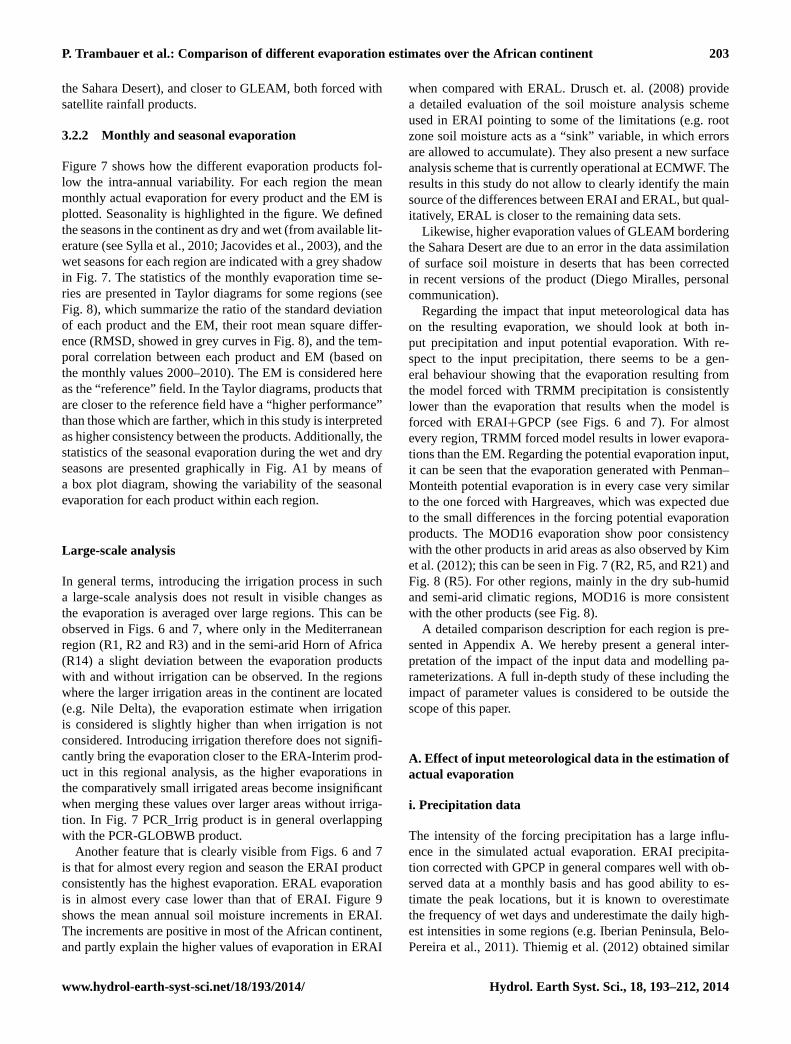
Fig. 5.Relative mean bias (RMB) between each product and the evaporation multiproduct (EM).
three known meteorological data sets: GMAO, ERA-40 fromECMWF and NCEP/NCAR to evaluate the sensitivity ofMODIS global terrestrial gross and net primary production(GPP and NPP) to the uncertainties of meteorological inputs.They found that NCEP tends to overestimate surface solar ra-diation and underestimate both temperature and vapor pres-sure deficit (VPD), ECMWF has the highest accuracy butits radiation is lower in tropical regions, and the accuracy ofGMAO lies in between. Their results show that the biases inthe meteorological inputs can introduce significant error inthe evaporation estimates.
3.2 Comparison of actual evaporation products
3.2.1 Mean annual evaporation
From the maps of mean annual evaporation for each product(not shown) it appears that the similarity between the differ-ent actual evaporation products is much higher than it is be-tween the potential evaporation products. This suggests thatthe high variability introduced by the potential evaporationproducts is decreased in the derivation of actual evaporation.Figure 5 shows the maps of RMB between the mean annualactual evaporation of each product and the EM for the period2000–2010. The RMB results in the highest values for thehyper-arid areas surrounding the Sahara Desert, region thatwas left out of this analysis due to its negligible actual evapo-ration values. On the continental scale the mean annual evap-oration maps of PCR-GLOBWB and the PCR_Irrig productsare almost identical. The difference is only apparent if com-pared on a much smaller scale. Therefore, PCR_Irrig prod-uct was not included in the EM product to avoid a doubleweight. ERAI is generally considerable above the EM, and
for the remaining products the offset with the EM dependson the region. Over some water bodies higher evaporationvalues are noticeable in the products resulting from the PCR-GLOBWB model when compared to the other products; openwater evaporation is considered in the total actual evapora-tion in this model by means of crop factors, which are spec-ified for the fractions: open water, short vegetation and tallvegetation for each cell. ERAI and ERAL only consider wa-ter bodies bigger than 3000 km2. For those grid points, onlythe energy balance is calculated and evaporation given as afree water surface with prescribed temperature. In GLEAMevaporation from the open water is considered as potentialevaporation which is computed using Priestley and Taylormethod. In MOD16 the contribution of lakes and rivers is notmodelled, the evaporation therefore refers only to the landevaporation.
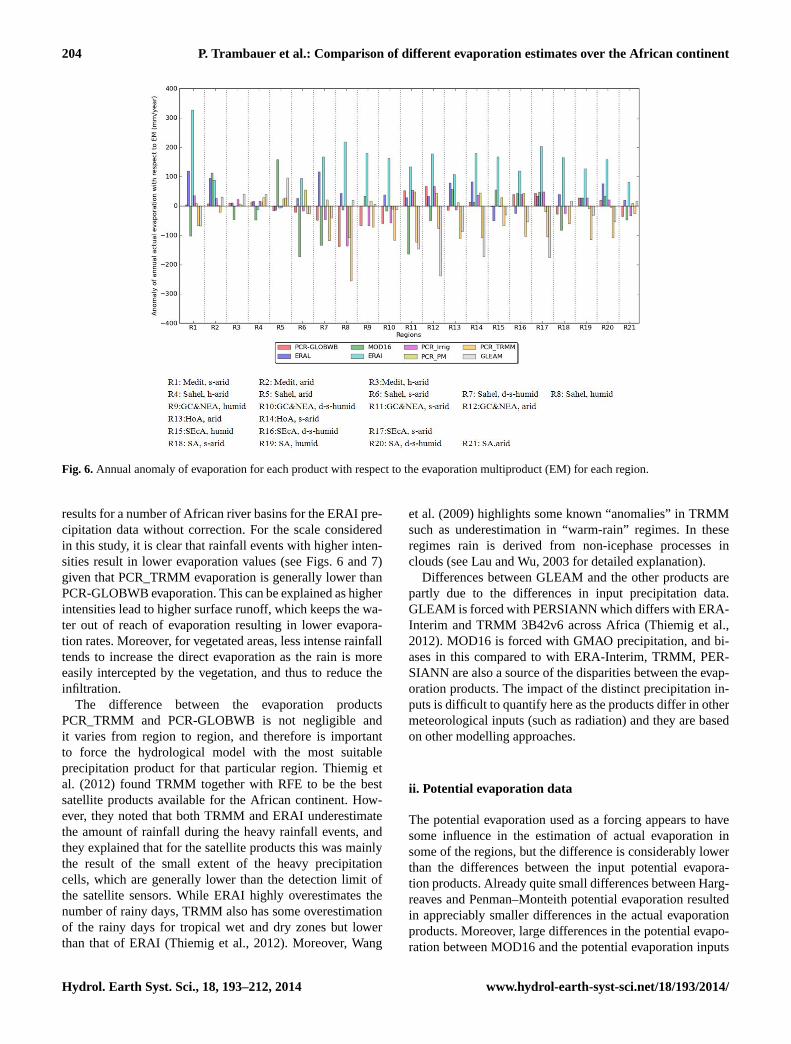
The annual anomalies of evaporation for each product withrespect to the EM are presented in Fig. 6 for each region. Thefigure shows that ERAI evaporation product has the high-est annual evaporation in the continent for almost every re-gion with the exception of the hyper-arid and arid areas ofthe Mediterranean (R2 and R3) and Sahel (R4 and R5) re-gions, which border the Sahara Desert. Regarding the otherevaporation products, in most cases they deviate from theEM for less than 100 mm yr−1, with some few exceptions forMOD16, PCR_TRMM and GLEAM. The PCR-GLOBWBderived products forced with ERAI+GPCP precipitation arein almost every case close to the EM with the exception ofhumid Sahel (R8). PCR_TRMM product (PCR-GLOBWBmodel forced with TRMM precipitation data) is mostly lowerthan the EM (with the exception of the regions bordering
Hydrol. Earth Syst. Sci., 18, 193–212, 2014 www.hydrol-earth-syst-sci.net/18/193/2014/
P. Trambauer et al.: Comparison of different evaporation estimates over the African continent 203
the Sahara Desert), and closer to GLEAM, both forced withsatellite rainfall products.
3.2.2 Monthly and seasonal evaporation
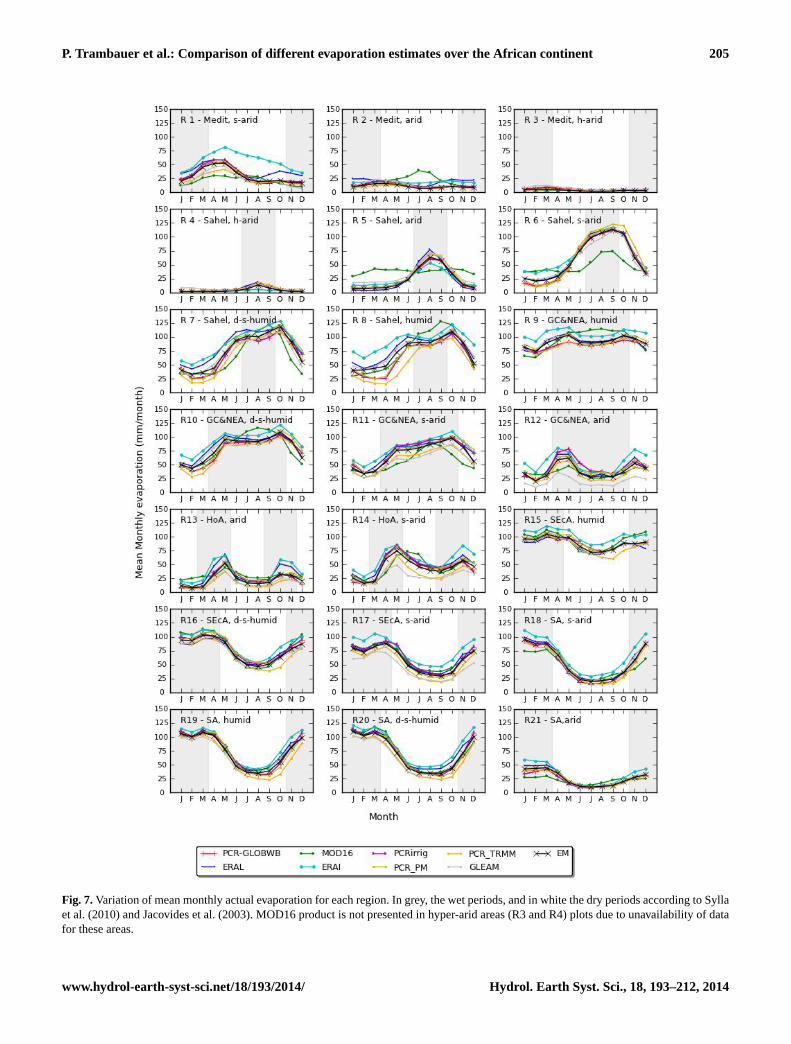
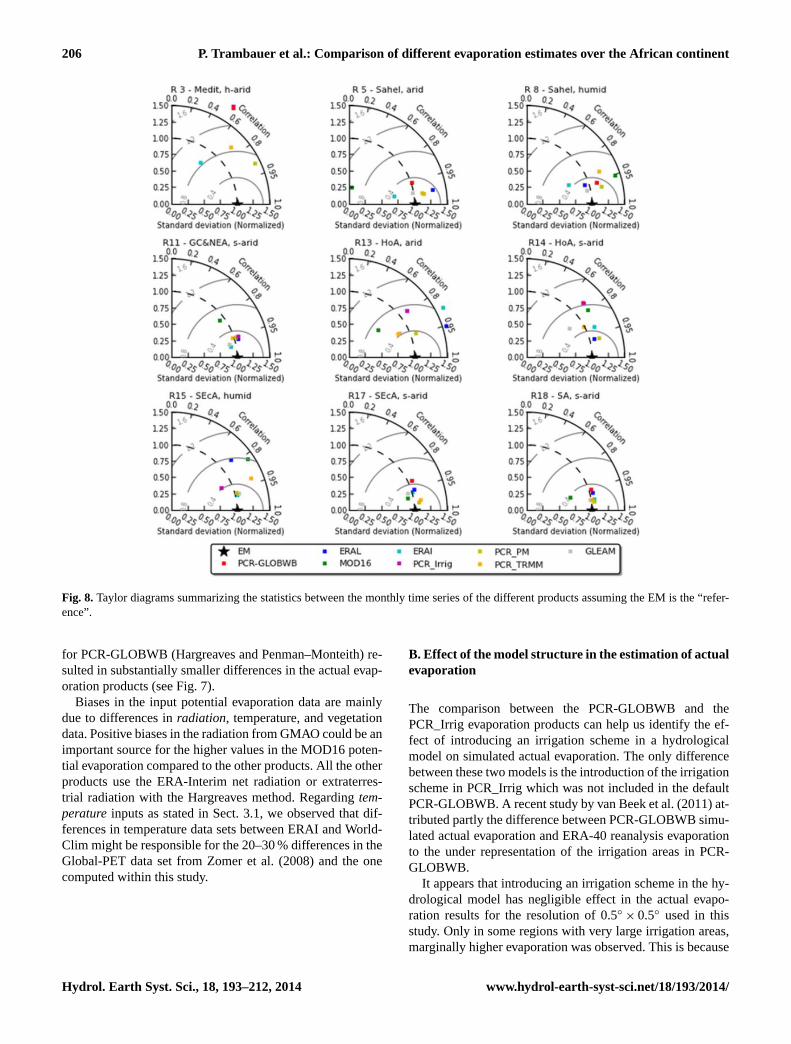
Figure 7 shows how the different evaporation products fol-low the intra-annual variability. For each region the meanmonthly actual evaporation for every product and the EM isplotted. Seasonality is highlighted in the figure. We definedthe seasons in the continent as dry and wet (from available lit-erature (see Sylla et al., 2010; Jacovides et al., 2003), and thewet seasons for each region are indicated with a grey shadowin Fig. 7. The statistics of the monthly evaporation time se-ries are presented in Taylor diagrams for some regions (seeFig. 8), which summarize the ratio of the standard deviationof each product and the EM, their root mean square differ-ence (RMSD, showed in grey curves in Fig. 8), and the tem-poral correlation between each product and EM (based onthe monthly values 2000–2010). The EM is considered hereas the “reference” field. In the Taylor diagrams, products thatare closer to the reference field have a “higher performance”than those which are farther, which in this study is interpretedas higher consistency between the products. Additionally, thestatistics of the seasonal evaporation during the wet and dryseasons are presented graphically in Fig. A1 by means ofa box plot diagram, showing the variability of the seasonalevaporation for each product within each region.
Large-scale analysis
In general terms, introducing the irrigation process in sucha large-scale analysis does not result in visible changes asthe evaporation is averaged over large regions. This can beobserved in Figs. 6 and 7, where only in the Mediterraneanregion (R1, R2 and R3) and in the semi-arid Horn of Africa(R14) a slight deviation between the evaporation productswith and without irrigation can be observed. In the regionswhere the larger irrigation areas in the continent are located(e.g. Nile Delta), the evaporation estimate when irrigationis considered is slightly higher than when irrigation is notconsidered. Introducing irrigation therefore does not signifi-cantly bring the evaporation closer to the ERA-Interim prod-uct in this regional analysis, as the higher evaporations inthe comparatively small irrigated areas become insignificantwhen merging these values over larger areas without irriga-tion. In Fig. 7 PCR_Irrig product is in general overlappingwith the PCR-GLOBWB product.
Another feature that is clearly visible from Figs. 6 and 7is that for almost every region and season the ERAI productconsistently has the highest evaporation. ERAL evaporationis in almost every case lower than that of ERAI. Figure 9shows the mean annual soil moisture increments in ERAI.The increments are positive in most of the African continent,and partly explain the higher values of evaporation in ERAI
when compared with ERAL. Drusch et. al. (2008) providea detailed evaluation of the soil moisture analysis schemeused in ERAI pointing to some of the limitations (e.g. rootzone soil moisture acts as a “sink” variable, in which errorsare allowed to accumulate). They also present a new surfaceanalysis scheme that is currently operational at ECMWF. Theresults in this study do not allow to clearly identify the mainsource of the differences between ERAI and ERAL, but qual-itatively, ERAL is closer to the remaining data sets.
Likewise, higher evaporation values of GLEAM borderingthe Sahara Desert are due to an error in the data assimilationof surface soil moisture in deserts that has been correctedin recent versions of the product (Diego Miralles, personalcommunication).
Regarding the impact that input meteorological data hason the resulting evaporation, we should look at both in-put precipitation and input potential evaporation. With re-spect to the input precipitation, there seems to be a gen-eral behaviour showing that the evaporation resulting fromthe model forced with TRMM precipitation is consistentlylower than the evaporation that results when the model isforced with ERAI+GPCP (see Figs. 6 and 7). For almostevery region, TRMM forced model results in lower evapora-tions than the EM. Regarding the potential evaporation input,it can be seen that the evaporation generated with Penman–Monteith potential evaporation is in every case very similarto the one forced with Hargreaves, which was expected dueto the small differences in the forcing potential evaporationproducts. The MOD16 evaporation show poor consistencywith the other products in arid areas as also observed by Kimet al. (2012); this can be seen in Fig. 7 (R2, R5, and R21) andFig. 8 (R5). For other regions, mainly in the dry sub-humidand semi-arid climatic regions, MOD16 is more consistentwith the other products (see Fig. 8).
A detailed comparison description for each region is pre-sented in Appendix A. We hereby present a general inter-pretation of the impact of the input data and modelling pa-rameterizations. A full in-depth study of these including theimpact of parameter values is considered to be outside thescope of this paper.
A. Effect of input meteorological data in the estimation ofactual evaporation
i. Precipitation data
The intensity of the forcing precipitation has a large influ-ence in the simulated actual evaporation. ERAI precipita-tion corrected with GPCP in general compares well with ob-served data at a monthly basis and has good ability to es-timate the peak locations, but it is known to overestimatethe frequency of wet days and underestimate the daily high-est intensities in some regions (e.g. Iberian Peninsula, Belo-Pereira et al., 2011). Thiemig et al. (2012) obtained similar
www.hydrol-earth-syst-sci.net/18/193/2014/ Hydrol. Earth Syst. Sci., 18, 193–212, 2014
204 P. Trambauer et al.: Comparison of different evaporation estimates over the African continent
Fig. 6.Annual anomaly of evaporation for each product with respect to the evaporation multiproduct (EM) for each region.
results for a number of African river basins for the ERAI pre-cipitation data without correction. For the scale consideredin this study, it is clear that rainfall events with higher inten-sities result in lower evaporation values (see Figs. 6 and 7)given that PCR_TRMM evaporation is generally lower thanPCR-GLOBWB evaporation. This can be explained as higherintensities lead to higher surface runoff, which keeps the wa-ter out of reach of evaporation resulting in lower evapora-tion rates. Moreover, for vegetated areas, less intense rainfalltends to increase the direct evaporation as the rain is moreeasily intercepted by the vegetation, and thus to reduce theinfiltration.
The difference between the evaporation productsPCR_TRMM and PCR-GLOBWB is not negligible andit varies from region to region, and therefore is importantto force the hydrological model with the most suitableprecipitation product for that particular region. Thiemig etal. (2012) found TRMM together with RFE to be the bestsatellite products available for the African continent. How-ever, they noted that both TRMM and ERAI underestimatethe amount of rainfall during the heavy rainfall events, andthey explained that for the satellite products this was mainlythe result of the small extent of the heavy precipitationcells, which are generally lower than the detection limit ofthe satellite sensors. While ERAI highly overestimates thenumber of rainy days, TRMM also has some overestimationof the rainy days for tropical wet and dry zones but lowerthan that of ERAI (Thiemig et al., 2012). Moreover, Wang
et al. (2009) highlights some known “anomalies” in TRMMsuch as underestimation in “warm-rain” regimes. In theseregimes rain is derived from non-icephase processes inclouds (see Lau and Wu, 2003 for detailed explanation).
Differences between GLEAM and the other products arepartly due to the differences in input precipitation data.GLEAM is forced with PERSIANN which differs with ERA-Interim and TRMM 3B42v6 across Africa (Thiemig et al.,2012). MOD16 is forced with GMAO precipitation, and bi-ases in this compared to with ERA-Interim, TRMM, PER-SIANN are also a source of the disparities between the evap-oration products. The impact of the distinct precipitation in-puts is difficult to quantify here as the products differ in othermeteorological inputs (such as radiation) and they are basedon other modelling approaches.
ii. Potential evaporation data
The potential evaporation used as a forcing appears to havesome influence in the estimation of actual evaporation insome of the regions, but the difference is considerably lowerthan the differences between the input potential evapora-tion products. Already quite small differences between Harg-reaves and Penman–Monteith potential evaporation resultedin appreciably smaller differences in the actual evaporationproducts. Moreover, large differences in the potential evapo-ration between MOD16 and the potential evaporation inputs
Hydrol. Earth Syst. Sci., 18, 193–212, 2014 www.hydrol-earth-syst-sci.net/18/193/2014/
P. Trambauer et al.: Comparison of different evaporation estimates over the African continent 205
Fig. 7.Variation of mean monthly actual evaporation for each region. In grey, the wet periods, and in white the dry periods according to Syllaet al. (2010) and Jacovides et al. (2003). MOD16 product is not presented in hyper-arid areas (R3 and R4) plots due to unavailability of datafor these areas.
www.hydrol-earth-syst-sci.net/18/193/2014/ Hydrol. Earth Syst. Sci., 18, 193–212, 2014
206 P. Trambauer et al.: Comparison of different evaporation estimates over the African continent
Fig. 8. Taylor diagrams summarizing the statistics between the monthly time series of the different products assuming the EM is the “refer-ence”.
for PCR-GLOBWB (Hargreaves and Penman–Monteith) re-sulted in substantially smaller differences in the actual evap-oration products (see Fig. 7).
Biases in the input potential evaporation data are mainlydue to differences inradiation, temperature, and vegetationdata. Positive biases in the radiation from GMAO could be animportant source for the higher values in the MOD16 poten-tial evaporation compared to the other products. All the otherproducts use the ERA-Interim net radiation or extraterres-trial radiation with the Hargreaves method. Regardingtem-peratureinputs as stated in Sect. 3.1, we observed that dif-ferences in temperature data sets between ERAI and World-Clim might be responsible for the 20–30 % differences in theGlobal-PET data set from Zomer et al. (2008) and the onecomputed within this study.
B. Effect of the model structure in the estimation of actualevaporation
The comparison between the PCR-GLOBWB and thePCR_Irrig evaporation products can help us identify the ef-fect of introducing an irrigation scheme in a hydrologicalmodel on simulated actual evaporation. The only differencebetween these two models is the introduction of the irrigationscheme in PCR_Irrig which was not included in the defaultPCR-GLOBWB. A recent study by van Beek et al. (2011) at-tributed partly the difference between PCR-GLOBWB simu-lated actual evaporation and ERA-40 reanalysis evaporationto the under representation of the irrigation areas in PCR-GLOBWB.
It appears that introducing an irrigation scheme in the hy-drological model has negligible effect in the actual evapo-ration results for the resolution of 0.5◦
× 0.5◦ used in thisstudy. Only in some regions with very large irrigation areas,marginally higher evaporation was observed. This is because
Hydrol. Earth Syst. Sci., 18, 193–212, 2014 www.hydrol-earth-syst-sci.net/18/193/2014/

P. Trambauer et al.: Comparison of different evaporation estimates over the African continent 207
Fig. 9.Mean annual soil moisture increments (in mm yr−1) in ERAIresulting from the soil moisture assimilation scheme.
the higher evaporations in the comparatively small irrigatedareas become insignificant when averaged over large regionscontaining large areas without irrigation. In a cell by cellarea, the difference in evaporation when irrigation is in-cluded is noticeable. Moreover, we observed considerabledifferences in the evaporation results when the same irri-gation scheme was introduced in a finer resolution model(0.05◦ × 0.05◦) for the Limpopo River basin.
Regarding ERAI and ERAL, it is interesting to notice alarge impact of the differences in the two model structureson evaporation estimates. As described in Sect. 2.1.6, ERAIhas an improved land-surface model, feedback with the at-mosphere (through direct coupling) and soil moisture assim-ilation. In ERAI the effect of data assimilation is mostly toadd soil moisture to the root zone, leading to increased evap-oration.
Interception plays an important role in evaporation, andthis may explain the generally lower values of MOD16 evap-oration than the other products in (semi-)arid areas duringthe wet season. By analysing intra-annual variability we ob-served that the difference between MOD16 potential evapo-ration and the other products is highest during the dry sea-son. MOD16 actual evaporation is generally higher than theEM during the dry season and lower during the wet seasoneven though the MOD16 potential evaporation is higher inboth seasons. This can be due to the representation of canopyintercepted evaporation. In MOD16, evaporation from thecanopy is restricted by relative humidity, if the relative hu-midity is less than 70 % no evaporation is considered frominterception (Mu et al., 2011).
4 Discussion and conclusions
Possibilities to validate a continental evaporation product forAfrica is still limited due to the inexistence of a continental-scale evaporation product based on ground measured data.In recent years there has been an increase in the amountof studies that focus on global evaporation estimates. Sev-eral new estimates were developed and validated with fluxtowers where available, mostly in North America and Eu-rope, and received some indirect validation (e.g. comparisonwith another product) in other regions of the world. More-over, some recent studies compare several of these estimatesat a global scale, largely coming from land-surface models.The main contribution of this paper is to present an evapora-tion analysis focused on the African continent which servesas an indirect validation of methods or tools used in oper-ational water resources assessments. Our analysis discrimi-nates areas where there is a good consistency between dif-ferent evaporation products and areas where they diverge. Italso provides a range of variance in actual evaporation thatcan be expected in a given region, which may be useful infor example water resources management when estimatingthe water balance. Africa strongly relies on agriculture andseveral regions are often hit by severe droughts; evaporationestimates are key for assisting water managers in the estima-tion of water needed for irrigation. This paper compares dif-ferent evaporation products for Africa and presents an ActualEvaporation Multiproduct at a 0.5◦ resolution. This EM thatintegrates satellite based products, evaporation results fromland-surface models and from hydrological models forcedwith different precipitation and potential evaporation datasets, may serve as a reference data set (benchmark).
In general ERAI and MOD16 do not show good agree-ment with other products in most part of Africa, while therest of the products are more consistent. ERAL is gener-ally quite close to the EM, and the higher values of evap-oration in ERAI when compared with ERAL are partly ex-plained by the analysis of soil moisture data assimilation inERAI. It also appears that in some regions like in south-ern Africa the agreement between the products is very good,which means that use of any of these products may be equallygood. In other regions, such as in humid Sahel or the Mediter-ranean the choice of a particular product needs to be furtherstudied as there is a larger difference between the products.These results are in agreement with the study of Vinukollu etal. (2011) who found that the evaporation products they com-pared are most uncertain in tropical and subtropical monsoonregions including the Sahel.
Products compared at a monthly timescale certainly resultin better outcomes than when the products are compared at adaily timescale. This study focused on the monthly and sea-sonal comparison, with daily comparisons considered to bebeyond the scope of this study. However, monthly standarddeviations of daily products differ from one product to theother and from one region to the other. A comparison of the
www.hydrol-earth-syst-sci.net/18/193/2014/ Hydrol. Earth Syst. Sci., 18, 193–212, 2014
208 P. Trambauer et al.: Comparison of different evaporation estimates over the African continent
monthly standard deviation of daily products (with the ex-ception of MOD16 that did not have daily estimates) con-sistently showed that in arid and hyper-arid areas (R2, R3,R4, R5, R12, R13, and R21) ERAL shows the highest stan-dard deviation, generally followed by ERAI and GLEAM.In these regions the mean values and variability of the stan-dard deviation of PCR-GLOBWB derived products seem tobe lower. In other regions, the standard deviations of all theproducts have roughly the same variability and mean values.Among the four PCR-GLOBWB derived products, the oneforced with Penman–Monteith (PCR_PM) showed slightlyhigher values of standard deviation than the other three prod-ucts. For every product and every region, a seasonality of thestandard deviation can be observed, with the highest standarddeviations during the wet seasons.
A potential action to improve this comparison study andthe EM is to validate the products in different African re-gions with ground data, where available. Moreover, otheravailable products could be added to the comparison and tothe EM calculation to have more information on the vari-ance between the products and a more consistent EM esti-mate. It is also recommended to compare the computed EMand the variability of the products with the global benchmarkrecently developed by Mueller et al. (2013). Similarly, in abasin-wide scale, long-term estimates of evaporation couldbe obtained from the water balance with an uncertainty esti-mate (Dingman, 1994).
Appendix A
Regional analysis
A1 Mediterranean region (R1 to R3)
This region is characterized by higher evaporation rates inthe months of March to May, after the end of the rainy sea-son (see Fig. 7). The evaporation peak is clear in the semi-arid region (R1), but becomes less noticeable in the arid re-gion (R2) as the evaporation rates become lower and almostdisappear in the hyper-arid areas (R3) where evaporationrates throughout the year are negligible. In the rainy seasonFig. 7 shows a clear offset between ERAI and ERAL withrespect to the other products, where the first two present con-siderably higher evaporation rates. In the dry season, whileERAL comes closer to the other products, the offset of ERAIis still evident. This offset of ERAI in the dry periods de-creases with increasing aridity, in contrast with the MOD16product, which shows higher evaporation rates than the re-maining data sets for arid areas (R2) in the dry period. Inthe Mediterranean region only the dry season of the semi-arid region (R1) presents quite a high variability betweenthe different seasons for every product (see Fig. A1). In theMediterranean region the consistency between the productsdecreases as aridity increases, and in hyper-arid Mediter-
ranean region (R3) all the products show very little consis-tency (see Fig. 8).
A2 Sahel (R4 to R8)
The Sahel region is characterized by an annual evaporationcycle with one peak during the rainy season, namely fromJuly to September (Sylla et al., 2010) (see Fig. 7). The evapo-ration rates become higher and the peaks become clearer withincreasing humidity. Figure 7 shows that only the MOD16product in the arid region (R5) and to a lesser extent in thesemi-arid region (R6) do not capture the annual evaporationcycle, presenting a relatively uniform evaporation throughoutthe year. This can also be seen in Fig. 8 (R5) where the verylow values of normalized standard deviation in MOD16 indi-cate that the amplitude of the annual cycle is underestimated.García et al. (2012) also found that MOD16 evapotranspira-tion product failed to capture the dynamics of evapotranspira-tion in the Sahelian savannah. Figure 7 shows that the lowestevaporation values are observed for PCR_TRMM during thedry season but it is not clear for the wet season. Regardingthe highest evaporation values, ERAI (and secondly ERAL)present these during the dry season, but a clear behaviourcannot be observed for the wet season. The semi-arid (R6),dry sub-humid (R7) and humid Sahel (R8) are the regionsthat present the largest variability in the inter-annual meancycles for each product and the higher dispersion betweenthe products in the dry seasons. Similarly to the Mediter-ranean region, the hyper-arid region (R4) in the Sahel showsthe least consistency between all the products. For the othersub-regions all the products have a higher consistency, (seefor example Fig. 8 (R8)). Figure 8 shows that in the Sahel re-gion ERAI product has a lower amplitude of the annual cyclethan the EM, whereas PCR_PM and PCR_TRMM present alarger amplitude of the annual cycle than the EM. All theproducts however are well in phase (high correlation).
A3 Guinean coast and north equatorial central Africa(R9 to R12)
This region is characterized by a bimodal precipitation cy-cle with unpronounced peaks and precipitation minima. Thisprecipitation pattern results in different evaporation cyclesdepending on the aridity of the region (see Fig. 7). For the hu-mid region (R9) all products show more or less uniform evap-oration over the year; however, respective values between theproducts are different. In regions R10 and R11, the majorityof the products follow roughly the same pattern, with slightlynoticeable peaks around May and October. MOD16 deviatesfrom this pattern, represents the amplitude fairly well in theannual cycle but remains out of phase (see Fig. 8). Figure 7shows that the peaks of the evaporation cycle become morepronounced when aridity increases. The arid area (R12) hasa clear bimodal evaporation cycle. For this region (R12) theGLEAM product presents the lowest values throughout the
Hydrol. Earth Syst. Sci., 18, 193–212, 2014 www.hydrol-earth-syst-sci.net/18/193/2014/
P. Trambauer et al.: Comparison of different evaporation estimates over the African continent 209
Fig. A1. Box plot diagrams of seasonal evaporation for each region.
www.hydrol-earth-syst-sci.net/18/193/2014/ Hydrol. Earth Syst. Sci., 18, 193–212, 2014
210 P. Trambauer et al.: Comparison of different evaporation estimates over the African continent
year. During the dry season ERAI present the highest val-ues; while during the wet season a clear behaviour cannot beobserved. Figure 8 suggests that most of the products havea good consistency in R11 with the exception of MOD16,while in R12 the products show less consistency.
A4 Horn of Africa (R13 and R14)
The Horn of Africa presents a bimodal evaporation cyclewith defined peaks at around May and November (see Fig. 7).For this region most products show little consistency. Thiscan be observed both in Figs. 7 and 8. In the arid Horn ofAfrica (R13) ERAI and ERAL present larger amplitude ofthe annual cycle than the EM, and MOD16 shows lower am-plitude of the annual cycle than the EM. In the semi-arid re-gion (R14), the amplitude of the annual cycle are now consis-tent between most products (normalized standard deviationclose to one), but the correlation coefficients are rather low(the time series are not correctly phased).
A5 Southern equatorial central Africa (R15 to R17)
This region presents an evaporation seasonal cycle with aminimum in June through October and a maximum in De-cember through April (see Fig. 7). The difference betweenthe evaporation values in the wet and in the dry season in-creases with aridity. The consistency between all productsseems to be quite better in the dry sub-humid region (R16)than in the humid region (R15). In R15 MOD16 and ERALseem to be fairly out of phase (low correlation values), andPCR_TRMM presents a larger amplitude of the annual cy-cle than the EM. Regarding the semi-arid region (R17), theabsolute amplitude of the annual cycle increases, and quite agood consistency is observed between all the products (seeFig. 8).
A6 Southern Africa (R18 to R21)
The southern Africa region show a pronounced seasonal cy-cle with a minimum in June through October and a maxi-mum in December through April (see Fig. 7). In the semi-arid (R18), humid (R19) and dry sub-humid (R20) regionsall the products present a good consistency. In the semi-arid(R18) and arid (R21) regions MOD16 presents a lower an-nual cycle amplitude that the EM, which is represented inFig. 8 (R18) by low normalized standard deviations. In thearid region (R21) all the products show less consistency.
Acknowledgements.This study was carried out as part of theDEWFORA Project (Improved Drought Early Warning and Fore-casting to strengthen preparedness and adaptation to droughts inAfrica) which is funded by the Seventh Framework Programme forResearch and Technological Development (FP7) of the EuropeanUnion (grant agreement no: 265454). Special acknowledgmentgoes to V. Thiemig from JRC for providing pre-processed TRMM
data for the African continent and to D. Miralles from the Uni-versity of Bristol for providing the global GLEAM data set. Theauthors would like to thank G. Balsamo for the suggestions thathelped to improve the manuscript.
Edited by: M. Vanclooster
References
Allen, R. G., Pereira, L., Raes, D., and Smith, M.: Crop evapotran-spiration – Guidelines for computing crop water requirements:FAO Irrigation and drainage paper No. 56, FAO, Rome, 26–40,1998.
Alton, P., Fisher, R., Los, S., and Williams, M.: Simulations ofglobal evapotranspiration using semiempirical and mechanis-tic schemes of plant hydrology, Global Biogeochem. Cy., 23,GB4023, doi:10.1029/2009GB003540, 2009.
Armstrong, R. L., Brodzik, M. J., Knowles, K., and Savoie, M.:Global monthly EASE-Grid snow water equivalent climatology,Boulder, CO: National Snow and Ice Data Center, Digital media,2007.
Balsamo, G., Beljaars, A., Scipal, K., Viterbo, P., van den Hurk,B., Hirschi, M., and Betts, A. K.: A Revised Hydrology for theECMWF Model: Verification from Field Site to Terrestrial Wa-ter Storage and Impact in the Integrated Forecast System, J. Hy-drometeorol., 10, 623–643, 2009.
Balsamo, G., Boussetta, S., Lopez, P., and Ferranti, L.: Evaluationof ERA-Interim and ERA-Interim-GPCP-rescaled precipitationover the USA, ECMWF ERA Report Series 5, 1–25, availableat: http://www.ecmwf.int/publications/library/do/references/list/782009, 2010.
Balsamo, G., Boussetta, S., Dutra, E., Beljaars, A., Viterbo, P.,and Hurk, B.: Evolution of land-surface processes in the IFS,ECMWF Newsletter 127, Spring 2011, 2011a.
Balsamo, G., Pappenberger, F., Dutra, E., Viterbo, P., and van denHurk, B.: A revised land hydrology in the ECMWF model: a steptowards daily water flux prediction in a fully closed water cycle,Hydrol. Process., 25, 1046–1054, 2011b.
Balsamo, G., Albergel, C., Beljaars, A., Boussetta, S., Brun, E.,Cloke, H. L., Dee, D., Dutra, E., Pappenberger, F., MunozSabater, J., Stockdale, T., and Vitart, F.: ERA-Interim/Land: Aglobal land-surface reanalysis based on ERA-Interim meteoro-logical forcing, ECMWF ERA Report Series, 13, 1–25, 2012.
Belo-Pereira, M., Dutra, E., and Viterbo, P.: Evaluation of globalprecipitation data sets over the Iberian Peninsula, J. Geophys.Res., 116, D20101, doi:10.1029/2010JD015481, 2011.
Boussetta, S., Balsamo, G., Beljaars, A., Kral, T., and Jarlan, L.: Im-pact of a satellite-derived leaf area index monthly climatology ina global numerical weather prediction model, Anglais, 34, 3520–3542, doi:10.1080/01431161.2012.716543, 2012.
CGIAR-CSI Global Aridity and PET Database: available at:http://www.cgiar-csi.org(last access: May 2012), 2010.
Cleugh, H. A., Leuning, R., Mu, Q., and Running, S. W.: Regionalevaporation estimates from flux tower and MODIS satellite data,Remote Sens. Environ., 106, 285–304, 2007.
Dee, D. P., Uppala, S. M., Simmons, A. J., Berrisford, P., Poli,P., Kobayashi, S., Andrae, U., Balmaseda, M. A., Balsamo, G.,Bauer, P., Bechtold, P., Beljaars, A. C. M., van de Berg, L., Bid-lot, J., Bormann, N., Delsol, C., Dragani, R., Fuentes, M., Geer,
Hydrol. Earth Syst. Sci., 18, 193–212, 2014 www.hydrol-earth-syst-sci.net/18/193/2014/
P. Trambauer et al.: Comparison of different evaporation estimates over the African continent 211
A. J., Haimberger, L., Healy, S. B., Hersbach, H., Hólm, E. V.,Isaksen, L., Kållberg, P., Köhler, M., Matricardi, M., McNally,A. P., Monge-Sanz, B. M., Morcrette, J. J., Park, B. K., Peubey,C., de Rosnay, P., Tavolato, C., Thépaut, J. N., and Vitart, F.: TheERA-Interim reanalysis: configuration and performance of thedata assimilation system, Q. J. Roy. Meteorol. Soc., 137, 553–597, doi:10.1002/qj.828, 2011.
Dingman, S. L.: Physical hydrology, Prentice Hall EnglewoodCliffs, NJ, 1994.
Douville, H., Viterbo, P., Mahfouf, J. F., and Beljaars, A. C. M.:Evaluation of the Optimum interpolation and nudging techniquesfor soil moisture analysis using FIFE data, Mon. Weather Rev.,128, 1733–1756, 2000.
Droogers, P. and Allen, R.: Estimating Reference Evapotranspira-tion Under Inaccurate Data Conditions, Irriga. Drain. Syst., 16,33–45, 2002.
Droogers, P., Immerzeel, W. W., Terink, W., Hoogeveen, J.,Bierkens, M. F. P., van Beek, L. P. H., and Debele, B.: Waterresources trends in Middle East and North Africa towards 2050,Hydrol. Earth Syst. Sci., 16, 3101–3114, doi:10.5194/hess-16-3101-2012, 2012.
Drusch, M., Scipal, K., de Rosnay, P., Balsamo, G., Anders-son, E., Bougeault, P., and Viterbo, P.: Exploitation of satel-lite data in the surface analysis. ECMWF Tech. Memo. No.576, available at:http://www.ecmwf.int/publications/library/do/references/show?id=88712, 2008.
EUMETSAT: The EUMETSAT Satellite Application Facility onLand Surface Analysis (LSA SAF) – Product User Manual,Evapotranspiration (ET), 2011.
FAO: Irrigation Potential in Africa: A Basin Approach, FAO-UN,Rome, 1997.
García, M., Sandholt, I., Ceccato, P., Mougin, E., Kergoat, L., andTimouk, F.: Estimating evaportranspiration in the Sahel using re-mote sensing products 30th AMS Conference on Agriculturaland Forest Meteorology, Boston, USA, 2012.
Ghilain, N., Arboleda, A., and Gellens-Meulenberghs, F.: Evapo-transpiration modelling at large scale using near-real time MSGSEVIRI derived data, Hydrol. Earth Syst. Sci., 15, 771–786, 10,http://www.hydrol-earth-syst-sci.net/15/771/10/.5194/hess-15-771-2011, 2011.
Hagemann, S., Botzet, M., Dümenil, L., and Machenhauer, B.:Derivation of global GCM boundary conditions from 1 km landuse satellite data, Max-Planck-Institut für Meteorologie, 1999.
Hargreaves, G. H. and Allen, R. G.: History and Evaluation of Har-greaves Evapotranspiration Equation, J. Irrig. Drain. Eng., 129,53–63, 2003.
Hijmans, R. J., Cameron, S. E., Parra, J. L., Jones, P. G., and Jarvis,A.: Very high resolution interpolated climate surfaces for globalland areas, Int. J. Climatol., 25, 1965–1978, 2005.
Huffman, G. J., Adler, R. F., Bolvin, D. T., and Gu, G.: Improvingthe global precipitation record: GPCP version 2.1, Geophys. Res.Lett, 36, L17808, doi:10.1029/2009GL040000, 2009.
Jacovides, C. P., Tymvios, F. S., Asimakopoulos, D. N., Theofilou,K. M., and Pashiardes, S.: Global photosynthetically active radia-tion and its relationship with global solar radiation in the EasternMediterranean basin, Theor. Appl. Climatol., 74, 227–233, 2003.
Jiménez, C., Prigent, C., Mueller, B., Seneviratne, S. I., McCabe,M. F., Wood, E. F., Rossow, W. B., Balsamo, G., Betts, A.K., Dirmeyer, P. A., Fisher, J. B., Jung, M., Kanamitsu, M.,
Reichle, R. H., Reichstein, M., Rodell, M., Sheffield, J., Tu,K., and Wang, K.: Global intercomparison of 12 land surfaceheat flux estimates, J. Geophys. Res.-Atmos., 116, D02102,10.1029/2010jd014545, 2011.
Keys, R.: Cubic convolution interpolation for digital image process-ing, Acoustics, Speech and Signal Processing, IEEE Trans., 29,1153–1160, 1981.
Kim, H. W., Hwang, K., Mu, Q., Lee, S. O., and Choi, M.: Valida-tion of MODIS 16 global terrestrial evapotranspiration productsin various climates and land cover types in Asia, KSCE J. CivilEng., 16, 229–238, 2012.
Kingston, D. G., Todd, M. C., Taylor, R. G., Thompson, J. R., andArnell, N. W.: Uncertainty in the estimation of potential evap-otranspiration under climate change, Geophys. Res. Lett., 36,L20403, doi:10.1029/2009GL040267, 2009.
Lau, K. M. and Wu, H. T.: Warm rain processes over tropicaloceans and climate implications, Geophys. Res. Lett., 30, 2290,doi:10.1029/2003GL018567, 2003.
Liu, Y., Yamaguchi, Y., and Ke, C.: Reducing the discrepancy be-tween ASTER and MODIS land surface temperature products,Sensors, 7, 3043–3057, 2007.
McClain, M.: Balancing Water Resources Development and En-vironmental Sustainability in Africa: A Review of RecentResearch Findings and Applications, Ambio, 42, 549–565,doi:10.1007/s13280-012-0359-1, 2012.
Miralles, D. G., Gash, J. H., Holmes, T. R. H., de Jeu, R.A. M., and Dolman, A. J.: Global canopy interception fromsatellite observations, J. Geophys. Res.-Atmos., 115, D16122,doi:10.1029/2009jd013530, 2010.
Miralles, D. G., De Jeu, R. A. M., Gash, J. H., Holmes, T. R. H., andDolman, A. J.: Magnitude and variability of land evaporation andits components at the global scale, Hydrol. Earth Syst. Sci., 15,967–981, doi:10.5194/hess-15-967-2011, 2011a.
Miralles, D. G., Holmes, T. R. H., De Jeu, R. A. M., Gash, J. H.,Meesters, A. G. C. A., and Dolman, A. J.: Global land-surfaceevaporation estimated from satellite-based observations, Hydrol.Earth Syst. Sci., 15, 453–469, doi:10.5194/hess-15-453-2011,2011b.
Miralles, D. G., van den Berg, M. J., Gash, J. H., Parinussa, R. M.,de Jeu, R. A. M., Beck, H. E., Holmes, T. R. H., Jiménez, C., Ver-hoest, N. E. C., Dorigo, W. A., Teuling, A. J., and Johannes Dol-man, A.: El Niño-La Niña cycle and recent trends in continen-tal evaporation, Nat. Clim. Change, doi:10.1038/nclimate2068,in press, 2013.
Mu, Q., Heinsch, F. A., Zhao, M., and Running, S. W.: Developmentof a global evapotranspiration algorithm based on MODIS andglobal meteorology data, Remote Sens. Environ., 111, 519–536,2007.
Mu, Q., Zhao, M., and Running, S. W.: Improvements to a MODISglobal terrestrial evapotranspiration algorithm, Remote Sens. En-viron., 115, 1781–1800, 2011.
Mueller, B., Seneviratne, S. I., Jimenez, C., Corti, T., Hirschi, M.,Balsamo, G., Ciais, P., Dirmeyer, P., Fisher, J. B., Guo, Z., Jung,M., Maignan, F., McCabe, M. F., Reichle, R., Reichstein, M.,Rodell, M., Sheffield, J., Teuling, A. J., Wang, K., Wood, E. F.,and Zhang, Y.: Evaluation of global observations-based evapo-transpiration datasets and IPCC AR4 simulations, Geophys. Res.Lett., 38, L06402, doi:10.1029/2010gl046230, 2011.
www.hydrol-earth-syst-sci.net/18/193/2014/ Hydrol. Earth Syst. Sci., 18, 193–212, 2014

212 P. Trambauer et al.: Comparison of different evaporation estimates over the African continent
Mueller, B., Hirschi, M., Jimenez, C., Ciais, P., Dirmeyer, P. A.,Dolman, A. J., Fisher, J. B., Jung, M., Ludwig, F., Maignan, F.,Miralles, D., McCabe, M. F., Reichstein, M., Sheffield, J., Wang,K. C., Wood, E. F., Zhang, Y., and Seneviratne, S. I.: Benchmarkproducts for land evapotranspiration: LandFlux-EVAL multi-dataset synthesis, Hydrol. Earth Syst. Sci. , 17, 3707–3720,doi:10.5194/hess-17-3707-2013, 2013.
Overgaard, J., Rosbjerg, D., and Butts, M. B.: Land-surface mod-elling in hydrological perspective – a review, Biogeosciences, 3,229–241, doi:10.5194/bg-3-229-2006, 2006.
Owe, M., de Jeu, R., and Holmes, T.: Multisensor historical clima-tology of satellite-derived global land surface moisture, J. Geo-phys. Res. Earth Surf., 113, F01002, doi:10.1029/2007JF000769,2008.
Portmann, F., Siebert, S., Bauer, C., and Döll, P.: Global data set895 of monthly growing areas of 26 irrigated crops, FrankfurtHydrology Paper 06, Institute of Physical Geography, Universityof Frankfurt, Frankfurt am Main, Germany, 2008.
Portmann, F. T., Siebert, S., and Döll, P.: MIRCA2000 – Globalmonthly irrigated and rainfed crop areas around the year2000: A new high-resolution data set for agricultural and hy-drological modeling, Global Biogeochem. Cy., 24, GB1011,doi:10.1029/2008GB003435, 2010.
Rossow, W. B. and Schiffer, R. A.: Advances in UnderstandingClouds from ISCCP, B. Am. Meteorol. Soc., 80, 2261–2287,1999.
Siebert, S., Döll, P., Feick, S., Hoogeveen, J., and Frenken, K.:Global Map of Irrigation Areas version 4.0.1, edited by: JohannWolfgang Goethe University, Frankfurt am Main, Germany/Foodand Agriculture Organization of the United Nations, Rome, Italy,2007.
Sperna Weiland, F. C., van Beek, L. P. H., Kwadijk, J. C. J., andBierkens, M. F. P.: On the Suitability of GCM Runoff Fields forRiver Discharge Modeling: A Case Study Using Model Outputfrom HadGEM2 and ECHAM5, J. Hydrometeorol., 13, 140–154,doi:10.1175/jhm-d-10-05011.1, 2011.
Sperna Weiland, F. C., Tisseuil, C., Dürr, H. H., Vrac, M., andvan Beek, L. P. H.: Selecting the optimal method to calculatedaily global reference potential evaporation from CFSR reanal-ysis data for application in a hydrological model study, Hydrol.Earth Syst. Sci., 16, 983–1000, doi:10.5194/hess-16-983-2012,2012.
Sylla, M. B., Coppola, E., Mariotti, L., Giorgi, F., Ruti, P.,Dell’Aquila, A., and Bi, X.: Multiyear simulation of the Africanclimate using a regional climate model (RegCM3) with the highresolution ERA-interim reanalysis, Clim. Dynam., 35, 231–247,2010.
Szczypta, C., Calvet, J.-C., Albergel, C., Balsamo, G., Boussetta,S., Carrer, D., Lafont, S., and Meurey, C.: Verification of the newECMWF ERA-Interim reanalysis over France, Hydrol. EarthSyst. Sci., 15, 647–666, doi:10.5194/hess-15-647-2011, 2011.
Teuling, A., Hirschi, M., Ohmura, A., Wild, M., Reichstein,M., Ciais, P., Buchmann, N., Ammann, C., Montagnani,L., and Richardson, A.: A regional perspective on trendsin continental evaporation, Geophys. Res. Lett, 36, L02404,doi:10.1029/2008GL036584, 2009.
Thiemig, V., Rojas, R., Zambrano-Bigiarini, M., Levizzani, V., andDe Roo, A.: Validation of Satellite-Based Precipitation Products
Over Sparsely-Gauged African River Basins, J. Hydrometeorol.,13, 1760–1783, doi:10.1175/JHM-D-12-032.1, 2012.
UNEP: World atlas of desertification 2ED, UNEP (United NationsEnvironment Programme) London, 1997.
USGS: MODIS Overview – Retrieved on April 2012, avail-able at: https://lpdaac.usgs.gov/products/modis_overview(lastaccess: April 2012), 2012.
van Beek, L. P. H. and Bierkens, M. F. P.: The Global Hydrologi-cal Model PCR-GLOBWB: Conceptualization, Parameterizationand Verification, Utrecht University, Faculty of Earth Sciences,Department of Physical Geography, Utrecht, tThe Netherlands,2009.
van Beek, L. P. H., Wada, Y., and Bierkens, M. F. P.: Global monthlywater stress: 1. Water balance and water availability, Water Re-sour. Res., 47, W07517, doi:10.1029/2010WR009791, 2011.
Van den Hurk, B., Viterbo, P., Beljaars, A. C. M., and Betts, A. K.:Offline validation of the ERA40 surface scheme, ECMWF Tech.Memo. 295, 1–42, 2000.
van der Ent, R. J., Savenije, H. H. G., Schaefli, B., andSteele-Dunne, S. C.: Origin and fate of atmospheric mois-ture over continents, Water Resour. Res., 46, W09525,doi:10.1029/2010WR009127, 2010.
Vinukollu, R. K., Meynadier, R., Sheffield, J., and Wood, E. F.:Multi-model, multi-sensor estimates of global evapotranspira-tion: climatology, uncertainties and trends, Hydrol. Process., 25,3993–4010, doi:10.1002/hyp.8393, 2011.
Wada, Y., van Beek, L. P. H., Viviroli, D., Dürr, H. H., Weingartner,R., and Bierkens, M. F. P.: Global monthly water stress: 2. Wa-ter demand and severity of water stress, Water Resour. Res., 47,W07518, doi:10.1029/2010wr009792, 2011.
Wang, N.-Y., Liu, C., Ferraro, R., Wolff, D., Zipser, E., and Kum-merow, C.: TRMM 2A12 Land Precipitation Product - Status andFuture Plans, J. Meteorol. Soc. Jpn. Ser. II, 87A, 237–253, 2009.
Wang, T. and Zlotnik, V. A.: A complementary relationship be-tween actual and potential evapotranspiration and soil effects, J.Hydrol., 456–457, 146–150, doi:10.1016/j.jhydrol.2012.03.034,2012.
Weiß, M. and Menzel, L.: A global comparison of four potentialevapotranspiration equations and their relevance to stream flowmodelling in semi-arid environments, Adv. Geosci., 18, 15–23,doi:10.5194/adgeo-18-15-2008, 2008.
Zhang, K., Kimball, J. S., Nemani, R. R., and Running, S. W.:A continuous satellite-derived global record of land surfaceevapotranspiration from 1983 to 2006, Water Resour. Res, 46,W09522, doi:10.1029/2009WR008800, 2010.
Zhao, M., Running, S. W., and Nemani, R. R.: Sensitivity of Mod-erate Resolution Imaging Spectroradiometer (MODIS) terrestrialprimary production to the accuracy of meteorological reanaly-ses, J. Geophys. Res., 111, G01002, doi:10.1029/2004jg000004,2006.
Zomer, R. J., Trabucco, A., Bossio, D. A., van Straaten, O., andVerchot, L. V.: Climate Change Mitigation: A Spatial Analysisof Global Land Suitability for Clean Development MechanismAfforestation and Reforestation, Agric. Ecosystems and Envir.,126, 67–80, 2008.
Hydrol. Earth Syst. Sci., 18, 193–212, 2014 www.hydrol-earth-syst-sci.net/18/193/2014/
Related Documents
![DROUGHT MONITOR [IHP-VIII] - UNESDOC Databaseunesdoc.unesco.org/images/0023/002319/231937e.pdf · DROUGHT MONITOR [IHP-VIII] International Hydrological Programme. THE CONTEXT Drought](https://static.cupdf.com/doc/110x72/5b99333609d3f26e678b70e8/drought-monitor-ihp-viii-unesdoc-drought-monitor-ihp-viii-international.jpg)


