Portland State University Portland State University PDXScholar PDXScholar Dissertations and Theses Dissertations and Theses 1990 A Comparison of an Acoustic Stethoscope and an A Comparison of an Acoustic Stethoscope and an Amplified Stethoscope in White Noise and Cafeteria Amplified Stethoscope in White Noise and Cafeteria Noise During Cardiac Auscultation Noise During Cardiac Auscultation Lynda Lynell Gigstad Portland State University Follow this and additional works at: https://pdxscholar.library.pdx.edu/open_access_etds Part of the Cardiovascular System Commons, and the Speech Pathology and Audiology Commons Let us know how access to this document benefits you. Recommended Citation Recommended Citation Gigstad, Lynda Lynell, "A Comparison of an Acoustic Stethoscope and an Amplified Stethoscope in White Noise and Cafeteria Noise During Cardiac Auscultation" (1990). Dissertations and Theses. Paper 3974. https://doi.org/10.15760/etd.5855 This Thesis is brought to you for free and open access. It has been accepted for inclusion in Dissertations and Theses by an authorized administrator of PDXScholar. Please contact us if we can make this document more accessible: [email protected].

Welcome message from author
This document is posted to help you gain knowledge. Please leave a comment to let me know what you think about it! Share it to your friends and learn new things together.
Transcript

Portland State University Portland State University
PDXScholar PDXScholar
Dissertations and Theses Dissertations and Theses
1990
A Comparison of an Acoustic Stethoscope and an A Comparison of an Acoustic Stethoscope and an
Amplified Stethoscope in White Noise and Cafeteria Amplified Stethoscope in White Noise and Cafeteria
Noise During Cardiac Auscultation Noise During Cardiac Auscultation
Lynda Lynell Gigstad Portland State University
Follow this and additional works at: https://pdxscholar.library.pdx.edu/open_access_etds
Part of the Cardiovascular System Commons, and the Speech Pathology and Audiology Commons
Let us know how access to this document benefits you.
Recommended Citation Recommended Citation Gigstad, Lynda Lynell, "A Comparison of an Acoustic Stethoscope and an Amplified Stethoscope in White Noise and Cafeteria Noise During Cardiac Auscultation" (1990). Dissertations and Theses. Paper 3974. https://doi.org/10.15760/etd.5855
This Thesis is brought to you for free and open access. It has been accepted for inclusion in Dissertations and Theses by an authorized administrator of PDXScholar. Please contact us if we can make this document more accessible: [email protected].

AN ABSTRACT OF THE THESIS OF Lynda Lynell Gigstad for the
Master of science in Speech Communication with emphasis in
Audiology presented August 23, 1990.
Title: A Comparison of an Acoustic Stethoscope and an
Amplified Stethoscope in White Noise and
Cafeteria Noise during Cardiac Auscultation.
APPROVED BY MEMBERS OF THE THESIS COMMITTEE:
T1?-S/mas D()lan":' P~ D.
Sheldon Maron, Ph.D.
A basic relationship between stethoscopic auscultation
and background noise interference was reviewed and examined
in this study. The principle experimental design of the
study questioned whether hospital background noise levels
are capable of masking the threshold of detection for
auscultated heart sounds. Several cited studies monitoring
" background noise levels in various hospital locations have
reported averages exceeding the U.S. Environmental
Protection Agency (EPA) (1974) and World Health Organization

2
(WHO) (1980) recommendations of "quiet", namely 35 to 40 dBA
(Falk & Woods, 1973; Hilton, 1985, 1987; Shapiro & Berland,
1972; Turner, et al., 1975; Woods & Falk, 1974) by as much
as 46 to 51 dB, i.e., up to 86 dBA (Shapiro & Berland 1972).
In addition to the previous query, a review of the
literature reflected a lack of implementatory standards
regarding the acoustic stethoscopic output and the masking
effects of noise during the auscultation process.
Specifically, this study ascertained the effective masking
level (EML) intensities of two noise environments, white
noise and cafeteria noise, for cardiac auscultation through
an acoustic stethoscope and an amplified stethoscope. Two
principle measurements were employed in the experimental
protocol: an objective measurement employing a method of
adjustment detection identification task of the EML, and
subjective responses solicited by a forced-choice
questionnaire. Sixteen normal hearing listener's were
selected to participate in the experiment. Objective
measures were analyzed using a MANOVA and a Pearson Product
Moment Coefficient of correlation. The subjective
questionnaire data were analyzed with a two-tailed
T-test. All analyses were based on a .05 level of
confidence.
The resultant analysis of the experimental protocol
data revealed calculated EML means greater than 92 dBA for
both of the stethoscopes and the noise environments. These

3
findings did not support the primary hypothesis which stated
that there would be a relatively low, 65 to 75 dBA, EML for
the two noise environments. Based on the these findings and
previous noise studies, most hospital settings appear to
provide a listening environment that will not completely
mask the detection threshold of cardiac sounds during
auscultation.
In addition, there were no significant differences
demonstrated for the stethoscopes or the noise environments.
This could be interpreted that the Sprague-Rapport LAB 600
acoustic stethoscope and the Bosch EST 40 amplified
stethoscope function equally well for the detection purposes
in high intensity, 90+ dBA, noise environments.
Subsequently, at these high levels, there appears to be no
discernable difference between the absolute masking effect
of white noise and cafeteria noise. The questionnaire data
results also found that there was no discernable difference
between the subjective performance of the stethoscopes.
Both stethoscopes were judged to perform equally well in the
areas of comfortable loudness, quality and clearness of
sound transmission, noise attenuation in both white noise
and cafeteria noise, and goodness of ear tip fit.

A COMPARISON OF
AN ACOUSTIC STETHOSCOPE AND AN AMPLIFIED STETHOSCOPE IN
WHITE NOISE AND CAFETERIA NOISE DURING CARDIAC AUSCULTATION
by
LYNDA LYNELL GIGSTAD
A thesis submitted in partial fulfillment of the requirements for the degree of
MASTER OF SCIENCE in
SPEECH COMMUNICATIO~ SPEECH AND HEARING SCIENCES
Portland State University 1990

TO THE OFFICE OF GRADUATE STUDIES:
The members of the Committee approve the thesis of
Lynda Lynell Gigstad presented August 23, 1990.
Th as Do 1 an';' Ph . D .
c.
Sheldon Maron, Ph.D.
APPROVED:
Theodore G. Grove, Chair, Department of Speech Communication
c. William Savery, Interim Vice and Research
for Graduate Studies

ACKNOWLEDGEMENTS
At this time, I wish to express my sincere gratitude
and appreciation to all of the individuals that shared their
time and expertise in order to support and assist in the
completion of my research project.
I would like to thank my committee members who guided
me throughout each thesis endeavor: Dr. James Maurer
(chair), Dr. Thomas Dolan and Dr. Sheldon Maron.
I wish to thank all of the attentive listeners that
participated in my study. In particular, John Fitzpatrick
who participated as my "heart beat" assistant, and Lois
Hagstrom who participated in my pilot study.
A special thanks to all of my resource specialists:
Jon Gigstad (Computer Consultant), Anna Mette Smeenk
(Experienced Auscultator), Gordon Frey (Electronic
Specialist), and Theodore Grove (Statistician).
Finally, a very special thankyou to my parents,
relatives, friends and colleagues. With their support and
encouragement, I finally accomplished this goal.

TABLE OF CONTENTS
ACKNOWLEDGEMENTS
LIST OF TABLES .
LIST OF FIGURES
CHAPTER
I
II
III
INTRODUCTION
REVIEW OF THE LITERATURE
Acoustic Stethoscope
Amplified Stethoscope .
Stethoscopic Research .
Human Hearing •
Heart Sounds
Background Noise
Clinical Background Noise .
Background Noise and Auscultation .
Statement of the Problem
METHODS .
Subjects
Instrumentation .
Calibration •
Procedures
PAGE
iii
vi
vii
1
10
11
13
15
17
20
21
22
23
26
28
28
30
32
32

IV
v
Data Measurement and Analysis
RESULTS AND DISCUSSION
Results .
Discussion
SUMMARY AND IMPLICATIONS
Summary
Implications
REFERENCES .
APPENDICES
A
B
STETHOSCOPIC QUESTIONNAIRE
INFORMED CONSENT
v
36
38
38
46
50
50
52
55
59
60

TABLE
I
II
LIST OF TABLES
Survey of Hospital Background Noise
Mean dBA Data Comparison for Stethoscopes
and Noise
III Multivariate Analysis of Variance (MANOVA)
A Comparison of Stethoscopes, Noise
PAGE
24
39
and Methods . . . . . . . . . . . . . 42
IV
v
VI
Pearson Product Moment Coefficient of
Correlation: (Pearson r)
Mean Data Results of Listener Judgements on
Stethoscopic Questionnaire
Dependent Two-Tailed T-Test Analysis of
Listener Judgements on a Stethoscopic
Questionnaire •
43
44
45

FIGURE
1.
2 •
3 •
4.
5 •
6.
LIST OF FIGURES
Three Weighting Scale Networks
Mean Output of Three Stethoscopes
Human Dynamic Range of Audition
Listener's Mean Thresholds of Audibility .
Schematic Representation of Equipment
Overhead View of Experimental Arrangement
7. Mean Effective Masking Levels for an Acoustic
Stethoscope and an Amplified Stethoscope in
PAGE
6
16
18
29
31
34
White Noise and Cafeteria Noise . . . . . . 40

CHAPTER I
INTRODUCTION
Cardiac sounds reflect heart functions. Since the
early 1800's, the awareness of heart sounds and their
possible diagnostic implications have been acknowledged.
Gradually over the centuries, heart sound monitoring via a
stethoscope has become a common practice. This monitoring
process is dependent on the listener's hearing acuity which
enables her to auditorily perceive the subtle diagnostically
significant differences between normal and aberrant heart
sounds. Unfortunately, this perception is also limited by a
minimal overlap between the frequency spectrum of the
cardiac sounds and the human range of audition. Any factor
that interferes with this perception process is detrimental.
A common interference during any listening task is the
background noise that competes with the desired signal.
Depending on the type and intensity of a noise and the
signal, the noise creates an adverse listening environment
by exerting a masking effect on the signal (Newby and
Popelka, 1985). In other words, the signal becomes less
audible and eventually inaudible within the background
noise. The effective masking level (EML) is the detection
level at which the acoustic signal has just become inaudible

within a measured level of noise. Any amount of masking
would seem to be detrimental to the cardiac auscultation
process because the noise may interfere with the perception
of critical elements of the heart sound. At present, the
2
intensities of the EMLs created by different types of noises
during cardiac auscultation are unknown. Further
investigation of the specific effects of noise on cardiac
auscultation are warranted due to the life threatening
circumstances and the general lack of knowledge in this
area.
Presently, stethoscopes are widely used in the medical
professions to monitor the sounds of internal organs of
patients in order to differentiate normal from abnormal
functions. The stethoscope was invented to augment sound
reception and facilitate the fundamental auscultation
process. The "direct" or "immediate auscultation" process
was previously accomplished by the applying the examiner's
ear directly to the patient's body (Chang, 1987). After the
initial innovation and subsequent modifications of the
stethoscope, there remain two basic types of stethoscopes
used in the monitoring of bodily sounds, namely the acoustic
stethoscope and the amplified stethoscope. The former has
received the most attention in research studies because it
was invented earlier and it is the most widely used
(Frederick & Dodge, 1924). To this date, there are no

calibration standards or specifications for the acoustic
properties of the entire stethoscope.
3
The acoustics delivered via a stethoscope have been
assessed both qualitatively and quantitatively by
implementing subjective and objective measures. The
subjective and objective evaluations have primarily assessed
the frequency and intensity characteristics of the
functional output of the stethoscope in experimental sound
treated environments (Ertel, Lawrence, Brown & Stern,
1966a,b; Frederick & Dodge, 1924; Kindig, Beeson, Campbell,
Andries & Tavel, 1982; McKusick, 1958; Rappaport & Sprague,
1941). The output of the stethoscope in sound pressure
level (SPL) is defined as the intensity provided by the
stethoscope during typical user conditions. In the case of
an acoustic stethoscope, the functional output is equivalent
to it's maximum output, since this device represents a
passive system with fixed amplification. Amplified
stethoscopes, on the other hand, permit intensity
adjustments to be made in accordance with the listener's
most comfortable listening level (MCL). The functional
outputs on these active systems are represented by
intensities measured at the MCL of the listener.
Stethoscopic research has also evaluated the
influences of external factors, such as background noise, on
the auscultation process (Groom, 1956, 1964). It is
inevitable that some degree of noise is delivered along with

the body sounds to the listener's ear via a stethoscope.
The primary component of noise in a stethoscope is the
leakage of ambient noise into the stethoscope proper due to
the coupling arrangement. The leakage of noise can occur
between the skin and the chest piece , the chest piece and
the tubing, the tubing and the ear tips, and above all, the
ear tips and the ear canals (Groom & Chapman, 1959;
Rappaport & Sprague, 1952). A second noise component,
distortion, is produced by the internal noise of the
amplifying structures of the stethoscope.
4
Studies evaluating the influence of background noise
tend to employ artificial noise in an attempt to control the
unique and variable nature of ambient noise (Groom, 1956,
19 64). Two commonly used types of artificial noise are
white noise and cafeteria noise. The former is the most
universally used type of noise in research (Miller, 1985)
As defined by Yost and Nielsen (1985) "white noise is a
noise for which the spectrum density is substantially
independent of frequency over a specified frequency range."
This frequency spectrum focuses on the human range of
audition that approximates 20 to 20,000 Hertz (Hz). In
contrast, cafeteria noise is essentially a tape recording of
the environmental noise within a cafeteria. The calibrated
cafeteria noise tape is derived from a spliced time segment
of a comprehensive tape recording. Intensity fluctuations
within the time segment are qualified within a decibel range

5
centered around the designated intensity level. The time
segment is then recorded on a continuous tape loop to
generate a controlled source of cafeteria noise. As related
to a medical facility, white noise is similar to the hum
generated by equipment, and cafeteria noise is comparable to
commotion and vocal noise created by people interacting
within their environment.
Background noise is measured in decibels with
reference to a frequency weighting scale network.
scales include dBA, dBB, and dBC in SPL (Figure 1)
The three
These
scales are designed to approximate human auditory responses
to pure tones (Melnick, 1985). The equal-loudness level
unit, the phon, denotes a 1000 Hz referent in dB SPL for
loudness comparisons between frequencies. The A-weighted
scale approximates human responsiveness for intensity levels
below 55 dB SPL (Melnick, 198S), and it represents the most
severe low frequency filtering of white noise below 500 Hz
by a contour of 40 phone (Miller, 198S; Peterson & Gross,
1967; Sheeley, 1978). The a-weighted scale approximates
intensities between SS to 8S dB SPL, and it moderately
filters white noise below 200 Hz by a contour of 70 phons
(Melnick, 1985). The C-weighted scale corresponds to
intensities above 85 dB SPL, and it minimally filters white
noise below SO Hz with a contour of 100 phons (Melnick,
1985). These scales provide a reference for estimating the
effect of noise on the human auditory system.

IQ "'V
I u>
"' 5 0.. Ill Ul cf I.&)
> I< .J
"" cc
+s I - A
~ I../" / .,,,,,..., -~ SANO
0
-f>
-io
7c / ,..
-H>
-20
-25
I -30 ., .
--:i
-l.O
--<5
-SD 20
I.I"
/
/P>
i/ I A
I I
50
Figure 1. scales dB frequency
/ .v
/
·---H>O ::1JX> 500 '~ 2K 5K. ,o~
f P.cQ\JENC:'(-H2
Three weighting scale networks. The A, dB B and dB C have standardized (Hz) and intensity (dB SPL) functions
used for sound measurement references. Derived from Council for Accreditation in occupational Hearing Conservation (p. 107) edited by M. H. Miller, 1985, New Jersey: Association Management Corporation. Copyright 1985 by CAOHC. Adapted by permission.
6

Studies investigating the effects of noise usually
involve the use of human subjects that are instructed to
perform a psychophysical identification or discrimination
task. The method of adjustment, is a common task employed
for the detection of threshold levels. This method allows
7
the subject to control the parameters of a variable stimulus
and compare it to another stimulus that remains constant
(Yost & Nielsen, 1985). This method was implemented in the
study by Groom (1956) to establish a threshold of audibility
during auscultation. The listener adjusted the volume of
the heart sound until he could just audibly detect the heart
sound in quiet, and later, in ambient noise (Groom, 1956).
The few studies that have researched the influence of
background noise during auscultation have agreed that
background noise levels can have an adverse masking effect
on the cardiac signal (Groom, 1956, 1964). The degree of
detriment is dependent on several internal and external
factors involving the listener (hearing acuity and
expertise), the signal (the different intensity and
frequency ranges), the stethoscope (the type and coupling
arrangement), and the environment (the type and intensity of
the background noise). All of these variables limit the use
reliability of the stethoscope in a medical setting where
auscultatory monitoring is imperative to diagnostic
decisions.

8
The lack of implementatory standards regarding the
acoustic output of stethoscopes and the masking effects of
noise have a direct impact on the auscultation process. The
primary function and use of the stethoscope is to enhance
normal or aberrant cardiac sounds during a preliminary
diagnosis or while monitoring a pre-existing condition. In
both circumstances, the sooner the aberrant heart condition
is detected, the better the treatment prognosis.
further investigation is warranted to disclose the
relationship between background noise and cardiac
auscultation.
Thus,
The primary purpose of this study was to evaluate the
interference created by competing background noises during
cardiac auscultation. In an attempt to control the multiple
variables and achieve some correspondence with real life
medical settings, two types or noise environments were
selected, white noise and cafeteria noise. Both noises were
recorded in the dBA scale for direct comparison with
background noise studies of medical setting. These two
noise environments were selected because they both provided
a constant noise source with controlled fluctuations. In
particular, white noise has a standardized uniform spectrum
of energy that encompasses all frequencies within the range
equally, and therefore the noise is easily replicated for
the present and future studies. Cafeteria noise was
selected because it provides a more realistic noise source.

9
However, it is less standardized and future replication may
be more variable. The primary objective was accomplished by
determining the intensity of the EMLs for equal intensities
of white noise and cafeteria noise during cardiac
auscultation.
Secondary objectives of the study intended to evaluate
any potential differences between the two types of
stethoscopes, and between the effects of the two noise
environments. Depending on the results, it might prove
advantageous to select a type of stethoscope based on the
listening environment in which it is to be used. In
addition, information about the subjective and objective
effects of the both noises may provide a basis for reducing
their potential effect. The secondary objectives were
accomplished by evaluating the following: 1. An examination
of the potential difference of noise masking levels between
2. An an acoustic stethoscope and an amplified stethoscope.
examination of the potential difference between the
effective masking level of the white noise and the cafeteria
noise. 3. An investigation of the listener's subjective
judgments regarding stethoscope performance in quiet, white
noise and cafeteria noise.

CHAPTER II
REVIEW OF THE LITERATURE
Dr. R.T.H. Laennec in 1816 was the first to document
the use of an apparatus to improve the auscultation
procedure during cardiac screening (Sakula, 1981).
Laennec's discovery was initially the use of several pieces
of paper rolled into a tube. This discovery inspired his
development of a hollow, wooden cylinder with a flared
funnel base. He named his invention the stethoscope, which
is a combination of two Greek words meaning chest and to
inspect.
Since the stethoscope's first public introduction in
1819, it has functioned to conduct internal body sounds at
the surface of the skin to the examiner's ears. Every
structural component along this conduction process
inherently changes the acoustic transmission of the sound.
As a result, many structural modifications and studies of
the instrument have been made over the years to improve
sound transmission. Eventually from these modification
studies evolved the two primary styles of stethoscopes that
are in use today; the acoustic stethoscope and the amplified
stethoscope.

11
ACOUSTIC STETHOSCOPE
The acoustic stethoscope is constructed of three basic
parts, the chest piece, the tubing and the ear tip. The
chest piece is in direct contact with the patient's skin,
and it funnels sound to the tubing. There are two chest
piece designs; the bell or Ford chest piece, and the
diaphragm or Bowles chest piece (Littmann, 1972).
Acoustically, the bell chest piece transmits less distortion
and it has a lower frequency response range then the
diaphragm chest piece (Littmann, 1972). Contrarily, the
diaphragm design has a greater diameter which enables it to
receive more stimulation then the bell chest piece, and the
diaphragm itself acts as a high-pass frequency filter
(Fredrick & Dodge, 1924; Littmann, 1972). According to
Kindig, et al. (1982) the two chest pieces differ in
functional output by approximately 2 dB SPL.
The tubing portion of the stethoscope conducts the
sound from the chest piece to the ear tip. There are two
variations of the tubing that affect the sound transmission.
The first variation includes a monaural or binaural tubing
design which acoustically influences the frequency and
intensity characteristics of the transmitted sound.
Objective measures demonstrate that a monaural stethoscope
has a predominant frequency range enhanced by 5 dB SPL
between 850 to 1000 Hz, while a binaural stethoscopic design

12
has a 20 dB SPL enhancement between 60 and 400 Hz (Rappaport
& Sprague, 1941). Subjective comparisons, on the other
hand, show no significant qualitative, e.g., clarity and
intelligibility of sound, or quantitative, e.g., improved
amplification, preference between the monaural and binaural
fittings (Kindig, et al., 1982). Thus, the tubing design
has a negligible affect on the acoustical properties for the
listener.
The second variation pertains to the tubing length
from yoke to chest piece. Studies investigating the affects
of tubing length on stimulus output have shown that
stethoscopes function more efficiently, in that they provide
more amplification and less pitch variation, with shorter
tubing length (Groom, 1964; Littmann, 1972; Rappaport &
Sprague, 1941). However, according to Littmann, 1972, the
difference created by the length of the tubing is
significant only between the extreme measurements that range
from 6 to 36 inches. Since the former length is too short
and the latter is too long for most purposes, a length of 20
inches has been arbitrarily accepted, as stated by Groom
(1964) as a "practical compromise."
The ear tip of the stethoscope fits into the outer
portion of the ear canal to deliver the sound waves directly
to the peripheral auditory system. The size of the ear tip
and it's fit affect the amount of sound leakage into and out
of the canal. Depending on the tubing design, monaural or

13
binaural, there are either one or two ear tips. Two ear
tips provide a bilateral occlusion effect which reduces the
listener's task of inhibiting environmental noises.
The amplification spectrum of an intact stethoscope as
derived from pure tone stimuli reveal near threshold
intensity values with prominent frequency peaks from 125 to
800 Hz (Ertel, et al., 1966a,b; Fredrick & Dodge, 1924;
Johnston & Kline, 1940; Kindig, et al., 1982). Complex
stimuli of normal taped and live heartbeats reveal lower
peaks from 50 to 125 Hz at approximately 0 to 5 dB SL above
threshold (Groom, 1956, 1964; Kindig, et al., 1982; Oliver,
1989). Thus, an acoustic stethoscope innately enhances the
low frequency characteristics of the auscultated stimuli.
AMPLIFIED STETHOSCOPE
In the early 1900's, an "electrical" or amplified
stethoscope was designed not for it's clinical application,
but for the educational ear-training of medical interns
(Fredrick & Dodge, 1924; Gamble & Repologle, 1924; Rappaport
& Sprague, 1941). Today, the amplified stethoscope is in
use clinically. The amplified stethoscope is an acoustic
stethoscope with hearing aid circuitry. In addition to the
three basic parts, the chest piece, tubing and ear tip; it
consists of a microphone, an amplifier, a receiver, a power
source and a volume control like a hearing aid. Basically,
the amplification process includes the following steps. The

14
microphone receives and converts the acoustic energy of the
sound into an electrical energy charge. The amplifier
receives and amplifies the electrical charge. The receiver
transduces the amplified electrical charge into acoustic
energy, and conducts the amplified sound into the tubing.
The fourth and fifth components, the power source and volume
control, provide the energy supply and allow variable
attenuation of the amplified output respectively.
In reference to the amplification delivered via an
amplified stethoscope, several manufacturer's specifications
report that the amplifier, not the intact instrument, can
supply 30 to 40 dB SPL signal gain at frequencies above 100
Hz (Oliver, 1989). No specifications included the
intensities levels below 100 Hz.
In the study by Oliver (1989), the frequency and
intensity spectrums of two amplified stethoscopes were
compared with an acoustic stethoscope in audiometric quiet
using real ear measurements. The frequency range of the two
amplified stethoscopes were found to basically parallel the
acoustic stethoscope's response to complex cardiovascular
sounds. The total range of frequencies ranged from 50 to
800 Hz with the primary resonant peak for all three
stethoscopes at 50 Hz. The intensity range for the two
amplified stethoscopes reflected frequency responses at 50
Hz ranging from -4 to 3 dB SPL to 19 dB SPL at varying peaks
above 50 Hz relative to the acoustic stethoscope results

15
(Figure 2). Overall, both amplified stethoscopes were found
to provide more gain above 50 Hz in quiet then the acoustic
stethoscope.
STETHOSCOPIC RESEARCH
Research has attempted to qualitatively and
quantitatively evaluate the functional output of the
stethoscope since it's invention in the early 1800's. Thus
far, there is no consensus on a standardized calibration
procedure, and there are no acoustic specifications required
for manufacturing a stethoscope.
Qualitative research on the functional output of the
stethoscope has utilized biologic listening tasks performed
by inexperienced and trained expert auscultators.
Psychoacoustic methodology has been used to evaluate various
subjective discriminatory parameters, e.g., clarity, pitch
and loudness, of the intact stethoscope. The subjective
nature of these personal preference evaluation techniques
demonstrated high variability with poor standardization
capabilities.
with caution.
However, trends are noted and generalized
Quantitative research of the functional output of the
stethoscope has consisted of two different methods, an
electroacoustical evaluation and real ear measurements. The
electroacoustic methodology is similar to the
electroacoustical evaluation of hearing aids. This method

,,..... ...I a. c.n ....., -I
-~--80 ·~
L.U 60 > UJ ...I
L.IJ
°' :'.;:) c.n (f) UJ ~ 0.. 0 z ~ 0 en
40
........... ......,...
20
Q-t--T-~r-------~-----------------------' 0 200 400 600 800 1000 1200
FREQUENCY (Hz) Figure 2. Mean output of three stethoscopes. The output of the acoustic Sprague-Rappaport LAB 600 [ -+ ], the amplified Bosch EST 40 [ -o-) and the amplified Starkey ST 3 [ -<>- ) are in dB SPL as a function of frequency. Input to the stethoscopes was normal heart sounds. Output was measured by a probe tube system in the subject's ears. The lower curve [ -rn- ] represent the mean threshold of audibility for the subjects. From "In situ Measurements of Two Amplified and One Acoustic Stethoscope" by s. R. A. Oliver, 1989, (Masters dissertation), p. 30. Reprinted by permission.
16

17
can monitor the intact stethoscope, but it is typically used
to evaluate the individual structural components of the
stethoscope separately, e.g. amplifier, chest piece, and
tubing. In general, the schematics incorporated the
elicitation of a pure tone stimulus which was directed
through the component to a receiver for analysis. The
objective nature of this technique lends itself to better
standardization than the qualitative research. However, the
pure tone stimulation is not representative of the complex
nature of body sounds.
Real ear measurement instrumentation allows a direct
acoustic evaluation of sound delivered to the listener's ear
canal. Although the customary use of real ear measurements
is to evaluate hearing aid responses in situ, its
application to the amplification via a stethoscope provides
an evaluation of body sounds in the ear canal of the
stethoscope user. This measurement provides a
frequency/intensity function analysis of complex sounds
during actual auscultation. This method of measurement was
implemented by Oliver (1989) to evaluate the frequency and
intensity responses of a stethoscope in quiet.
HUMAN HEARING
The human sensitivity curve for audition is stimulus
dependent on intensity as a function of frequency
(Figure 3) . Threshold levels are represented by one of the

18
watt/cm 2 Dynes/cm'
Threshold of Pain 10-1 2000 140 Threshold of Tickle 10·
3
~ Threshold of Discomfort 10·• 200 S2 120 10-s
w 1 o-6 z 20 >- 100 0 0 10-1
~ z z 10·1 2 0 80 0 0 10·Q 0 (f) if)
0 <( <( 10·10 0.2 ~ 60 [ MAP ~ 10-11
a: z ---- ... \ ·• :::> 10-12 0.02 ~ 40 - ... ,..
10-IJ
z \'· .. Audiometric Zero / 10
.,. 0.002 ....J 20 ','··· ... / •••••••• / 1o·IS
a_ ' ••·············· I 10·16 (f) ' -0.0002 0 ---..~ 10-11
' 1 o-u 0.00002 - 20 15.7 31.3 62.5 125 250 500 1 2 4 8 16 32
Hertz Kilohertz FREQUENCY
Figure 3 • Human dynamic range of audition. Represented here are three threshold and three suprathreshold curves. Threshold results were obtained in soundfield for the minimum audible field (MAF - solid line), under earphones for the minimum audible pressure (MAP - dashed line), and standardized by ANSI (1969) in the audiometric zero curve (dotted line). Suprathreshold curves of discomfort, tickle and pain are maximum sensation levels. Derived from Audiology, 5th Edition (p. 17) by H. A. Newby and G. R. Popelka, 1985, New Jersey: Prentice Hall Inc. Copyright 1985 by Prentice Hall Inc. Adapted by permission.

19
three customary measurements, minimum audible field (MAF),
minimum audible pressure (MAP) or audiometric zero.
measurements obtained in sound field and the MAP
The MAF
measurements acquired via ear phones most accurately reflect
the average young adult auditory sensitivity in ideal
testing conditions. These measurements attempt to encompass
the broad range of human frequency reception that spans from
20 to 20,000 Hz. The ANSI 1969 standards have adapted a
more conservative audiometric zero curve to provide a
standardized reference for audiometric evaluations within
the speech frequency from 100 to 8000 Hz. Below 100 Hz,
audiometric calibration is not standardized, and most
audiometers have a low frequency cut off at 125 or 250 Hz.
This lack of standardization limits human auditory threshold
comparisons with sounds that generate their primary
frequency and intensity peaks below 100 Hz, such as heart
sounds.
Humans also have a large dynamic range of intensity
reception. The evaluation of this receptive intensity range
begins with the detection threshold of sound, approximately
audiometric zero in dB HL, and terminates near the threshold
of pain, approximated at 140 dB SPL (Figure 3). Prior to
the threshold of pain, there are two other sensation levels,
the threshold of discomfort and the threshold of tickle. At
these supra-threshold levels, human auditory perception is
relatively equivalent for the frequency-intensity functions.

On the other hand, threshold and near threshold values are
very dependent on the frequency-intensity function that
20
allows human audition. Such that, the human auditory system
is the most insensitive to levels that occur specifically in
the lower frequency range below 500 Hz where more sound
pressure is needed to elicit a threshold value for normal
hearing listeners.
HEART SOUNDS
In terms of human perception, heartbeats created by
muscle contractions are very faint. Their perception
approximates the normal human threshold of detection (Groom,
1956, 1964; Williams & Dodge, 1926). According to Williams
and Dodge (1926) cardiovascular sounds have a limited low
frequency range between 5 and 660 Hz, and a primary resonant
peak around 50 to 60 Hz. The average MAF threshold of
audibility at 50 Hz is 43 dB SPL (Newby & Popelka, 1985),
while the real ear intensity of heartbeats at that frequency
ranges from 63 to 79 dB SPL depending on stethoscope type
(Oliver, 1989). Thus, the functional overlap between
heartbeat perception and human audition at 50 Hz has an
average intensity sensation level (SL) of 20 to 36 dB SL.
In the 1989 study by Oliver, the functional overlap ranged
from 0 to 20 dB SL for an acoustic stethoscope and 0 to 40
dB SL for an amplified stethoscope across the test frequency
range of 50 to 800 Hz (Figure 2). Consequently, the primary

21
sounds of the heartbeat, in relation to the threshold curve
at the same frequency region, are located in the least
sensitive frequency region of human audition.
BACKGROUND NOISE
Background noise is a type of noise that is generated
by a specific environment, a generally unwanted sound that
is usually complex and aperiodic in nature. As defined by
Sheeley (1978) masking noise is " .• a signal that interferes
with the detection or discrimination of another signal." In
general, as the noise level increases, the ability to
discriminate acoustic stimuli decreases until a maximum
saturation level is reached. The beginning point
of this saturation level is referred to as the effective
masking level (EML) during audiometric test procedures.
Specifically, the EML refers to the intensity level of the
noise when it "just masks" the intensity level of the
signal, and the signal becomes less audible (Sheeley, 1978)
The unpredictable nature of ambient noise makes it
difficult to measure. The general characteristic state of
noise has two broad descriptive categories: steady state
noise which is relatively continuous, and impulse noise
which is instantaneous. Extraneous noise is typically a
combination of both steady state and impulse noises. In
order to classify these two entities, noise levels are
represented by their median dB SPL of a referent weighting

22
scale, the frequency band width, and the intensity range.
The median dB SPL and the intensity range is derived from
sound level meter readings, while frequency fluctuations are
graphically recorded on a frequency analyzer. The high
points and low points of the intensity and frequency
fluctuations are noted throughout the frequency analyzer
recording, and a time weighted average of the noise source
is calculated for the designated period of time at that
specific location.
CLINICAL BACKGROUND NOISE
Clinical background noise refers to the noise level
within a particular clinical setting, and like most noises,
it is comprised of a variety of complex steady state and
impulse sounds of several intensity levels. The
Environmental Protection Agency (EPA, 1974) and the World
Health Organization (WHO, 1980) have recommended that
ambient noise levels within hospital settings be at or below
35 dBA at night and 40 dBA during the day time (Hilton,
1985). These guidelines were suggested in order to provide
an environment that is conducive for both monitoring
patients and their recovery.
The effects of noise interference are both
physiological and psychological. Several studies have
investigated the relationship between hospital noise and
subtle changes within the cardiovascular, endocrine and the

auditory systems, as well as increases in stress,
sleeplessness, fatigue and the perception of pain (Falk &
Woods, 1973; Hilton, 1985, 1987; Shapiro & Berland, 1972;
Turner, King & Craddock, 1975; Woods & Falk, 1974).
Patients in particular are more susceptible to the effects
of noise than healthy people because they have reduced
tolerance levels for sounds (Harris, 1979; Lipscomb, 1974)
In addition to noise levels increasing patient discomfort,
noise also degrades speech communication and any form of
acoustic monitoring, such as cardiac screening.
23
The majority of the research involving hospital
ambient noise levels tend to concentrate on the intensive or
acute care units, and the patient recovery rooms (Falk &
Woods, 1973; Hilton, 1985, 1987; Shapiro & Berland, 1972;
Turner, et al., 1975; Woods & Falk, 1974). The results
from several of these surveys, involving various hospital
environments, reveal dBA SPL means and ranges that
predominately exceed the EPA and WHO recommendations of 35
to 40 dBA (Table I). Noise awareness and reduction should
become common practice in all hospital settings according to
these recommendations.
BACKGROUND NOISE AND AUSCULTATION
The adverse effects of background noise on the
auscultation process has been investigated in studies by
Groom, (1956, 1964). In the first study, the intensity of

TABLE I
SURVEY OF HOSPITAL BACKGROUND NOISE
LOCATION dBA X
INTENSIVE (ACUTE) CARE UNITS ICU ICU small hospital ICU large hospital ACU ACU Medical-surgical ICU Coronary ICU
RECOVERY ROOMS RR RR Open-heart RR Pre-operative RR Post-operative RR
OPERATING ROOM
+SO
+6S -60
+SO -so -so
dBA RANGE
32.S - S7 34.2S - 62.S so so
4S 4S
SS
- 76 - 70
- 84 - 84
- 86
24
REFERENCE
Hilton 87 Hilton 8S Hilton 8S Woods 74 Falk 73 Turner 7S Turner 7S
Woods 74 Falk 73 Hilton 87 Hilton 87 Hilton 87
Shapiro 72
Note: A summary of hospital background noise level surveys recorded in various locations with findings reported in mean dBA or an average low to high dBA range.

25
tape-recorded heart sounds transmitted through an
"artificial precordium" was adjusted to the threshold of
audibility by experienced listeners in audiometric quiet and
in 65 dB of taped "artificial background noise". The
listener-adjusted stimulus intensity was greater for the
noisy environment. The second study by Groom (1964)
evaluated the efficiency of 33 stethoscopes in audiometric
quiet and in 65 dB of white noise. Using the same
procedures as above, " .• the threshold of stethoscopic
audibility" was measured. The results revealed poorer
thresholds of stimulus audibility for the noisy environment.
In summary, the two basic types of stethoscopes, the
acoustic stethoscope and the amplified stethoscope, both
conduct an augmented signal to the listener's ears.
However, the audition of the conducted sound is dependent
upon the detection and discrimination of the characteristic
frequencies and intensities of the stimulus by the listener.
The frequency and intensity ranges characteristic of
heartbeat sounds are detectable at the lower and most
inefficient region for human audition. This fragile link of
detection is further deteriorated by the masking potential
of background noise. Studies evaluating the noise levels in
several medical facilities have reported excessive levels of
noise in most locations. There are few studies available
that have specifically evaluated the adverse effects of
noise on cardiac screening via a stethoscope. Consequently,

26
the effects of noise on cardiac auscultation deserve further
investigation.
The present study is different from the previous
studies investigating the effects of noise on cardiac
auscultation in that: 1. The human heart sound used for
the stimulus was "live" rather than a tape recording
transmitted through a manufactured precordium as seen in
Groom's studies (1956, 1964). 2 • The experimental noise
levels were varied instead of being pre-set at a constant
level. 3. Inexperienced listeners were used in place of
experienced cardiac auscultators. 4. Only two
stethoscopes, one acoustic and one amplified, were used
throughout the experiment. The previous procedural
differences were aimed at providing new information
regarding stethoscopic function during cardiac auscultation
in competing background noise.
STATEMENT OF THE PROBLEM
This study primarily evaluated the sound pressure
levels of competing background noises, white noise and
cafeteria noise, that effectively masked heart sounds during
cardiac auscultation. The primary hypothesis stated that
there would be a relatively low, e.g., 65 to 75 dBA, EML of
both white noise and cafeteria noise that adversely effects
cardiac auscultation. This hypothesis was based on the
assumption that the competing background noises used within

the study were relatively representative of the average
noise ambience within most hospital settings. If the data
supported the primary hypothesis, then most hospital
settings that were reported earlier provide an adverse
listening condition for cardiac auscultation, and
appropriate measures should be taken to improve the S/N
within the environment and/or the stethoscopic instrument
27
employed. If the data do not reflect this hypothesis, then
most hospital settings appear to provide an adequate
environment for cardiac auscultation, at least for normal
hearers.
This study addressed the following questions: 1.
what sound pressure level does white noise mask cardiac
sounds during auscultation? 2. At what sound pressure
level does cafeteria noise mask cardiac sounds during
auscultation? 3. Is there a significant difference in
effective masking levels (EML) between white noise and
cafeteria noise during cardiac auscultation?
At
4. Is there a significant difference in EML levels during
auscultation through an acoustic stethoscope and an
amplified stethoscope set at MCL? 5. Is there a
significant difference between the subjective performance
judgments of the two stethoscopes, the acoustic stethoscope
and the amplified stethoscope, during cardiac auscultation
in quiet and in noise?

CHAPTER III
METHODS
The foregoing review of the literature suggested that
competing background noise provides an adverse listening
environment for cardiac auscultation. In the present study,
the relationship between two noise types, white noise and
cafeteria noise, and the audibility of the heart sounds
through two stethoscopes, an acoustic stethoscope and an
amplified stethoscope, was quantified and qualified
respectively by objective and subjective measures.
Objective measurements involved an effective masking level
(EML) identification task; and subjective results were
answers to a written questionnaire. An analysis and
comparison of the data from both measures were used to
address the experimental questions.
SUBJECTS
The stethoscope listeners consisted of 16 females with
normal hearing, who ranged from 16 to 38 years of age.
Normal hearing was defined bilaterally as 15 dB HL or lower
at the ANSI test frequencies from 125 to 4000 Hz (Figure 4).
The measurement of auditory thresholds below 125 Hz was not
possible due to the output limitations of the audiometer.

A U D I 0 G R A M
F R E Q U E N C Y in H E R T Z
125 250 500 1000 2000 H
E i A n 15 R
I D* 10 N E
G c 5
T f t r
f L+ l-t: ~ ~I () I I I
I
L B 0 1 4 x 0 '
() ()
E E x x v L -5 E s L -10 -
* dB reference is to .0002 dynes/cm 2 .
Figure 4. Listener's mean thresholds of audibility. The audiogram displays the threshold means for the listener's right ears [O) and left ears [X] across the test frequency range of 125 to 4000 Hz. The vertical lines represent the threshold response range.
29
4000
ff LJ I I
I I
I) I x

It was assumed that the listeners had normal auditory
thresholds below 125 Hz if they passed the above screening
30
criteria. The experienced auscultator also exhibited normal
hearing sensitivity as previously defined. An adult healthy
male assistant, age 40, was pre-examined by an experienced
medical cardiac auscultator and later provided the normal
heartbeat signal in the experiment.
INSTRUMENTATION
The experimental protocol required an acoustic
stethoscope, amplified stethoscope, pure tone audiometer,
variable attenuator, phase linear amplifier, tape recorder,
sound level meter, volt meter and a sound field chamber.
The Sprague-Rappaport LAB 600 acoustic stethoscope and the
Bosch EST 40 amplified stethoscope were the stethoscopes
evaluated. Both stethoscopes provided a constant volume
presentation. The adjustable volume control on the
amplified stethoscope was at a fixed setting throughout the
experiment. This volume was set by the experienced
auscultator at her most comfortable listening level for the
heart sound in audiometric quiet.
The white noise source used in sound field testing was
generated by a Beltone 2000 clinical audiometer through a
Leader LAT-45 attenuator which was controlled by the subject
by means of an attenuator dial (Figure 5). Output of the
attenuator was fed to a Crown D-75 amplifier. The output of

SIGNAL SOURCE
Figure 5. equipment.
CALIBRATED ATTENUATOR
POWER AMPLIFIER
Schematic representation of The noise was elicited at the
SPEAKER
audiometer, adjusted at the attenuator, augmented at the amplifier and finally presented via the loud speaker into the acoustic chamber. Wiring connections through the chamber wall are designated by the [ ~>- ] symbol.
31

33
inches from vertex to the loudspeaker, and at 180 degree
azimuth (Figure 6). At this fixed sitting position from the
loudspeaker, a constant field of noise was measured with the
sound level meter, and no difference was noted in the dB SPL
readings at either ear or the vertex of the model's head.
The assistant was seated off to the right side of the
listener, and out of the direct line of the speaker. Based
on the sound level meter readings, this arrangement provided
a constant S/N for each subject, and eliminated any body
baffle or sound reflection effect by the assistant.
The assistant's chest was marked for consistent chest
piece location throughout the experiment. The mark was
situated at the apical position of the heart. The chest
piece of the stethoscope was aligned and hand held by the
assistant on his chest at the designated mark with
appropriate pressure applied in accordance with clinical
recommendations from the experienced auscultator.
Each listener read the following written instructions
that explained the experimental task:
1. Familiarize yourself with the heart beat sound in quiet by listening to it for a few minutes. Listen for both beats of the heart, e.g., the "lub-dub."
2. When you are ready, this control box dial allows you to either increase or decrease the noise level from the loudspeaker.
3. Your purpose during the first few trials is to increase the noise level by turning the dial clock-wise until the heart sound is inaudible, and then raise your hand.

SPEAKER
ASSISTANT
SUBJECT
Figure 6. Overhead view of experimental arrangement. The subject, assistant and equipment were arranged within an acoustic chamber. The dashed line represents a measured distance of 21 and one-forth inches between the subject's vertex and the loud speaker. This distance provided a constant field of noise presentation to both ears.
34

4. Your purpose during the second few trials is to decrease the noise by turning the dial counter-clock-wise until the heart sound is just audible, and then raise your hand. Do not increase and decrease the noise in the same trial.
5. During each trial, look straight ahead at the designated point on the wall.
6. Do you have any questions about the instructions?
35
The listener's task was to adjust the level of the noise to
a value which just masked the cardiac sound. This level was
termed the "effective masking level" or EML. Stated
differently, the EML occurred when the listener signaled
that the cardiovascular sounds were completely masked by the
noise. The EML was determined by means of the method of
adjustment. The detection identification task incorporated
ascending and descending trials in the two different ambient
noises. The attenuator dial allowed the listener to
increase or decrease either noise level in increments of one
dB HL. During an ascending trial, the listener increased
the noise level until the heart sounds became inaudible. On
the descending trial, the listener decreased the noise level
until the heart sounds were just audibly detected. The
purpose of these two trial methods, ascending and
descending, was to establish an unbiased mean effective
masking level of the heart sounds for each stethoscope in
both of the noise environments.

DATA MEASUREMENT AND ANALYSIS
The order of the two stethoscopes, the two noise
environments, and the ascending and descending trials were
counterbalanced to avoid any order bias. To reduce the
36
possibility of any association bias with the stethoscopic
names, the acoustic stethoscope and the amplified
stethoscope were respectively labeled as stethoscope "A" and
II B". Each stethoscope was evaluated in the two noise
environments by recording both the attenuation value from
the attenuator dial and the audiometer setting for four
ascending and four descending trials. Prior to each trial,
the audiometer setting was selected in accordance with a
random numbers table (Mendenhall, 1979). The calculated dB
SPL of the noise in sound field was derived from the three
recorded values on the attenuator, tqe audiometer, and the
calibrated sound level meter readings. The initial trial of
each ascending and descending identification task was used
for task familiarization only. The remaining three trials
were used to establish mean effective masking levels, 95
percent confidence intervals, and to check the intra-rater
reliability.
Subjective and qualitative data were obtained through
the administration of a scaled forced-choice questionnaire.
The listener's judgments of stethoscopic performance
pertained to the comfort of the loudness listening level,

37
the quality and clearness of sound, the goodness of ear tip
fit, the effectiveness of ear tip noise attenuation, and her
overall impression of the instrument (Appendix 1). The
listener ranked each stethoscope on a five point scale from
very poor to excellent in the three listening environments:
quiet, white noise and cafeteria noise. The questionnaire
was initially read by the listener and clarified by the
experimenter along with the written instructions. It was
then filled out after the completion of each stethoscopic
analysis. The data provided arithmetic means for
statistical analysis.

CHAPTER IV
RESULTS AND DISCUSSION
This two-part study examined the objective and
subjective effects of background noise during cardiac
auscultation. Two stethoscopes, an acoustic stethoscope and
an amplified stethoscope, were evaluated in two noise
environments, white noise and cafeteria noise, through an
effective masking level (EML) detection identification task
and a qualitative questionnaire. Data from both the
objective and subjective measures were used to address the
experimental questions.
RESULTS
The EML means and standard deviations in dBA of the
combined ascending and descending methods for each
stethoscope within both noise environments are as seen in
Table II. The mean EMLs and the 95 percent confidence
intervals for each objective trial series are seen in Figure
7. The significance of these data were analyzed using a
Multivariate Analysis of Variance (MANOVA) with an alpha
level of .OS. Relationships were computed for main effects,
first order interactions and second order interactions
between the two stethoscopes, the two noise environments and

39
TABLE II
MEAN dBA DATA COMPARISON FOR STETHOSCOPES AND NOISE
ACOUSTIC STETHOSCOPE
AMPLIFIED STETHOSCOPE
WHITE NOISE 95.6355 dBA (4.7545)
94.3910 dBA (4.5960)
CAFETERIA NOISE 92.1045 dBA (8.7285)
93.0625 dBA (10.2960)
Note: The effective masking level (EML) means in dBA and standard deviations in parentheses of the combined ascending and descending trials for the acoustic stethoscope and the amplified stethoscope in white noise and cafeteria noise.

~BA 00 99 98 97 96 95 94 93 92 91 90 89 88 87 86 85 84 83 82 81 80
40
S T E T H 0 S C 0 P E S:
A C 0 U s T I c A M p L I F I E D
WHITE CAFETERIA WHITE CAFETERIA NOISE NOISE NOISE
l ! I I I I l 0
I I l * l
l r
Figure 7. Mean effective masking levels for an acoustic stethoscope and an amplified stethoscope in white noise and cafeteria noise. The ascending trial means are represented by an [*] and the descending trial means by a [o]. The vertical lines display the 95 percent confidence intervals.
NOISE
¢

the two trial methods. The only significant difference of
the F statistic was found between the ascending and
descending methods for the identification task with a .049
41
level of significance. All other values were insignificant
at the .OS level as seen in Table III.
Listener intra-reliability was analyzed by using the
Pearson Product Moment Coefficient of Correlation (Pearson
r) for each trial set (Table IV). The repeated measure
correlation was good, greater than .5, for all data with one
exception. The condition for the amplified stethoscope in
white noise with an ascending identification task for trial
comparison (3 - 4) displayed a low .2225 Pearson r
correlation.
The questionnaire data were analyzed using a dependent
two-tailed T-test analysis. Although the amplified
stethoscope received higher performance ratings in all of
the listener judgement categories then the acoustic
stethoscope (Table V), this trend was not supported by the
T-test analysis. As seen in Table VI, all T-score values
fell within the table values of -1.96 and 1.96 (Mendenhall,
1979). Thus, all T-scores failed to demonstrate a
significant difference between the stethoscope ratings at a
5 percent level of confidence.
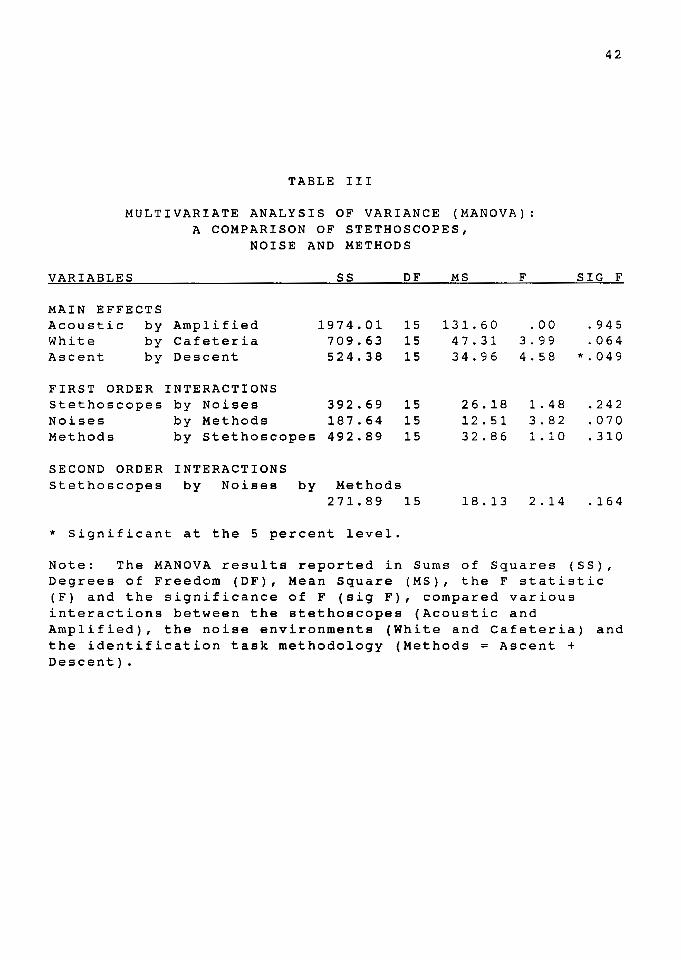
TABLE III
MULTIVARIATE ANALYSIS OF VARIANCE (MANOVA):
VARIABLES
MAIN EFFECTS Acoustic by White by Ascent by
A COMPARISON OF STETHOSCOPES, NOISE AND METHODS
SS DF MS
Amplified 1974.01 15 131.60 Cafeteria 709.63 15 47.31 Descent 524.38 15 34.96
FIRST ORDER INTERACTIONS Stethoscopes by Noises 392.69 15 26.18 Noises by Methods 187.64 15 12. 51 Methods by stethoscopes 492.89 15 32.86
SECOND ORDER INTERACTIONS Stethoscopes by Noises by Methods
271.89 15 18.13
* Significant at the 5 percent level.
F
.DO 3. 9 9 4. 58
1. 48 3.82 1. 10
2.14
42
SIG F
. 9 4 5
.064 *.049
.242
.070
.310
.164
Note: The MANOVA results reported in Sums of Squares (SS), Degrees of Freedom (DF), Mean Square (MS), the F statistic (F) and the significance of F (sig F), compared various interactions between the stethoscopes (Acoustic and Amplified), the noise environments (White and Cafeteria) and the identification task methodology (Methods = Ascent + Descent).

TABLE IV
PEARSON PRODUCT MOMENT COEFFICIENT OF CORRELATION: (PEARSON r)
ACOUSTIC STETHOSCOPE PEARSON r
WHITE NOISE TRIAL # ASCENT DESCENT
2 - 3 3 - 4 4 - 2
.7424 .9028
.8118 .9142 = .8186
CAFETERIA NOISE 2 - 3 = .7314 3 - 4 4 - 2
.8697
.6720
AMPLIFIED STETHOSCOPE
WHITE NOISE
2 - 3 3 - 4
4 - 2
=
TRIAL l
.5764
.2225
.5046 CAFETERIA NOISE 2 - 3 = .8183 3 - 4
4 - 2 = =
.8335
.7422
.8338
.8222
.7998
.8305
.9529
.9174
.9329
.8764
.9257
.9322
PEARSON r ASCENT DESCENT
43
Note: The Pearson Product Moment Coeffiecient of correlation (Pearson r) data collected for listener intrareliability analysis of three trials (2,3,4) while using an acoustic stethoscope and an amplified stethoscope in white noise and cafeteria noise with both ascending and descending identification tasks.

TABLE V
MEAN DATA RESULTS OF LISTENER JUDGEMENTS ON STETHOSCOPIC QUESTIONNAIRE
SCALED LISTENER JUDGEMENTS QUIET
COMFORTABLE LOUDNESS LISTENING LEVEL Acoustic 3.88
Amplified ( 1. 02) 4.33
(l.08) QUALITY AND CLEARNESS OF SOUND
Acoustic 3.72
Amplified
GOODNESS OF EAR TIP FIT Acoustic
Amplified
EAR TIP NOISE ATTENUATION Acoustic
Amplified
(1.07) 4.77
( 0. 42)
2.50 ( 0. 92) 2.83
(l.54)
3.66 ( 0. 84) 4.16
( 1. 04) OVERALL IMPRESSION OF THE INSTRUMENT
Acoustic 3.44
Amplified ( 0. 98) 4.22
( 0. 94)
WHITE NOISE
3.17 (0.88) 3.82
(0.80)
2.88 ( 0 . 6 9 l 3.82
( 0. 88)
3. 1 7 (0.72) 3.47
(l.00)
2.88 (0.60) 3.70
( 0. 98)
44
CAFETERIA NOISE
2.66 (1.02) 2. 94
( 0 . 9 3 )
2 . 5 0
( 0 . 7 0 l 3.00
( 0. 90)
2. 88 ( 0 . 9 0 l
3 . 1 1 (1.02)
2. 7 6
' 0 . 7 5 l 3.27
(1.12)
Note: The means and standard deviations in parentheses of the raw data collection acquired from a stethscopic questionnaire evaluating the performance of the acoustic stethoscope and the amplified stethoscope in three listening environments, quiet, white noise and cafeteria noise.

45
TABLE VI
DEPENDENT TWO-TAILED T-TEST ANALYSIS OF LISTENER JUDGEMENTS ON A STETHOSCOPIC QUESTIONNAIRE
SCALED LISTENER WHITE CAFETERIA JUDGEMENTS QUIET NOISE NOISE
Comfortable Loudness Listening Level -0.30 -0.51 -0.27
Quality and Clearness of Sound -0.71 -0.78 -0.51
Goodness of Ear Tip Fit -0.33
Noise Attenuation -0.36 -0.24 -0.20
Overall Impression of Instrumentation -0.57 -0.69 -0.46
Note: The T-score results that compared an acoustic stethoscope and an amplified stethoscope in three listening environments: quiet, white noise and cafeteria noise. Values within the table values of -1.96 and 1.96 are not significant at the 5 percent level (Mendenhall, 1979).

46
DISCUSSION
The primary objective of this study was to determine
the EMLs for white noise and cafeteria noise during cardiac
auscultation through two stethoscopes, an acoustic and
anamplified. The most prominent result of the study
revealed high EML means that ranged from 92 to 95 dBA for
These both noise environments during cardiac auscultation.
arithmetic means reflect the total noise level at the
external ear which surpassed the ear tip attenuation to
completely mask the heart sounds. The bilateral ear tip
attenuation was measured in sound field in accordance with
ANSI S12.6-1984 standard methodology by determining the
thresholds of audibility for white noise and cafeteria
noise, and then by subtracting the unoccluded values from
the occluded values. The mean attenuation value of 8 dB HL
for both noise environments and both stethoscopes was
established.
The hospital noise study by Shapiro and Berland (1972)
reported noise levels ranging from 55 to 86 dBA. A
comparison of these hospital noise levels and the EML means,
92 to 95 dBA, show that there is a discrepancy between the
two measured noise levels that range from 6 to 40 decibels.
In affect, any noise exposure below the 86 dBA provides a
negligible probability that the environmental noise will
completely mask the auscultated heart sounds. However, at

47
the extremes with 86 dBA background noise exposure and poor
ear tip attenuation, there is a potential for the cardiac
sounds to be effectively masked during auscultation.
Moreover, it should be made clear that this was a detection
task, and the effects of background noise on intelligibility
of the heart sound signal was not encompassed in this study.
This is an important point particularly in view of the
probable noise interference effects on diagnostic
auscultation.
The Secondary objectives examined any potential EML
differences between the acoustic stethoscope and the
amplified stethoscope, and between the white noise and the
cafeteria noise. These comparisons between the stethoscopes
and the noise environments displayed results that were not
significant at the .OS level. This would suggest that both
stethoscopes were equally effective, and that both noise
environments have equivalent masking capabilities at these
high intensity levels.
Thirdly, the results from the subjective questionnaire
data supported the objective results that there was no
differentiation noted between either stethoscope in the two
noise environments. Therefore, it appears that both
stethoscopes perform equally well in the areas of
comfortable loudness, quality and clearness of sound
transmission, noise attenuation in both white noise and
cafeteria noise, and goodness of ear tip fit.

With the exception of one trial condition, the
listener intra-reliability was very good, above a .SO
Pearson r coefficient. This suggests that the
48
identification task was an absolute and stable measurement.
In addition, the significance noted between the ascending
and descending trials can also be considered as an after
the-f act reliability check in that this significance was
expected based on the psychophysical nature of the two
methods (Green & Swets, 1974; Egan & Clarke, 1966).
The reason for the inordinately low correlation, .2225
Pearson r, of the amplified stethoscope during the ascending
trials 3 and 4 in white noise can not be accounted for. Due
to the randomized nature of the task presentation, no single
factor should have exhibited an influence on one condition
without affecting the other conditions. Based on the
relatively high Pearson r correlations, none of the other
conditions were affected. The possible internal
contaminating influences associated with the listener:
attention, fatigue, and motivation, and external influential
factors such as changes in ear tip fit which effect both
noise attenuation and comfort, or changes in the loudness of
other internal auscultated body sounds, were in affect
counter-balanced for all conditions by the random
presentation order. Thus, these internal and external
influences can not assume the responsibility for generating
the resultant correlation discrepancy.

49
In conclusion, background noise levels of appropriate
intensity will eventually and completely mask out the
detection of heart sounds. The results from this study have
quantitatively supported this observation for two noise
environments during cardiac auscultation via two types of
stethoscopes. At present, these EMLs appear to be higher
then the average ambient noise levels in hospital settings.
However, this finding does not eliminate the probability
that noise interference is affecting the intelligibility of
the heart sounds at lower intensity levels, those below the
EMLs, during the auscultation process.

CHAPTER V
SUMMARY AND IMPLICATIONS
SUMMARY
A basic relationship between stethoscopic auscultation
and background noise interference was reviewed and examined
in this study. The principle experimental design of the
study questioned whether hospital background noise levels
are capable of masking the threshold of detection for
auscultated heart sounds. Several cited studies monitoring
background noise levels in various hospital locations have
reported averages exceeding the U.S. Environmental
Protection Agency (EPA) (1974) and World Health Organization
(WHO) (1980) recommendations of "quiet", namely 35 to 40 dBA
(Falk & Woods, 1973; Hilton, 1985, 1987; Shapiro & Berland,
1972; Turner, et al., 1975; Woods & Falk, 1974) by as much
as 46 to 51 dB, i.e., up to 86 dBA (Shapiro & Berland 1972).
In addition to the previous query, a review of the
literature reflected a lack of implementatory standards
regarding the acoustic stethoscopic output and the masking
effects of noise during the auscultation process.
Specifically, this study ascertained the effective masking
level (EML) intensities of two noise environments, white

51
noise and cafeteria noise, for cardiac auscultation through
an acoustic stethoscope and an amplified stethoscope. Two
principle measurements were employed in the experimental
protocol: an objective measurement employing a method of
adjustment detection identification task of the EML, and
subjective responses solicited by a forced-choice
questionnaire. Sixteen normal hearing listener's were
selected to participate in the experiment. Objective
measures were analyzed using a MANOVA and a Pearson Product
Moment Coefficient of Correlation. The subjective
questionnaire data were analyzed with a two-tailed
T-test. All analyses were based on a .OS level of
confidence.
The resultant analysis of the experimental protocol
data revealed calculated EML means greater than 92 dBA for
both of the stethoscopes and the noise environments. These
findings did not support the primary hypothesis which stated
that there would be a relatively low, 65 to 75 dBA, EML for
the two noise environments. Based on the these findings and
previous noise studies, most hospital settings appear to
provide a listening environment that will not completely
mask the detection threshold of cardiac sounds during
auscultation.
In addition, there were no significant differences
demonstrated for the stethoscopes or the noise environments.
This could be interpreted that the Sprague-Rapport LAB 600

52
acoustic stethoscope and the Bosch EST 40 amplified
stethoscope function equally well for the detection purposes
in high intensity, 90+ dBA, noise environments.
Subsequently, at these high levels, there appears to be no
discernable difference between the absolute masking effect
of white noise and cafeteria noise. The questionnaire data
results also found that there was no discernable difference
between the subjective performance of the stethoscopes.
Both stethoscopes were judged to perform equally well in the
areas of comfortable loudness, quality and clearness of
sound transmission, noise attenuation in both white noise
and cafeteria noise, and goodness of ear tip fit.
IMPLICATIONS
The primary clinical disclosure of this study was the
measured effective masking levels of heart sound detection
in background noise during auscultation. This narrow range
of the calculated EML means, 92 to 95 dBA, demonstrated the
levels at which background noise effectively masked the
detection of auscultated cardiac sounds. In addition, these
noise levels are above the guidelines from the Environmental
Protection Agency (EPA) that states that daily time weighted
averages (TWA) exceeding 85 dBA are potentially hazardous to
human hearing (Suter & Von Gierke, 1987). Therefore,
hospital noise levels should not exceed the TWA 85 dBA
guidelines due to the potential that the noise will not only

53
effectively mask the cardiac sounds but also create a damage
risk situation for noise induced hearing loss among hospital
workers continuously exposed.
The EML is at the uppermost region of the range for
cardiac sound perception in background noise. Direct
auscultation in quiet without a stethoscopic instrument
might be hypothesized as the lowermost region of this range
in that the perception of heart sounds is already very close
to the threshold of human auditory detection (Groom, 1956,
1964; Williams & Dodge, 1926). A probable linear
progression of noise interference with the heart sound
perception lies between these lower and uppermost regions.
For example, diagnostic components of heart sounds may be
masked, even though the heart beat is still audible.
Although the reported hospital noise levels do not exceed
the EML for cardiac sounds, there is the probability that
these lower noise intensity levels may render the heart
sounds diagnostically unintelligible. The present study did
not address the noise interference level of heart sound
intelligibility as perceived by experienced listeners,
however, this topic is in need of further clarification.
The hospital noise levels as reported by Falk and
Woods (1973), Hilton (1985, 1987), Shapiro and Berland
(1972), Turner, et al., (1975), and Woods and Falk (1974)
are below the mean EML of cardiac sounds in this study.
This finding does not eliminate the possibility that these

levels of background noise may mask other bodily sounds,
such as pathologic cardiac sounds or respiration. Other
body sounds may have lower or higher EMLs then the cardiac
sounds. Future research could follow suit with an
investigation of the EML intensities for other auscultated
body sounds.
Cafeteria noise and white noise were the artificial
noises selected for this study because they are
experimentally controllable stimuli. They may not
approximate the environmental noises from a medical
facility. Although this study revealed no significant
54
difference between the EMLs for the stethoscopes in the two
noise environments, this does not eliminate the probability
that other noise environments, either artificial, on site
recordings, continuous or intermittent noises will have the
same or different effects.
Further investigation to provide more insight about
auscultation in background noise might include the following
areas: 1. What is the noise interference level for
intelligibility of heart sounds in background noise, rather
than detectability during cardiac auscultation for
experienced listeners? 2 • Are the effective masking levels
equivalent for other bodily sounds, such as respiration or
pathological conditions? 3. Would other types of
background noises display the same levels of interference,
particularly intermittent noise and conversational noise?

REFERENCES
American National Standards Institute. (1973). Standard for Audiometers. (ANSI S3.6-1969 [R 1973]). New York: American National Standards Institute.
American National standards Institute. (1977). ANSI S3.1-1977. New York: American National Standards Institute.
American National standards Institute. (1977). Criteria for Permissible Ambient Noise during Audiometric Testing. (ANSI S3.6-1977). New York: American National Standards Institute.
American National Standards Institute. (1983). American National Standard Specification for Sound Level Meters. (ANSI Sl.14-1983). New York: American National Standards Institute.
Chang, L., (1987). Development and Use of the Stethoscope in Diagnosing Cardiac Disease. The American Journal of Cardiology, .§_Q_, 1378-1382.
Egan, J. P. & Clarke F. R., (1966). Psychophysics and Signal Detection. In J. B. Sidowski (Ed.), Experimental Methods and Instrumentation in Psychology, New York: McGraw-Hill.
Ertel, P. Y., Lawrence, M., Brown, R. K., & Stern, A. M. (1966a). Stethoscope acoustics: I. The doctor and his stethoscope. Circulation, .J...i, 889-898.
Ertel, P. Y., Lawrence, M., Brown, R. K., & Stern, A. M. (1966b). Stethoscope acoustics: II. Transmission and filtration patterns. Circulation, J,±, 899-909.
Falk, S.A., & Woods, N. F. (1973). and potential health hazards. of Medicine, Vol. 289, No. 15,
Hospital Noise - Levels The New England Journal 774-781.
Fredrick, H. A., & Dodge, H. F. electrical stethoscope. Journal, 2, 531-549.
(1924). The stethophone, The Bell System Technical
An

Gamble, c. J., & Repologle, D. E. (1924). A multiple electrical stethoscope of teaching. Journal of American Medical Association, §_£, 387-388.
56
Green, D. M., & Swets, J. A. (1974). Signal Detection Theory and Psychophysics. New York: R.E. Krieger.
Groom, D. (1956). auscultation.
The effect of background noise on cardiac American Heart Journal, .2.1._, 781-790.
Groom, D. and Chapman, W. (1959). Anatomic Variations of the Auditory Canal Pertaining to the Fit of Stethoscope Earpieces. Circulation, 1...2_, 606-608.
Groom, D. (1964). Comparative efficiency of stethoscopes. American Heart Journal, §....§_, 220-226.
Harris, c. M. (1979). Handbook of Noise Control (2nd Ed.). New York: McGraw-Hill.
Hilton, B. A., (1985). Noise in Acute Patient Care Areas. Research in Nursing & Health, ~' 283-291.
Hilton, B. A., (1987). The Hospital Racket: How Noisy is 87, 59-61. Your Unit?, American Journal of Nursing,
Johnston, F. D., & Kline, of the stethoscope. 328-339.
E. M. (1940). An acoustical study Archive of Internal Medicine, .§2.,
Kindig, J. R., Beeson, R. P., Campbell, R. w., Andries, F., & Tavel, M. (1982). Acoustical performance of the stethoscope: A comparative analysis. Curriculum in Cardiology, 104, 269-275.
Lipscomb, D. M. (1974). Noise: The Unwanted Sounds, Chicago: Nelson Hall.
Littmann, D. (1972). Auscultation. American Journal of Nursing, 1239-1241.
McKusick, v. A. (1958). Cardiovascular Sound in Health and Disease. Baltimore: Williams & Wilkins Company.
Melnick, W. ( 1985). Industrial Hearing Conservation. In J. Katz (Ed.), Handbook of Clinical Audiology, (3rd Ed.). Maryland: Williams & Wilkins.
Mendenhall, w. (Ed.). and Statistics, Publishers.
(1979). Introduction to Probability (6th Ed.). Massachusetts: PWS

Miller, M. H. (Ed.). (1985). Council for Accreditation in Occupational Hearing Conservation, (2nd Ed.). New Jersey: Association Management Corporation.
Newby, H. A., & Popelka, G. R. (1985). Audiology, (5th Ed.). New Jersey: Prentice-Hall, Inc.
Oliver, s. R. A. (1989). In situ Measurements of Two Amplified and One Acoustic Stethoscope (Masters dissertation). Oregon: Portland StateUniversity, Speech & Hearing Sciences.
57
Peterson, A. P. G., & Gross, E. E. Jr. (1967). Handbook of Noise Measurement, (6th Ed.). Massachusetts: General Radio Company.
Rappaport, M. B., & Sprague, H. B. (1941). Physiologic and physical laws that govern auscultation, and their clinical application. The American Society of America, .!.§.., 1366-1372.
Rappaport, M.R., & Sprague, H. B. (1952). The Effects of Improper Fitting of Stethoscope to Ears of Auscultatory Efficiency. American Heart Journal, ~. 183-192.
Sakula, A. (1981). RTH Laennec 1781-1826, His life and work: a bicentenary appreciation. Thorax, 2§_, 81-90.
Shapiro, R. A., & Berland, T. (1972). Noise in the Operating Room. The New England Journal of Medicine, 287, 1236-1238.
Sheeley, E. c. (1978). Glossary. In J. Katz (Ed.), Handbook of Clinical Audiology, (3rd Ed.). Maryland: Williams & Wilkins.
Suter, A.H. and H. E. Von Gierke. (1987). Noise and Public Policy. Ear and Hearing, ~(4), 188-191.
Turner, A.G., King, c. H., & Craddock, J. G. (1975). Hospitals, Vol. 49, No. 15, 85-90.
U.S. Environmental Protection Agency, (1974). Information on levels of environmental noise requisite to protect public health and welfare with an adequate margin safety (Report #550-9-74-004), Washington, D.C.

Williams, W. & Dodge, M. (1926). The frequency characteristics of heartbeat sounds. The Journal of the American Medical Association, .§2, 1584-1589.
Woods, N. F., & Falk, Acute Care Area. 144-150.
s. A. (1974). Noise Stimuli Nursing Research, Vol. 23,
in the No. 2,
World Health Organization, (1980). Noise. Geneva: WHO.
Yost, W. A., & Nielsen, D. W. (1985). Fundamentals of Hearino: An Introduction, <2nd Ed.). New York: CBS College Publishing.
58

APPENDIX A
STETHOSCOPIC QUESTIONNAIRE
Rate the stethoscope in each environment on the following 5-point scale:
1 very poor 2 poor 3 satisfactory 4 very good 5 excellent
HEART SOUNDS IN:
L I S T E N I N G E N V I R 0 N M E N T
QUIET WHITE NOISE CAFETERIA NOISE
Is the heart sound at a comfortable loudness listening level?
1 2 3 4 5 1 2 3 4 5 1 2 3 4 5
How is the general quality and clearness of the heart sound?
1 2 3 4 5 1 2 3 4 5 1 2 3 4 5
How well do the ear tips fit?
1 2 3 4 5
How well do the ear tips attenuate the noise?
1 2 3 4 5 1 2 3 4 5 1 2 3 4 5
What is your overall impression of the instrument?
1 2 3 4 5 1 2 3 4 5 l 2 3 4 5
COMMENTS:

APPENDIX B
INFORMED CONSENT
I, , hereby agree to serve as a subject in the research project entitled "A comparison of an Acoustic Stethoscope and an Amplified Stethoscope in white noise and cafeteria noise during cardiac auscultation" conducted by principal investigator Lynda Lynell Gigstad, Graduate Student in Audiology at Portland State University and Dre. James Maurer and Thomas Dolan, Audiologists and Faculty members.
I understand that the study involves the use of 3nd written evaluation of two stethoscopes, an acoustic stethoscope and an amplified stethoscope, during cardiac auscultation in which I will adjust the noise level.
I understand that no known risks are associated with these procedures. It has been explained to me that the purpose of the study is to provide new knowledge about stethoscopic auscultation in background noise.
I may not receive any direct benefit from participation in this study, but my participation may help to increase knowledge which may benefit others in the future.
Lynda Lynell Gigstad and Drs. Maurer and Dolan have offered to answer any questions I may have about the study, and what is expected of me in the study. I have been assured that all information I give will be kept confidential and neither my name nor identity will be used for publication or public discussion purposes.
I understand that I am free to withdraw from participation in this study at any time without jeopardizing my course grade or my relationship with Portland State University.
I have read and understand the foregoing information and agree to participate in this study.
Date Signature
If you experience problems that are the result of your participation in this study, please contact the secretary of the Human Subjects Research Review committee, Off ice of Grants and Contracts, 303 Crammer Hall, Portland State University, 464-3417.
Related Documents