A comparison ofa dynamic software testability metric to static cyclomatic complexity J.M. Voas, K.W. Miller & J.E. Payne Reliable Software Technologies Corporation, 11150 ABSTRACT This paper compares the dynamic testability prediction technique termed "sensitivity analysis" to the static testability technique termed cyclomatic complexity. The appli- cation that we chose in this empirical study is a CASE generated version of a B-737 autoland and yawdamp systems. For the B-737 systems we analyzed, we isolated those functions that we predict are more prone to hide errors during system/reliability test- ing. We also analyzed the code with several other well-known static metrics. This paper compares and contrasts the results of sensitivity analysis to the results of the static metrics. INTRODUCTION The adage that non-exhaustive software testing cannot reveal the absence of errors and only their existence is as true today as itwas when Dijkstra wrote it[4, 1]. Unfortunately, between the time then and now, we have begun to build orders-of-magnitude more complex systems while our testing technologies are no more advanced. Thus the same problems that we had in past years when testing a 1000 line program are compounded when we apply those techniques to a 1M line program today. We must admit that we are building software systems that are destined to be in- adequately tested. Since we know this a priori, it suggests that we should look for techniques that aid the testing process where the process isknown to be weak. In this paper, we discuss one such technique: a method that quantifies the dynamic testability of a system that is undergoing system/reliability testing. We will then compare the results of this technique to other metrics that are in wide-spread use today. Software testing isperformed for generallytwo reasons: (1) detect faults so that they can be fixed, and (2) reliability estimation. The goal of the dynamic testability mea- surement technique presented in this paper isto strengthen the software testing process as it applies to reliability estimation. Dynamic testability analysis is less concerned with fault detection, even though it is true that a function that is more likely to hide faults during system testing may also be more likely to hide faults during unit testing. Instead, dynamic testability analysis is concerned with a lack of fault detection. *This paper isan expanded version of a paper presented at the 1993 NASA-Goddard Soft- ware Engineering Workshop. We have included more experimental results and analysis. Transactions on Information and Communications Technologies vol 8, © 1994 WIT Press, www.witpress.com, ISSN 1743-3517

Welcome message from author
This document is posted to help you gain knowledge. Please leave a comment to let me know what you think about it! Share it to your friends and learn new things together.
Transcript
A comparison of a dynamic software
testability metric to static cyclomatic
complexity
J.M. Voas, K.W. Miller & J.E. Payne
Reliable Software Technologies Corporation, 11150
ABSTRACT
This paper compares the dynamic testability prediction technique termed "sensitivityanalysis" to the static testability technique termed cyclomatic complexity. The appli-cation that we chose in this empirical study is a CASE generated version of a B-737autoland and yawdamp systems. For the B-737 systems we analyzed, we isolated thosefunctions that we predict are more prone to hide errors during system/reliability test-ing. We also analyzed the code with several other well-known static metrics. Thispaper compares and contrasts the results of sensitivity analysis to the results of thestatic metrics.
INTRODUCTION
The adage that non-exhaustive software testing cannot reveal the absence of errors andonly their existence is as true today as it was when Dijkstra wrote it [4, 1]. Unfortunately,between the time then and now, we have begun to build orders-of-magnitude morecomplex systems while our testing technologies are no more advanced. Thus the sameproblems that we had in past years when testing a 1000 line program are compoundedwhen we apply those techniques to a 1M line program today.
We must admit that we are building software systems that are destined to be in-adequately tested. Since we know this a priori, it suggests that we should look fortechniques that aid the testing process where the process is known to be weak. In thispaper, we discuss one such technique: a method that quantifies the dynamic testabilityof a system that is undergoing system/reliability testing. We will then compare theresults of this technique to other metrics that are in wide-spread use today.
Software testing is performed for generally two reasons: (1) detect faults so that theycan be fixed, and (2) reliability estimation. The goal of the dynamic testability mea-surement technique presented in this paper is to strengthen the software testing processas it applies to reliability estimation. Dynamic testability analysis is less concernedwith fault detection, even though it is true that a function that is more likely to hidefaults during system testing may also be more likely to hide faults during unit testing.Instead, dynamic testability analysis is concerned with a lack of fault detection.
*This paper is an expanded version of a paper presented at the 1993 NASA-Goddard Soft-ware Engineering Workshop. We have included more experimental results and analysis.
Transactions on Information and Communications Technologies vol 8, © 1994 WIT Press, www.witpress.com, ISSN 1743-3517

432 Software Quality Management
STATIC SOFTWARE METRICS
The study of software metrics has grown out of a need to be able to express quantitativeproperties about programs. The first software metric was simply a count of the numberof lines. This was acceptable as a way of measuring size, but was not applicable to othersoftware characteristics.
Software complexity is another metric that tries to relate how difficult a program is tounderstand. In general, the more difficult, the more likely that errors will be introduced,and hence the more testing that will be required. Thus it is common for developers torelate a software complexity measurement to the allocation of testing resources. It isour experience, however, that software complexity is still too coarse-grained of a metricto relate to the testing of critical software systems, those that must fail less than oncein 10^ executions (or some other large number). Thus even though software complexitycan be useful as a first-stab at how much testing to perform and where, it is too coarsefor assessing reliability in the ultra-reliable region of the input space.
In this paper, we have considered 6 software metrics that are available in the PC-METRIC 4.0 toolkit: (1) Software Science Length (N) (2) Estimated Software ScienceLength (N*), (3) Software Science Volume (V), (4) Software Science Effort (#), (5)Cyclomatic Complexity (VG1), and (6) Extended Cyclomatic Complexity (VG2). Wewill briefly mention what these metrics are; in general, any software engineering textwill go into more depth on these metrics for the inquisitive reader.
Halstead [2] observed that all programs are comprised of operators and operands.He defined NI to be the number of total operators and TVg to be the number of totaloperands. He defined length of a program, TV, to be:
N = NI + NI.
Halstead also has a predicted length metric, N*, that is given by:
where n\ is the number of unique operators and #2 is the number of unique operands.Halstead has another metric that he terms volume, V, that is given by:
V = N • Iog2(ni
Halstead 's Effort metric, E, is given by:
E = V/L,
however most researchers use [5]:
McCabe's cyclomatic complexity metric is less based on program size (as are Hal-stead's measures) and more on information/control flow:
where n is the number of nodes in the graph and e is the number of edges, or linesconnecting each node. It is the cyclomatic complexity metric that we are more interestedin for this paper, and most importantly how cyclomatic complexity compares to thedynamic testability measure presented in Section 3.
Transactions on Information and Communications Technologies vol 8, © 1994 WIT Press, www.witpress.com, ISSN 1743-3517
Managing Quality Systems 433
TESTABILITY ANALYSIS
Software testability analysis measures the benefit provided by a software testing schemeto a particular program. There are different ways to define the "benefit" of tests andtesting schemes, and each different definition requires a different perspective on whattestability analysis produces. For instance, software testability has sometimes beenreferred to as the ease with which inputs can be selected to satisfy structural testingcriteria (e.g., statement coverage) with a given program. With this perspective, if itwere extremely difficult to find inputs that satisfied a structural coverage criteria for agiven source program, then that program is said to have "low testability" with respectto that coverage criteria. Another view of software testability defines it as a predictionof the probability that existing faults will be detected during testing given some inputselection criteria C. Here, software testability is not regarded as an assessment of thedifficulty to select inputs that cover software structure, but more generally as a way ofpredicting whether a program would reveal existing faults during testing according toC.
In either definition, software testability analysis is a function of a (program, inputselection criteria) pair. Different input selection criteria choose test cases differently:inputs may be selected in a random black-box manner, their selection may be depen-dent upon the structure of the program, or their selection may be based upon otherdata or they may be based on the intuition of the tester. Testability analysis is morethan an assertion about a program, but rather is an assertion about the ability of aninput selection criteria (in combination with the program) to satisfy a particular testinggoal. The same syntactic program may have different testabilities when presented withdifferent input selection criteria.
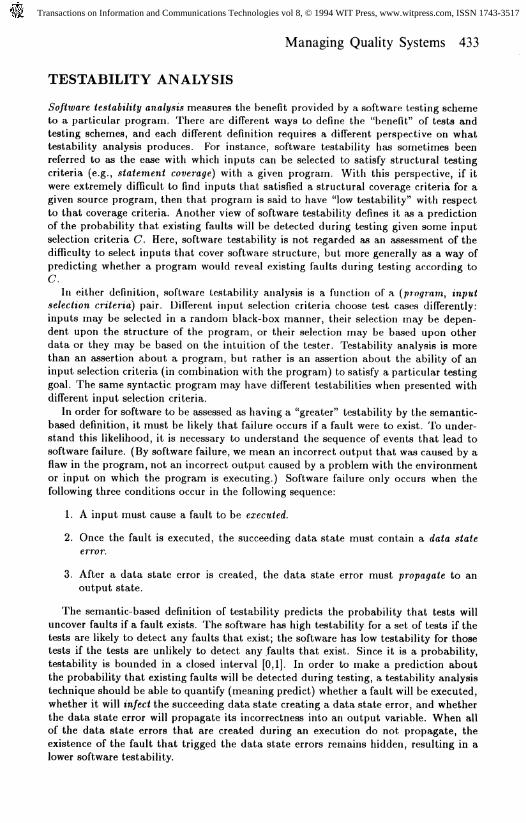
In order for software to be assessed as having a "greater" testability by the semantic-based definition, it must be likely that failure occurs if a fault were to exist. To under-stand this likelihood, it is necessary to understand the sequence of events that lead tosoftware failure. (By software failure, we mean an incorrect output that was caused by aflaw in the program, not an incorrect output caused by a problem with the environmentor input on which the program is executing.) Software failure only occurs when thefollowing three conditions occur in the following sequence:
1. A input must cause a fault to be executed.
2. Once the fault is executed, the succeeding data state must contain a data stateerror.
3. After a data state error is created, the data state error must propagate to anoutput state.
The semantic-based definition of testability predicts the probability that tests willuncover faults if a fault exists. The software has high testability for a set of tests if thetests are likely to detect any faults that exist; the software has low testability for thosetests if the tests are unlikely to detect any faults that exist. Since it is a probability,testability is bounded in a closed interval [0,1]. In order to make a prediction aboutthe probability that existing faults will be detected during testing, a testability analysistechnique should be able to quantify (meaning predict) whether a fault will be executed,whether it will infect the succeeding data state creating a data state error, and whetherthe data state error will propagate its incorrectness into an output variable. When allof the data state errors that are created during an execution do not propagate, theexistence of the fault that trigged the data state errors remains hidden, resulting in alower software testability.
Transactions on Information and Communications Technologies vol 8, © 1994 WIT Press, www.witpress.com, ISSN 1743-3517

434 Software Quality Management
Software sensitivity analysis is a code-based technique based on the semantic defini-tion of testability; it injects instrumentation that contains program mutation, data statemutation, and repeated executions to predict a minimum non-zero fault size [7, 13]. Theminimum non-zero fault size is the smallest probability of failure likely to be inducedby a programming error based upon the results of the injected instrumentation. Sensi-tivity analysis is not a testing technique, and thus it does not use an oracle, and can becompletely automated (provided that the user initially tells the technique where in thecode to apply the analysis).
Software sensitivity analysis is based on approximating the three conditions thatmust occur before a program can fail: (1) execution of a software fault, (2) creation ofan incorrect data state, and (3) propagation of this incorrect data state to a discernibleoutput. This three part model of software failure [9, 10] has been explored by others,but not in the manner in which sensitivity analysis explores it. In this paper we examinehow to apply sensitivity analysis to the task of finding a realistic minimum probabilityof failure prediction when random testing has discovered no errors.
In the rest of this section we give a brief outline of the three processes of sensitivityanalysis. To simplify explanations, we will describe each process separately, but ina production analysis system, execution of the processes would overlap. As with theanalysis of random testing, the accuracy of the sensitivity analysis depends in part on agood description of the input distribution that will drive the software when operational(and when tested).
Before a fault can cause a program to failure, the fault must be executed. In thismethodology, we concentrate on faults that can be isolated to a single location in aprogram. This is done because of the combinatorial explosion that would occur ifwe considered distributed faults. A location is defined as a single high level languagestatement. Our experiments to date have defined a location as a piece of source code thatcan change the data state (including input and output files and the program counter).Thus an assignment statement, if, and while statement define a location. The probabilityof execution for each location is determined by repeated executions of the code withinputs selected at random from the input distribution. An automated testability system,PiSCES [11], controls the instrumentation and bookkeeping.
If a location contains a fault, and if the location is executed, the data state after thefault may or may not be changed adversely by the fault. If the fault does change thedata state into an incorrect data state, we say the data state is infected. To estimate theprobability of infection, the second process of sensitivity analysis performs a series ofsyntactic mutations on each location. After each mutation, the program is re-executedwith random inputs; each time the location is executed, the data state is immediatelycompared with the data state of the original (unmutated) program at that same pointin the execution. If the internal state differs, infection has taken place. And this isrecorded by PiSCES and reported back to the user.
The third process of the analysis estimates propagation. Again the location is mon-itored during random tests. After the location is executed, the resulting data state isforcefully changed by assigning a random value to one data item using a predeterminedinternal state distribution. After the internal data state is changed, the program con-tinues executing until an output results. The output that results from the changed datastate is compared to the output that would have resulted without the change. If theoutputs differ, propagation has occurred and PiSCES reports that back to the user asa probability estimate.
For a test case to reveal a fault, execution, infection, and propagation must occur;without these three events occurring, the execution will not result in failure. And fora specific fault, the product of the probability of these events occurring is the actualprobability of failure for that fault. Each sensitivity analysis process produces a prob-
Transactions on Information and Communications Technologies vol 8, © 1994 WIT Press, www.witpress.com, ISSN 1743-3517
Managing Quality Systems 435
ability estimate based on the number of trials divided by the number of events (eitherexecution, infection, or propagation). The product of these estimates yields an estimateof the probability of failure that would result when this location contains a fault. Sincewe are approximating the model of how faults result in failures, we also take this multi-plication approach when we predict the minimum fault size and multiply the minimuminfection estimate, minimum propagation estimate, and execution estimate for a givenlocation. This produces the testability of that location. We then take the location withthe lowest non-zero testability to be the testability of the overall program.
PISCES
Several proof-of-concept sensitivity analysis prototypes were built in the early 1990s.PiSCES is the commercial software testability tool that evolved from these prototypes.PiSCES is written in C++ and operates on programs written in C. The recommendedplatform for PiSCES is a Spare-2 with 16 mbytes of memory, 32 mbytes of swap space,and 20 mbytes of hard disk space. For larger C applications, the amount of memory thatPiSCES needs increases, and thus we currently are limited to running around 3,000-4,000 lines of source code at a time through PiSCES. For larger systems, we performanalysis on a part of the code, and when that is done, we perform analysis on anotherpart until all of the code has received dynamic testability analysis. This "modularapproach" is how we get results for systems larger than 4,000 SLOC.PiSCES produces testability predictions by creating an "instrumented" copy of your
program and then compiling and executing the instrumented copy. Although it is hardto determine precisely, given the default settings that PiSCES uses, the instrumentedversion of your program is approximately 10 times as large as the original source code.The instrumented copy is then executed with inputs that are either supplied in a file orPiSCES uses random distributions from which it generates inputs.
DYNAMIC TESTABILITY RESULTS
We were first supplied with a C version of a B-737 autopilot/autoland that had beengenerated by a CASE tool; the CASE tool has been under development by NASA-Langley and one of their vendors for several years. We were told that as far as NASAknew, this version of the autopilot/autoland had never failed; it appears to be a correctversion of the specification. The version consisted of 58 functions; parameters to thesystem included information such as direction of wind, wind speed, and speed of gusts.The version we used is not embedded in any commercial aircraft. Instead, the versionis based on the specification of the system that is embedded on aircraft, and hencethis code should contain most (if not all) of the functionality of the production aircraftsystem.
We should mention that the B737 source code was approximately 3000 SLOCs, andit represents the largest program to receive sensitivity analysis in its entirety to date.Our results here are based on 2000 randomly generated input cases that are correlatedto the following types of landing conditions:
1. no winds at all,
2. moderate winds, and
3. extremely strong winds with high gusts.
Transactions on Information and Communications Technologies vol 8, © 1994 WIT Press, www.witpress.com, ISSN 1743-3517
436 Software Quality Management
(We think it was important to exercise three major classes of scenarios that the systemwould encounter in operation.) We should mention that we found similar results [12]when we used a different test suite with 1000 randomly generated inputs. The totalamount of clock time that it took for PiSCES analysis to run and produce the results forthe 2000 test cases was 55 hours on a Sparc-2 (there were no other major jobs runningon that platform during this time).
According to the Squeeze-Play model [8] for testing sufficiency for the B-737 version,sensitivity analysis recommends 11,982,927 system level tests. This is based on theconservative testability prediction of < 2.50 — 07 for the entire program; a conservativetestability translates into a liberal estimate of the amount of needed testing. We use aconservative testability to ensure that we are not fooled into believing that we have doneenough testing when we really have not. A testability written as an inequality indicatesthat PiSCES encountered at least one location that did not execute or propagate duringanalysis. One possible quantification of this situation is to assign a testability of 0.0,but that creates problems for further analysis. Instead, PiSCES makes a reasonableestimate on testability and signals the singularity with the inequality. The processfor doing this as well as the mathematics are described in the PiSCES Version 1.0User's Manual. (A 0.0 testability produces an infinite amount of testing needed whichis useless to testers.) Since testing on approximately 12 million inputs is impractical,there are other alternatives for increasing the testability; if these alternatives are appliedsuccessfully, they will decrease the number of tests required, but we will not explain herehow that is done.
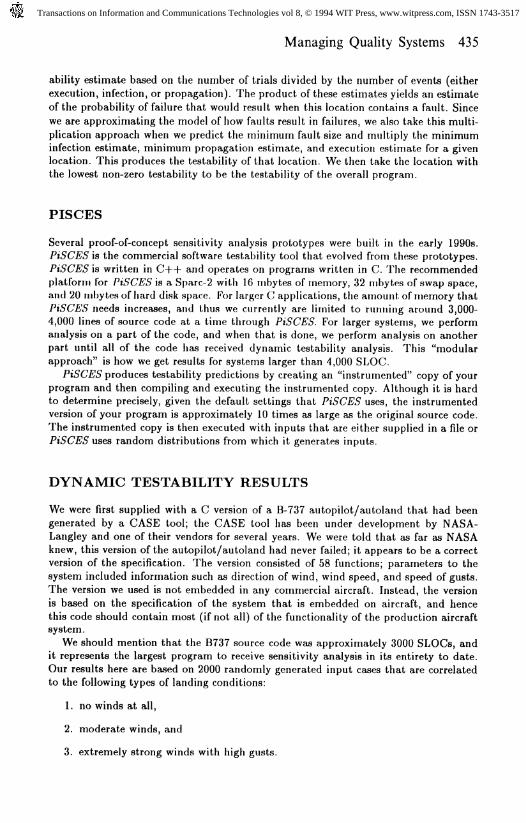
We show the results for the 58 individual functions of the B737.C system in Figures1 and 2. As you can see, there are 15 functions out of the 58 that have a testability ofgreater than 0.01. These are functions that the developer/tester need not worry over;they appear to have little fault hiding ability. This information also tells the developerwhich functions (the other 43) are more worrisome (in terms of hiding faults at thesystem level of testing); by immediately isolating those functions of low testability, wegain insight as to where additional testing resources are needed. Note that the degreeto which we consider a function to be "worrisome" is a function of how much testing isconsidered feasible.
Next, we ran a module called "yawdamp.c" for NASA, with 15,000 test cases thatwere uniformly selected. Those results are shown in Figure 3. In this example, we seethat there were 4 functions of fairly high testability, and 2 functions of lower testability.Again, the static metrics suggest that the code is trivial to test structurally.
As you can see from the bar charts, there were many functions with low testabilityscores from sensitivity analysis. (We present the static scores in the next section.) Lowtestability does not say that these functions are incorrect (recall that this program hasnever failed for NASA), but rather that these functions should receive special consider-ation during V&V. In our tool, there are ways of decreasing the recommended testingcosts if the user knows that the regions of the code where the low testabilities occur arenot hiding faults. Although such knowledge is difficult to obtain, it does provide theuser with a justifiable way of performing code inspections and testing sufficiency.
STATIC METRIC RESULTS
This section provides several sets of data that we collected from the B737 autolandand yawdamp source code when we ran it through a commercial metrics package withthe default settings. Tables 1-3 display the results that were attained by running PC-METRIC 4.0.2 [5].
Transactions on Information and Communications Technologies vol 8, © 1994 WIT Press, www.witpress.com, ISSN 1743-3517

Managing Quality Systems 437
Figure 1: Testing needed given "raw" testability score for autoland module.
Transactions on Information and Communications Technologies vol 8, © 1994 WIT Press, www.witpress.com, ISSN 1743-3517
438 Software Quality Management
Figure 2: Function testabilities for autoland.
Transactions on Information and Communications Technologies vol 8, © 1994 WIT Press, www.witpress.com, ISSN 1743-3517

Managing Quality Systems 439
Figure 3: Additional function testabilities for autoland.
Transactions on Information and Communications Technologies vol 8, © 1994 WIT Press, www.witpress.com, ISSN 1743-3517

440 Software Quality Management
Figure 4: Function testabilities for yawdarnp module.
Transactions on Information and Communications Technologies vol 8, © 1994 WIT Press, www.witpress.com, ISSN 1743-3517

Managing Quality Systems 441
Procedure N VGl VG2LIMITERLIM_180ONEDINTEGRATEFOLAGWASHOUTSTATEEZSWITCHKOUNTMODLAGMODLAG.lMODLAG.2MODLAG_3DZONEAUTOPILOTMODEMODES.2MODE1MODE2CALC.GSTRKMODESTHROTATHROTPRE_FLAREVER_SINEWIND-SHEARSPEEDCAFTLIMEPR.GAINLONG_xLONGAPCALC_HRFLARE_CONTROLCALC_HDERPRE.FLARE-LONGIN_ON_BEAMGSE.ADJBEFORE.GSEBANK_ADJPITCH_ADJCAS_ADJLATERALLATAPLOC.ERRORCROSS.VELLOCCMD
375913745435317626613010835682227617217813912012010973180792999185843111226151353998393751173925115192781876
467215657687224113711857664824061032335120921013416814431016857151369772242399281857218571679633815327036212836128
145259714188186233563012907014821493088418421016107276366360557636810724181215126727318962014085272817152817116024061176102656117339067380
2186 34001 325760 31642 32243 23215 2329 14694 23508 416964 27706 71772 25263 3603 125716 25166 17309 16940 18948 19837 67615 11432 121174 54840 2605 16763 1320 13926 32302 22391 128817 3227 112557 51485 27332 21225 21270 12657 1457 11491 2657 12394 119388 24095 2320 15510 2
33732213437331211108871721116213152221212112212
Table 1: Software Science Length (N) Estimated Software Science Length (N*), Soft-ware Science Volume (V), Software Science Effort (£"), Cyclomatic Complexity (VGl),and Extended Cyclomatic Complexity (VG2) for B737.c-Autoland
Transactions on Information and Communications Technologies vol 8, © 1994 WIT Press, www.witpress.com, ISSN 1743-3517

442 Software Quality Management
Procedure N N* V E VGl VG2LOCINTLOCCFCROSSTKADJBANKPHICMDFBRtoAJCFDCALC_PSILIMSPOILERAIL_CMDRUDDER_CMDOUTERLOOPSAUTOOL
4678339083103575197753969
10111771156145191768116914569117
219383145469426559254231513385169339
1884452195758945830784728982391528737516503386
142322324313
2424323243
4
Table 2: Software Science Length (TV) Estimated Software Science Length (N*), Soft-ware Science Volume (V), Software Science Effort (E), Cyclomatic Complexity (VGl),and Extended Cyclomatic Complexity (VG2) for B737.c-Autoland
Metric ScoreSoftware Science Length (N): 4707Estimated Software Science Length (N*): 4107Software Science Volume (V): 42147Software Science Effort (E): 7963380Estimated Errors using Software Science (B*): 13Estimated Time to Develop, in hours (T*): 123Cyclomatic Complexity (VGl): 70Extended Cyclomatic Complexity (VG2): 111Average Cyclomatic Complexity: 1Average Extended Cyclomatic Complexity: 1Average of Nesting Depth: 1Average of Average Nesting Depth: 0Lines of Code (LOG): 3312Physical Source Stmts (PSS): 2683Logical Source Stmts (LSS): 569Nonexecutable Statements: 861Compiler Directives: 9Number of Comment Lines: 1384Number of Comment Words: 1985Number of Blank Lines: 629Number of Procedures/Functions: 58
Table 3: Summary of Static Metric Scores for Autoland
Procedure N N* V E VGl VG2YAWDAMPWOUTFOLAGlimFCASLINTERP
10353433716334
17477684612453
548236186145808139
7698 22902 22243 22186 314536 71191 1
222371
Table 4: Software Science Length (N) Estimated Software Science Length (N*), Soft-ware Science Volume (K), Software Science Effort (E), Cyclomatic Complexity (VGl),and Extended Cyclomatic Complexity (VG2) for B737.c-Yawdamp
Transactions on Information and Communications Technologies vol 8, © 1994 WIT Press, www.witpress.com, ISSN 1743-3517

Managing Quality Systems 443
Metric ScoreSoftware Science Length (N) 433Estimated Software Science Length (N*) 450Software Science Volume (V) 2753Software Science Effort (E) 84293Estimated Errors using Software Science (B*) 1Estimated Time to Develop, in hours (T*) 1Cyclomatic Complexity (VG1) 12Extended Cyclomatic Complexity (VG2) 12Average Cyclomatic Complexity 2Average Extended Cyclomatic Complexity 2Average of Nesting Depth 2Average of Average Nesting Depth 0
Table 5: Summary of Static Metric Scores for Yaw damp
COMPARISON OF RESULTS
Some software researchers and practitioners have equated testability with McCabe's cy-clomatic complexity or some other static metric. We contend that such static measuresdo not capture the dynamic, data dependent nature that is fundamental to testing andour analysis of the effectiveness of testing.
In 1990, we introduced both a new definition of testability and a new method formeasuring testability based on our definition. Still, we are frequently asked how ourdefinition compares to cyclomatic complexity, which we feel is a valid question. In thissection, we will try to show how these two measurement methods differ, and what thesedifferences mean for the typical tester or QA manager.
As we have shown in Figures 2-4, the B737 code had functions of high testabilityand lower testability. If the reader then considers Tables 1 and 2, we immediately seethat the VG1 values for the functions of B737 never exceeded 7, and for VG2, thefunctions never exceeded 10. According to the cyclomatic complexity measures, allof these functions are labeled as "not complex;" however sensitivity analysis has foundthat many of these functions are more likely to hide faults during testing than McCabe'snumbers might suggest.
Our interpretation for why this is true is simply how the two metrics distinctly view aprogram; sensitivity analysis is based on the semantic meaning of the program, whereascyclomatic complexity is based on an abstract and structural view of the program. It istrue that the structural view has some impact on the semantics of the program, how-ever during system level testing, we argue that the information provided by cyclomaticcomplexity is essentially useless in terms of how much testing to perform. Thus weconclude that for unit testing, cyclomatic complexity is an easy means of attaining afeeling for how good the structure of the program is (essentially as a "spaghetti" codetype of measure), however for critical systems, we contend that the semantic perspectiveon testability provided by sensitivity analysis is far more valuable. Sensitivity analysiscosts more, but the value added is also increased.
CONCLUSIONS
We contend that the preliminary results of experiments in software sensitivity are suf-ficient to motivate additional research into quantifying sensitivity analysis [13, 6]. Notonly do we think that this technique may hold promise in assessing critical systems,
Transactions on Information and Communications Technologies vol 8, © 1994 WIT Press, www.witpress.com, ISSN 1743-3517
444 Software Quality Management
but in Hamlet's award winning IEEE Software paper [3] and The National Instituteof Standards and Technology's report on software error analysis [14], sensitivity anal-ysis is acknowledged as a technique that should be further explored for its potentiallyenormous impact on assessing ultra-reliable software.
Although the subprocesses of sensitivity analysis will in all likelihood require minorrevisions as more is learned about fault-based analysis, the ideas that motivate sen-sitivity analysis and the "Squeeze Play" model dispute the contention that softwaretesting is the only method of experimentally quantifying software reliability. We can-not guarantee that sensitivity analysis will assess reliability to the precisions requiredfor life-critical avionics software, because as we have pointed out, low testability codecan never be tested to any threshold that would strongly suggest that faults are nothiding. However, we do think it is premature to declare such an assessment impossiblefor all systems, and we feel that this topic deserves attention both from the avionicscommunity as well as the software engineering and testing communities.
This experiment demonstrates important differences between static and dynamicanalysis of how much testing is required. Admittedly, dynamic information is far moreexpensive to attain; but for the additional cost, the precision derived we feel is justified.This expense comes mainly from the fact that the input space and probability densityfunction are also considered when assessing how much testing is necessary, not only thestructure of the code. And this expense is in computer time, not human time.
We have felt that static software metrics are too assumption-based to be useful forpredicting how to test critical systems. For this reason, we developed a new perspectiveon testability, a new way of measuring that definition, and commercialized a tool toperform the measurement.
Acknowledgement
This experiment was funded through NASA-Langley Grant NAG-1-884. The authorsthank Carrie Walker for supplying us with the B737 auto-generated code from theASTER tool.
Disclaimer
The code supplied to us was from NASA and not Boeing, and as far as we know, thiscode and the testability results do not reflect the quality of the software used in Boeingaircraft or produced by Boeing. Boeing is in no way affiliated with this experiment norRST Corporation.
References
[1] E. DUKSTRA. Structured Programming. In Software Engineering, Concepts, andTechniques. Van Nostrand Reinhold, 1976.
[2] M. H. HALSTEAD. Elements of Software Science. New York:Elsevier North-Holland,1977.
[3] D. HAMLET. Are We Testing for True Reliability? IEEE Software, pages 21-27,July 1992.
[4] O. J. DAHL, E. W. DIJSKTRA, AND C. A. R. HOARE. Structured Programming.Academic Press, 1972.
Transactions on Information and Communications Technologies vol 8, © 1994 WIT Press, www.witpress.com, ISSN 1743-3517

Managing Quality Systems 445
[5] SET LABORATORIES INC PC-METRIC User's Manual.
[6] J. VOAS, J. PAYNE, C. MICHAEL AND K. MILLER. Experimental Evidence of Sensitiv-ity Analysis Predicting Minimum Eailure Probabilities. In Proc. of COMPASS'93.,NIST, Washington DC, June 1993.
[7] J. VOAS, L. MORELL, AND K. MILLER. Predicting Where Faults Can Hide FromTesting. IEEE Software, 8(2):41-48, March 1991.
[8] J. VOAS AND K. MILLER. Improving the Software Development Process UsingTestability Research. In Proc. of the 3rd Int'L Symposium on Software ReliabilityEngineering., pages 114-121, Research Triangle Park, NC, October 1992. IEEEComputer Society.
[9] L. J. MORELL. Theoretical Insights into Fault-Based Testing. Second Workshop onSoftware Testing, Validation, and Analysis, pages 45 62, July 1988.
[10] L. J. MORELL. A Theory of Fault-Based Testing. IEEE lYansactions on SoftwareEngineering, SE-16, August 1990.
[11] J. VOAS, K. MILLER, AND J. PAYNE. PISCES: A Tool for Predicting SoftwareTestability. In Proc. of the Symp. on Assessment of Quality Software DevelopmentTools, pages 297-309, New Orleans, LA, May 1992. IEEE Computer Society TCSE.
[12] J. VOAS, K. MILLER, AND J. PAYNE. Software Testability and Its Application toAvionics Software. In Proc. of the 9th AIAA Computers in Aerospace, San DiegoCA, October 19-21 1993.
[13] J. VOAS. PIE: A Dynamic Failure-Based Technique. IEEE Trans, on SoftwareEngineering, 18(8):717-727, August 1992.
[14] W. PENG AND D. WALLACE. Software Error Analysis. Technical Report NIST Spe-cial Publication 500-209, National Institute of Standards and Technology, Gaithers-burg, MD, April 1993.
Transactions on Information and Communications Technologies vol 8, © 1994 WIT Press, www.witpress.com, ISSN 1743-3517
Related Documents