1 | Page A Comparative Study on Financial Performance of SBI Life Insurance and ICICI Prudential Life Insurance Research Project Submitted in Partial Fulfilment of the Requirements for the Degree of BCOM Honours By Harshita Kataria to the DEPARTMENT OF COMMERCE BHOPAL SCHOOL OF SOCIAL SCIENCES April, 2021 Submitted by Guided by Harshita Kataria Dr Swapna Pillai Associate Professor Department of Commerce

Welcome message from author
This document is posted to help you gain knowledge. Please leave a comment to let me know what you think about it! Share it to your friends and learn new things together.
Transcript

1 | P a g e
A Comparative Study on Financial Performance of SBI Life
Insurance and ICICI Prudential Life Insurance
Research Project Submitted in Partial Fulfilment of the Requirements
for the Degree of
BCOM Honours
By
Harshita Kataria
to the
DEPARTMENT OF COMMERCE
BHOPAL SCHOOL OF SOCIAL SCIENCES
April, 2021
Submitted by Guided by
Harshita Kataria Dr Swapna Pillai
Associate Professor
Department of Commerce

2 | P a g e
CERTIFICATE
It is certified that the work contained in the project report titled “A Comparative Study on
Financial Performance of SBI Life Insurance and ICICI Prudential Life Insurance,” by
“Harshita Kataria,” has been carried out under my/our supervision and that this work has
not been submitted elsewhere for a degree*
Signature of Supervisor: …………….
Name : Dr Swapna Pillai, Associate Professor
Department : Commerce
Bhopal School of Social Sciences
April, 2021
3 | P a g e
DECLARATION
I hereby declare that this project report entitled “A Comparative Study on Financial
Performance of SBI Life Insurance and ICICI Prudential Life Insurance “was carried out by
me for the degree of BCOM Honours under the guidance and supervision of Dr Swapna
Pillai , Associate Professor of Department of Commerce, BSSS College. The interpretations
put forth are based on my reading and understanding of the original texts and they are not
published anywhere in any form. The other books, articles and websites, which I have made
use of are acknowledged at the respective place in the text. This research report is not
submitted for any other degree or diploma in any other University.
Place: Bhopal
Name of the Student: Harshita Kataria
Class & Section: B.Com (Hons) III ‘A’
Date: 30th April 2021

4 | P a g e
ACKNOWLEDGEMENT
I would like to thank our Principal Dr. Fr. John P.J. and Vice Principal Dr Sr Sonia Kurien
for their immense support and blessings. I thank our HOD Dr Amit Kumar Nag for his
support. I would like to express my special thanks of gratitude to my research guide Dr.
Swapna Pillai, Associate Professor of Department of Commerce for her valuable suggestions
and guidance and for giving me the golden opportunity to do this wonderful research project
on the topic: A Comparative Study on Financial Performance of SBI Life Insurance and
ICICI Prudential Life Insurance, Without her help it would have been difficult for me to have
reached this state of completion of my project report. Also, I would like to thank my parents
and friends who helped me a lot in the preparation of this project.
I wish to acknowledge the help of all those who have provided me information, guidance and
other help during my research period.
5 | P a g e
SUMMARY
Insurance has been playing a vital role in advanced and emerging nations and has been
recognized as a reliable tool for the mobilization of public savings. In India, the insurance
sector has gone through various phases, such as deregulation, regulation, nationalization,
privatization and globalization. Liberalization has opened the door for many private players
to join hands with international partners. Since 2000, the Indian life insurance sector has been
characterized by intense competition between the private and public sector players and within
the private sector players. This study aims to examine the financial performance of ICICI
Prudential Life Insurance and SBI Life Insurance during the period 2017-18 to 2019-20. For
measuring it, various financial ratios have been calculated taking into consideration liquidity,
solvency, profitability and persistency ratio of ICICI Prudential Life Insurance and SBI Life
Insurance. For further analysis of the data, a t-test is applied, and the results of the t-test
reveal that there is a significant difference in the current ratio of selected insurers.
This study mainly depends on the secondary data. The relevant and required data were
collected from the text books, websites, National and International articles, as well as annual
reports of ICICI Prudential Life Insurance and SBI Life Insurance.
6 | P a g e
INDEX
S.NO. CONTENTS PAGE NO.
1. Rationale of the study 8
2. Introduction to the industry 8
3. Introduction to the company 10
4. Justification of the topic 12
5. National Review 14
6. International Review 17
7. Objectives of the study 20
8. Research Hypothesis 20
9. Scope of the study 20
10. Research Design 21
11. Limitation of the study 21
12. Data representation and interpretation 23
13. Hypothesis testing 34
14. Major findings 36
15. Discussions and suggestions 37
16. Conclusions 37
17. References 39
18. Annexure 43

7 | P a g e
CHAPTER 1 : INTRODUCTION OF
THE TOPIC
1.1 Rationale of the Study
1.2 Introduction to the Industry
1.3 Introduction to the Company
1.4 Justification of the Topic
8 | P a g e
1.1 RATIONALE OF THE STUDY:
1.1.1 Why the need for the study?
To compare the companies to identify which company is the market leader.
To understand their financial performance.
1.1.2 What information will the study add?
This research will help in analysis of companies.
This research will make us understand the companies’ market share, financial strength
and quality of their business.
1.2 INTRODUCTION OF THE INDUSTRY:
Insurance is the backbone in managing the risk of the country. The insurance providers offer diversity
of products to business, thus ensuring protection from risk thereby guaranteeing financial stability .It
helps individual and organization to minimize the consequences of risk which impart significant cause
on the growth and development of insurance industry. Insurance plays a key role in stabilizing the
economy, trade and commerce.
What is Life Insurance?
(Life Insurance) is defined as a contract between the policy holder and the insurance
company, where the life insurance company pays a specific sum to the insured individual's
family upon his death. The life insurance sum is paid in exchange for a specific amount of
premium.
The Indian Insurance Industry is divided into 2 basic sectors – Life Insurance and Non-life
Insurance (also called General Insurance ) Both these sectors are regulated by Insurance
Regulatory and Development Authority (IRDA) of India which is a government body which
frames the rules for the entire industry and all insurance companies have to abide by them. IRDA is
the policy maker for the entire insurance industry in India and also serves as the custodian of
consumers rights.

9 | P a g e
Growth of Life Insurance Industry
As an industry, insurance is regarded as a slow-growing, safe sector for investors. This perception is
not as strong as it was in the 1970s and 1980s. (A Brief Overview of the Insurance Sector) . The
Indian Insurance has been growing rapidly since 2000, as it was liberalised after more than 50
years of monopoly of LIC, where private life insurers have entered the insurance sector with
innovative practices leading to more business. Indian consumers, who have always seen life
insurance as a tax saving system, are now suddenly turning to the private sector and snapping
up the new innovative products on offer. The Private players have taken some market share
from LIC, and major growth has happened because of market expansions. The Indian
Insurance Industry is getting ready for new era, where it is building world-class risk
Management capability. The insurance industry has come a long way from being an open
competitive market to nationalized then back to a liberalized market in India.
Current market Scenario
.According to (Indian Insurance Industry Report , 2021) the insurance industry of India has 57
insurance companies 24 are in the life insurance business, while 33 are non-life insurers. Among the
life insurers, Life Insurance Corporation (LIC) is the sole public sector company. According to
(McKinsey, 2007) it was estimated that India is likely to emerge as the fifth largest market in the
world by 2025.
In India, most private companies have entered into business with collaboration with
established Insurance Companies in the world, both in the life and non-life Insurance Sectors.
These global players' skills contribute to the performance of the Indian insurance sector, as it
replicates the learning acquired from other industries over a long span of time. The
international partner of any insurance firm in India is not allowed to own more than 26% of
the shares in Indian insurance company as per IRDA regulations. We have seen big financial
groups in India like SBI, ICICI and HDFC enter this pace and become aggressive players. .
Other famous corporate groups like the Tata’s, Birla’s and the Ambani’s have also formed insurance
companies.

10 | P a g e
1.3 INTRODUCTION TO THE COMPANY:
For the purpose of the present study, two renowned private life insurance companies namely,
ICICI Prudential Life Insurance and SBI Life Insurance were selected. Brief profiles of the
selected insurers are as follows:
SBI Life Insurance Company Ltd.
It is a joint venture life insurance company between State Bank of India (SBI), the
largest state-owned banking and financial services company in India, and BNP
Paribas Cardif. It incorporated October 11, 2000, and received permission from IRDA on
March 29, 2001, to carry on the life insurance business .SBI has a 62.1% stake in the
company and BNP Paribas Cardif owns a 22% stake. Other investors are Value Line Pte. Ltd.
and MacRitchie Investments Pte. Ltd., holding a 1.95% stake each while the remaining 12%
is free float stake with public investors.
SBI Life incorporated with an authorized capital of Rs. 2000 crore, while it is paid up capital
is Rs.1000 crore. SBI Life, which started its operations with the vision “To be the most
trusted and preferred life insurance provider,” initially depended upon the Bancassurance and
now is developing its own agency team for selling insurance products. SBI Life’s insurance
products include various policies meant to address different needs of different sections of the
society. It offers unit-linked, child plans, protection plans, saving plans, retirement, group
plans, etc. With customer service excellence and product innovations, the company has been
growing year after year. SBI Life Insurance has received many awards and accolades for the
work in the field. Following are some of them:
SBI Life Insurance has won ‘Brand of the Year 2016-17’ award in the insurance
category
SBI Life Insurance has won ‘Private Sector Life Insurance Company of the Year’
award at Fintelekt Insurance Awards
SBI Life Insurance has won ‘Bancassurance Leader, Life Insurance’ in large
companies category.

11 | P a g e
ICICI Prudential Life Insurance Company Limited
It is a life insurance company in India. Established as a joint venture between ICICI
Bank and Prudential plc, ICICI Prudential is engaged in life insurance and asset management
business. The firm offers long term life insurance plans and is headquartered in Mumbai. In
2016, the firm became the first insurance company in India to be listed in the domestic stock
exchanges.
ICICI Prudential Life Insurance Company has been promoted jointly by ICICI Bank limited,
a leading private sector Indian bank, and Prudential Corporation Holdings Limited by
contributing 74% and 23% capital, respectively. It was incorporated on July 20, 2000, and
received a certificate of registration from IRDAI to carry out the life insurance business on
November 20, 2000. ICICI Life began its operations in financial year 2001 with the vision to
build an enduring institution that serves with sensitivity the protection and long-term saving
needs of customers. ICICI Prudential Life, known as ICICI Life, has become the first
insurance company in India to be listed on the NSE and the BSE in 2017. It offers health
insurance, term insurance, savings, and retirement plans for individuals and groups to meet
varied needs of the customers.
ICICI Prudential Life Insurance has received many awards and accolades for the work in the
field. Following are some of them:
ICICI Prudential Life has received ‘Life Insurance Company of the Year’ award at
India Summit and Awards 2019
ICICI Prudential Life has received ‘Life Insurance Provider of the Year’ by Outlook
Money Awards 2018
ICICI Prudential Life has received ‘Best Term Insurance Provider of the Year’ award
by Money Today Financial Awards 2017-18
ICICI Prudential Life is awarded as ‘Best Customer Orientation in Life Insurance’
award by Emerging Asia Awards 2018
ICICI Prudential Life is awarded as ‘Best Growth in Life Insurance’ category by
Emerging Asia Awards 2018.

12 | P a g e
1.4 JUSTIFICATION OF THE TOPIC:
1.4.1 What is the potential utility of the findings (local, national, global)?
This analysis will help the investors who want to invest in such companies.
To identify their good points and points of improvement.
1.4.2 What are the implications of the study?
Comparison of market share.
Comparison of profitability.
Ratio analysis to find out their financial strength.
Measuring Quality of the Businesses.

13 | P a g e
CHAPTER 2: REVIEW OF
LITERATURE
2.1 National Reviews
2.2 International Reviews

14 | P a g e
2.1 NATIONAL REVIEWS:
1. (Naidu & Paramasivan, 2015) highlighted that the measurement of performance of
insurance firms become important, because they not only include the money saving and risk
transfer process, but also help to properly redirect funds in order to finance investment
activities in the economy.
2. (Joshi & Takodia, 2017) study suggests that all life insurers need to raise understanding
on the definition of life insurance and on different life insurance undertakings among
investors in order to increase market share and growth in a sector. When looking at Life
insurers, they must have adequate weightage for different factors such as the timeliness of
pay-out and the sum of their claims, ensure that investors are at the best possible convenience
in the settlement, provide integrity and retain strong financial position to draw the interest of
investors.
3. (Kumari, 2013) analysed efficiency assessment of India's post-liberalization life insurance
market by using different ratios. The study concluded that India has registered a rise in both
insurance penetration and density since Indian insurance market was opened to private firms.
India's life insurance spectrum is enormous. The total assets to earned premium ratio,
investment income to earned premium ratio and investment income to total investment ratio
represent an insurer's economic solidity and reveal the performance with respect to
investment decisions.
4. (Dr.Parmasivan, 2015) has carried out a comparative analysis of insurance providers in
India in the public and private Life Insurance Companies. Current ratio and debt equity ratio
is estimated to measure the solvency ratio for financial efficiency. The analysis shows that
LIC already dominates the market. The new commercial channels of promotion are used by
private sector insurance providers in comparison to LIC. The sale of more plan-linked units
allows private insurers to capture LIC market share. Private insurers are also better than LIC's
solvency and lapse ratios. In comparison with private life insurance the service of death
lawsuits was higher for LIC.
5. ( Mishra, 2015) suggest that the current public insurers with ensuring cost-effectiveness
should stay competitive also. These public sector firms have taken a range of steps with
regard to competition with private sector businesses. But, despite changing their strategy and

15 | P a g e
ideology in the post-Reform era, the government sector companies do need to reassess their
current status. Insurance firms must ensure that premium goods are guaranteed at a fair price
and companies can reduce the price of the commodity by reducing costs. Success depends on
their sustainability, competitiveness, reliability and quality of service performance.
6. (Bodla, Bodla, & Tondon, 2017 ) analysed and compared the profits of life insurance firms in
India (Public and Private). The 10-year comparison frame for the analysis varied from 2007 and 2016.
Seven factors, including Net Premium, Investment income, Underwriting income, asset return,
combined ratio, solvency ratio and profits were used for analysis of income and financial results. The
analysis showed that the net average premium over the last five years was the highest for ICICI
prudential followed by the HDFC Standard and SBI Life, while the lowest premium for the private
sector life insurers was mobilised by IDBI Federal. They concluded, too, that in almost every private
sector corporation in the past five years, the CAGR's underwriting revenue has decreased.
7. (Gulati & Jain, 2011) analysed business performance of all life insurers in industry on
the basis of various indicators. LIC was the highest rider in all forms of premiums whereas in
the private sector, ICICI Prudential Life Insurance led the Insurance Industry followed by
SBI Life Insurance and Bajaj Allianz Life Insurance. The study suggested that even after the
entry of private sector, the growth of public sector undertaking had not resulted in downfall
even after facing numerous opportunities and challenges.
8. ( Bawa & Chattha , 2013) examines the financial performance of Indian life insurance
companies by analysing their profitability determinants. Financial Efficiency was calculated
using financial ratios such as the current ratio, solvency ratio, equity ratio, and insurance debt
ratio. The samples for this analysis are 18 Indian Life Insurers (including 1 public and 17
private life insurers) and the study period is from 2007-08 to 2011-12.According to the
report, the public sector LIC is the most liquid of all life insurers. Future General Life
Insurance, IDBI, Sahara, Shri Ram Life Insurance, and SBI Life Insurance have a strong cash
position in comparison to other private insurers. Life insurers like Aviva, Bajaj Allianz, IDBI,
Max Life, Sahara and SBI Life insurance are more solvency-friendly than other insurers
.Bajaj Allianz and ICICI Prudential Return on Asset Measurements sounds good.
9. (Dar & Bhat, 2015) evaluate the financial statements and soundness of selected public and
private life insurance companies. The statistical findings of the analysis reveals that there are
significant statistical variations in the capital adequacy, revenue, profitability and liquidity
roles in selected insurers of public and private life. The overall result reveals that the capital

16 | P a g e
adequacy among selected private life insurers is much greater than the average amount of
capital of public life insurer. But the public life insurers surpass the private life insurers in
their profitability in the analysis period. The study also showed that public life insurers had a
higher liquidity in relation to private life insurers during the examined period.
10. (Solanki, 2016) examined the profitability of life insurance companies. For measuring the
profitability of the companies various ratios were calculated. The study shows that the private
sector life insurances companies should strive to increase its business by issuing more and
more policies in order to retain its market share in the competitive scenario.
11. ( Gour & Gupta , 2012) determined the solvency ratio of Indian Life insurance
companies for the period of 3 years from 2009-10 to 2011-12. It analysed whether
performance of different companies was similar or there was any significant difference. On
the basis of solvency ratio, ranks were assigned to different companies which showed that
ICICI found the best among selected companies of industry followed by Birla Sun Life, SBI,
HDFC and LIC. The paper also observed that solvency of life insures depend on returns
received from total investible funds and interest rate.
12 (Vasavi & Reddy, 2020) analysed that there is a significant difference in the earnings and
profitability performance of ICICI Prudential Life Insurance and SBI Life Insurance. The
findings suggested that ICICI Prudential Life Insurance outperformed SBI Life Insurance for
two indicators of the three indicators chosen for the report. ICICI Prudential Life Insurance
has shown itself to be a more stable insurer by having a higher mean valuation for the income
on investments ratio and return on equity ratio. Although ICICI Prudential Life Insurance has
taken SBI Life Insurance’s lead over the whole study period in retaining the higher
investment earnings ratio, it is evident that its results include a persistent decrease in its
investment earnings ratio.
13. (Neelaveni, 2012) evaluated the performance of five life insurance companies in the
period of 2002-03 in terms of various plans and policies on the basis of annual growth rate.
The study concluded that LIC being the public sector insurance provider was lagging behind
due to competition faced by private insurers whereas in terms of financial aspects, private life
insurance providers were doing well.
17 | P a g e
2.2 INTERNATIONAL REVIEWS:
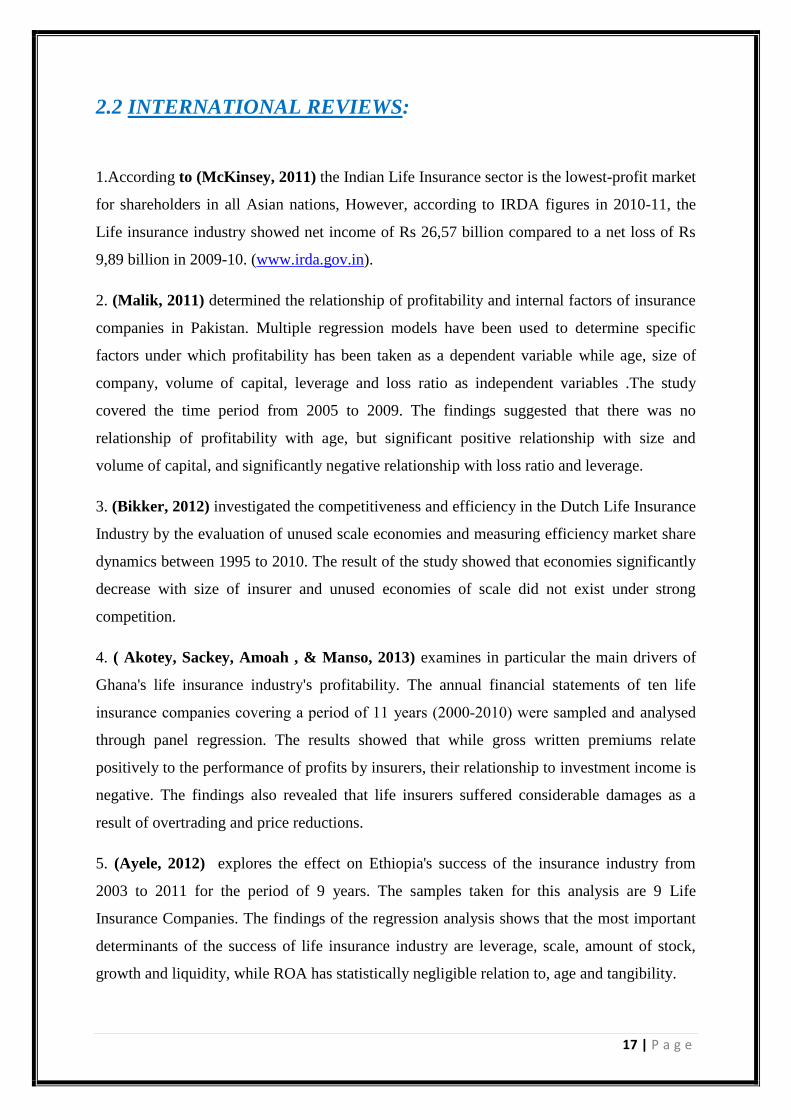
1.According to (McKinsey, 2011) the Indian Life Insurance sector is the lowest-profit market
for shareholders in all Asian nations, However, according to IRDA figures in 2010-11, the
Life insurance industry showed net income of Rs 26,57 billion compared to a net loss of Rs
9,89 billion in 2009-10. (www.irda.gov.in).
2. (Malik, 2011) determined the relationship of profitability and internal factors of insurance
companies in Pakistan. Multiple regression models have been used to determine specific
factors under which profitability has been taken as a dependent variable while age, size of
company, volume of capital, leverage and loss ratio as independent variables .The study
covered the time period from 2005 to 2009. The findings suggested that there was no
relationship of profitability with age, but significant positive relationship with size and
volume of capital, and significantly negative relationship with loss ratio and leverage.
3. (Bikker, 2012) investigated the competitiveness and efficiency in the Dutch Life Insurance
Industry by the evaluation of unused scale economies and measuring efficiency market share
dynamics between 1995 to 2010. The result of the study showed that economies significantly
decrease with size of insurer and unused economies of scale did not exist under strong
competition.
4. ( Akotey, Sackey, Amoah , & Manso, 2013) examines in particular the main drivers of
Ghana's life insurance industry's profitability. The annual financial statements of ten life
insurance companies covering a period of 11 years (2000‐2010) were sampled and analysed
through panel regression. The results showed that while gross written premiums relate
positively to the performance of profits by insurers, their relationship to investment income is
negative. The findings also revealed that life insurers suffered considerable damages as a
result of overtrading and price reductions.
5. (Ayele, 2012) explores the effect on Ethiopia's success of the insurance industry from
2003 to 2011 for the period of 9 years. The samples taken for this analysis are 9 Life
Insurance Companies. The findings of the regression analysis shows that the most important
determinants of the success of life insurance industry are leverage, scale, amount of stock,
growth and liquidity, while ROA has statistically negligible relation to, age and tangibility.
18 | P a g e
6. In (Greene & Segal , 2004) Research 'Profitability and Economical efficiency in the U.S.
Life insurance industry' the relationship between cost inefficiency and sustainability has been
discussed in the US Life Insurance Industry. An established, dynamic life insurance market
can be the primary engine of sustainability and cost-effectiveness. The study indicates that
cost inefficiency is significant in comparison to profits in the life insurance sector and that
inefficiencies are adversely correlated with performance ratio including equity income.
7. (Smajla, 2014) highlighted Croatian insurance firms level of financial well-being using
CARAMEL Model. This research is being conducted in Croatia on 24 insurance
undertakings. The study found that company liquidity ratios were not good and suggests that
the health of the insurance firms capital adequacy and liquidity indicators be taken into
account by the Croatian regulatory bodies.

19 | P a g e
CHAPTER 3: RESEARCH
METHODOLOGY
3.1 Objectives of the Study
3.2 Research Hypothesis
3.3 Scope of the Study
3.4 Research Design
3.5 Limitation of the study
20 | P a g e
3.1 OBJECTIVES OF THE STUDY:
The main objective of the present study is to study the financial performance of SBI and
ICICI Prudential life insurance companies. The other objectives of the present study are the
followings.
I. To evaluate the financial soundness, business efficiency and overall performance of SBI
Life Insurance and ICICI Prudential Life Insurance.
II. To analyse the solvency, profitability and liquidity position of SBI Life Insurance and
ICICI Prudential Life Insurance for last three years (i.e. FY 2018 to FY 2020).
3.2 RESEARCH HYPOTHESIS:
H0: There is no significant difference between Current Ratio of SBI Life Insurance and
ICICI Prudential Life Insurance.
3.3 SCOPE OF THE STUDY:
The present study is based on secondary data, which has been extracted from different
websites, National and International articles as well as annual reports of ICICI Prudential Life
Insurance and SBI Life Insurance. To analyse the quantitative data, the ratio analysis has
been used. For the purpose of the present study, two renowned private life insurance
companies in India namely, ICICI Prudential Life Insurance and SBI Life Insurance are
selected. This study aims to examine the profitability performance of ICICI Life and SBI
Life during the period 2017-18 to 2019-2020.
21 | P a g e
3.4 RESEARCH DESIGN:
3.4.1 SAMPLE OF THE STUDY:
The sample for this study includes 2 Indian life insurers namely, ICICI Prudential Life Insurance and
SBI Life Insurance.
3.4.2 DURATION OF THE STUDY:
The research analyses the data for 3 years from 2017-18 to 2019-20
3.4.3 SOURCE OF DATA:
This study mainly depends on the secondary data. The relevant and required data were
collected from the text books, websites, National and International articles, as well as annual
reports of ICICI Prudential Life Insurance and SBI Life Insurance.
3.4.4 TOOLS and TECHINIOUE:
The present study is an analytical study. For the analysis of data in the form of various
profitability ratios, liquidity ratio, Persistency Ratio, Solvency Ratio and the statistical tools
like T-Test have been employed.
3.5 LIMITATION OF THE STUDY:
The data collected for the study depends on published financial statements of the
companies which may incorporate some drawbacks.
The horizon of the study merely confined to very less number of variables as the
determinants of insurance company's profitability and measuring financial
performance without considering any overall performance measurement tool.
The data which has been used for the study mainly secondary data, so limitation of
secondary data remains with it and also applies to this study.
The Financial statement study is based on only three years.
22 | P a g e
CHAPTER 4: DATA
REPRESENTATION AND ANALYSIS
1.1 Data Representation & Interpretation
1.2 Hypothesis Testing

23 | P a g e
4.1 DATA REPRESENTATION AND INTERPRETATION:
4.4.1 LIQUIDITY RATIOS:
Liquidity is a very critical part of a business. Liquidity is required for a business to meet its
short term obligations. A higher liquidity ratio represents that the company is highly rich in
cash.
Liquidity ratios determine how quickly a company can convert the assets and use them for
meeting the dues that arise. The higher the ratio, the easier is the ability to clear the debts and
avoid defaulting on payments.
This is a very important criterion that creditors check before offering short term loans to the
business. An organisation which is unable to clear dues results in creating impact on the
creditworthiness and also affects credit rating of the company.
A. Current Ratios – Current Ratio also known as the working capital ratio is the
most widely used ratio. The current ratio is a measure of a company’s ability to pay off the
obligations within the next twelve months. This ratio is used by creditors to evaluate whether
a company can be offered short term debts. Thus, Current Ratio is a measurement of financial
health of enterprise.
Computation: The formula for calculating Current Ratio is:
The ideal level of Current Ratio is 2:1. The ratio is considered as safe margin of solvency due
to the fact that if the current assets are reduced to half, then also the creditors will be able to
get their payments in full.
Current Ratio = Current Assets
Current Liabilities

24 | P a g e
Significance of Current Ratio
This financial metric helps to determine a company’s immediate financial standing.
A higher ratio often indicates greater liquidity and more stability.
The financial tool helps to understand a firm’s working capital requirement more
effectively.
It comes in handy for making an informed investment-related decision.
GRAPH 1-CURRENT RATIO
1.83 1.781.93
0.790.91
1.15
0
0.5
1
1.5
2
2.5
Mar-18 Mar-19 Mar-20
YEARS
SBI LIFE INSURANCE
ICICI PRUDENTIAL LIFEINSURANCE
YEAR SBI LIFE INSURANCE ICICI PRUDENTIAL
LIFE INSURANCE
MAR 2018 1.83
0.79
MAR 2019 1.78
0.91
MAR 2020 1.93
1.15
TABLE 1 - CURRENT RATIO

25 | P a g e
Interpretation:
Graph 1 depicts that the current ratio is fluctuating during the study period in the case
of SBI Life Insurance. A considerable decline in the current ratio from 1.83 in FY
2018 to 1.78 in FY 2019 and an increase in the ratio from 1.78 in FY 2019 to 1.93 in
FY 2020 can be observed from the graph whereas there is a constant increase in the
current ratio of ICICI Prudential Life Insurance from FY 2018 to FY 2020 i.e. from
0.79 to 1.15 respectively.
The Current ratio is higher in SBI Life Insurance than ICICI Prudential Life Insurance
for all the years during the study period.
B. Quick Ratios- Quick Ratio also known as Liquid Ratio is used to determine whether a
company or a business has enough liquid assets which are able to be instantly converted into
cash to meet short term financial obligations.
Computation: The formula for calculating Quick Ratio is:
Quick ratio of 1:1 is an accepted standard, since for every rupee of current liabilities, there is a rupee
of quick assets.
Significance of Quick Ratio:
It is precisely an indicator of a company’s ability or limitation in discharging its debts and
obligations. A company’s lenders, suppliers and investors rely on quick ratio to determine if
it has enough liquid assets for discharging its short-term liabilities.
Quick Ratio = Quick Assets
Current Liabilities

26 | P a g e
GRAPH 2- QUICK RATIO
Interpretation:
Graph 2 depicts that the quick ratio is fluctuating during the study period in the case
of SBI Life Insurance. A considerable decline in the quick ratio from 1.83 in FY 2018
to 1.78 in FY 2019 and an increase in the ratio from 1.78 in FY 2019 to 1.93 in FY
2020 can be observed from the graph whereas there is a constant increase in the quick
ratio of ICICI Prudential Life Insurance from FY 2018 to FY 2020 i.e. from 0.79 to
1.15 respectively.
1.83 1.781.93
0.790.91
1.15
0
0.5
1
1.5
2
2.5
Mar-18 Mar-19 Mar-20
YEARS
SBI LIFE INSURANCE
ICICI PRUDENTIAL LIFEINSURANCE
YEAR SBI LIFE INSURANCE ICICI PRUDENTIAL
LIFE INSURANCE
MAR 2018
1.83
0.79
MAR 2019
1.78
0.91
MAR 2020
1.93
1.15
TABLE 2 - QUICK RATIO

27 | P a g e
The Quick ratio is higher in SBI Life Insurance than ICICI Prudential Life Insurance
for all the years during the study period.
4.4.2 PROFITABILITY RATIOS:
The primary objective of each business enterprise is to earn profits. In fact profit earning is
considered essential not only for the survival of the business but is also required for its
expansion and diversification. Profitability ratios are a type of accounting ratio that helps in
determining the financial performance of business at the end of an accounting period.
Profitability ratios show how well a company is able to make profits from its operations.
Net Profit Ratio (%) – This ratio establishes the relationship in terms of
percentage between Net Profit and Revenue from Operations, i.e., Net Sales. It
shows the percentage of Net Profit earned on Revenue from Operations.
Computation: The formula for calculating Net Profit Ratio is:
Higher the net profit ratio, better the business.
Significance of Net Profit Ratio:
Investors, shareholders and business owners can review the firm’s net profit margin to
analyse its growth trends effectively.
Net Profit Ratio is an indicator of overall efficiency of the business.
Net Profit Ratio = Net Profit x100
Revenue from Operations

28 | P a g e
GRAPH 3- NET PROFIT RATIO (%)
Interpretation:
Graph 3 depicts that there is a considerable decline in the Net Profit Ratio from
89.77% in FY 2018 to 73.33% in FY 2020 in the case of SBI Life Insurance and from
88.57% in FY 2018 to 40.35% in FY 2020 in the case of ICICI Prudential Life
Insurance.
The Net Profit Ratio is higher in SBI Life Insurance than ICICI Prudential Life
Insurance for all the years during the study period.
89.77 88.2
73.33
88.57
66.36
40.35
0
10
20
30
40
50
60
70
80
90
100
Mar-18 Mar-19 Mar-20
YEARS
SBI LIFE INSURANCE
ICICI PRUDENTIAL LIFEINSURANCE
YEAR SBI LIFE INSURANCE ICICI PRUDENTIAL
LIFE INSURANCE
MAR 2018
89.77
88.57
MAR 2019
88.20
66.36
MAR 2020
73.33
40.35
TABLE 3-NET PROFIT RATIO (%)
29 | P a g e
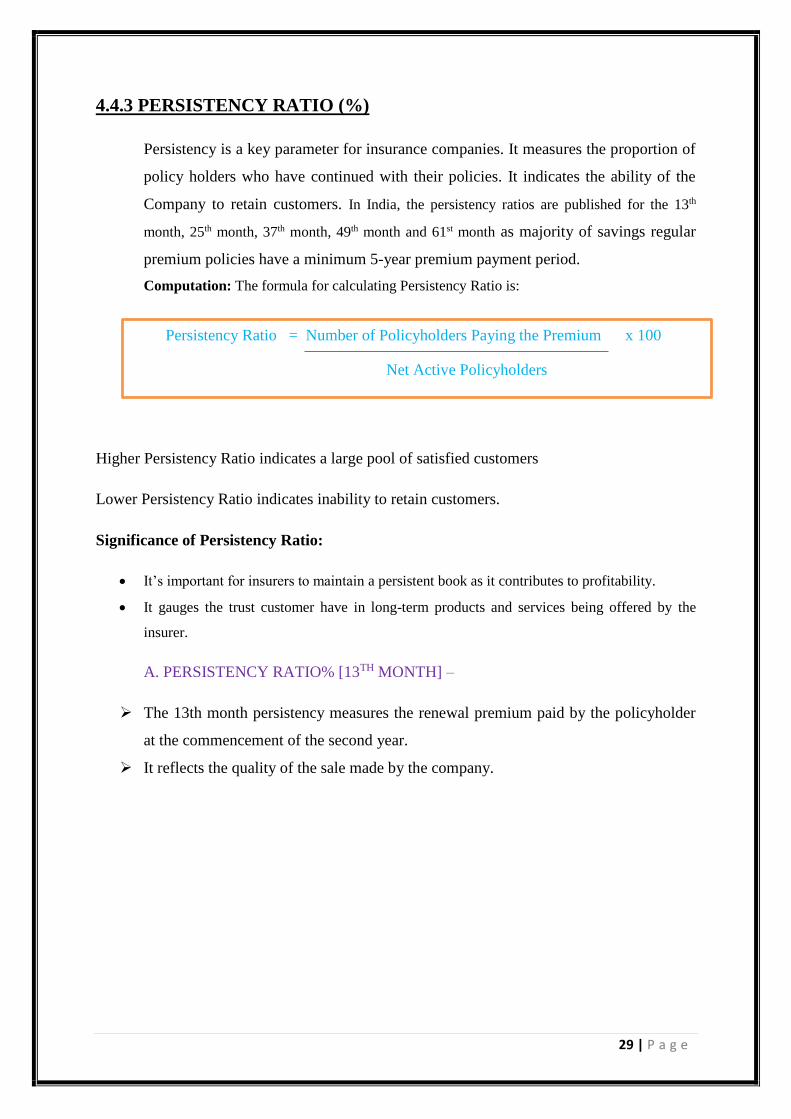
4.4.3 PERSISTENCY RATIO (%)
Persistency is a key parameter for insurance companies. It measures the proportion of
policy holders who have continued with their policies. It indicates the ability of the
Company to retain customers. In India, the persistency ratios are published for the 13th
month, 25th month, 37th month, 49th month and 61st month as majority of savings regular
premium policies have a minimum 5-year premium payment period.
Computation: The formula for calculating Persistency Ratio is:
Higher Persistency Ratio indicates a large pool of satisfied customers
Lower Persistency Ratio indicates inability to retain customers.
Significance of Persistency Ratio:
It’s important for insurers to maintain a persistent book as it contributes to profitability.
It gauges the trust customer have in long-term products and services being offered by the
insurer.
A. PERSISTENCY RATIO% [13TH MONTH] –
The 13th month persistency measures the renewal premium paid by the policyholder
at the commencement of the second year.
It reflects the quality of the sale made by the company.
Persistency Ratio = Number of Policyholders Paying the Premium x 100
Net Active Policyholders
30 | P a g e
GRAPH 4- PERSISTENCY RATIO % [13TH MONTH]
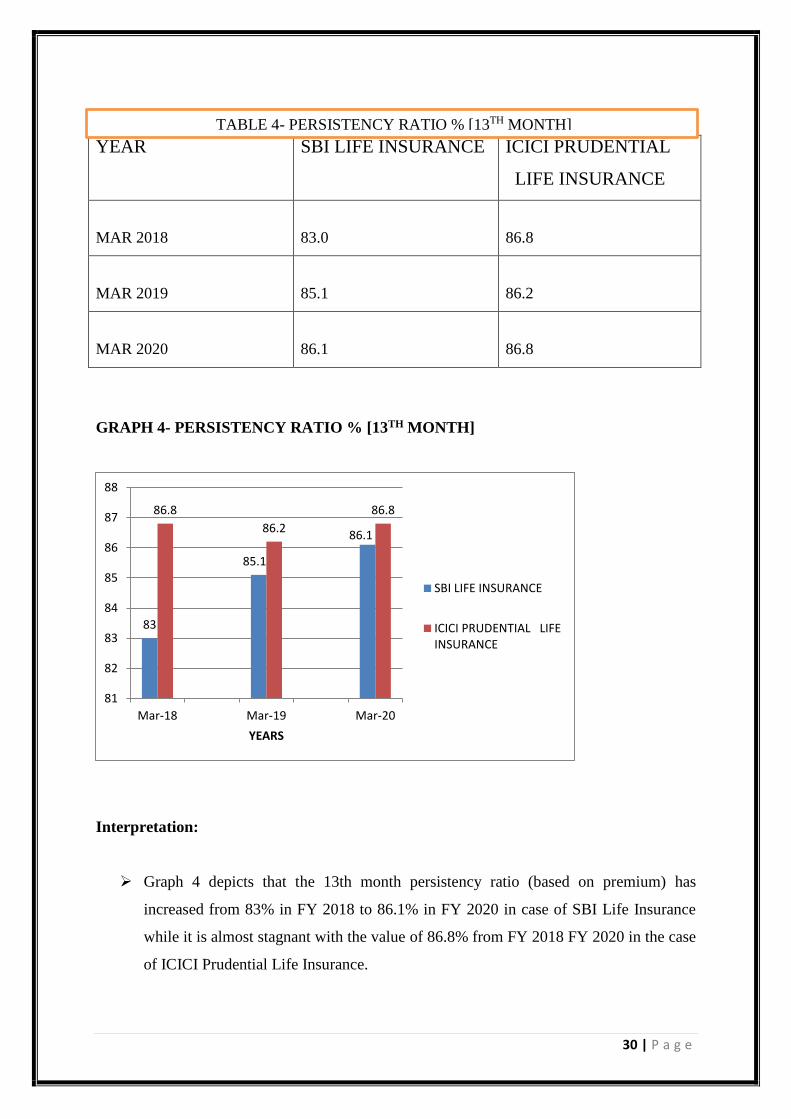
Interpretation:
Graph 4 depicts that the 13th month persistency ratio (based on premium) has
increased from 83% in FY 2018 to 86.1% in FY 2020 in case of SBI Life Insurance
while it is almost stagnant with the value of 86.8% from FY 2018 FY 2020 in the case
of ICICI Prudential Life Insurance.
YEAR SBI LIFE INSURANCE ICICI PRUDENTIAL
LIFE INSURANCE
MAR 2018
83.0
86.8
MAR 2019
85.1
86.2
MAR 2020
86.1
86.8
TABLE 4- PERSISTENCY RATIO % [13TH MONTH]
83
85.1
86.1
86.8
86.2
86.8
81
82
83
84
85
86
87
88
Mar-18 Mar-19 Mar-20
YEARS
SBI LIFE INSURANCE
ICICI PRUDENTIAL LIFEINSURANCE

31 | P a g e
The 13th month persistency ratio is higher in ICICI Prudential Life Insurance than
SBI Life Insurance for all the years during the study period.
B. PERSISTENCY RATIO% [49TH MONTH] -
The 49th month persistency measures the renewal premium paid by the policyholder
at the commencement of the fourth year.
The 49th month tells about the ability of the Insurance Companies to retain their
customers.
GRAPH 5- PERSISTENCY RATIO % [49TH MONTH]
63.9
66.4
67.3
64.2
65
67.3
62
63
64
65
66
67
68
Mar-18 Mar-19 Mar-20
YEARS
SBI LIFE INSURANCE
ICICI PRUDENTIAL LIFEINSURANCE
YEAR SBI LIFE INSURANCE ICICI PRUDENTIAL
LIFE INSURANCE
MAR 2018
63.9
64.2
MAR 2019
66.4
65.0
MAR 2020
67.3
67.3
TABLE 5- PERSISTENCY RATIO % [49TH MONTH]
RATIO

32 | P a g e
Interpretation:
Graph 5 depicts that the 49th month persistency ratio (based on premium) has
increased from 63.9% in FY 2018 to 67.3% in FY 2020 in case of SBI Life Insurance
and from 64.2% in FY 2018 to 67.3% in FY 2020 in the case of ICICI Prudential Life
Insurance.
The 49th month persistency ratio is lower in SBI Life Insurance in the FY 2018, it
becomes higher than ICICI Prudential Life Insurance in the FY 2019 and then
becomes equal to ICICI Prudential Life Insurance in the FY 2020
4.4.4 SOLVENCY RATIO (%)
Solvency is a regulatory measure of capital adequacy. It is critical in determining any
organisation’s ability to meet future contingencies and fund growth plans. It defines how
good or bad an insurance company’s financial situation is on defined solvency norms. IRDAI
mandates a minimum solvency ratio of 150% to minimise bankruptcy risk. (Khatri, 2017)
Computation: The formula for calculating Persistency Ratio is:
Higher the solvency ratio, the greater the chances of policyholders claim getting paid.
Lower Solvency ratio indicates inability of the Company to pay claims and meet future
contingencies.
Significance of Solvency Ratio:
Solvency ratio is an indicator of a company’s financial capacity to meet both short-
term and long-term liabilities
Solvency ratio helps identify whether the company has enough buffer to settle all
claims in extreme situations.
Solvency Ratio = Available Capital
Required Capital

33 | P a g e
GRAPH 6- SOLVENCY RATIO %
Interpretation:
Graph 6 depicts that the solvency ratio of SBI Life Insurance witnessed an increasing
trend from 206% in the period 2017- 2018 to 213% in the period 2018- 2019, but in
the period 2019- 2020 that trend got reversed and the ratio declined to 195% whereas
there is a constant decrease in the solvency ratio of ICICI Prudential Life Insurance
from 252% in FY 2018 to 194% in FY 2020.
206 213
195
252
215
194
0
50
100
150
200
250
300
Mar-18 Mar-19 Mar-20
YEARS
SBI LIFE INSURANCE
ICICI PRUDENTIAL LIFEINSURANCE
YEAR SBI LIFE INSURANCE ICICI PRUDENTIAL
LIFE INSURANCE
MAR 2018
206
252
MAR 2019
213
215
MAR 2020
195
194
TABLE 6- SOLVENCY RATIO (%)

34 | P a g e
The Solvency ratio is higher in ICICI Prudential Life Insurance for the FY 2018 and
FY 2019 by 46% and 2% respectively whereas it is lower than SBI Life Insurance for
the FY 2020 by 1%.
4.2 HYPOTHESIS TESTING:
4.2.1 T –TEST
SBI LIFE
INSURANCE
ICICI PRUDENTIAL
LIFE INSURANCE
Mean 1.846667 0.95
Variance 0.005833 0.0336
Observations 3 3
Pearson Correlation 0.785714
Hypothesized Mean Difference 0
Df 2
t Stat 11.76255
P(T<=t) one-tail 0.003575
t Critical one-tail 2.919986
P(T<=t) two-tail 0.00715
t Critical two-tail 4.302653
Results
Since p is less than p< 0.05, H0 is rejected and hence it is proved that there is a significant
difference between Current Ratio of SBI Life Insurance and ICICI Life Insurance.

35 | P a g e
CHAPTER 5: RESULTS AND
DISCUSSIONS
5.1 Major Findings
5.2 Discussions & Suggestions
5.3 Conclusion

36 | P a g e
5.1 MAJOR FINDINGS:
The Insurance Sector is growing and grooming from subsequent past years
considering their achievements and financial reports of both the companies.
The Current Ratio of ICICI Prudential Life Insurance indicates that current liabilities
of the enterprise are greater than their current asset which means that the enterprise
would be unable to meet its short –term financial obligations if they become due.
ICICI Prudential is not in a good financial health.
The Current Ratio of SBI Life Insurance indicates that the current liabilities of the
enterprise are lower than their current asset which means that the enterprise would be
able to meet its short –term financial obligations if they become due. SBI Life
Insurance gives the evidence of sound liquidity position.
SBI Life Insurance has higher Current Ratio than ICICI Prudential Life Insurance
during the study period which shows that SBI Life Insurance has better Liquidity
Position than ICICI Prudential Life Insurance.
The Quick Ratios and Current Ratios of both the companies are same which means
that there are no inventories and prepaid expenses in both the firms.
There is a decline in the Net Profit Ratio during the study period of 3 years which
shows deterioration in the operational efficiency of both the firms.
The Net Profit Ratio is higher in SBI Life Insurance than ICICI Prudential Life
Insurance during the study period which shows that SBI Life Insurance is performing
its operations more efficiently than ICICI Prudential Life Insurance.
The 13th month persistency ratios are improved from what they were in FY18 which
reflects that there is a rise in the sale of both the companies Insurance policies.
ICICI Prudential Life Insurance has higher 13th month persistency ratio than SBI Life
Insurance during the study period which shows that there are more sales of ICICI
Prudential Life Insurance than SBI Life Insurance.
The 49th month persistency ratios are improved from what they were in FY18 which
implies that the associated policyholders are satisfied with the customer service,
customer loyalty, product utility, post sales service, returns on their product, product
portfolio, etc. and are renewing their policies even after commencement of the fourth
year.
37 | P a g e
Both the companies are at equal position in terms of 49th month persistency ratio for
the FY 2020 which shows that both the companies have same ability to retain their
customers in the particular year.
Both the Companies have a solvency ratio more than the mandatory requirement of
150% during the study period which shows that both the companies have enough
buffers to settle all claims in extreme situations.
Since p is less than p< 0.05, H0 is rejected and hence it is proved that there is a
significant difference between Current Ratio of SBI Life Insurance and ICICI Life
Insurance.
5.2 DISCUSSION AND SUGGESTIONS:
It is suggested to ICICI Prudential Life Insurance to raise extra finance to meet their
short-term financial obligations.
In my opinion, it will be beneficial to both the companies if they cut down their
expenses to increase their net profit as the study shows decline in their Net Profit
Ratio during the study period of 3 years.
Both the companies should look for the factors which are leading to deterioration of
their operational efficiency and taking necessary measures to counter them.
Since p is less than p< 0.05, H0 is rejected and hence it is proved that there is a
significant difference between Current Ratio of SBI Life Insurance and ICICI
Prudential Life Insurance.
5.3 CONCLUSION:
The study has aimed to examine the financial performance of Indian life insurance companies
i.e. SBI Life Insurance and ICICI Prudential Life Insurance through analysing the
determinants of their profitability. Performance of companies can affect economy as a whole
and therefore it requires empirical analysis to judge the performance. For measuring financial
performance, financial ratios such as Liquidity Ratio, Profitability Ratio, Persistency Ratio
and Solvency Ratio have been calculated. T-Test was also conducted to check if there was a
significant difference between the Current Ratio of SBI Life Insurance and ICICI Prudential
Life Insurance .The study evaluated that SBI Life Insurance have sound liquidity position and
ICICI Prudential Life Insurance is not in a good financial health. Profitability measure of SBI
Life Insurance is better than ICICI Prudential Life Insurance. But, there is a decline in the
38 | P a g e
Profitability Ratio during the study period which shows deterioration in the operational
efficiency of both the firms. Hence, both the firms needs to adopt immediate corrective
measures to arrest the downfall in the ratio .As far as 13th persistency ratio is concerned the
performance of ICICI Prudential Life Insurance is better than that of SBI Life Insurance but it
can be seen that SBI Life Insurance is trying to increase their ratio over the previous years
and has reached very near to the ratio of ICICI Life Insurance in FY 2020.Both the
companies are at equal position in terms of 49th month persistency ratio for the FY 2020
which shows that SBI Life Insurance is equally cable to retain their customers than that of
ICICI Prudential Life Insurance and is better in FY 2019 . From the analysis of T-Test
results, it is clear that there is a significant difference between Current Ratio of SBI Life
Insurance and ICICI Prudential Life Insurance .Thus, in the light of above findings, it can be
concluded that SBI Life Insurance is performing better than ICICI Prudential Life Insurance.

39 | P a g e
BIBLIOGRAPHY
Works Cited
Akotey, J. O., Sackey, F. G., Amoah , L., & Manso, R. F. (2013, May 17). The financial performance
of life insurance companies in Ghana. Journal of Risk Finance, 14(3), 286-302.
Bawa, D. K., & Chattha , S. (2013, November). Financial Performance of Life Insurers in Indian
Insurance Industry . Pacific Business Review International, 6(5), 44-52.
Gour, B., & Gupta , M. C. ( 2012, June). A Review on Solvency Margin in Indian Insurance
Companies. International Journal of Recent Research and Review, II, 43-47.
Mishra, K. K. (2015, September 9). Comparative Study Of Public and Private Life Insurance
Companies in India. International Journal of Research in Finance and Marketing, 5, 16-19.
Indian Insurance Industry Report . (2021, January). Retrieved from India Brand Equity Foundation:
https://www.ibef.org/industry/insurance-sector-india.aspx
A Brief Overview of the Insurance Sector. (n.d.). Retrieved from Investopedia:
https://www.investopedia.com/ask/answers/051915/how-does-insurance-sector-work.asp
Ayele, A. G. (2012, May). Factors Affecting Profitability of Insurance Companies in Ethiopia: Panel
Evidence. ” Doctoral Thesis, Addis Ababa University.
Bikker, J. A. (2012, November). Performance of the life insurance industry under pressure: efficiency,
competition and consolidation. Utrecht School of Economics, 12-19.
Bodla, D. B., Bodla, S., & Tondon, D. (2017 , September –October ). Profitability Performance of
Life Insurance Companies – A Study in Indian Context . Research gate International Journal
of Computing and Business Research, 7( 3).
Dar , S. A., & Bhat, J. A. (2015, April). A Comparative Evaluation of Financial Performance and
Soundness of Selected Public and Private Life Insurers in India. Pacific Business Review
International, 7(10), 55-64.
Dr.Parmasivan. (2015). A Comparative Study of Public and Private Life Insurance Companies in
India. 1(7), 15-18.
Greene, W. H., & Segal , D. (2004, May ). Profitability and Efficiency in the U.S. Life Insurance
Industry. Journal of Productivity Analysis, 21, 229–247.

40 | P a g e
Gulati , N. C., & Jain, C. M. (2011, OCTOBER ). Comparative Analysis of the Performance of All
the Players of the Indian Life Insurance Industry. VSRD International Journal of Business &
Management Research, 1( 8), 561-569.
Joshi, M. C., & Takodia, T. M. (2017, January 1). A Study of Recent Trend and Awareness &
Preferences in Life Insurance Sector in India. Research Gate, 144-159.
Khatri, Y. (2017, June 27). 6 ratios to know when buying insurance. Retrieved from The Economics
Times: https://economictimes.indiatimes.com/wealth/insure/6-ratios-to-know-when-buying-
insurance/articleshow/59297010.cms?utm_source=contentofinterest&utm_medium=text&ut
m_campaign=cppst
Kumari, T. H. (2013). Performance Evaluation of Indan Life Insurance Industry in Post
Liberalisation. International Journal of Social Sciences Arts and Humanities, 1, 7-14.
Life Insurance. (n.d.). Retrieved from Aegon Life: https://www.aegonlife.com/insurance-basics/life-
insurance/what-life-insurance
Malik, H. (2011, November). Determinants of Insurance Companies Profitability: An Analysis of
Insurance Sector of Pakistan . Academic Research International, 1(3), 315-321.
McKinsey. (2011). Retrieved from http://www.Thehindubusinessline.com/industry-and-
economy/banking/article2692453.ece.
Naidu, C. K., & Paramasivan, D. C. (2015, Sep). A Comparative Study of Public and Private Life
Insurance Companies in India. International Journal of Multidisciplinary Research Review,
pp. 15-18.
Neelaveni, V. (2012, March ). Financial Performance of Life Insurance Companies and Products .
Zenith International Journal of Business Economics & Management Research, 2(3 ), 233-
258.
Smajla, N. (2014). Measuring financial soundness of insurance companies by using CARAMELS
model–case of Croatia. Interdisciplinary Management Research, 10, 600-609.
Solanki, R. (2016, June). An Analytical Study Of Profitability Of Life Insurance Companies In India:
A Study Of Selected Private Sector Insurance Companies. Abhinav National Monthly
Refereed Journal of Research in Commerce & Management, 5(6), 8-12.
Vasavi, V., & Reddy, P. M. (2020). Earnings and Profitability Analysis of Life Insurance Companies-
Comparative Study of ICICI Prudential and SBI Life Insurance Companies. International
Management Review, 16(2), 76-84.

41 | P a g e
Websites:-
https://www.moneycontrol.com/financials/iciciprudentiallifeinsurancecompany/profit-
lossVI/IPL01#IPL01
https://www.moneycontrol.com/financials/sbilifeinsurancecompany/balance-sheetVI/SLI03
https://www.sbilife.co.in/sites/SBILife/Annual-Report/FY2019-
20/pdf/SBI%20Life%20IR%202020.pdf
https://www.iciciprulife.com/about-us/investor-relations/financial-information.html
https://en.wikipedia.org/wiki/ICICI_Prudential
https://en.wikipedia.org/wiki/SBI_Life_Insurance_Company
https://byjus.com/commerce/liquidity-ratio/
https://groww.in/p/current-ratio/
https://byjus.com/commerce/profitability-ratios/
Books: -
Management Accounting by Dr. S.P. Gupta and Dr. K.L. Gupta, Sahitya Bhawan
Publication.

42 | P a g e
ANNEXURE

43 | P a g e
SBI Life Insurance
Company Ltd.
Balance Sheet
------------------- in Rs. Cr. -------------------
Mar 20 Mar 19 Mar 18
12 months 12 months 12 moths
EQUITIES AND LIABILITIES
SHAREHOLDER'S FUNDS
Equity Share Capital 1,000.03 1,000.00 1,000.00
Total Share Capital 1,000.03 1,000.00 1,000.00
Reserves and Surplus 7,743.06 6,576.36 5,527.82
Total Reserves and Surplus 7,743.06 6,576.36 5,527.82
Total Shareholders Funds 8,743.08 7,576.36 6,527.82
NON-CURRENT LIABILITIES
Other Long Term Liabilities 80,374.58 74,829.34 62,069.86
Long Term Provisions 73,440.22 60,592.14 49,558.08
Total Non-Current Liabilities 153,814.81 135,421.48 111,627.95
CURRENT LIABILITIES
Other Current Liabilities 2,783.79 3,377.13 3,216.13
Short Term Provisions 238.51 358.88 348.54
Total Current Liabilities 3,022.30 3,736.01 3,564.67
Total Capital And Liabilities 165,580.19 146,733.85 121,720.44
ASSETS
NON-CURRENT ASSETS
Tangible Assets 567.99 563.37 581.29
Capital Work-In-Progress 13.19 31.85 0.00
Fixed Assets 581.18 595.22 581.29
Non-Current Investments 158,813.21 139,324.71 114,435.87
Long Term Loans And Advances 364.48 172.50 170.90
Total Non-Current Assets 159,758.88 140,092.44 115,188.06
CURRENT ASSETS
Current Investments 0.00 0.00 0.00
Cash And Cash Equivalents 1,423.23 2,420.63 2,644.63
Short Term Loans And Advances 4,398.08 4,220.78 3,887.75
Other Current Assets 0.00 0.00 0.00
Total Current Assets 5,821.31 6,641.41 6,532.37
Total Assets 165,580.19 146,733.85 121,720.44

44 | P a g e
SBI Life Insurance Company Ltd.
Profit & Loss Account (in Rs. Cr.)
Mar 20 Mar 19 Mar 18
12 months 12months
12
months INCOME
Revenue From Operations [Gross] 1,939.35 1,504.16 1,281.47
Less: Excise/Service Tax/Other Levies 0.00 0.00 0.00
Revenue From Operations [Net] 1,939.35 1,504.16 1,281.47
Total Operating Revenues 1,939.35 1,504.16 1,281.47
Other Income 6.79 13.54 11.47
Total Revenue 1,946.14 1,517.70 1,292.93
EXPENSES
Cost Of Materials Consumed 0.00 0.00 0.00
Operating And Direct Expenses 0.00 0.00 0.00
Changes In Inventories Of FG,WIP And Stock-In Trade 0.00 0.00 0.00
Employee Benefit Expenses 0.00 0.00 0.00
Finance Costs 0.00 0.00 0.00
Depreciation And Amortisation Expenses 0.39 0.62 0.30
Other Expenses 524.19 128.29 107.43
Total Expenses 532.59 144.83 108.47
Profit/Loss Before Exceptional, Extra Ordinary Items And Tax 1,413.55 1,372.86 1,184.46
Exceptional Items 0.00 0.00 0.00
Profit/Loss Before Tax 1,413.55 1,372.86 1,184.46
Tax Expenses-Continued Operations
Current Tax -8.63 46.07 34.07
Less: MAT Credit Entitlement 0.00 0.00 0.00
Deferred Tax 0.00 0.00 0.00
Tax For Earlier Years 0.00 0.00 0.00
Total Tax Expenses -8.63 46.07 34.07
Profit/Loss After Tax And Before Extra-Ordinary Items 1,422.18 1,326.80 1,150.39
Profit/Loss From Continuing Operations 1,422.18 1,326.80 1,150.39
Profit/Loss For The Period 1,422.18 1,326.80 1,150.39
OTHER ADDITIONAL INFORMATION
EARNINGS PER SHARE
Basic EPS (Rs.) 14.22 13.27 11.50
Diluted EPS (Rs.) 14.22 13.27 11.50
VALUE OF IMPORTED AND INDIGENIOUS RAW
MATERIALS STORES, SPARES AND LOOSE TOOLS Imported Raw Materials 0.00 0.00 0.00
Indigenous Raw Materials 0.00 0.00 0.00
STORES, SPARES AND LOOSE TOOLS
Imported Stores And Spares 0.00 0.00 0.00
Indigenous Stores And Spares 0.00 0.00 0.00
DIVIDEND AND DIVIDEND PERCENTAGE
Equity Share Dividend 0.00 200.00 200.00
Tax On Dividend 0.00 41.11 40.72
Equity Dividend Rate (%) 0.00 20.00 20.00

45 | P a g e
ICICI Prudential Life Insurance
Company Ltd.
Balance Sheet (in Rs. Cr.)
Mar 20
Mar 19
Mar 18
12 months 12 months 12 months
EQUITIES AND LIABILITIES
SHAREHOLDER'S FUNDS
Equity Share Capital 1,435.86 1,435.78 1,435.50
Total Share Capital 1,435.86 1,435.78 1,435.50
Reserves and Surplus 5,782.76 5,587.63 5,427.46
Total Reserves and Surplus 5,848.28 5,610.95 5,448.95
Total Shareholders Funds 7,284.14 7,046.74 6,884.45
NON-CURRENT LIABILITIES
Long Term Borrowings 0.00 0.00 0.00
Deferred Tax Liabilities [Net] 0.00 0.00 0.00
Other Long Term Liabilities 57,383.98 48,679.61 39,176.87
Long Term Provisions 88,036.75 103,699.85 92,312.36
Total Non-Current Liabilities 145,420.73 152,379.47 131,489.23
CURRENT LIABILITIES
Short Term Borrowings 0.00 0.00 0.00
Trade Payables 0.00 0.00 0.00
Other Current Liabilities 3,302.86 3,638.62 3,425.41
Short Term Provisions 27.53 25.51 22.18
Total Current Liabilities 3,330.39 3,664.13 3,447.60
Total Capital And Liabilities 156,035.26 163,090.33 141,821.28
ASSETS
NON-CURRENT ASSETS
Tangible Assets 457.27 462.76 404.48
Intangible Assets 0.00 0.00 0.00
Capital Work-In-Progress 20.35 12.86 17.58
Other Assets 0.00 0.00 0.00
Fixed Assets 477.62 475.62 422.06
Non-Current Investments 151,256.20 159,008.54 138,540.11
Deferred Tax Assets [Net] 0.00 0.04 0.05
Long Term Loans And Advances 463.09 270.19 145.06
Other Non-Current Assets 0.00 0.00 0.00
Total Non-Current Assets 152,196.90 159,754.39 139,107.28
CURRENT ASSETS
Current Investments 0.00 0.00 0.00
Inventories 0.00 0.00 0.00
Trade Receivables 0.00 0.00 0.00
Cash And Cash Equivalents 810.56 661.02 203.74
Short Term Loans And Advances 3,027.80 2,674.92 2,510.26
Other Current Assets 0.00 0.00 0.00
Total Current Assets 3,838.36 3,335.94 2,714.00
Total Assets 156,035.26 163,090.33 141,821.28
46 | P a g e
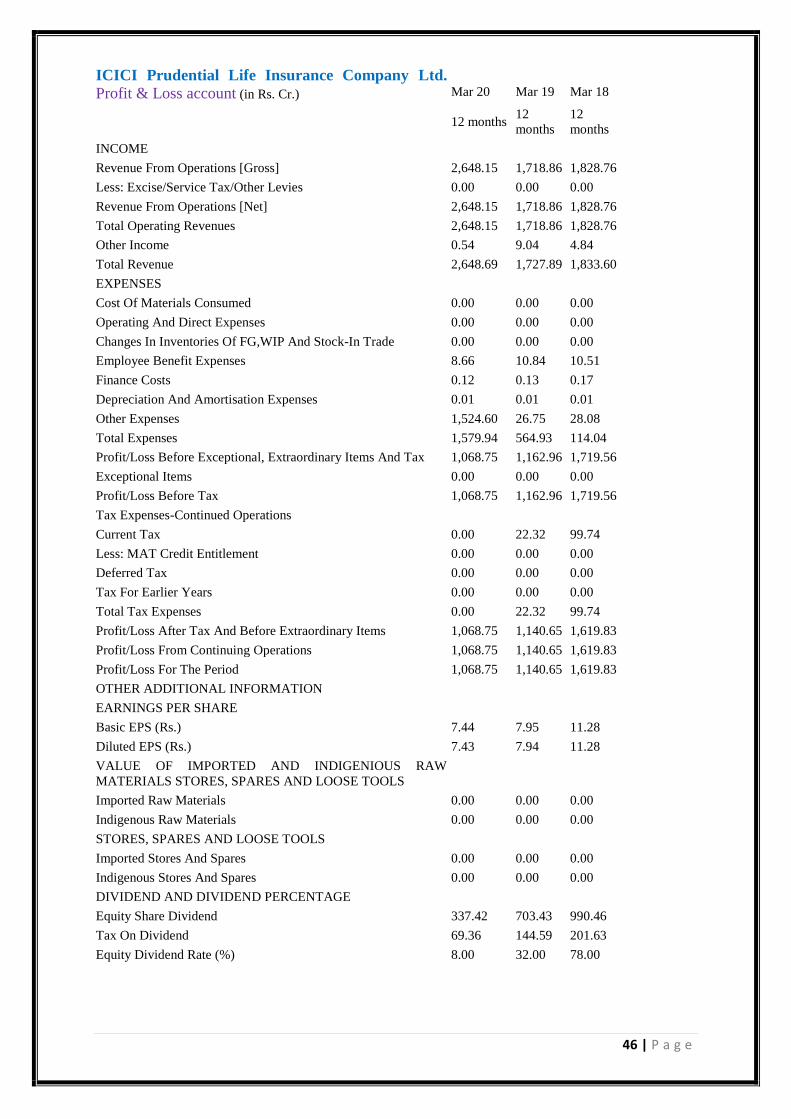
ICICI Prudential Life Insurance Company Ltd. Profit & Loss account (in Rs. Cr.)
Mar 20
Mar 19
Mar 18
12 months 12
months
12
months
INCOME
Revenue From Operations [Gross] 2,648.15 1,718.86 1,828.76
Less: Excise/Service Tax/Other Levies 0.00 0.00 0.00
Revenue From Operations [Net] 2,648.15 1,718.86 1,828.76
Total Operating Revenues 2,648.15 1,718.86 1,828.76
Other Income 0.54 9.04 4.84
Total Revenue 2,648.69 1,727.89 1,833.60
EXPENSES
Cost Of Materials Consumed 0.00 0.00 0.00
Operating And Direct Expenses 0.00 0.00 0.00
Changes In Inventories Of FG,WIP And Stock-In Trade 0.00 0.00 0.00
Employee Benefit Expenses 8.66 10.84 10.51
Finance Costs 0.12 0.13 0.17
Depreciation And Amortisation Expenses 0.01 0.01 0.01
Other Expenses 1,524.60 26.75 28.08
Total Expenses 1,579.94 564.93 114.04
Profit/Loss Before Exceptional, Extraordinary Items And Tax 1,068.75 1,162.96 1,719.56
Exceptional Items 0.00 0.00 0.00
Profit/Loss Before Tax 1,068.75 1,162.96 1,719.56
Tax Expenses-Continued Operations
Current Tax 0.00 22.32 99.74
Less: MAT Credit Entitlement 0.00 0.00 0.00
Deferred Tax 0.00 0.00 0.00
Tax For Earlier Years 0.00 0.00 0.00
Total Tax Expenses 0.00 22.32 99.74
Profit/Loss After Tax And Before Extraordinary Items 1,068.75 1,140.65 1,619.83
Profit/Loss From Continuing Operations 1,068.75 1,140.65 1,619.83
Profit/Loss For The Period 1,068.75 1,140.65 1,619.83
OTHER ADDITIONAL INFORMATION
EARNINGS PER SHARE
Basic EPS (Rs.) 7.44 7.95 11.28
Diluted EPS (Rs.) 7.43 7.94 11.28
VALUE OF IMPORTED AND INDIGENIOUS RAW
MATERIALS STORES, SPARES AND LOOSE TOOLS
Imported Raw Materials 0.00 0.00 0.00
Indigenous Raw Materials 0.00 0.00 0.00
STORES, SPARES AND LOOSE TOOLS
Imported Stores And Spares 0.00 0.00 0.00
Indigenous Stores And Spares 0.00 0.00 0.00
DIVIDEND AND DIVIDEND PERCENTAGE
Equity Share Dividend 337.42 703.43 990.46
Tax On Dividend 69.36 144.59 201.63
Equity Dividend Rate (%) 8.00 32.00 78.00
Related Documents