International Journal of Scientific & Engineering Research, Volume 6, Issue 8, August-2015 1182 ISSN 2229-5518 IJSER © 2015 http://www.ijser.org A Comparative Study of the Methods of Concrete Mix Design Using Crushed and Uncrushed Coarse Aggregates T.C. Nwofor, S. Sule and D.B. Eme Department of Civil Engineering, University of Port Harcourt, P.M.B 5323 Port Harcourt, Rivers State, Nigeria. Abstract: The study aims at comparing two methods of concrete mix design; The British Department of Environment Method and The American Concrete Institute Method, using the crushed and uncrushed coarse aggregates at various target strengths. A total of Forty-Five cubes were produced. Fifteen concrete cubes were produced with crushed aggregates (Granite) using the DOE method. Another fifteen cubes were produced with uncrushed coarse aggregates (Gravel) using the DOE method, while the remaining fifteen concrete cubes were produced with crushed aggregates using the ACI method. Each of these cube were produced at different mix strength M20, M30 and M50, according to IS 456:2000 and tested at different curing days; 7days, 14days and 24days respectively. The compressive strength values were determined at ages 7, 14 and 28 days curing periods respectively. Results obtained showed that the uncrushed aggregates gave a higher 28- days compressive strength compared to that obtained from the crushed aggregates, but the reverse was the case for M50 were the result obtained using the crushed aggregate gave a higher strength than that obtained from uncrushed aggregate. It was also found that using the DOE method, the overall result obtained gave some low and high strength values at some point or the other. The same goes also for the ACI method, an average of 36.2N/mm2 for M20, 45.6N/mm2 for M30 and 67.7N/mm2 for M50 was obtained at 28-days using the DOE method and an average of 33.9N/mm2for M20, 46.9N/mm2 for M30 and 73.35N/mm2 for M50 using the ACI at 28-days. The ACI did not make provision for uncrushed aggregate in its design method, implying that comparison could not be made in that regard. —————————— —————————— 1.0 Introduction oncrete is the second most consumed material worldwide by man after food and water [1]. It is obtained by mixing cement, fine aggregate, coarse aggregate and water in required proportions. The mixture when placed in forms and allowed to set hardens like rock. This hardening is caused by the chemical reaction between the water and the cement which results to concrete growing stronger with age. The strength, durability and other characteristics of concrete depend upon the properties of the constituent materials, proportion of mix, the methods of compaction and other controls during placing, compaction and curing. Concrete mix design, involves the determination of the proportions of the given constituents of concrete namely, cement, water, fine aggregates, and coarse aggregate and admixtures if any [2-7]. It is the process of specifying the mixture of the ingredients required to meet anticipated properties of fresh and hardened concrete [8]. This proportioning is governed by the performance of concrete in two states, namely, the plastic (fresh) state and the hardened state. If the plastic concrete is not workable, it cannot be placed and compacted, hence the property of workability becomes of very vital importance. Secondly, the compressive strength of the hardened concrete is generally considered to be an index of its other properties, depending upon many other factors, namely, quality and quantity of cement, water and aggregates, mixing, placing, compaction and curing. Concrete mix design is a well-established practice around the world. All developed countries as well as many developing countries, have standardized their concrete mix design methods. These methods are C IJSER

Welcome message from author
This document is posted to help you gain knowledge. Please leave a comment to let me know what you think about it! Share it to your friends and learn new things together.
Transcript

International Journal of Scientific & Engineering Research, Volume 6, Issue 8, August-2015 1182 ISSN 2229-5518
IJSER © 2015 http://www.ijser.org
A Comparative Study of the Methods of Concrete Mix Design Using Crushed and Uncrushed Coarse Aggregates
T.C. Nwofor, S. Sule and D.B. Eme
Department of Civil Engineering, University of Port Harcourt,
P.M.B 5323 Port Harcourt, Rivers State, Nigeria.
Abstract: The study aims at comparing two methods of concrete mix design; The British Department of Environment Method and The American Concrete Institute Method, using the crushed and uncrushed coarse aggregates at various target strengths. A total of Forty-Five cubes were produced. Fifteen concrete cubes were produced with crushed aggregates (Granite) using the DOE method. Another fifteen cubes were produced with uncrushed coarse aggregates (Gravel) using the DOE method, while the remaining fifteen concrete cubes were produced with crushed aggregates using the ACI method. Each of these cube were produced at different mix strength M20, M30 and M50, according to IS 456:2000 and tested at different curing days; 7days, 14days and 24days respectively. The compressive strength values were determined at ages 7, 14 and 28 days curing periods respectively. Results obtained showed that the uncrushed aggregates gave a higher 28-days compressive strength compared to that obtained from the crushed aggregates, but the reverse was the case for M50 were the result obtained using the crushed aggregate gave a higher strength than that obtained from uncrushed aggregate. It was also found that using the DOE method, the overall result obtained gave some low and high strength values at some point or the other. The same goes also for the ACI method, an average of 36.2N/mm2 for M20, 45.6N/mm2 for M30 and 67.7N/mm2 for M50 was obtained at 28-days using the DOE method and an average of 33.9N/mm2for M20, 46.9N/mm2 for M30 and 73.35N/mm2 for M50 using the ACI at 28-days. The ACI did not make provision for uncrushed aggregate in its design method, implying that comparison could not be made in that regard.
—————————— —————————— 1.0 Introduction
oncrete is the second most consumed material worldwide by man after food and water [1]. It is obtained by mixing cement, fine aggregate,
coarse aggregate and water in required proportions. The mixture when placed in forms and allowed to set hardens like rock. This hardening is caused by the chemical reaction between the water and the cement which results to concrete growing stronger with age. The strength, durability and other characteristics of concrete depend upon the properties of the constituent materials, proportion of mix, the methods of compaction and other controls during placing, compaction and curing. Concrete mix design, involves the determination of the proportions of the given constituents of concrete namely, cement, water, fine aggregates, and coarse aggregate and admixtures if any [2-7]. It is the process of specifying the mixture
of the ingredients required to meet anticipated properties of fresh and hardened concrete [8]. This proportioning is governed by the performance of concrete in two states, namely, the plastic (fresh) state and the hardened state. If the plastic concrete is not workable, it cannot be placed and compacted, hence the property of workability becomes of very vital importance. Secondly, the compressive strength of the hardened concrete is generally considered to be an index of its other properties, depending upon many other factors, namely, quality and quantity of cement, water and aggregates, mixing, placing, compaction and curing.
Concrete mix design is a well-established practice around the world. All developed countries as well as many developing countries, have standardized their concrete mix design methods. These methods are
C IJSER
International Journal of Scientific & Engineering Research, Volume 6, Issue 8, August-2015 1183 ISSN 2229-5518
IJSER © 2015 http://www.ijser.org
mostly based on empirical relations, charts, graphs and tables developed as an outcome of extensive experiments and investigations of locally available materials and all of those standards and methods follow the same basic trial and error principles. Some of the prevalent concrete mix design methods available are: ACI mix design method, USBR mix design method, British or DOE mix design method, ISI recommended guidelines. The British Department of Environment (DOE) method of concrete mix design is used in the United Kingdom and many other parts of the world including Nigeria. The method originates from the “Road-note” which was published in Greek Britain in 1950. The DOE method utilizes British test data obtained at the building research institute, the Transport and Road Research Institute and the British Cement Association. The aggregates used in the test conform to BS 812 [9] and the cements to BS 12 [10]. The American Concrete Institute (ACI) mix design method is one of the numerous methods of concrete mix design available today. It is widely used in US and is continually updated. Both methods are somehow similar, but with major difference in the method of estimating the relative proportions of fine and coarse aggregates.
The British Department of Environment (DOE) and the American Concrete Institute (ACI) methods are two different methods of concrete mix design amidst other methods, for construction work (Highways & Building) [11-12]. The aim of this research work is to examine the similarities and differences (if any) between the ACI and the DOE methods of concrete mix design, using crushed and uncrushed coarse aggregate at various target strength, and to determine how the different design methods affects overall results.
2.0 Materials and Method Cement
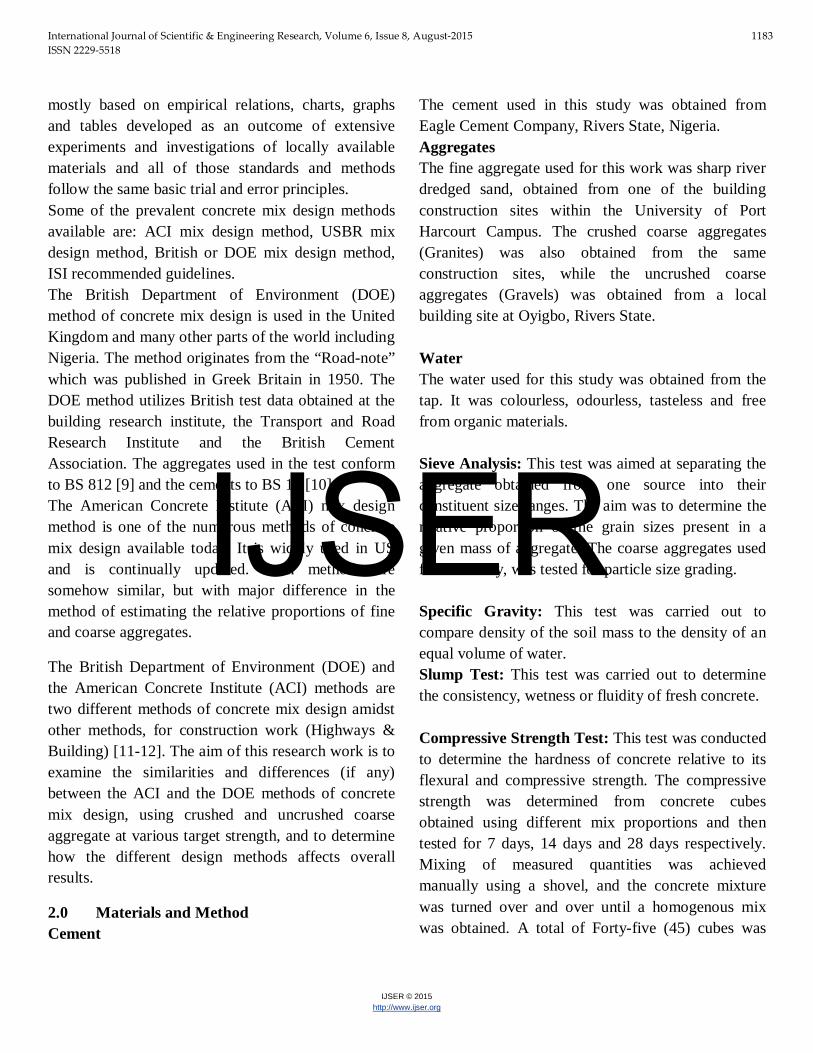
The cement used in this study was obtained from Eagle Cement Company, Rivers State, Nigeria. Aggregates The fine aggregate used for this work was sharp river dredged sand, obtained from one of the building construction sites within the University of Port Harcourt Campus. The crushed coarse aggregates (Granites) was also obtained from the same construction sites, while the uncrushed coarse aggregates (Gravels) was obtained from a local building site at Oyigbo, Rivers State. Water The water used for this study was obtained from the tap. It was colourless, odourless, tasteless and free from organic materials. Sieve Analysis: This test was aimed at separating the aggregate obtained from one source into their constituent size ranges. The aim was to determine the relative proportion of the grain sizes present in a given mass of aggregate. The coarse aggregates used for this study, was tested for particle size grading. Specific Gravity: This test was carried out to compare density of the soil mass to the density of an equal volume of water. Slump Test: This test was carried out to determine the consistency, wetness or fluidity of fresh concrete. Compressive Strength Test: This test was conducted to determine the hardness of concrete relative to its flexural and compressive strength. The compressive strength was determined from concrete cubes obtained using different mix proportions and then tested for 7 days, 14 days and 28 days respectively. Mixing of measured quantities was achieved manually using a shovel, and the concrete mixture was turned over and over until a homogenous mix was obtained. A total of Forty-five (45) cubes was
IJSER
International Journal of Scientific & Engineering Research, Volume 6, Issue 8, August-2015 1184 ISSN 2229-5518
IJSER © 2015 http://www.ijser.org
produced, 15 from each of the methods Two (2) cubes each were tested at every 7 and 28 days curing periods for every target strength, one (1) was crushed on the Fourteenth (14) day and the average of the two taken as the compressive strength of the concrete at that age. RESULTS AND DISCUSSION
3.1 Result of Sieve Analysis Below is the result of the sieve analysis carried out on the coarse aggregate used for the experiment
Mass of Soil = 500g
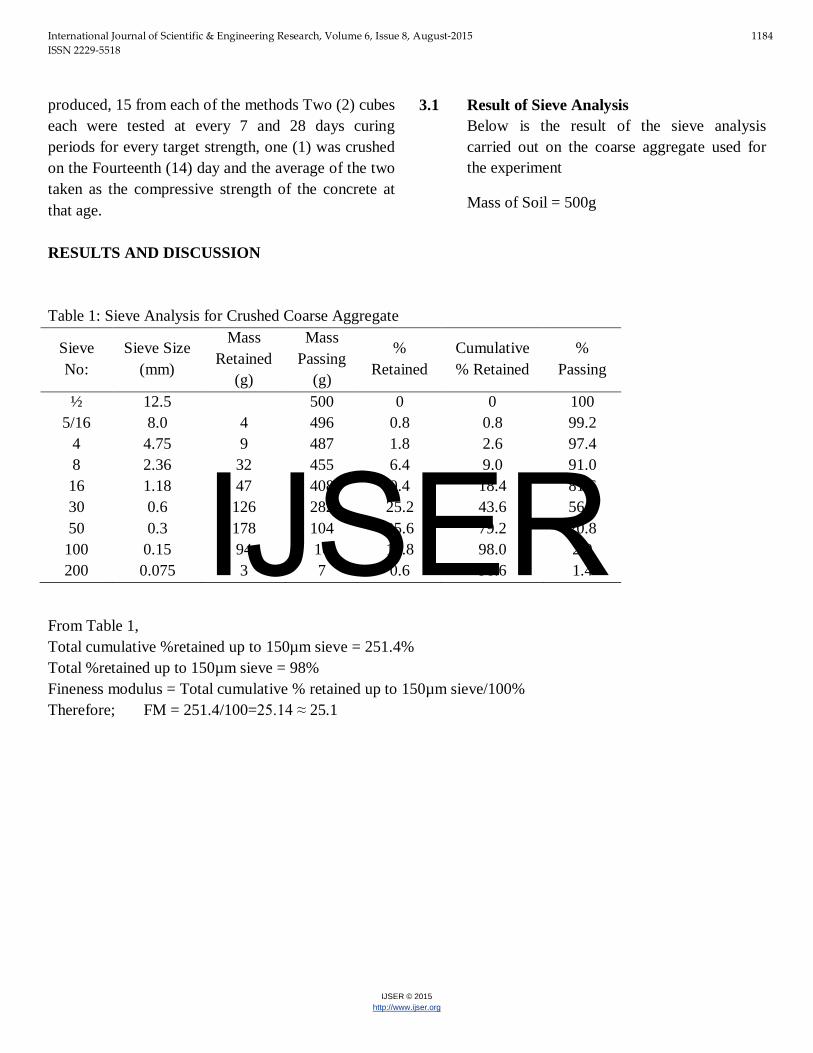
Table 1: Sieve Analysis for Crushed Coarse Aggregate
Sieve No:
Sieve Size (mm)
Mass Retained
(g)
Mass Passing
(g)
% Retained
Cumulative % Retained
% Passing
½ 12.5 500 0 0 100 5/16 8.0 4 496 0.8 0.8 99.2
4 4.75 9 487 1.8 2.6 97.4 8 2.36 32 455 6.4 9.0 91.0 16 1.18 47 408 9.4 18.4 81.6 30 0.6 126 282 25.2 43.6 56.4 50 0.3 178 104 35.6 79.2 20.8
100 0.15 94 10 18.8 98.0 2.0 200 0.075 3 7 0.6 98.6 1.4
From Table 1, Total cumulative %retained up to 150µm sieve = 251.4% Total %retained up to 150µm sieve = 98% Fineness modulus = Total cumulative % retained up to 150µm sieve/100% Therefore; FM = 251.4/100=25.14 ≈ 25.1
IJSER
International Journal of Scientific & Engineering Research, Volume 6, Issue 8, August-2015 1185 ISSN 2229-5518
IJSER © 2015 http://www.ijser.org
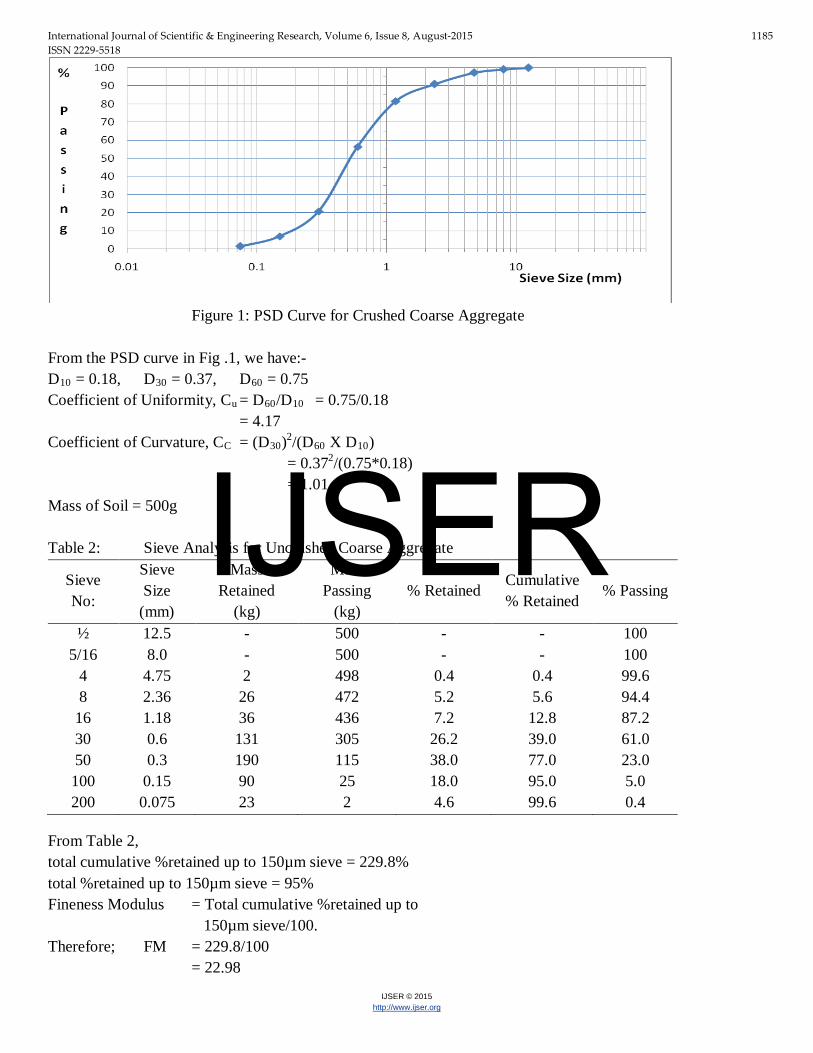
Figure 1: PSD Curve for Crushed Coarse Aggregate
From the PSD curve in Fig .1, we have:- D10 = 0.18, D30 = 0.37, D60 = 0.75 Coefficient of Uniformity, Cu = D60/D10 = 0.75/0.18
= 4.17 Coefficient of Curvature, CC = (D30)2/(D60 X D10)
= 0.372/(0.75*0.18) = 1.01
Mass of Soil = 500g Table 2: Sieve Analysis for Uncrushed Coarse Aggregate
Sieve No:
Sieve Size
(mm)
Mass Retained
(kg)
Mass Passing
(kg) % Retained
Cumulative % Retained
% Passing
½ 12.5 - 500 - - 100 5/16 8.0 - 500 - - 100
4 4.75 2 498 0.4 0.4 99.6 8 2.36 26 472 5.2 5.6 94.4
16 1.18 36 436 7.2 12.8 87.2 30 0.6 131 305 26.2 39.0 61.0 50 0.3 190 115 38.0 77.0 23.0 100 0.15 90 25 18.0 95.0 5.0 200 0.075 23 2 4.6 99.6 0.4
From Table 2, total cumulative %retained up to 150µm sieve = 229.8% total %retained up to 150µm sieve = 95% Fineness Modulus = Total cumulative %retained up to
150µm sieve/100. Therefore; FM = 229.8/100
= 22.98
IJSER

International Journal of Scientific & Engineering Research, Volume 6, Issue 8, August-2015 1186 ISSN 2229-5518
IJSER © 2015 http://www.ijser.org
Figure 2: PSD Curve for Uncrushed Coarse Aggregate
From the PSD curve in Fig .2, we have:
D10 = 0.17, D30 = 0.35, D60 = 0.69 Coefficient of Uniformity, Cu = D60/D10 = 0.69/0.17
= 4.06 Coefficient of Curvature, CC = (D30)2/(D60 X D10)
= 0.352/(0.69*0.17) = 1.04
3.2 Result of Specific Gravity Test: The result of the specific gravity conducted on the coarse aggregates used for the project work is as shown below: Table 3: Specific Gravity for Crushed and Uncrushed Aggregates.
S/N DESCRIPTION MASS in kg, (CRUSHED)
MASS in kg, (UNCRUSHED)
1 Weight of empty density bottle (W1) 24.00 24.00 2 Weight of Bottle + Soil (W2) 76.98 76.92 3 Weight of Bottle + Soil + Water (W3) 123.43 122.57 4 Weight of Bottle + Water (W4) 90.74 89.39 5 Weight of Water = (W4 - W1) 66.74 65.39 6 Weight of Soil + Water = (W3 – W2) 46.45 45.65 7 Weight of Soil = (W2 - W1) 52.88 52.92
8 Weight of Displaced Water = ((W4 - W1)- (W3 – W2))
20.29 19.74
IJSER
International Journal of Scientific & Engineering Research, Volume 6, Issue 8, August-2015 1187 ISSN 2229-5518
IJSER © 2015 http://www.ijser.org
From Table 3, we have: For Crushed aggregate, GS = SN 7/SN 8 = 52.88/20.29
= 2.61 For Uncrushed aggregate, GS = SN 7/SN 8 = 52.92/19.74
= 2.68 3.3 Result of Slump Test Result is as presented below:- Initial height of concrete (H) = 300mm Subsided height of concrete (h) = 233 Slump S, = ΔH
= H – h = 300 – 233
= 67mm To the nearest 5mm = 65mm 3.4 Result of Compaction Factor Test Wt. of cylinder alone (W1) = 3.6kg Wt. Of partially compacted concrete + Cylinder (W2)
= 8.3kg Wt. Of fully compacted concrete + Cylinder (W3)
= 8.65kg
Therefore, compaction factor (cf) =
=
CF = 0.93. 3.5 Result of Cube Test
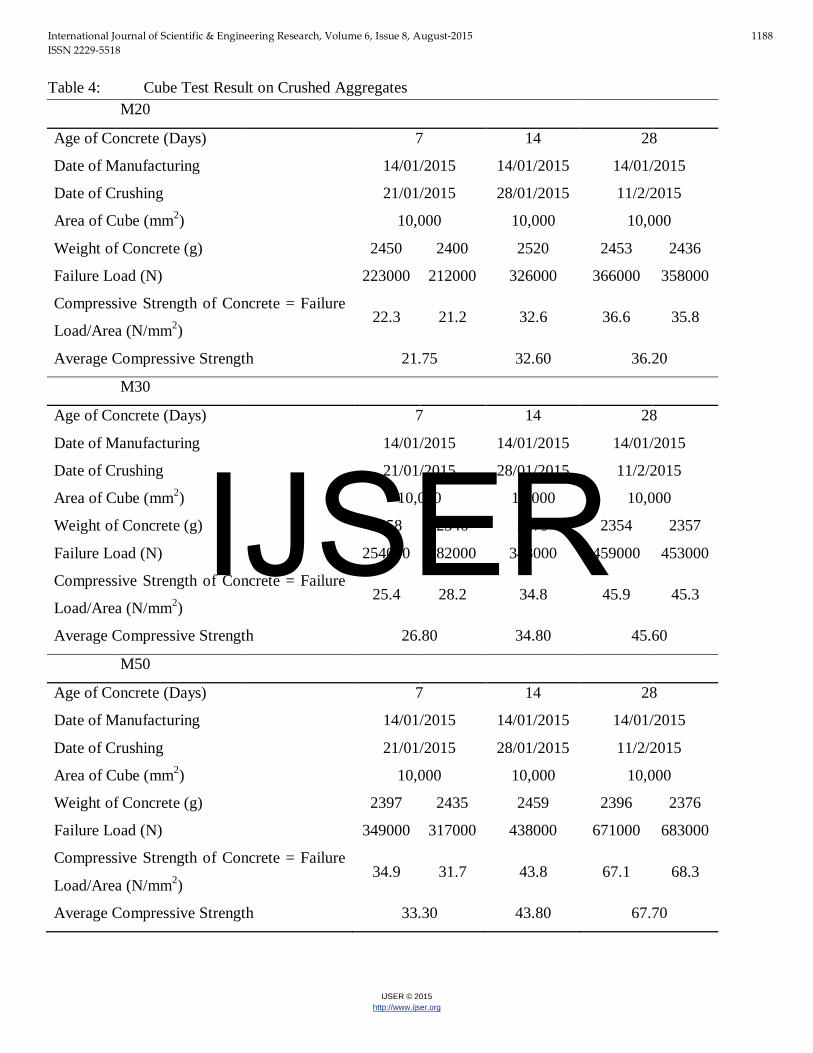
3.5.1 DOE Method The result of the cube test obtained from the cubes produced with the values of the constituent elements for DOE crushed and uncrushed aggregates are presented below:
IJSER
International Journal of Scientific & Engineering Research, Volume 6, Issue 8, August-2015 1188 ISSN 2229-5518
IJSER © 2015 http://www.ijser.org
Table 4: Cube Test Result on Crushed Aggregates
M20
Age of Concrete (Days) 7 14 28
Date of Manufacturing 14/01/2015 14/01/2015 14/01/2015
Date of Crushing 21/01/2015 28/01/2015 11/2/2015
Area of Cube (mm2) 10,000 10,000 10,000
Weight of Concrete (g) 2450 2400 2520 2453 2436
Failure Load (N) 223000 212000 326000 366000 358000
Compressive Strength of Concrete = Failure
Load/Area (N/mm2) 22.3 21.2 32.6 36.6 35.8
Average Compressive Strength 21.75 32.60 36.20
M30
Age of Concrete (Days) 7 14 28
Date of Manufacturing 14/01/2015 14/01/2015 14/01/2015
Date of Crushing 21/01/2015 28/01/2015 11/2/2015
Area of Cube (mm2) 10,000 10,000 10,000
Weight of Concrete (g) 2258 2346 2479 2354 2357
Failure Load (N) 254000 282000 348000 459000 453000
Compressive Strength of Concrete = Failure
Load/Area (N/mm2) 25.4 28.2 34.8 45.9 45.3
Average Compressive Strength 26.80 34.80 45.60
M50
Age of Concrete (Days) 7 14 28
Date of Manufacturing 14/01/2015 14/01/2015 14/01/2015
Date of Crushing 21/01/2015 28/01/2015 11/2/2015
Area of Cube (mm2) 10,000 10,000 10,000
Weight of Concrete (g) 2397 2435 2459 2396 2376
Failure Load (N) 349000 317000 438000 671000 683000
Compressive Strength of Concrete = Failure
Load/Area (N/mm2) 34.9 31.7 43.8 67.1 68.3
Average Compressive Strength 33.30 43.80 67.70
IJSER

International Journal of Scientific & Engineering Research, Volume 6, Issue 8, August-2015 1189 ISSN 2229-5518
IJSER © 2015 http://www.ijser.org
Table 5: Cube Test Result on Uncrushed Aggregates
M20
Age of Concrete (Days) 7 14 28
Date of Manufacturing 14/01/2015 14/01/2015 14/01/2015
Date of Crushing 21/01/2015 28/01/2015 11/2/2015
Area of Cube (mm2) 10,000 10,000 10,000
Weight of Concrete (g) 2435 2479 2513 2470 2503
Failure Load (N) 288000 283000 317000 375000 381100 Compressive Strength of Concrete = Failure Load/Area (N/mm2)
28.8 28.3 31.7 37.5 38.11
Average Compressive Strength 28.55 31.70 37.81
M30
Age of Concrete (Days) 7 14 28
Date of Manufacturing 14/01/2015 14/01/2015 14/01/2015
Date of Crushing 21/01/2015 28/01/2015 11/2/2015
Area of Cube (mm2) 10,000 10,000 10,000
Weight of Concrete (g) 2311 2343 2378 2421 2454
Failure Load (N) 321000 298000 354000 472000 483000 Compressive Strength of Concrete = Failure Load/Area (N/mm2)
32.1 29.8 35.4 47.2 48.3
Average Compressive Strength 30.95 35.4 47.75
M50
Age of Concrete (Days) 7 14 28
Date of Manufacturing 14/01/2015 14/01/2015 14/01/2015
Date of Crushing 21/01/2015 28/01/2015 11/2/2015
Area of Cube (mm2) 10,000 10,000 10,000
Weight of Concrete (g) 2349 2351 2417 2512 2458
Failure Load (N) 363000 395000 481000 643000 631000 Compressive Strength of Concrete = Failure Load/Area (N/mm2)
36.3 39.5 48.1 64.3 63.1
Average Compressive Strength 37.90 48.10 63.70
3.5.2 From the ACI Method
IJSER
International Journal of Scientific & Engineering Research, Volume 6, Issue 8, August-2015 1190 ISSN 2229-5518
IJSER © 2015 http://www.ijser.org
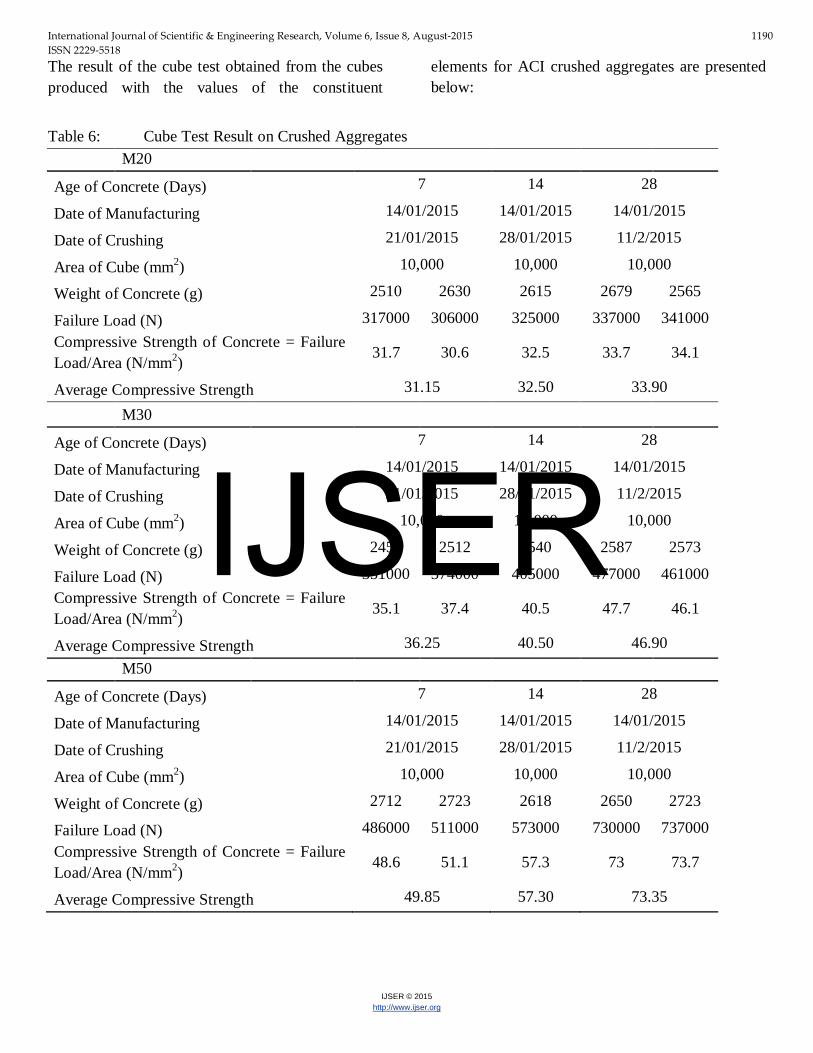
The result of the cube test obtained from the cubes produced with the values of the constituent
elements for ACI crushed aggregates are presented below:
Table 6: Cube Test Result on Crushed Aggregates
M20
Age of Concrete (Days) 7 14 28
Date of Manufacturing 14/01/2015 14/01/2015 14/01/2015
Date of Crushing 21/01/2015 28/01/2015 11/2/2015
Area of Cube (mm2) 10,000 10,000 10,000
Weight of Concrete (g) 2510 2630 2615 2679 2565
Failure Load (N) 317000 306000 325000 337000 341000 Compressive Strength of Concrete = Failure Load/Area (N/mm2)
31.7 30.6 32.5 33.7 34.1
Average Compressive Strength 31.15 32.50 33.90
M30
Age of Concrete (Days) 7 14 28
Date of Manufacturing 14/01/2015 14/01/2015 14/01/2015
Date of Crushing 21/01/2015 28/01/2015 11/2/2015
Area of Cube (mm2) 10,000 10,000 10,000
Weight of Concrete (g) 2450 2512 2540 2587 2573
Failure Load (N) 351000 374000 405000 477000 461000 Compressive Strength of Concrete = Failure Load/Area (N/mm2)
35.1 37.4 40.5 47.7 46.1
Average Compressive Strength 36.25 40.50 46.90
M50
Age of Concrete (Days) 7 14 28
Date of Manufacturing 14/01/2015 14/01/2015 14/01/2015
Date of Crushing 21/01/2015 28/01/2015 11/2/2015
Area of Cube (mm2) 10,000 10,000 10,000
Weight of Concrete (g) 2712 2723 2618 2650 2723
Failure Load (N) 486000 511000 573000 730000 737000 Compressive Strength of Concrete = Failure Load/Area (N/mm2)
48.6 51.1 57.3 73 73.7
Average Compressive Strength 49.85 57.30 73.35
IJSER
International Journal of Scientific & Engineering Research, Volume 6, Issue 8, August-2015 1191 ISSN 2229-5518
IJSER © 2015 http://www.ijser.org
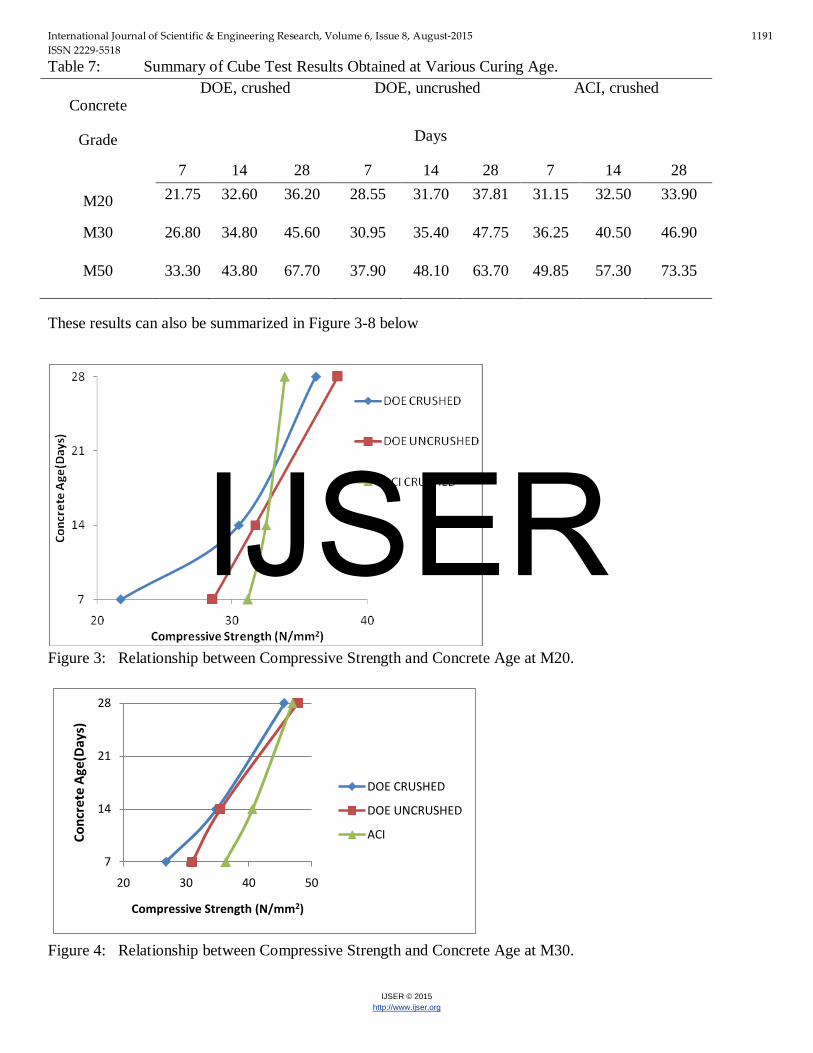
Table 7: Summary of Cube Test Results Obtained at Various Curing Age.
Concrete
Grade
DOE, crushed DOE, uncrushed ACI, crushed
Days
7 14 28 7 14 28 7 14 28
M20 21.75 32.60 36.20 28.55 31.70 37.81 31.15 32.50 33.90
M30 26.80 34.80 45.60 30.95 35.40 47.75 36.25 40.50 46.90
M50 33.30 43.80 67.70 37.90 48.10 63.70 49.85 57.30 73.35
These results can also be summarized in Figure 3-8 below
Figure 3: Relationship between Compressive Strength and Concrete Age at M20.
7
14
21
28
20 30 40 50
Conc
rete
Age
(Day
s)
Compressive Strength (N/mm2)
DOE CRUSHED
DOE UNCRUSHED
ACI
Figure 4: Relationship between Compressive Strength and Concrete Age at M30.
IJSER

International Journal of Scientific & Engineering Research, Volume 6, Issue 8, August-2015 1192 ISSN 2229-5518
IJSER © 2015 http://www.ijser.org
7
14
21
28
20 40 60 80
Conc
rete
Age
(Day
s)
Compressive Strength (Nmm2)
DOE CRUSHED
DOE UNCRUSHED
ACI
Figure 5: Relationship between Compressive Strength and Concrete Age at M50.
20
30
40
50
10 20 30 40 50 60
Targ
et S
tren
gth
Compressive Strength (Nmm2)
DOE CRUSHED
DOE UNCRUSHED
ACI
Figure 6: Relationship between Compressive Strength and Target Strength at Age 7days.
Figure 7: Relationship between Compressive Strength and Target Strength at Age 14days.
IJSER
International Journal of Scientific & Engineering Research, Volume 6, Issue 8, August-2015 1193 ISSN 2229-5518
IJSER © 2015 http://www.ijser.org
20
30
40
50
20 30 40 50 60 70 80
Targ
et S
tren
gth
Compressive Strength
DOE CRUSHED
DOE UNCRUSHED
ACI
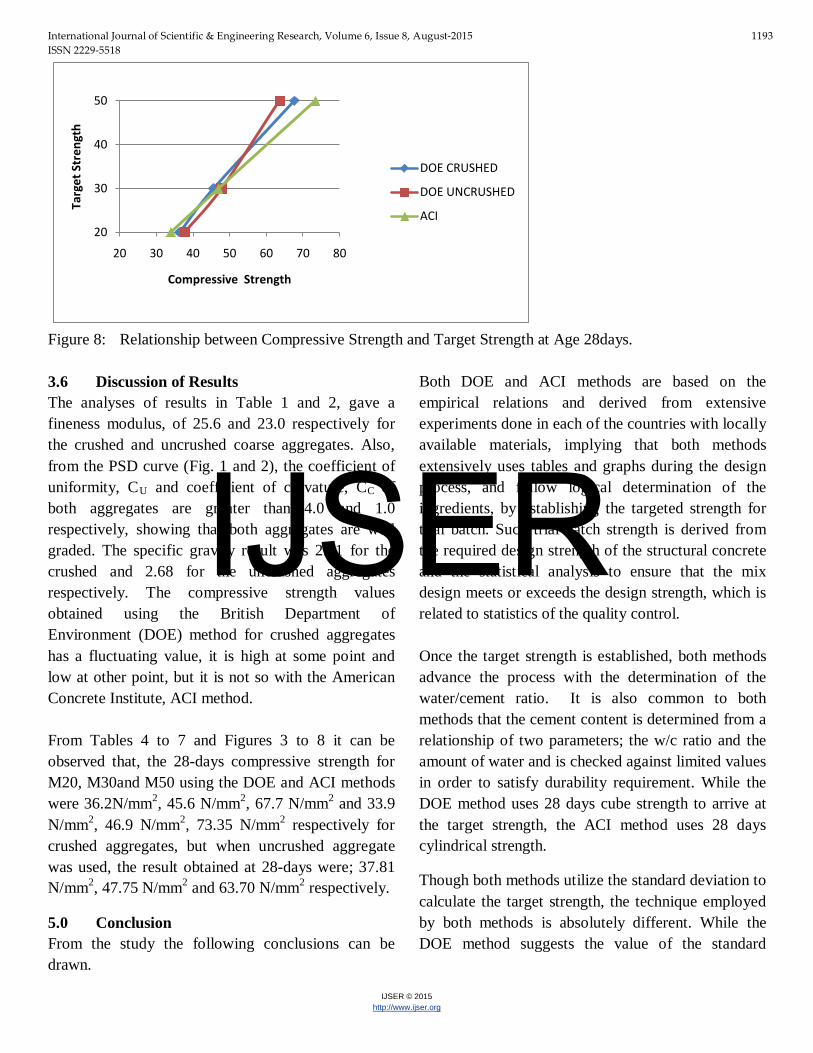
Figure 8: Relationship between Compressive Strength and Target Strength at Age 28days. 3.6 Discussion of Results The analyses of results in Table 1 and 2, gave a fineness modulus, of 25.6 and 23.0 respectively for the crushed and uncrushed coarse aggregates. Also, from the PSD curve (Fig. 1 and 2), the coefficient of uniformity, CU and coefficient of curvature, CC of both aggregates are greater than 4.0 and 1.0 respectively, showing that both aggregates are well graded. The specific gravity result was 2.61 for the crushed and 2.68 for the uncrushed aggregates respectively. The compressive strength values obtained using the British Department of Environment (DOE) method for crushed aggregates has a fluctuating value, it is high at some point and low at other point, but it is not so with the American Concrete Institute, ACI method. From Tables 4 to 7 and Figures 3 to 8 it can be observed that, the 28-days compressive strength for M20, M30and M50 using the DOE and ACI methods were 36.2N/mm2, 45.6 N/mm2, 67.7 N/mm2 and 33.9 N/mm2, 46.9 N/mm2, 73.35 N/mm2 respectively for crushed aggregates, but when uncrushed aggregate was used, the result obtained at 28-days were; 37.81 N/mm2, 47.75 N/mm2 and 63.70 N/mm2 respectively.
5.0 Conclusion From the study the following conclusions can be drawn.
Both DOE and ACI methods are based on the empirical relations and derived from extensive experiments done in each of the countries with locally available materials, implying that both methods extensively uses tables and graphs during the design process, and follow logical determination of the ingredients, by establishing the targeted strength for trial batch. Such trial batch strength is derived from the required design strength of the structural concrete and the statistical analysis to ensure that the mix design meets or exceeds the design strength, which is related to statistics of the quality control. Once the target strength is established, both methods advance the process with the determination of the water/cement ratio. It is also common to both methods that the cement content is determined from a relationship of two parameters; the w/c ratio and the amount of water and is checked against limited values in order to satisfy durability requirement. While the DOE method uses 28 days cube strength to arrive at the target strength, the ACI method uses 28 days cylindrical strength.
Though both methods utilize the standard deviation to calculate the target strength, the technique employed by both methods is absolutely different. While the DOE method suggests the value of the standard
IJSER

International Journal of Scientific & Engineering Research, Volume 6, Issue 8, August-2015 1194 ISSN 2229-5518
IJSER © 2015 http://www.ijser.org
deviation, the ACI method recommends empirical values to determine the standard deviation. While the British DOE method uses the compaction factor as a measure of workability, the American ACI method uses the slump. Though the DOE method discusses the air entrainment, the selection of the w/c ratio is a sole function of the target strength, whereas in the ACI method, the determination of the w/c ratio, is a combination of both the target strength and the type of concrete (whether Air entrained or Non Air entrained). In the DOE method, determination of the water content is dependent on the target strength, whereas in the ACI method, water content could be determined independent of the target strength. The DOE method considers whether the coarse aggregate used is crushed or uncrushed, but in the ACI method, consideration is not made for uncrushed aggregate. Generally, it could be seen that at lower target strength, the DOE method gives a higher compressive strength than the ACI method, but the reverse was the case at M50. Also on the basis of comparison based on age of concrete, from Figures 7 and 8, it could be seen that the ACI method gave a higher compressive strength (46.9Nmm2) at day 14 and day 28 respectively as against the DOE method of 45.6 N/mm2 and 67.7 N/mm2 respectively for 14 and 28 days respectively.
References [1] Krishnaswami, B. N. (2009). Concrete Mix
Design. Civil Engineers & Architects Association, Kumbakonam.
[2] Kett, I. (2nd Edition). (2010). Engineered
concrete: Mix design and Test methods. CRC press, New York. [3] Durocrete. (2012). Mixed design manual.
[4] Nwofor, T.C. & Eme, D.B. (2010). Stability of concrete work with partial substitute of rice
husk ash (RHA) for cement in Nigeria. Journal of Chemical, Mechanical and Engineering Practice, 1(2&3), 42-47
[5] Sule, S. & Nwofor, T.C. (2011). Analytical models for prediction of mechanical properties of rice husk ash concrete. International Journal of Current Research, 3(11), 368-370
[6] Nwofor, T.C. & Sule, S. (2012). Stability of groundnut shell ash (GSA)/ordinary Portland cement (OPC) concrete in Nigeria. Advances in Applied Science Research, 3(4), 2283-2287.
[7] Nwofor, T.C. & Sule, S. (2014). Investigating geometric characteristics of cement concrete materials. International Journal of Innovative Research in Advanced Engineering, 1(9), 74-82.
[8] Amarjit, S. and Kamal, G. (2005). Comparison of IST and ACI methods for absolute volume concrete mix design. 30th conference on our world in concrete and structures, Singapore.
[9] BS 812: Part 1 (1975). Methods of Determination of particle size and shape.
[10] BS 12 (1978). Specification for Portland cement. British Standards Institution.
[11] Kumbhar, P. D. (2012). Assessment of the suitability of existing mi design methods of normal concrete for designing high performance concrete. International Journal of Civil and Structural Engineering. Vol.3.
[12] Bhattacharjee, B. Mix Design of Concrete: British (DOE) method, CEL 774 Construction practices, Civil Engineering Department, IIT, Delhi.
IJSER
Related Documents