Article A Comparative Study of the AHP and TOPSIS Techniques for Dam Site Selection Using GIS: A Case Study of Sistan and Baluchestan Province, Iran Ali Jozaghi 1, *, Babak Alizadeh 1 , Mohsen Hatami 2 , Ian Flood 2 , Mohammad Khorrami 3 , Nastaran Khodaei 4 and Erfan Ghasemi Tousi 5 1 Department of Civil Engineering, University of Texas at Arlington, P.O. Box 19019, Arlington, TX 76019, USA; [email protected] (B.A.) 2 M. E. Rinker, Sr. School of Construction Management, University of Florida, P.O. Box 115703, Gainesville, FL 32611, USA; [email protected] (M.H.); [email protected] (I.F.) 3 Department of Civil Engineering, Ferdowsi University of Mashhad, Mashhad 9177948974, Iran; [email protected] 4 College of Architecture and Planning, University of Colorado Denver, PO Box 173364, Denver, CO 80217- 3364, [email protected] 5 Department of Civil and Architectural Engineering and Mechanics, University of Arizona, P.O. Box 210072, Tucson, AZ 85721, USA; [email protected] * Correspondence: [email protected]; Tel.: +1-682-808-1236 Abstract: The application of multiple criteria decision-making (MCDM) techniques in real-life problems has increased in recent years. The need to build advanced decision models with higher capabilities that can support decision making in a broad spectrum of applications, promotes the integration of MCDM techniques with applicable systems, including artificial intelligence, and Geographic Information Systems (GIS). The Analytic Hierarchy Process (AHP) and Technique for Order of Preference by Similarity to Ideal Solution (TOPSIS) are amongst the most widely adopted MCDM techniques capable of resolving water resources challenges. A critical problem associated with water resource management is dam site selection. This paper presents a comparative analysis of TOPSIS and AHP in the context of decision making using GIS for dam site selection. The comparison was made based on geographic and water quality criteria. A ratio estimation procedure was used to determine the weights of these criteria. Both methods were applied for selection of optimal sites for dams in the Sistan and Baluchestan province, Iran. The results show that the TOPSIS method is better suited to the problem of dam site selection for this case study. Actual locations of dams constructed in the area were used to verify the results of both methods. Keywords: multi-criteria decision-making; TOPSIS; AHP; water resources; dam site selection 1. Introduction and Background Selection of the best site for locating a dam is amongst the most important decisions in water supply management. As an optimal selection can enhance the security of the reservoir in a region and groundwater regeneration, a bad selection can undermine them. The economic merits of dams outweigh the detriments and costs, thus it provides a good reason for construction of dams around the world. A well-selected site will not only provide direct benefits but also its careful design can provide the additional benefit of a recreational area surrounding the reservoir. Conversely, a poorly selected site could cause detrimental influences. Development of these structures have some negative biophysical, socio-economic, and geopolitical impacts, often through the loss of ecosystem services provided by fully functioning aquatic systems. Moreover, since people’s livelihoods are dependent on riverine resources, construction of a dam can have an adverse influence on livelihoods of local people [1]. The social, economic, political and environmental consequences are great wherever large dams are built [2]. The number of negative environmental and related social impacts that can result Preprints (www.preprints.org) | NOT PEER-REVIEWED | Posted: 1 November 2018 doi:10.20944/preprints201810.0773.v1 © 2018 by the author(s). Distributed under a Creative Commons CC BY license.

Welcome message from author
This document is posted to help you gain knowledge. Please leave a comment to let me know what you think about it! Share it to your friends and learn new things together.
Transcript
Article
A Comparative Study of the AHP and TOPSIS Techniques for Dam Site Selection Using GIS: A Case Study of Sistan and Baluchestan Province, Iran Ali Jozaghi 1,*, Babak Alizadeh 1, Mohsen Hatami 2, Ian Flood 2, Mohammad Khorrami 3, Nastaran Khodaei 4 and Erfan Ghasemi Tousi 5
1 Department of Civil Engineering, University of Texas at Arlington, P.O. Box 19019, Arlington, TX 76019, USA; [email protected] (B.A.)
2 M. E. Rinker, Sr. School of Construction Management, University of Florida, P.O. Box 115703, Gainesville, FL 32611, USA; [email protected] (M.H.); [email protected] (I.F.)
3 Department of Civil Engineering, Ferdowsi University of Mashhad, Mashhad 9177948974, Iran; [email protected]
4 College of Architecture and Planning, University of Colorado Denver, PO Box 173364, Denver, CO 80217-3364, [email protected]
5 Department of Civil and Architectural Engineering and Mechanics, University of Arizona, P.O. Box 210072, Tucson, AZ 85721, USA; [email protected]
* Correspondence: [email protected]; Tel.: +1-682-808-1236
Abstract: The application of multiple criteria decision-making (MCDM) techniques in real-life problems has increased in recent years. The need to build advanced decision models with higher capabilities that can support decision making in a broad spectrum of applications, promotes the integration of MCDM techniques with applicable systems, including artificial intelligence, and Geographic Information Systems (GIS). The Analytic Hierarchy Process (AHP) and Technique for Order of Preference by Similarity to Ideal Solution (TOPSIS) are amongst the most widely adopted MCDM techniques capable of resolving water resources challenges. A critical problem associated with water resource management is dam site selection. This paper presents a comparative analysis of TOPSIS and AHP in the context of decision making using GIS for dam site selection. The comparison was made based on geographic and water quality criteria. A ratio estimation procedure was used to determine the weights of these criteria. Both methods were applied for selection of optimal sites for dams in the Sistan and Baluchestan province, Iran. The results show that the TOPSIS method is better suited to the problem of dam site selection for this case study. Actual locations of dams constructed in the area were used to verify the results of both methods.
Keywords: multi-criteria decision-making; TOPSIS; AHP; water resources; dam site selection
1. Introduction and Background
Selection of the best site for locating a dam is amongst the most important decisions in water supply management. As an optimal selection can enhance the security of the reservoir in a region and groundwater regeneration, a bad selection can undermine them. The economic merits of dams outweigh the detriments and costs, thus it provides a good reason for construction of dams around the world. A well-selected site will not only provide direct benefits but also its careful design can provide the additional benefit of a recreational area surrounding the reservoir. Conversely, a poorly selected site could cause detrimental influences. Development of these structures have some negative biophysical, socio-economic, and geopolitical impacts, often through the loss of ecosystem services provided by fully functioning aquatic systems. Moreover, since people’s livelihoods are dependent on riverine resources, construction of a dam can have an adverse influence on livelihoods of local people [1]. The social, economic, political and environmental consequences are great wherever large dams are built [2]. The number of negative environmental and related social impacts that can result
Preprints (www.preprints.org) | NOT PEER-REVIEWED | Posted: 1 November 2018 doi:10.20944/preprints201810.0773.v1
© 2018 by the author(s). Distributed under a Creative Commons CC BY license.
from dams is notably diverse. While some impacts occur during construction, the major impacts are usually associated with the operation of the dam and reservoir. Other impacts can result from the support infrastructure such as transmission lines, access roads, quarries and borrow pits [3]. According to the adverse impacts mentioned above, locating the best site for a dam in an area is vital; therefore, it is necessary to conduct a precise study over the area considering all criteria that are important to dam site selection. Site selection, however, is not a new idea. There are numerous traditional methods that are costly and time consuming. Nowadays, with advances in computing and information technologies, determining competitive solutions in terms of cost, time and a variety of other objective variables is greatly facilitated. A powerful tool that can play a critical role in this process is GIS (Geographic Information Systems) techniques for hydrology. GIS is a computer-based system which can handle the attribute data as well as spatial data where geographical information is a key characteristic. It can provide large volumes of valuable data in spatial and temporal resolutions for areas where ground data are not otherwise readily available. Although the technologies such as GIS are now helping the planning, design and construction of dams, the use of technology in this sector compared to the buildings and other infrastructure is still behind and this has still remained as a challenge in the lifecycle management of dams. In addition to GIS, Multiple Criteria Decision Making (MCDM) techniques help decision makers select between alternative solutions, in this case sites for construction of dams, where there are many criteria. The MCDM technique is a well-known methodology, and is commonly used by researchers [4]. The first MCDM technique was developed in 1960 to reduce difficulties in accommodating diverse opinions and large complex datasets in the decision-making process [5]. These capabilities have persuaded researchers to connect MCDM with other planning tools such as GIS [6, 7]. There are many types of MCDM model. A precise analysis of the theoretical foundations of these models and their comparative strengths and weaknesses is presented in Belton and Steward [8]. Two of the most widely used MCDM techniques are Analytic Hierarchy Process (AHP) and Technique for Order of Preference by Similarity to Ideal Solution (TOPSIS).
The AHP approach developed by Saaty (1980) is an effective tool for system analysis and solves decision problems by reducing complex decisions to a series of pairwise comparisons [9]. AHP is an effective multiple criteria decision making technique which has been used to solve decision problems in a variety of fields [10]. Moreover, AHP includes an effective technique for checking the consistency of the decision maker’s evaluations, thus decreasing the bias in the decision making process. The TOPSIS method was first introduced by Hwang and Yoon (1981) and is based on the idea that the best alternative has the shortest distance from the ideal solution and the farthest distance from the negative ideal solution [11]. The ideal solution is assumed to be an alternative that has the best values for all considered criteria whereas the negative ideal solution is identified with a hypothetical alternative that has the worst criteria values.
Many papers have been published in the field of dam site selection using MCDM techniques for choosing a feasible location for building a dam. However, authors are not aware of any comparative study between the TOPSIS and AHP techniques for solving dam site selection problems. A wide range of studies have been conducted regrading risk or performance analysis on multiple watersheds, dams or tunnels all around the world with a diverse hydro-climatological regimes [12-19]. Also, Anane et al. (2012) carried out a study to prioritize the best locations for irrigation with treated wastewater (TWW) in Tunisia [20]. Potential feasible locations were identified based on resources conflicts, cost effectiveness, land suitability, social acceptance and environment factor. Several researchers have applied fuzzy systems on decision making methods [21-25]. Using fuzzy AHP combined with GIS, they were able to map and prioritize the appropriate sites for different purposes. Reliable data and advanced technologies are two necessary elements for efficient management of transportation networks and their transit corridors [26]. Soil properties and groundwater level should be investigated in design phase of the road transportation network to have a high-quality subgrade. As such, there have been a significant progress in development of the standards for data transfer between different software packages and technologies [27]. Choudhary and Shankar (2012) considered location selection for thermal power plants as a multi-criteria decision problem and applied a STEEP-fuzzy AHP-TOPSIS framework to rank the alternative locations and
Preprints (www.preprints.org) | NOT PEER-REVIEWED | Posted: 1 November 2018 doi:10.20944/preprints201810.0773.v1
select the most suitable for a thermal power plant in India [28]. Their study considered five major criteria including social, technical, economic, environmental, and political. The weight of qualitative and quantitative criteria that impact the location selection process was determined by the fuzzy AHP. The alternative locations were ranked based on their overall performance using the TOPSIS technique. Kim et al. (2012) used the TOPSIS method in a fuzzy environment to rank the best out of ten sites for treated wastewater (TWW) in a South Korean urban watershed [21]. They considered four main criteria including technical, social, economic and environmental. The uncertainty of weighting values and input data were considered using triangular fuzzy numbers, and data were collected using individual interviews. The results showed that the fuzzy TOPSIS approach provided different rankings of the best sites for TWW compared to a traditional MCDM technique, highlighting the need for fuzzy-based MCDM. In 2012, a study was conducted by Minatour et al. in the western part of Iran using the AHP technique to help choose an appropriate location for an earth dam [29]. In this study, nine categories of criteria and eleven sub criteria were considered based on their ranked importance for locating the earth dam site. The criteria used were: topographic conditions, economic development, health dam site, river flow regime, annual yield, volume of reservoir, annual volume of sediment, probable maximum flood, average annual evaporation, access to materials and facilities, overall cost, water quality, dam body and reservoir, probable dam break, environmental, social, and political. According to the criteria in the dam site selection, using the experiences and opinions of experts, and existing information and data, four feasible alternatives were proposed and prioritized using the AHP technique. The most optimal site was selected and then approved by the experts involved in the project [29]. In another study, Sengül et al. (2014) developed a model using the Fuzzy TOPSIS method to rank renewable energy supply systems in Turkey [22]. The Interval Shannon's Entropy methodology was used to determine weight values for the criteria. Criteria data were obtained from the literature and from official sites in Turkey. The results of this research offer energy policymakers and decision makers optimal alternative solutions for resource allocation in Turkey.
Zyoud et al. (2016) used AHP and TOPSIS methods within a fuzzy environment to create a framework for water loss management in developing countries [23]. They proposed a hierarchical structure of the decision problem that consisted of four levels: overall objective; main criteria; evaluation criteria; and options. In this study, the weight of criteria were determined by fuzzy AHP, and fuzzy TOPSIS was also used to rank options in terms of their potential to meet the overall objective based on the evaluations and preferences of decision makers. It was assumed that the most important option was a pressure management and control strategy. Additionally, employing advanced techniques and establishment of district metered areas were determined to be the second and third most important, respectively. Moreover, based on sensitivity analysis results, the strongest and weakest options were less sensitive to changes in the weights of the evaluation criteria. Özcan et al. (2017) applied the AHP and TOPSIS methods for maintenance strategy selection in hydroelectric power plants in Turkey [30]. In their study, a combined AHP-TOPSIS methodology was used for choosing the most critical equipment. Nine items of equipment of critical importance for hydroelectric power plants were determined. A Goal Programming (GP) model was proposed to obtain maintenance strategy combinations for the equipment. The results showed that there was an improvement of 77.1% in failure frequency of the power plant resulting from employing the wrong maintenance strategy on critical equipment compared to the period when the model was not used. Esavi et al. (2012) compared the AHP and Fuzzy-AHP methods for underground dam site selection in a hydrologic catchment in Iran [31]. They concluded that the Fuzzy-AHP shows higher capability and more flexibility in selecting the appropriate underground dam location. An intercomparison between AHP and TOPSIS techniques was carried out by Onut and Soner (2018) to select an optimal transshipment site in Istanbul, Turkey [32]. They used fuzzy sets to account for uncertainties in different criteria and they derived criteria weights based on a pair-wise comparison using the AHP method. Mulliner et al. (2016) conducted a comprehensive analysis of five different MCDM techniques, including TOPSIS and AHP, to assess sustainable housing affordability using different economic, social and environmental criteria in Liverpool, UK [33]. Their results show that overall ranking of alternatives varies from method to method and there is no perfect technique for this problem. Hence, where possible, applying a selection of different methods to the same problem is
Preprints (www.preprints.org) | NOT PEER-REVIEWED | Posted: 1 November 2018 doi:10.20944/preprints201810.0773.v1
ideal. Balioti et al. (2018) applied the AHP and TOPSIS methods with fuzzy logic to select the optimal type of spillway in a dam in Northern Greece [34]. They concluded that these tools are required to account for additional parameters beyond technical and construction costs.
The paper presents a case study based on the selection of suitable dam sites in southern parts of the Sistan and Baluchestan province, Iran. The appropriate dam sites will be selected primarily according to environmental conditions, of which the most important is irrigation water supply [35]. In this study, a comparative study of two Multiple Criteria Decision Making (MCDM) models -TOPSIS and AHP- using Geographic Information System (GIS) is performed to determine the most appropriate locations for dam construction in the region while reducing costs. The best selection tool will be determined by comparing the results of the two decision making approaches.
Based on a literature review of previous studies, particular conditions of the region and data availability, several geographical and water quality criteria were determined to be the most important. The geographical criteria are geology and land use, sediment erosion, slope, groundwater and discharge. The water quality criteria include soluble sodium percentage (SSP), total dissolved solid (TDS), hydrogen ion concentration (PH), and electrical conductivity of water (EC). There are several objectives, which need to be achieved in this study, in addition to the aim of this study: Stage1: Modeling of river flow routing using GIS and selecting possible locations based on topographical and morphological conditions. Stage2: Application of the TOPSIS model and determining the rank of the sites which were chosen in the first stage. Stage3: Application of the AHP technique and ranking the sites. Stage4: Comparing the results of the TOPSIS and AHP models.
This paper is organized into the following sections. Section (2) describes the study area where the dam sites are located. Section (3) describes the methodology for choosing the best locations for construction of dams including: selecting some alternatives based on topographical conditions, point interpolation and MCDM methods. In Section (4) the most important results for dam site selection based on the TOPSIS and AHP methods are described. Finally, Section (5) provides the conclusion and recommendations for future research.
1.1. Case Study
Sistan and Baluchestan Province with an area of 181,785 km² and a population of 2.5 million is the second largest province of Iran. Nonetheless, it is one of the most thinly populated provinces in the country. It is in the southeast of the country bordering Khorasan Province and Afghanistan in the north, Pakistan and Afghanistan in the west, the Oman Sea in the South, and Kerman and Hurmozgan Provinces in the west; its capital is Zahedan. It is composed of 14 cities, namely Iranshahr, Chabahar, Khash, Degan, Zabol, Zaboli, Zahedan, Zahak, Saravan, Sarbaz, Sib suran, Konarak, Miankangi, and Nikshahr. Zahedan with a population of more than 567,000 is the largest and most populous city and Rask is the least with a population of only 1,047 [36]. The study area of this research is the southern parts of Sistan and Baluchestan province which is around32000 km2. The location of the study area is illustrated in Figure 1. There are four perennial rivers, Sarbaz with an average flow rate of 7 m3/s, Kajoo with average flow rate 5 m3/s, Shi Kalak with average flow rate 0.3 m3/s and Kahir with average flow rate 5.5 m3/s. The study area also contains five large existing dams, Kahir Dam (reservoir capacity: 314×106 m3), Zirdan Dam (reservoir capacity: 207×106 m3), Shi Kalak Dam (reservoir capacity: 10.5×10⁶ m3), Land Dam (reservoir capacity: 10×106 m3) and Pishin Dam (reservoir capacity: 167×106 m3). In terms of climate, Sistan and Balouchestan province can be considered as a desert. There is virtually no rainfall all year long in Sistan and Baluchestan. These regions are arid and semi-arid and continuity of multi-year droughts and low level of precipitation during recent years has caused water shortages. Köppen and Geiger have classified this location as BWh [37].
Preprints (www.preprints.org) | NOT PEER-REVIEWED | Posted: 1 November 2018 doi:10.20944/preprints201810.0773.v1
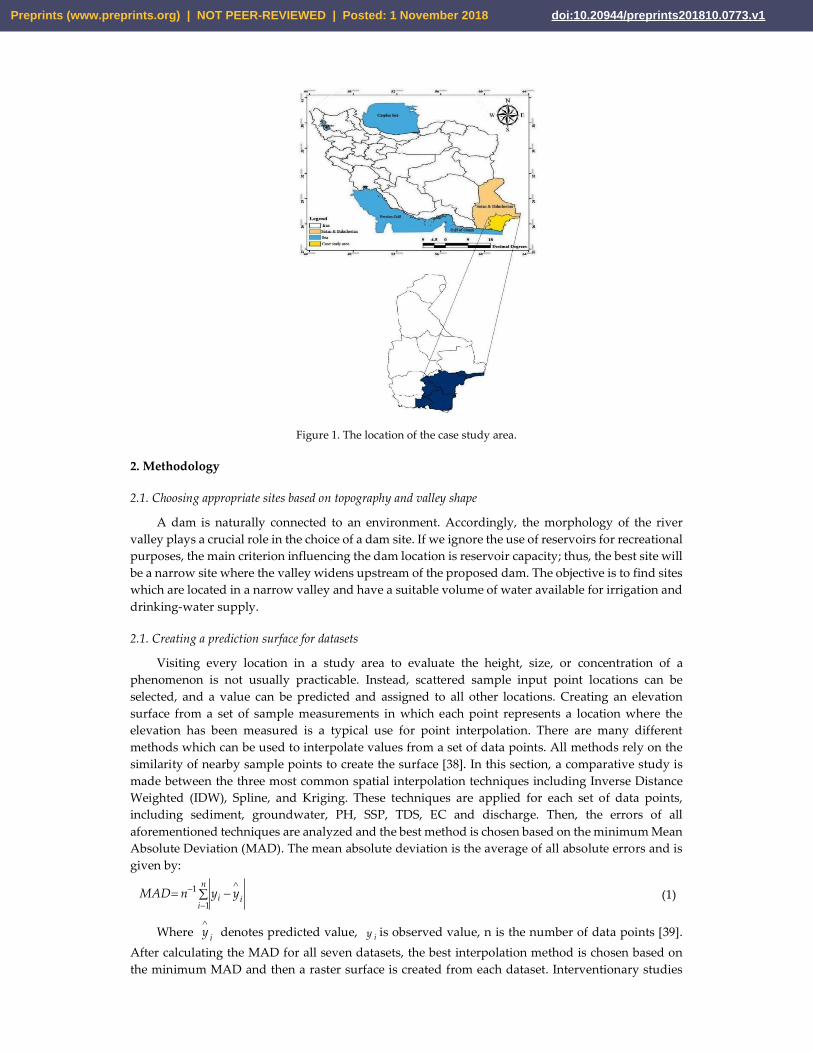
Figure 1. The location of the case study area.
2. Methodology
2.1. Choosing appropriate sites based on topography and valley shape
A dam is naturally connected to an environment. Accordingly, the morphology of the river valley plays a crucial role in the choice of a dam site. If we ignore the use of reservoirs for recreational purposes, the main criterion influencing the dam location is reservoir capacity; thus, the best site will be a narrow site where the valley widens upstream of the proposed dam. The objective is to find sites which are located in a narrow valley and have a suitable volume of water available for irrigation and drinking-water supply.
2.1. Creating a prediction surface for datasets
Visiting every location in a study area to evaluate the height, size, or concentration of a phenomenon is not usually practicable. Instead, scattered sample input point locations can be selected, and a value can be predicted and assigned to all other locations. Creating an elevation surface from a set of sample measurements in which each point represents a location where the elevation has been measured is a typical use for point interpolation. There are many different methods which can be used to interpolate values from a set of data points. All methods rely on the similarity of nearby sample points to create the surface [38]. In this section, a comparative study is made between the three most common spatial interpolation techniques including Inverse Distance Weighted (IDW), Spline, and Kriging. These techniques are applied for each set of data points, including sediment, groundwater, PH, SSP, TDS, EC and discharge. Then, the errors of all aforementioned techniques are analyzed and the best method is chosen based on the minimum Mean Absolute Deviation (MAD). The mean absolute deviation is the average of all absolute errors and is given by:
n
iii yynMAD
1
1 (1)
Where iy
denotes predicted value, iy is observed value, n is the number of data points [39]. After calculating the MAD for all seven datasets, the best interpolation method is chosen based on the minimum MAD and then a raster surface is created from each dataset. Interventionary studies
Preprints (www.preprints.org) | NOT PEER-REVIEWED | Posted: 1 November 2018 doi:10.20944/preprints201810.0773.v1
involving animals or humans, and other studies require ethical approval must list the authority that provided approval and the corresponding ethical approval code.
2.3. Ranking selected sites by using MCDM methods
MCDM is a sub-discipline of operations research that explicitly considers multiple criteria in decision making environments [40]. These techniques are used to evaluate and assess alternatives and rank them from the best to the worst under conflicting criteria. The most important characteristics of the MCDM techniques are: (1) alternatives, (2) criteria which the alternatives are based upon, (3) scores that reflect the value of an alternative's expected performance on the criteria, and (4) weights of criteria that calculate the relative importance of each criterion as compared with others [41]. There are several MCDM techniques proposed by researchers. These include: AHP1 [9], TOPSIS2 [11], CBR3 [42], ANP4 [43], GP5 [44], ELECTRE6 [45] and PROMETHEE7 [46]. This paper, however, focuses on AHP and TOPSIS and the aim of the study is to find suitable dam sites in southern parts of Sistan and Baluchestan Province using these methods. AHP is “a theory of measurement through pairwise comparisons and relies on the judgments of experts to derive priority scales” [47]. In this method decision makers are able to weight criteria and compare alternatives using pairwise comparisons. Due to its hierarchical structure, it can easily adjust in size to accommodate decision-making problems [48]. TOPSIS is the other MCDM method used in this study. It is “an approach to identify an alternative which is closest to the ideal solution and farthest to the negative ideal solution in a multi-dimensional computing space” [49]. It has a simpler procedure than the other decision making techniques and it is easy to use and programmable. Moreover, the number of steps remains the same regardless of the number of attributes [50].
2.3.1. TOPSIS
The TOPSIS technique was developed by Hwang & Yoon, 1981 and it is a pragmatic method for dealing with real life MCDM problems [11]. It helps decision makers and engineers compare and rank a set of alternative decisions. In this method, ranking of alternatives is based on the shortest distance from the ideal solution and the farthest from the negative ideal solution. The TOPSIS procedure comprises the following steps [51]:
Step 1: Determination of the weight of criteria and construction of the decision matrix
The first and foremost step in the TOPSIS algorithm is creating a decision matrix and determining the weight of criteria. Weighting the criteria, all of which in this study have been determined in GIS layers, is one of the most important and complicated stages of the MCDM methods [52]. In this step, relative weights must be assigned not only to each criterion but to its quantitative and qualitative values based on their importance. Since weighting the criteria is the main step in the decision making process, a high precision is required to determine weights for each criterion and its values. There are a variety of methods which have been proposed to determine weights in MCDM methods. Tzeng et al. (1998) classified weighting approaches into subjective or objective [53]. The weights in the subjective methods are determined based on preference information of criteria, subjective opinions and decision maker’s knowledge. However, the objective approaches select the weights of criteria based on a mathematical calculation. In this study, the Ratio Estimation procedure, which is a subjective method, is adopted to decide the relative importance of weights of attributes and criteria based on the opinion of experts. In this method, an arbitrary highest weight is assigned
1 Analytic Hierarchy Process 2 Technique for Order of Preference by Similarity to Ideal Solution 3 Case-Based Reasoning 4 Analytic Network Process 5 Goal Programming 6 Eimination et choix traduisant la realite (or Elimination and choice expressing the Reality) 7 Preference Ranking Organization Method for Enrichment of Evaluations
Preprints (www.preprints.org) | NOT PEER-REVIEWED | Posted: 1 November 2018 doi:10.20944/preprints201810.0773.v1
to the most important criterion. Correspondingly, smaller weights are assigned to the remaining 8 criteria with lower order until a score is assigned to the least important criterion. The ratio is calculated by dividing each weight to the lowest weight. The ratio, therefore, is equal to wj/w*, where w* is the lowest score assigned to the least important criterion and wj is the score for the jth criterion. Finally, the weights are normalized by dividing each one by the total [54]. In the next step, a decision matrix X= (xij) is constructed using GIS and the ratio estimation procedure, Where ijx .
Step 2: Calculation of the normalized decision matrix
Generally, there are benefit attributes and cost attributes in an MCDM problem. In order to transform various attribute dimensions into non-dimensional units and facilitate inter-attribute comparisons, several known standardized equations are introduced to normalize each attribute value xij in decision matrix nmij )x(X .The following equation is the most frequently used method of
calculating the normalized value rij [55]:
mnmm
n
n
n
m
nmij
rrr
rrrrrr
uuu
A
AA
)r(R
21
22221
11211
21
2
1
(2)
Where
m
iijijij )x(/xr
1
2 (3)
For benefit attribute Nj,Mi,xij
))x(/x(rm
iijijij
1
21 (4)
For cost attribute Nj,Mi,xij .
All criteria, which have been introduced in the GIS layers, including Soluble Sodium Percentage (SSP), Total Dissolved Solid (TDS), Potential of Hydrogen (PH), Electrical Conductivity (EC) of Water, Geology, Land Use, Sediment, Erosion, Slope, Groundwater and Discharge, are transformed to non-dimensional attributes using equations 3 and 4.
Step 3: Calculation of the weighted normalized decision matrix
In the third step the weighted normalized value vij is calculated by multiplying the normalized decision matrix by the normalized weights of criteria:
ijjij rwv (5)
where i = 1, … , m; j = 1, … , n , m is the number of attribute value in each criterion, n is the number of criteria, and wj is the normalized weight of the j-th criterion, 𝑤 =
𝑊∑ 𝑊 so that
∑ 𝑤 = 1 , Wj is the original weight assigned to each criterion.
Step 4: Determination of the positive ideal solutions and negative ideal solutions
The positive ideal solution minimizes the cost criteria and maximizes the benefit criteria; on the contrary, the negative ideal solution maximizes the cost criteria and minimizes the benefit criteria. The equations are as follows:
]v,,v,,v[A nj 1 (6)
Preprints (www.preprints.org) | NOT PEER-REVIEWED | Posted: 1 November 2018 doi:10.20944/preprints201810.0773.v1
]v,,v,,v[A nj 1 (7)
Where A denotes the positive ideal solution and A denotes the negative ideal solution and
criterion l beneficiaa is criterion jth the if21
21
m,..,,i}v{minv
m,..,,i}v{maxv
iji
j
iji
j
criterion cost a is criterion jth the if21
21
m,..,,i}v{maxv
m,..,,i}v{minv
ijij
ijij
Where ijv denotes the attribute values of each cell for the j-th layer.
Step 5: Calculation of the separation of each alternative from the positive ideal solution and the negative ideal solution
In this step, the separation of each alternative from the positive ideal solution and the negative ideal solution is calculated and then two different GIS layers
iS and iS are created. The equations
are as follows. The separation from the positive ideal solution for each alternative is given as:
n
jij
n
jjiji DvvS
11 (8)
The separation from the negative ideal solution for each alternative is given as:
n
jij
n
jjiji DvvS
11 (9)
Step 6: Calculation of the relative closeness to the positive ideal solution
The relative closeness of the i-th alternative jA with respect to the positive ideal solution can be calculated as:
)SS/()S(C iiii (10)
Where 10 iC , i = 1,2, … , m.
Step 7: Determination of the rank of the alternatives according to the relative closeness
In last step, the values of “the relative closeness to the positive ideal solution” layer created in step 6 are determined for sites selected based on topographical conditions. A set of sites can now be ranked by the descending order of the value of
iC . The best sites are those that have higher values
of iC and since they are closer to the positive ideal solution, they are preferable and must be chosen
[56].
2.3.2. AHP
The Analytic Hierarchy Process (AHP), developed by Thomas Saaty (1980), is an effective method for dealing with complex decision making [9]. This method helps decision makers set priorities between alternatives, sub-criteria and criteria in the decision making process and also helps them to make the best decision [48]. The following are the main steps of the AHP methodology [9]:
Step 1: Determination of the objective, main-criteria, sub-criteria, alternatives and structure of the hierarchy
Preprints (www.preprints.org) | NOT PEER-REVIEWED | Posted: 1 November 2018 doi:10.20944/preprints201810.0773.v1
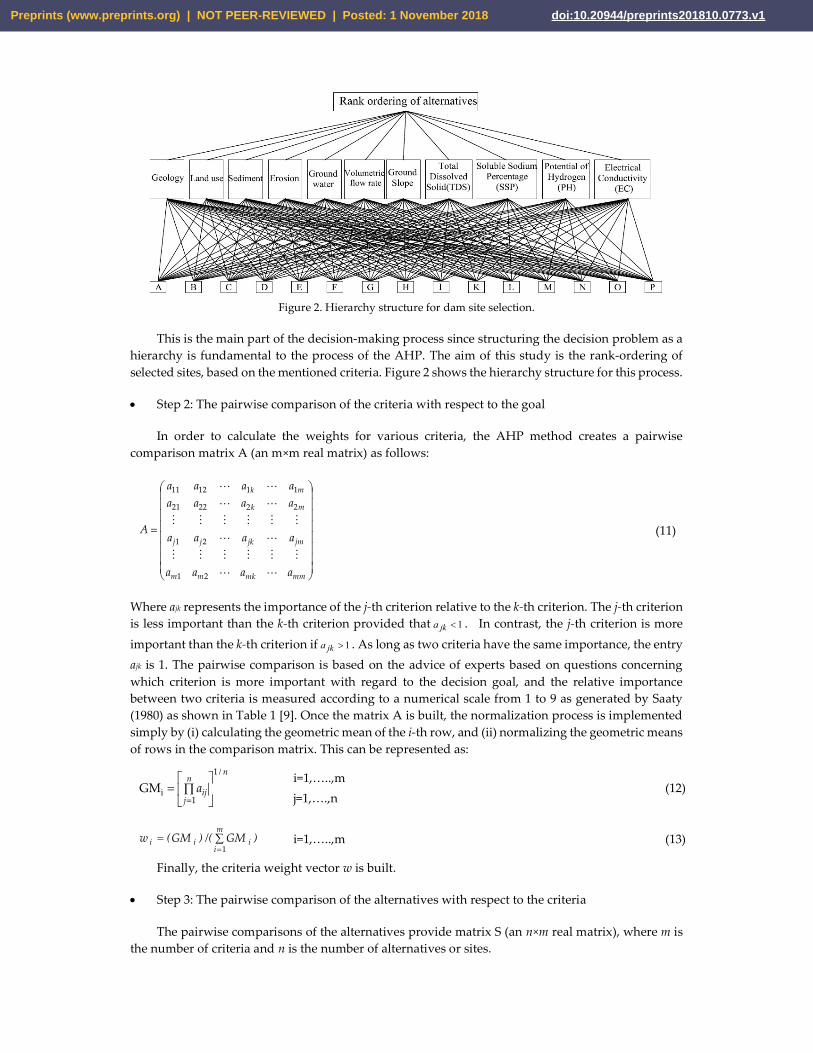
Figure 2. Hierarchy structure for dam site selection.
This is the main part of the decision-making process since structuring the decision problem as a hierarchy is fundamental to the process of the AHP. The aim of this study is the rank-ordering of selected sites, based on the mentioned criteria. Figure 2 shows the hierarchy structure for this process.
Step 2: The pairwise comparison of the criteria with respect to the goal
In order to calculate the weights for various criteria, the AHP method creates a pairwise comparison matrix A (an m×m real matrix) as follows:
mmmkmm
jmjkjj
mk
mk
aaaa
aaaa
aaaaaaaa
A
21
21
222221
111211
(11)
Where ajk represents the importance of the j-th criterion relative to the k-th criterion. The j-th criterion is less important than the k-th criterion provided that 1jka . In contrast, the j-th criterion is more important than the k-th criterion if 1jka . As long as two criteria have the same importance, the entry ajk is 1. The pairwise comparison is based on the advice of experts based on questions concerning which criterion is more important with regard to the decision goal, and the relative importance between two criteria is measured according to a numerical scale from 1 to 9 as generated by Saaty (1980) as shown in Table 1 [9]. Once the matrix A is built, the normalization process is implemented simply by (i) calculating the geometric mean of the i-th row, and (ii) normalizing the geometric means of rows in the comparison matrix. This can be represented as:
n/n
jija
1
1iGM
i=1,…..,m j=1,….,n
(12)
)GM/()GM(wm
iiii
1 i=1,…..,m
(13)
Finally, the criteria weight vector w is built.
Step 3: The pairwise comparison of the alternatives with respect to the criteria
The pairwise comparisons of the alternatives provide matrix S (an n×m real matrix), where m is the number of criteria and n is the number of alternatives or sites.
Preprints (www.preprints.org) | NOT PEER-REVIEWED | Posted: 1 November 2018 doi:10.20944/preprints201810.0773.v1
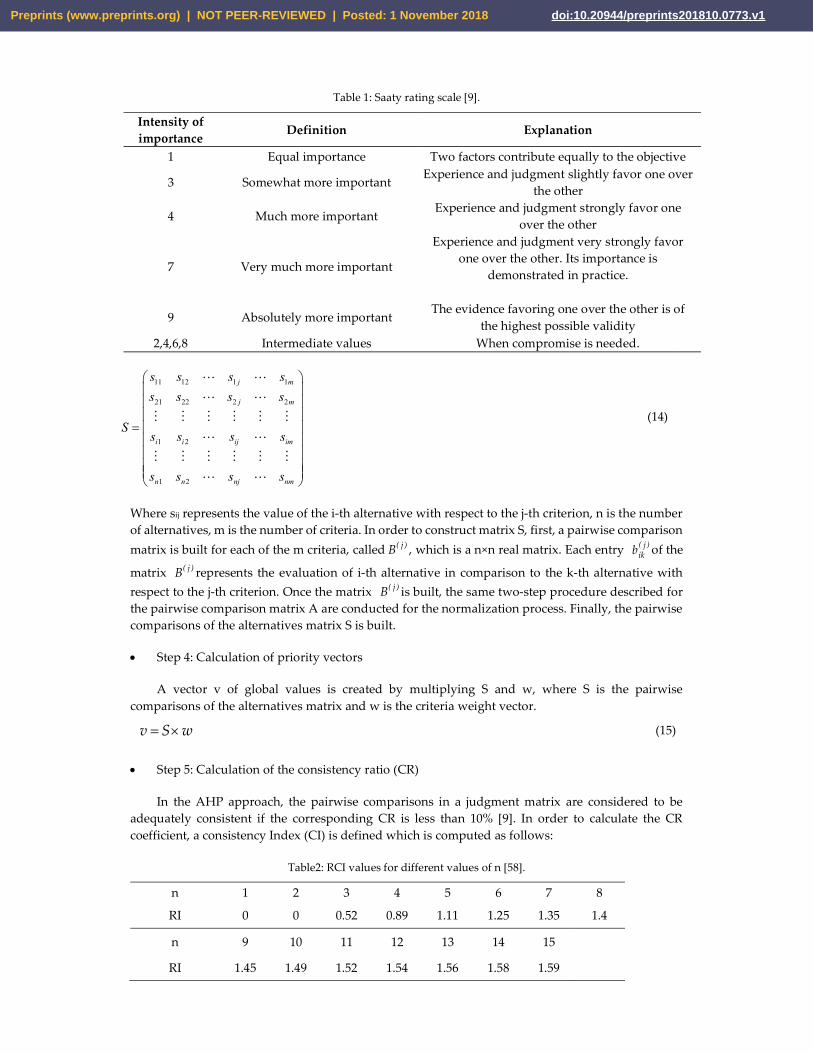
Table 1: Saaty rating scale [9].
Intensity of importance
Definition Explanation
1 Equal importance Two factors contribute equally to the objective
3 Somewhat more important Experience and judgment slightly favor one over the other
4 Much more important Experience and judgment strongly favor one
over the other
7 Very much more important
Experience and judgment very strongly favor one over the other. Its importance is
demonstrated in practice.
9 Absolutely more important The evidence favoring one over the other is of
the highest possible validity 2,4,6,8 Intermediate values When compromise is needed.
11 12 1 1
21 22 2 2
1 2
1 2
j m
j m
i i ij im
n n nj nm
s s s s
s s s s
Ss s s s
s s s s
(14)
Where sij represents the value of the i-th alternative with respect to the j-th criterion, n is the number of alternatives, m is the number of criteria. In order to construct matrix S, first, a pairwise comparison matrix is built for each of the m criteria, called )j(B , which is a n×n real matrix. Each entry )j(
ikb of the
matrix )j(B represents the evaluation of i-th alternative in comparison to the k-th alternative with respect to the j-th criterion. Once the matrix )j(B is built, the same two-step procedure described for the pairwise comparison matrix A are conducted for the normalization process. Finally, the pairwise comparisons of the alternatives matrix S is built.
Step 4: Calculation of priority vectors
A vector v of global values is created by multiplying S and w, where S is the pairwise comparisons of the alternatives matrix and w is the criteria weight vector.
wSv (15)
Step 5: Calculation of the consistency ratio (CR)
In the AHP approach, the pairwise comparisons in a judgment matrix are considered to be adequately consistent if the corresponding CR is less than 10% [9]. In order to calculate the CR coefficient, a consistency Index (CI) is defined which is computed as follows:
Table2: RCI values for different values of n [58].
n 1 2 3 4 5 6 7 8
RI 0 0 0.52 0.89 1.11 1.25 1.35 1.4
n 9 10 11 12 13 14 15
RI 1.45 1.49 1.52 1.54 1.56 1.58 1.59
Preprints (www.preprints.org) | NOT PEER-REVIEWED | Posted: 1 November 2018 doi:10.20944/preprints201810.0773.v1
)n/()n()CI( max 1 (16)
Where λmax is the maximum eigenvalue of the pairwise comparison matrix. According to Saaty’s theorem, for a given positive matrix A, the only positive vector x and only positive constant c that satisfy Ax=cx, is a vector x that is a positive multiple of the Perron vector (principal eigenvector) of A, and the only such c is the Perron value (principal eigenvalue) of A [57]. Saaty calculates λmax by adding the columns of matrix A and then multiplying the resulting vector with the vector x. The CR coefficient is calculated by dividing the CI value by the Random Consistency Index (RCI) as given in (Table 2).
ntinconsiste is data achieved 10%,CR If
consistent is data achieved 10%, CR If
RCI/CICR (17)
Step 6: Analysis of the AHP scores
If the model is consistent, the best alternative will be chosen based on the matrix calculated in Step 4.
3. Results and Discussion
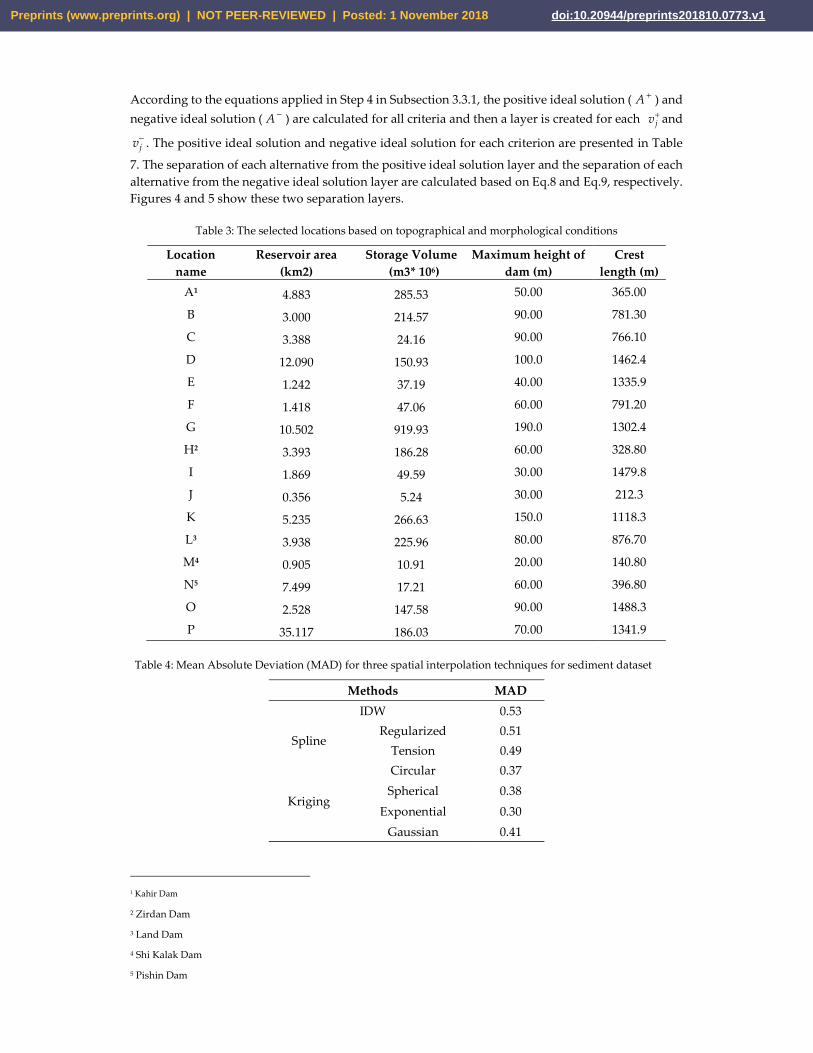
The first task consists in checking the routes of streams using a Digital Elevation Model (DEM) layer and finding locations that are suitable for constructing a dam based on the valley shape. At this stage, 16 points that meet the aforementioned conditions are located. Then, the volume of water that can be stored in a basin is calculated for each selected location based on the crest length. In this study, the minimum storage volume and maximum crest length are considered as 10×106 m3 and 1.5 Km, respectively. Table 3 shows the crest length and storage volume based on the maximum possible height of the dam. As point J does not satisfy the above condition in terms of storage volume, we will not consider this point as a potential site for constructing a dam. The location of the remaining 15 points are shown in Figure 3.
From Section 3.2, the mean absolute deviation for each of seven datasets and three interpolation methods are calculated. The results for the sediment dataset are shown in Table 4. As it can be seen, the exponential kriging has the lowest MAD and hence can be considered as the best interpolation method for this dataset. The selected method for each of these seven criterion are shown in Table 5. All datasets show the lowest MAD in kriging method which shows its superiority over the IDW and Spline methods.
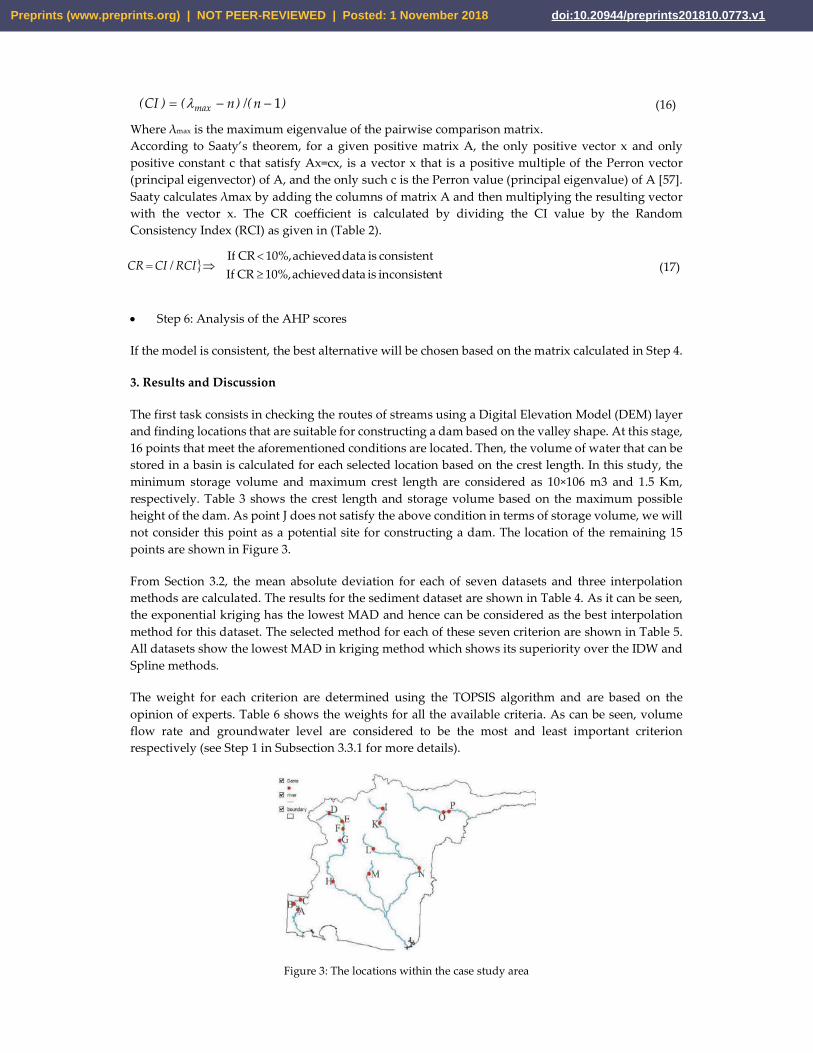
The weight for each criterion are determined using the TOPSIS algorithm and are based on the opinion of experts. Table 6 shows the weights for all the available criteria. As can be seen, volume flow rate and groundwater level are considered to be the most and least important criterion respectively (see Step 1 in Subsection 3.3.1 for more details).
Figure 3: The locations within the case study area
Preprints (www.preprints.org) | NOT PEER-REVIEWED | Posted: 1 November 2018 doi:10.20944/preprints201810.0773.v1
According to the equations applied in Step 4 in Subsection 3.3.1, the positive ideal solution ( A ) and negative ideal solution ( A ) are calculated for all criteria and then a layer is created for each
jv andjv . The positive ideal solution and negative ideal solution for each criterion are presented in Table
7. The separation of each alternative from the positive ideal solution layer and the separation of each alternative from the negative ideal solution layer are calculated based on Eq.8 and Eq.9, respectively. Figures 4 and 5 show these two separation layers.
Table 3: The selected locations based on topographical and morphological conditions
Location name
Reservoir area (km2)
Storage Volume (m3* 106)
Maximum height of dam (m)
Crest length (m)
A1 4.883 285.53 50.00 365.00
B 3.000 214.57 90.00 781.30
C 3.388 24.16 90.00 766.10
D 12.090 150.93 100.0 1462.4
E 1.242 37.19 40.00 1335.9
F 1.418 47.06 60.00 791.20
G 10.502 919.93 190.0 1302.4
H2 3.393 186.28 60.00 328.80
I 1.869 49.59 30.00 1479.8
J 0.356 5.24 30.00 212.3
K 5.235 266.63 150.0 1118.3
L3 3.938 225.96 80.00 876.70
M4 0.905 10.91 20.00 140.80
N5 7.499 17.21 60.00 396.80
O 2.528 147.58 90.00 1488.3
P 35.117 186.03 70.00 1341.9
Table 4: Mean Absolute Deviation (MAD) for three spatial interpolation techniques for sediment dataset
Methods MAD IDW 0.53
Spline Regularized 0.51
Tension 0.49
Kriging
Circular 0.37 Spherical 0.38
Exponential 0.30 Gaussian 0.41
1 Kahir Dam
2 Zirdan Dam
3 Land Dam
4 Shi Kalak Dam
5 Pishin Dam
Preprints (www.preprints.org) | NOT PEER-REVIEWED | Posted: 1 November 2018 doi:10.20944/preprints201810.0773.v1
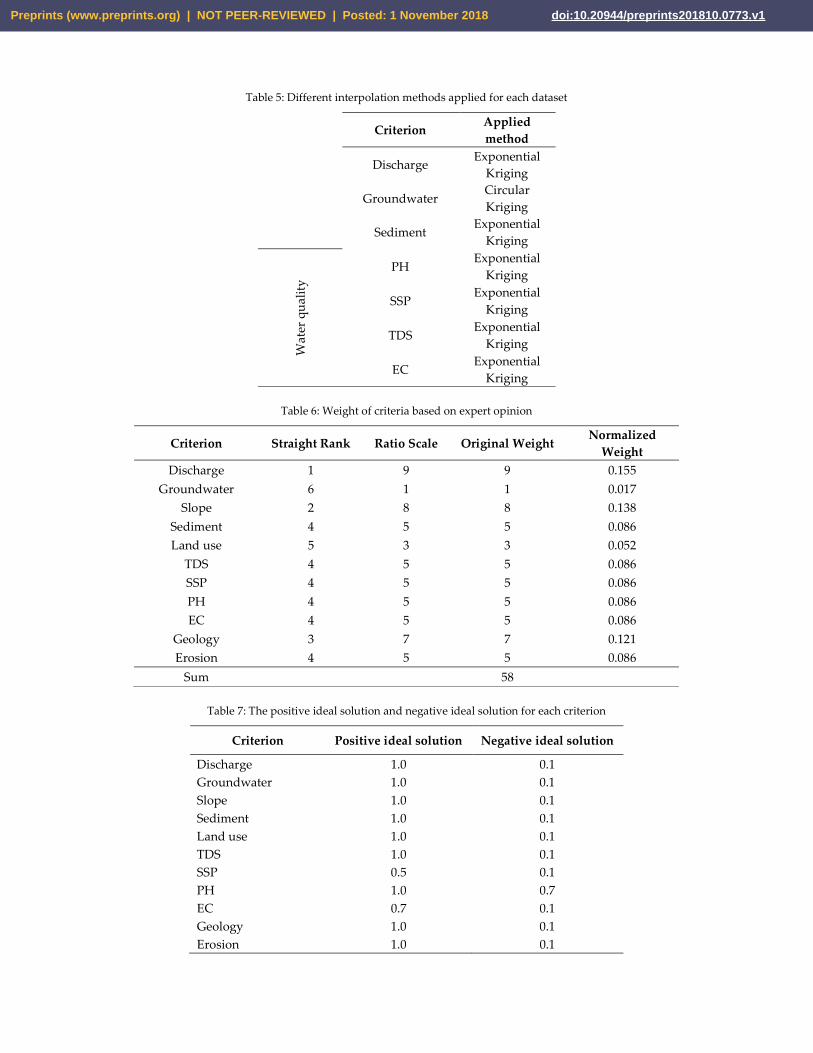
Table 5: Different interpolation methods applied for each dataset
Applied method
Criterion
Exponential Kriging
Discharge
Circular Kriging
Groundwater
Exponential Kriging
Sediment
Exponential Kriging
PH
Wat
er q
ualit
y Exponential
Kriging SSP
Exponential Kriging
TDS
Exponential Kriging
EC
Table 6: Weight of criteria based on expert opinion
Criterion Straight Rank Ratio Scale Original Weight Normalized
Weight Discharge 1 9 9 0.155
Groundwater 6 1 1 0.017 Slope 2 8 8 0.138
Sediment 4 5 5 0.086 Land use 5 3 3 0.052
TDS 4 5 5 0.086 SSP 4 5 5 0.086 PH 4 5 5 0.086 EC 4 5 5 0.086
Geology 3 7 7 0.121 Erosion 4 5 5 0.086
Sum 58
Table 7: The positive ideal solution and negative ideal solution for each criterion
Criterion Positive ideal solution Negative ideal solution
Discharge 1.0 0.1 Groundwater 1.0 0.1 Slope 1.0 0.1 Sediment 1.0 0.1 Land use 1.0 0.1 TDS 1.0 0.1 SSP 0.5 0.1 PH 1.0 0.7 EC 0.7 0.1 Geology 1.0 0.1 Erosion 1.0 0.1
Preprints (www.preprints.org) | NOT PEER-REVIEWED | Posted: 1 November 2018 doi:10.20944/preprints201810.0773.v1
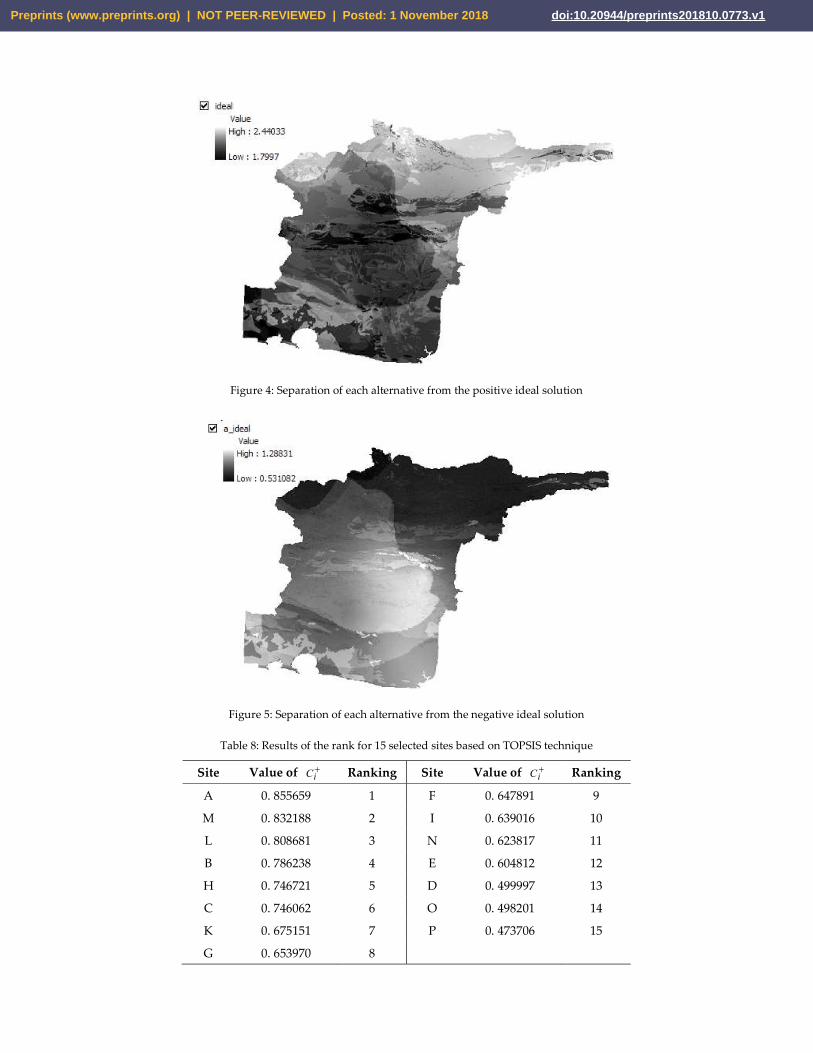
Figure 4: Separation of each alternative from the positive ideal solution
Figure 5: Separation of each alternative from the negative ideal solution
Table 8: Results of the rank for 15 selected sites based on TOPSIS technique
Site Value of iC Ranking Site Value of
iC Ranking
A 0. 855659 1 F 0. 647891 9
M 0. 832188 2 I 0. 639016 10
L 0. 808681 3 N 0. 623817 11
B 0. 786238 4 E 0. 604812 12
H 0. 746721 5 D 0. 499997 13
C 0. 746062 6 O 0. 498201 14
K 0. 675151 7 P 0. 473706 15
G 0. 653970 8
Preprints (www.preprints.org) | NOT PEER-REVIEWED | Posted: 1 November 2018 doi:10.20944/preprints201810.0773.v1
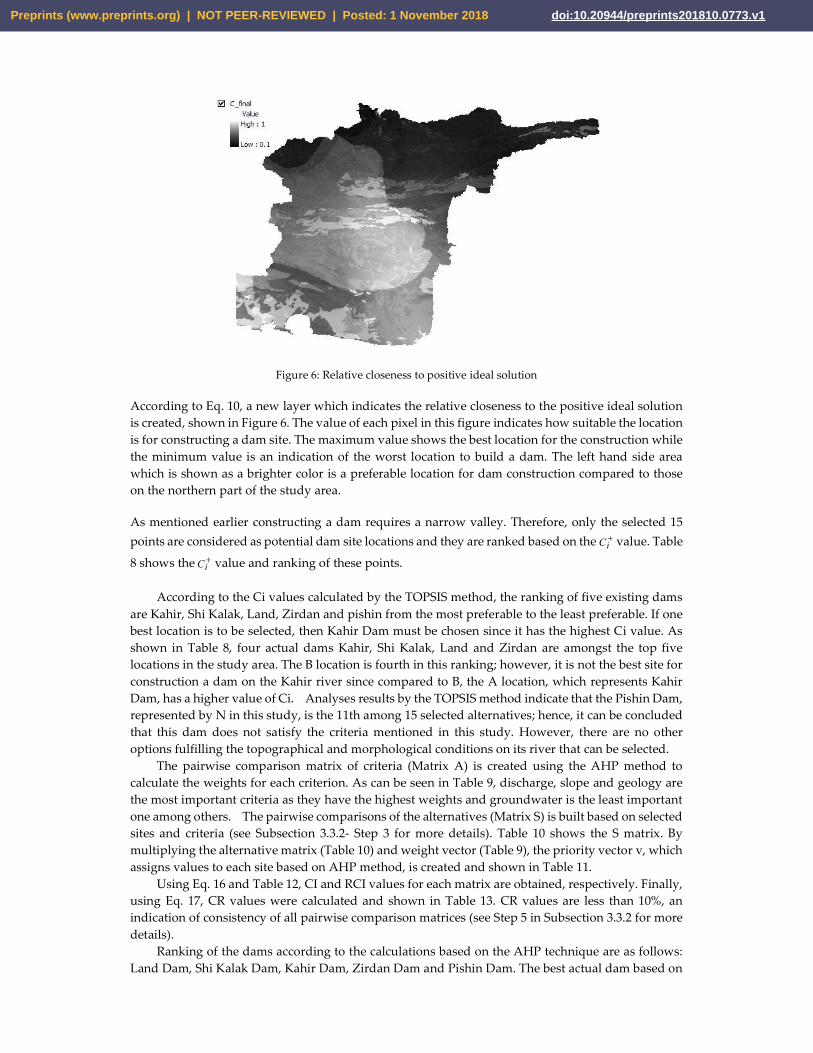
Figure 6: Relative closeness to positive ideal solution
According to Eq. 10, a new layer which indicates the relative closeness to the positive ideal solution is created, shown in Figure 6. The value of each pixel in this figure indicates how suitable the location is for constructing a dam site. The maximum value shows the best location for the construction while the minimum value is an indication of the worst location to build a dam. The left hand side area which is shown as a brighter color is a preferable location for dam construction compared to those on the northern part of the study area.
As mentioned earlier constructing a dam requires a narrow valley. Therefore, only the selected 15 points are considered as potential dam site locations and they are ranked based on the
iC value. Table
8 shows the iC value and ranking of these points.
According to the Ci values calculated by the TOPSIS method, the ranking of five existing dams are Kahir, Shi Kalak, Land, Zirdan and pishin from the most preferable to the least preferable. If one best location is to be selected, then Kahir Dam must be chosen since it has the highest Ci value. As shown in Table 8, four actual dams Kahir, Shi Kalak, Land and Zirdan are amongst the top five locations in the study area. The B location is fourth in this ranking; however, it is not the best site for construction a dam on the Kahir river since compared to B, the A location, which represents Kahir Dam, has a higher value of Ci. Analyses results by the TOPSIS method indicate that the Pishin Dam, represented by N in this study, is the 11th among 15 selected alternatives; hence, it can be concluded that this dam does not satisfy the criteria mentioned in this study. However, there are no other options fulfilling the topographical and morphological conditions on its river that can be selected.
The pairwise comparison matrix of criteria (Matrix A) is created using the AHP method to calculate the weights for each criterion. As can be seen in Table 9, discharge, slope and geology are the most important criteria as they have the highest weights and groundwater is the least important one among others. The pairwise comparisons of the alternatives (Matrix S) is built based on selected sites and criteria (see Subsection 3.3.2- Step 3 for more details). Table 10 shows the S matrix. By multiplying the alternative matrix (Table 10) and weight vector (Table 9), the priority vector v, which assigns values to each site based on AHP method, is created and shown in Table 11.
Using Eq. 16 and Table 12, CI and RCI values for each matrix are obtained, respectively. Finally, using Eq. 17, CR values were calculated and shown in Table 13. CR values are less than 10%, an indication of consistency of all pairwise comparison matrices (see Step 5 in Subsection 3.3.2 for more details).
Ranking of the dams according to the calculations based on the AHP technique are as follows: Land Dam, Shi Kalak Dam, Kahir Dam, Zirdan Dam and Pishin Dam. The best actual dam based on
Preprints (www.preprints.org) | NOT PEER-REVIEWED | Posted: 1 November 2018 doi:10.20944/preprints201810.0773.v1
the AHP method is the Land Dam as presented in Table 13. Since there are two other alternatives, B and C, on the Kahir river that have a higher score than Kahir Dam, A, it can be inferred that the results achieved from the AHP technique, unlike TOPSIS, are not sufficiently accurate but, nevertheless, results from the AHP method show that the Pishin Dam is 11th amidst 15 selected alternatives.
Table 9: The criteria weight vector w
Criteria Q1 GW2 Slope Sediment Land use
TDS SSP PH EC Geo3 Erosion w
Q 1 9 1.13 1.8 3 1.8 1.8 1.8 1.8 1.29 1.8 0.155
GW 0.11 1 0.13 0.2 0.33 0.2 0.2 0.2 0.2 0.14 0.2 0.017
Slope 0.89 8 1 1.6 2.67 1.6 1.6 1.6 1.6 1.14 1.6 0.138 Sediment 0.56 5 0.63 1 1.67 1 1 1 1 0.71 1 0.086 Land use 0.33 3 0.38 0.6 1 0.6 0.6 0.6 0.6 0.43 0.6 0.052 TDS 0.56 5 0.63 1 1.67 1 1 1 1 0.71 1 0.086 SSP 0.56 5 0.63 1 1.67 1 1 1 1 0.71 1 0.086 PH 0.56 5 0.63 1 1.67 1 1 1 1 0.71 1 0.086 EC 0.56 5 0.63 1 1.67 1 1 1 1 0.71 1 0.086 Geo 0.78 7 0.88 1.4 2.33 1.4 1.4 1.4 1.4 1 1.4 0.121 Erosion 0.56 5 0.63 1 1.67 1 1 1 1 0.71 1 0.086
Table 10: The pairwise comparisons of the alternatives matrix S
Discharge Ground
water Slope Sediment
Land use
TDS SSP PH EC Geology Erosion
A 0.106 0.056 0.064 0.061 0.029 0.093 0.053 0.067 0.078 0.034 0.085
B 0.105 0.051 0.066 0.062 0.029 0.009 0.053 0.067 0.078 0.207 0.074
C 0.100 0.050 0.067 0.064 0.057 0.047 0.053 0.067 0.044 0.207 0.074
D 0.032 0.025 0.066 0.072 0.086 0.047 0.053 0.067 0.044 0.034 0.083
E 0.053 0.070 0.067 0.070 0.057 0.009 0.053 0.067 0.078 0.034 0.070
F 0.047 0.068 0.067 0.070 0.086 0.093 0.053 0.067 0.078 0.034 0.068
G 0.055 0.054 0.067 0.069 0.086 0.093 0.053 0.067 0.078 0.034 0.068
H 0.077 0.057 0.067 0.068 0.057 0.093 0.053 0.067 0.078 0.034 0.042
I 0.016 0.120 0.067 0.075 0.086 0.093 0.263 0.067 0.078 0.034 0.090
K 0.046 0.088 0.067 0.076 0.086 0.093 0.053 0.067 0.078 0.034 0.091
L 0.090 0.104 0.067 0.066 0.057 0.093 0.053 0.067 0.078 0.103 0.083
M 0.095 0.064 0.067 0.064 0.086 0.093 0.053 0.067 0.078 0.103 0.053
N 0.112 0.061 0.067 0.037 0.029 0.047 0.053 0.067 0.044 0.034 0.091
O 0.035 0.067 0.066 0.072 0.086 0.047 0.053 0.067 0.044 0.034 0.019
P 0.031 0.064 0.066 0.072 0.086 0.047 0.053 0.067 0.044 0.034 0.010
1 Discharge 2 Groundwater 3 Geology
Preprints (www.preprints.org) | NOT PEER-REVIEWED | Posted: 1 November 2018 doi:10.20944/preprints201810.0773.v1
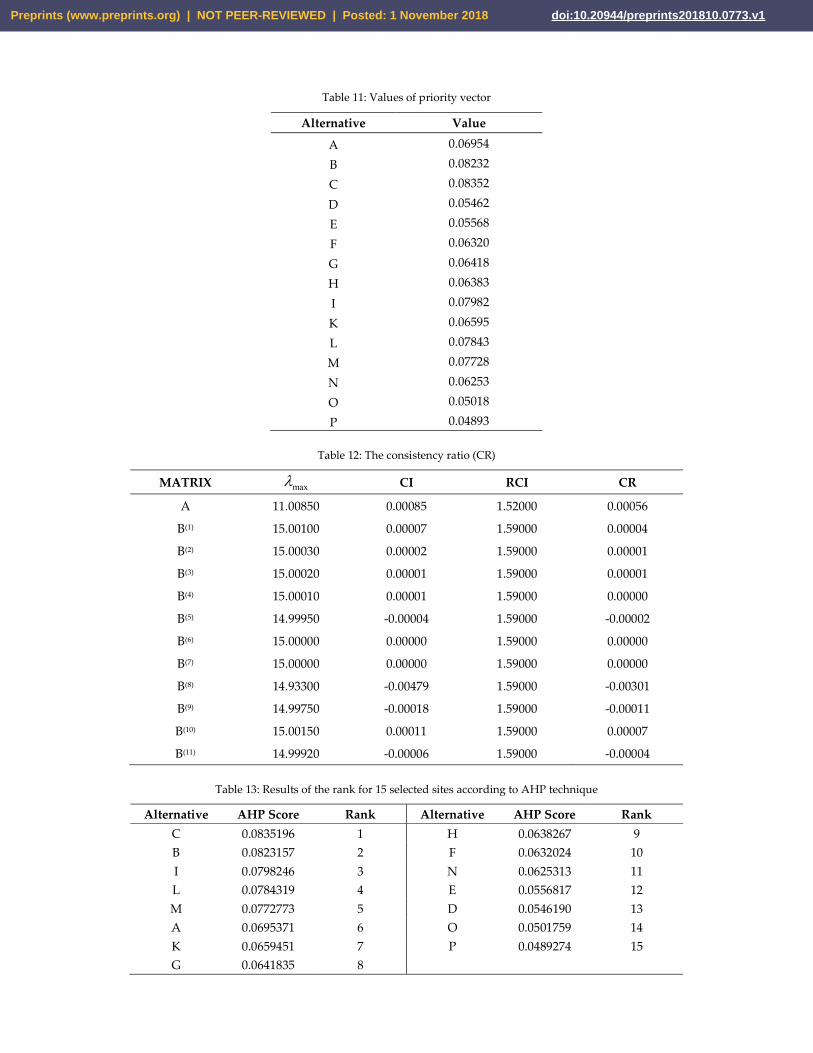
Table 11: Values of priority vector
Alternative Value
A 0.06954
B 0.08232
C 0.08352
D 0.05462
E 0.05568
F 0.06320
G 0.06418
H 0.06383
I 0.07982
K 0.06595
L 0.07843
M 0.07728
N 0.06253
O 0.05018
P 0.04893
Table 12: The consistency ratio (CR)
MATRIX max CI RCI CR
A 11.00850 0.00085 1.52000 0.00056
B(1) 15.00100 0.00007 1.59000 0.00004
B(2) 15.00030 0.00002 1.59000 0.00001
B(3) 15.00020 0.00001 1.59000 0.00001
B(4) 15.00010 0.00001 1.59000 0.00000
B(5) 14.99950 -0.00004 1.59000 -0.00002
B(6) 15.00000 0.00000 1.59000 0.00000
B(7) 15.00000 0.00000 1.59000 0.00000
B(8) 14.93300 -0.00479 1.59000 -0.00301
B(9) 14.99750 -0.00018 1.59000 -0.00011
B(10) 15.00150 0.00011 1.59000 0.00007
B(11) 14.99920 -0.00006 1.59000 -0.00004
Table 13: Results of the rank for 15 selected sites according to AHP technique
Alternative AHP Score Rank Alternative AHP Score Rank C 0.0835196 1 H 0.0638267 9 B 0.0823157 2 F 0.0632024 10 I 0.0798246 3 N 0.0625313 11 L 0.0784319 4 E 0.0556817 12 M 0.0772773 5 D 0.0546190 13 A 0.0695371 6 O 0.0501759 14 K 0.0659451 7 P 0.0489274 15 G 0.0641835 8
Preprints (www.preprints.org) | NOT PEER-REVIEWED | Posted: 1 November 2018 doi:10.20944/preprints201810.0773.v1
4. Conclusion
In the academic literature there is limited discussion of the dam site selection problem despite the fact that it represents a very important strategic decision. Generally, dam site selection is performed by traditional methods of decision making or by political interests. Cost and resource availability are two important factors in the traditional decision making approach; accordingly, a location near to a mine or water source may be selected without making a holistic and systematic analysis. Furthermore, political factors may also affect the location decision, resulting in high operational and transmission costs, low productivity, and significant negative impact on society due to increased environmental pollution [28]. Hence, the dam site selection process should consider precisely not only the technical issues, but also its impact on economic, social and ecological environment. Thus, a scientific approach is necessary for detailed study of all relevant factors to determine the best sites for a dam so as to protect the interest of all stakeholders. In this context, within the scope of the study, a comparative study of the TOPSIS and AHP models using GIS is proposed to determine the most appropriate locations for constructing dams in Sistan and Baluchestan Province, Iran. The approach considers topographical conditions in addition the factors Soluble Sodium Percentage (SSP), Total Dissolved Solid (TDS), Potential of Hydrogen (PH), Electrical Conductivity (EC) of water, Geology, Land use, Sediment, Erosion, Groundwater and Discharge. Accordingly, the proposed model for the dam site selection problem consists of four basic stages: (1) selecting possible locations based on topographical and morphological conditions; (2) application of the TOPSIS technique using GIS and prioritizing the sites selected in the previous stage; (3) application of the AHP method and ranking the sites selected in the first stage; and (4) comparing the results of the TOPSIS and AHP models. According to the results of the TOPSIS method, four actual dams Kahir, Shi Kalak, Land and Zirdan, respectively, are the best sites for building a dam in the region. There are three selected sites, A, B and C, on the Kahir river with the Kahir Dam, A, being the best location amongst them. The most suitable location amid the five sites selected based on topographical and morphological conditions, E, F, G, H and D, is the Zirdan Dam, which is shown by the H character. However, there are no options for the Land Dam, Shi Kalak Dam and Pishin Dam to choose on their rivers. According to the AHP method, the best location in the region for constructing a dam is C, which is located on the Kahir River. In this ranking four actual dams are not amongst the top three sites, whereas in the ranking based on the TOPSIS technique four dams constructed in the area are the best selection. Therefore, it can be concluded that the TOPSIS method is a more appropriate technique than the AHP method in locating dam based on the criteria mentioned in the paper.
Author Contributions: The authors have contributed to this paper at different levels. As the lead author, Ali Jozaghi conceived and designed the methodology. Ali Jozaghi along with Babak Alizadeh, Mohsen Hatami and Mohammad Khorrami equally contributed to manuscript writing and revision. Ian Flood reviewed the paper and provided helpful comments on improving its quality in all aspects. Ali Jozaghi, Babak Alizadeh, Mohsen Hatami and Erfan Ghasemi Tousi equally contributed to analyzing the results of this paper. And finally, Nastaran Khodaei, Babak Alizadeh and Ali Jozaghi contributed to literature review for this paper.
Conflicts of Interest: The authors declare no conflict of interest.
References
1. Beck, M. W., Claassen, A. H., & Hundt, P. J. (2012). Environmental and livelihood impacts of dams: Common lessons across development gradients that challenge sustainability. International Journal of River Basin Management. https://doi.org/10.1080/15715124.2012.656133
2. Fearnside, P. M. (2016). Environmental and Social Impacts of Hydroelectric Dams in Brazilian Amazonia: Implications for the Aluminum Industry. World Development, 77, 48–65. https://doi.org/10.1016/j.worlddev.2015.08.015
Preprints (www.preprints.org) | NOT PEER-REVIEWED | Posted: 1 November 2018 doi:10.20944/preprints201810.0773.v1
3. Shafieardekani, M., & Hatami, M. (2013). Forecasting Land Use Change in suburb by using Time series and Spatial Approach; Evidence from Intermediate Cities of Iran. European Journal of Scientific Research, 116(2), 199-208.
4. Rahman, M. A., Jaumann, L., Lerche, N., Renatus, F., Buchs, A. K., Gade, R., … Sauter, M. (2015). Selection of the Best Inland Waterway Structure: A Multicriteria Decision Analysis Approach. Water Resources Management, 29(8), 2733–2749. https://doi.org/10.1007/s11269-015-0967-1
5. Afshari, A., Vatanparast, M., & Ćoćkalo, D. (2016). Application of multi criteria decision making to urban planning - A review. JOURNAL OF ENGINEERING MANAGEMENT AND COMPETITIVENESS (JEMC), 6, 46–53.
6. Mollalo, A., Alimohammadi, A., Shirzadi, M. R., & Malek, M. R. (2015). Geographic information system-based analysis of the spatial and spatio-temporal distribution of zoonotic cutaneous leishmaniasis in Golestan Province, north-east of Iran. Zoonoses and public health, 62(1), 18-28.
7. Mollalo, A., Sadeghian, A., Israel, G. D., Rashidi, P., Sofizadeh, A., & Glass, G. E. (2018). Machine learning approaches in GIS-based ecological modeling of the sand fly Phlebotomus papatasi, a vector of zoonotic cutaneous leishmaniasis in Golestan province, Iran. Acta tropica, 188, 187-194.
8. Belton, V., & Stewart, T. (2002). Multiple criteria decision analysis: an integrated approach: Springer Science & Business Media. Norwell, Massachussets, US and Dordrecht, The Netherlands
9. Saaty, T. L. (1980). The analytic hierarchy process: planning, priority setting, resources allocation. McGraw-Hill Inc. Retrieved from http://www.mendeley.com/research/the-analytic-hierarchy-process/
10. Tung, S. L., & Tang, S. L. (1998). A comparison of the Saaty’s AHP and modified AHP for right and left eigenvector inconsistency. European Journal of Operational Research, 106, 123–128.
11. Hwang, C.-L., & Yoon, K. (1981). Methods for Multiple Attribute Decision Making. In Multiple Attribute Decision Making: Methods and Applications A State-of-the-Art Survey (pp. 58–191). https://doi.org/10.1007/978-3-642-48318-9_3
12. Kaushal, V., and Guleria, S.P. (2015). Geotechnical Investigation of Black Cotton Soils. International Journal of Advances in Engineering Sciences Vol.5, Issue 2,
13. Hassani, A. N., Katibeh, H., & Farhadian, H. (2016). Numerical analysis of steady-state groundwater inflow into Tabriz line 2 metro tunnel, northwestern Iran, with special consideration of model dimensions. Bulletin of Engineering Geology and the Environment, 75(4), 1617-1627.
14. Hassani, A. N., Farhadian, H., & Katibeh, H. (2018). A comparative study on evaluation of steady-state groundwater inflow into a circular shallow tunnel. Tunnelling and Underground Space Technology, 73, 15-25.
15. Sadooghi, A., Kibert, C., Sadeghi, F. M., & Jafari, S. (2019). Thermal performance analysis of a traditional passive cooling system in Dezful, Iran. Tunnelling and Underground Space Technology, 83, 291-302.
16. Piadeh, F., Moghaddam, M. R. A., & Mardan, S. (2014). Present situation of wastewater treatment in the Iranian industrial estates: recycle and reuse as a solution for achieving goals of eco-industrial parks. Resources, Conservation and Recycling, 92, 172-178.
17. Piadeh, F., Alavi-Moghaddam, M. R., & Mardan, S. (2018). Assessment of sustainability of a hybrid of advanced treatment technologies for recycling industrial wastewater in developing countries: Case study of Iranian industrial parks. Journal of Cleaner Production, 170, 1136-1150.
18. Moud, H. I., Shojaei, A., Flood, I., Zhang, X., & Hatami, M. (2018). Qualitative and Quantitative Risk Analysis of Unmanned Aerial Vehicle Flights over Construction Job Sites. In Proceedings of the Eighth International Conference on Advanced Communications and Computation (INFOCOMP 2018) , Barcelona, Spain, 22–26 July 2018; pp. 80–87.
19. Hatami, M., & Shafieardekani, M. (2014). The Effect of Industrialization on Land Use Changes; Evidence from Intermediate Cities of Iran. International Journal of Current Life Sciences, 4(12), 11899-11902.
20. Anane, M., Bouziri, L., Limam, A., & Jellali, S. (2012). Ranking suitable sites for irrigation with reclaimed water in the Nabeul-Hammamet region (Tunisia) using GIS and AHP-multicriteria decision analysis. Resources, Conservation and Recycling, 65, 36–46. https://doi.org/10.1016/j.resconrec.2012.05.006
21. Kim, Y., Chung, E.-S., Jun, S.-M., & Kim, S. U. (2013). Prioritizing the best sites for treated wastewater instream use in an urban watershed using fuzzy TOPSIS. Resources, Conservation and Recycling, 73, 23–32. https://doi.org/10.1016/j.resconrec.2012.12.009
22. Şengül, Ü., Eren, M., Eslamian Shiraz, S., Gezder, V., & Sengül, A. B. (2015). Fuzzy TOPSIS method for ranking renewable energy supply systems in Turkey. Renewable Energy, 75, 617–625. https://doi.org/10.1016/j.renene.2014.10.045
Preprints (www.preprints.org) | NOT PEER-REVIEWED | Posted: 1 November 2018 doi:10.20944/preprints201810.0773.v1
23. Zyoud, S., Kaufmann, L., Shaheen, H., Samhan, S., & Fuchs-Hanusch, D. (2016). A framework for water loss management in developing countries under fuzzy environment: Integration of Fuzzy AHP with Fuzzy TOPSIS. Expert Systems with Applications, 61.
24. Lahijanian, B., Zarandi, M. H. F., and Farahani, F. V. (2016a). Double coverage ambulance location modeling using fuzzy traveling time. Fuzzy Information Processing Society (NAFIPS). El Paso, Tx: Annual Conference of the North American.
25. Lahijanian, B., Zarandi, M. H. F., and Farahani, F. V. (2016b). Proposing a model for operating room scheduling based on fuzzy surgical duration. Fuzzy Information Processing Society (NAFIPS). El Paso, Tx: Annual Conference of the North American.
26. Adibfar, A., & Costin, A. (2019). Next Generation of Transportation Infrastructure Management: Fusion of Intelligent Transportation Systems (ITS) and Bridge Information Modeling (BrIM). In Advances in Informatics and Computing in Civil and Construction Engineering (pp. 43-50). Springer, Cham.
27. Costin, A., Adibfar, A., Hu, H., & Chen, S. S. (2018). Building Information Modeling (BIM) for transportation infrastructure–Literature review, applications, challenges, and recommendations. Automation in Construction, 94, 257-281.
28. Choudhary, D., & Shankar, R. (2012). An STEEP-fuzzy AHP-TOPSIS framework for evaluation and selection of thermal power plant location: A case study from India. Energy, 42(1), 510–521. https://doi.org/10.1016/j.energy.2012.03.010
29. Minatour, Y., Khazaei, J., & Ataei, M. (2012). Earth dam site selection using the analytic hierarchy process (AHP): A case study in the west of Iran. Arabian Journal of Geosciences, 6.
30. Özcan, E. C., Ünlüsoy, S., & Eren, T. (2017). A combined goal programming – AHP approach supported with TOPSIS for maintenance strategy selection in hydroelectric power plants. Renewable and Sustainable Energy Reviews. https://doi.org/10.1016/j.rser.2017.04.039
31. Esavi, V., Karami, J., Alimohammadi, A., & Niknezhad, S. A. (2012). Comparison the AHP and FUZZY-AHP Decision Making Methods in Underground Dam Site Selection in Taleghan Basin.
32. Önüt, S., & Soner, S. (2008). Transshipment site selection using the AHP and TOPSIS approaches under fuzzy environment. Waste Management, 28(9), 1552-1559.
33. Mulliner, E., Malys, N., & Maliene, V. (2016). Comparative analysis of MCDM methods for the assessment of sustainable housing affordability. Omega, 59, 146-156.
34. Balioti, V., Tzimopoulos, C., & Evangelides, C. (2018, July). Multi-Criteria Decision Making Using TOPSIS Method Under Fuzzy Environment. Application in Spillway Selection. In Multidisciplinary Digital Publishing Institute Proceedings (Vol. 2, No. 11, p. 637).
35. Dai, X, (2016). Dam siteselection using an integrated method of AHP and GIS for decision making support in Bortala, northwest china. In Lund University GEM thesis series NGEM01 20161, Dept of Physical Geography and Ecosystem Science. http://lup.lub.lu.se/student-papers/record/8886448
36. Biranvandzadeh, M., Heshmati jadid, M., & Sorkhkamal, K. (2015). Assessment of Development Level of Sistan and Baluchistan Province Compared to other Iran’s Provinces. International Journal of Architecture and Urban Development, 5(1), 69–76. Retrieved from http://ijaud.srbiau.ac.ir/article_8527.html
37. Kottek, M., J. Grieser, C. Beck, B. Rudolf, and F. Rubel (2006). World Map of the Köppen-Geiger climate classification updated. Meteorologische Zeitschrift, Vol. 15, No. 3, 259-263
38. Johnston, K., Hoef, J. M. Ver, Krivoruchko, K., Lucas, N., Care, E., Johnston, K., Lucas, N. (2001). GIS by ESRI. Analysis, 30(3), 261. Retrieved from http://scholar.google.com/scholar?hl=en&btnG=Search&q=intitle:Getting+Started+with+ArcGIS.+GIS+by+ESRI#0
39. Willmott, C. J., Matsuura, K., & Robeson, S. M. (2009). Ambiguities inherent in sums-of-squares-based error statistics. Atmospheric Environment, 43(3), 749–752. https://doi.org/10.1016/j.atmosenv.2008.10.005
40. Evren Can Özcan, U. K. (2016). Assessment of potential South Gas Corridor projects with a combined methodology. 23rd World Energy Congress, World Energy Council, 105–121.
41. Celik, E., Gul, M., Taskin, A., Ali, G., & Guneri, F. (2012). A Fuzzy TOPSIS Approach Based on Trapezoidal Numbers to Material Selection Problem. International Journal of Information Technology and Management, 19(3), 19–30.
42. Daengdej, J., Lukose, D., & Murison, R. (1999). Using statistical models and case-based reasoning in claims prediction: experience from a real-world problem. Knowledge-Based Systems, 12(5–6), 239–245. https://doi.org/10.1016/S0950-7051(99)00015-5
Preprints (www.preprints.org) | NOT PEER-REVIEWED | Posted: 1 November 2018 doi:10.20944/preprints201810.0773.v1
43. Saaty, T. L. (2006). Rank from comparisons and from ratings in the analytic hierarchy/network processes. In European Journal of Operational Research (Vol. 168, pp. 557–570). https://doi.org/10.1016/j.ejor.2004.04.032
44. Ignizio JP. (1976). Goal programming and extensions. Lexington: Lexington Books. 45. Bernard, R. (1968). Classement Et Choix En Presence De Points De Vue Multiples (»). Revue Française
D’informatique et de Recherche Opérationnelle, 2(8), 57–75. Retrieved from http://www.numdam.org/article/RO_1968__2_1_57_0.pdf
46. Brans, J. P., Mareschal, B., & Vincke, P. (1984). PROMETHEE: A New Family of Outranking Methods in Multicriteria Analysis. In Operational Research (pp. 477–490).
47. Saaty, T. L. (2008). Decision making with the analytic hierarchy process. International Journal of Services Science, 1(1), 83–98. https://doi.org/10.1504/IJSSCI.2008.017590
48. Velasquez, M., & Hester, P. T. (2013). An Analysis of Multi-Criteria Decision Making Methods. International Journal of Operations Research, 10(2), 56–66. https://doi.org/10.1007/978-3-319-12586-2
49. Qin, X. S., Huang, G. H., Chakma, A., Nie, X. H., & Lin, Q. G. (2008). A MCDM-based expert system for climate-change impact assessment and adaptation planning - A case study for the Georgia Basin, Canada. Expert Systems with Applications, 34(3), 2164–2179. https://doi.org/10.1016/j.eswa.2007.02.024
50. İç, Y. T. (2012). An experimental design approach using TOPSIS method for the selection of computer-integrated manufacturing technologies. Robotics and Computer-Integrated Manufacturing, 28(2), 245–256. https://doi.org/10.1016/j.rcim.2011.09.005
51. Ewa, R. (2011). Multi-criteria decision making models by applying the TOPSIS method to crisp and interval data,. Multiple Criteria Decision Making, (Mcdm).
52. Hyde, K. M., Maier, H. R., & Colby, C. B. (2005). A distance-based uncertainty analysis approach to multi-criteria decision analysis for water resource decision making. Journal of Environmental Management, 77(4), 278–290. https://doi.org/10.1016/j.jenvman.2005.06.011
53. Tzeng, G.-H., Chen, T.-Y., & Wang, J.-C. (1998). A weight-assessing method with habitual domains. European Journal of Operational Research, 110(2), 342–367. https://doi.org/10.1016/S0377-2217(97)00246-4
54. Malczewski, J. (1999). GIS and multicriteria decision analysis. Engineering (Vol. 31). Retrieved from http://books.google.com/books?hl=en&lr=&id=2Zd54x4_2Z8C&pgis=1
55. Yue, Z. (2011). A method for group decision-making based on determining weights of decision makers using TOPSIS. Applied Mathematical Modelling, 35(4), 1926–1936. https://doi.org/10.1016/j.apm.2010.11.001
56. Krohling, R. A., & Campanharo, V. C. (2011). Fuzzy TOPSIS for group decision making: A case study for accidents with oil spill in the sea. Expert Systems with Applications, 38(4), 4190–4197. https://doi.org/10.1016/j.eswa.2010.09.081
57. Saaty, T. L. (2003). Decision-making with the AHP: Why is the principal eigenvector necessary? European Journal of Operational Research, 145(1), 85–91. https://doi.org/10.1016/S0377-2217(02)00227-8
58. Saaty, T. L., & Tran, L. T. (2007). On the invalidity of fuzzifying numerical judgments in the Analytic Hierarchy Process. Mathematical and Computer Modelling, 46(7–8), 962–975. https://doi.org/10.1016/j.mcm.2007.03.022
Preprints (www.preprints.org) | NOT PEER-REVIEWED | Posted: 1 November 2018 doi:10.20944/preprints201810.0773.v1
Related Documents


![An Integrated Fuzzy AHP and Fuzzy TOPSIS Approach for ... · MCDM problems, such as AHP, TOPSIS, ELECTRE, rough sets theory and Multi-objective programming [8]. In comparison with](https://static.cupdf.com/doc/110x72/5cd05a1688c993480d8d8cac/an-integrated-fuzzy-ahp-and-fuzzy-topsis-approach-for-mcdm-problems-such.jpg)