1 Technological inclusiveness: A comparative study of Northern and Chinese induced technologies in the garment industry David Botchie a , David Sarpong b,c , Jianxiang Bi b a Development Policy and Practice, The Open University, Milton Keynes MK7 6AA, United Kingdom b Bristol Business School, University of the West of England, Frenchay Campus, Bristol BS16 1QY, United Kingdom c Research Lab for Science and Technology Studies, Institute for Statistical Studies and Economics of Knowledge, National Research University — Higher School of Economics, Myasnitskaya st., 20 Moscow, Russian Federation Please cite this article as: Botchie, D., et al., Technological inclusiveness: Northern versus Chinese induced technologies in the garment industry, Technol. Forecast. Soc. Change (2016), http://dx.doi.org/10.1016/j.techfore.2016.04.011 The Northern economies have been the main sources of technologies for the global garment manufacturing industry. Over the past decade, China has become an important alternative source of these technologies offering a range of technological choices for small scale and dispersed production of cheap consumer goods, particularly in the developing world. Preceding a national foresight exercise aimed at enhancing the capabilities of small-scale garment producers in Uganda, we examine the potential ‘inclusiveness’ of garment sewing machines imported from the Northern economies and China, and their individual potential to enhance the capabilities of poor garment producers, particularly, women and rural dwellers. Data for our study included a survey and semi-structured interviews with 147 garment firms and other key informants. Compared to the Chinese sewing machines, we found that the Northern machines have high acquisition cost, relies on scale and advanced infrastructure, and tend to exclude poor rural producers (often women). The transfer of Chinese technologies to Uganda, we also found is much easier, have larger spread effects, leading to smaller gaps in technological know-how between China and Uganda because of the context in which Chinese technological innovations are induced. We conclude with some implication of our study to theory and policy. Keywords: Africa, China, garment industry, technology inclusiveness, Uganda Introduction Despite the significant achievement in poverty reduction in Uganda, inequality and unemployment keep rising in this transition country. The garment sector has been identified as one of the key sectors that can help create jobs in transition countries as it has the potential to move labour from the inefficient agricultural sector to the manufacturing sector (Gereffi and Memedovic, 2003; Moghadam, 2015). However, limited investment in garment making technologies and erratic supply of energy are among the major contributors to the sub-sector’s current low capacity in garment production (GoU, 2009). Scholarly and policy makers in this regard have advocated for massive investment in garment

Welcome message from author
This document is posted to help you gain knowledge. Please leave a comment to let me know what you think about it! Share it to your friends and learn new things together.
Transcript
1
Technological inclusiveness: A comparative study of Northern and
Chinese induced technologies in the garment industry
David Botchie a, David Sarpong
b,c, Jianxiang Bi
b
a Development Policy and Practice, The Open University, Milton Keynes MK7 6AA, United
Kingdom
b Bristol Business School, University of the West of England, Frenchay Campus, Bristol BS16 1QY,
United Kingdom
c Research Lab for Science and Technology Studies, Institute for Statistical Studies and Economics of
Knowledge, National Research University — Higher School of Economics, Myasnitskaya st.,
20 Moscow, Russian Federation
Please cite this article as: Botchie, D., et al., Technological inclusiveness: Northern versus Chinese induced technologies in the garment
industry, Technol. Forecast. Soc. Change (2016), http://dx.doi.org/10.1016/j.techfore.2016.04.011
The Northern economies have been the main sources of technologies for the global garment
manufacturing industry. Over the past decade, China has become an important alternative source of
these technologies offering a range of technological choices for small scale and dispersed production of
cheap consumer goods, particularly in the developing world. Preceding a national foresight exercise
aimed at enhancing the capabilities of small-scale garment producers in Uganda, we examine the
potential ‘inclusiveness’ of garment sewing machines imported from the Northern economies and
China, and their individual potential to enhance the capabilities of poor garment producers,
particularly, women and rural dwellers. Data for our study included a survey and semi-structured
interviews with 147 garment firms and other key informants. Compared to the Chinese sewing
machines, we found that the Northern machines have high acquisition cost, relies on scale and
advanced infrastructure, and tend to exclude poor rural producers (often women). The transfer of
Chinese technologies to Uganda, we also found is much easier, have larger spread effects, leading to
smaller gaps in technological know-how between China and Uganda because of the context in which
Chinese technological innovations are induced. We conclude with some implication of our study to
theory and policy.
Keywords: Africa, China, garment industry, technology inclusiveness, Uganda
Introduction
Despite the significant achievement in poverty reduction in Uganda, inequality and unemployment
keep rising in this transition country. The garment sector has been identified as one of the key sectors
that can help create jobs in transition countries as it has the potential to move labour from the
inefficient agricultural sector to the manufacturing sector (Gereffi and Memedovic, 2003; Moghadam,
2015). However, limited investment in garment making technologies and erratic supply of energy are
among the major contributors to the sub-sector’s current low capacity in garment production (GoU,
2009). Scholarly and policy makers in this regard have advocated for massive investment in garment
2
technologies to help improve Uganda’s position in the industry to reduce poverty and inequality
(Akoten and Otsuka, 2007). However, there are two main competing sources of garment making
technologies in Uganda, and it is not too clear as to which of them the country should be investing in to
help improve its position in the global garment making industry. Northern European countries,
particularly Germany, United Kingdom, and Austria, remain the traditional sources of garment making
technologies for the industry (Gereffi and Memedovic, 2003; Mytelka, 1991). Following substantial
investment of Chinese firms in Africa, China in the past decade has become the alternative source of
these technologies for the Ugandan garment industry. In this regard, the existing literature has
identified various factors that shape and give form to the transfer, adopting and diffusion of these
competing garment technologies in transition countries (Huang, 2003; James and Bhalla, 1993). The
emerging consensus is that the Northern technologies compared to Chinese ones are much more
durable, efficient, but expensive. The Chinese induced technologies on the other hand, are
technological inferior, and cheap (Yamagata, 2007; Schrank, 2004).
Preceding a national foresight exercise aimed at enhancing the capabilities of small scale
garment producers and reducing poverty, examine the potential appropriateness and ‘inclusiveness’
of these competing technologies, focussing on sewing machines in the Ugandan garment industry. By
inclusiveness, we refer to the potential and appropriateness of these sewing machines’ to enhancing
the capabilities of poor producers, particularly women and rural dwellers, in ways that reduces
inequalities which are known to offset the poverty reducing effect on economic growth (Hazarika,
2015; Ravalion, 2007). Inclusiveness in this context is also about improving the welfare of low income
groups through the use of low cost technologies in a developing country (Paunov, 2013; Feder and
Umali, 1993). We aim to provide empirical evidence to support policy makers in deciding which of
the two technologies they could potentially put their bet on to help improve the competitive position
of Uganda’s garment industry while reducing poverty among women and rural dwellers.
Drawing on firm level secondary data, survey, and semi-structured interviews with 147
garment firms, and statistical data from organizations such as the International Cotton Advisory
3
Committee, World bank and Cotton Development Organisation, we compare the production
characteristics of the two sewing machines, their repair and maintenance costs to assess their relative
impact on poor producers in general, and women and rural producers in particular. We found that
the Chinese induced sewing machines compared to their Northern counterparts have a discernible
pro-poor, pro-women, and pro-rural impact on Uganda’s garment industry. Contributing to the
existing literature on technology inclusiveness, our study sheds light on the significant role of
technology in poverty alleviation efforts in the third world.
The paper is structured as follows. First, with particular emphasis on the global garment
industry, we provide a brief overview of the sources of inducement to the development of inclusive
technologies and innovations. Second, we delineate the state of the Ugandan garment sector with
emphasis on the sources of imports into the sector. Third, we present our sampling strategy, data
sources and the operational framework guiding our inquiry. Fourth is our results and discussion. We
then conclude with some implications of our findings for theory and policy.
Sources of inducement to the development of inclusive technologies and innovations
The appropriate technologies movement as espoused by the international organisations in the 1970s
and 1980s were overwhelmingly driven by not-for-profit organisations (Schumacher, 1973). More
recently, the rise of emerging economies such as China and India suggests that this dominant
trajectory may be subject to change. The growth in capabilities in China, in particular, has coincided
with a rapid growth in demand by poor consumers. These poor consumers may aspire to branded
positional goods, but because of their low incomes will settle for simpler and lower quality products
(Kaplinsky, 2010). This form of demand from poor consumers has reignited the appropriate
technology concept with countries like China serving as the likely source. The re-emergence of the
appropriate technology concept has led to the call for direct inclusive innovations for the poor and a
better understanding of the Sources of inducement to the development of Inclusive technologies and
innovations.
4
There are three broad sources of inducement for the development of technologies in China.
The first is the increase in demand of low-cost technologies; due to rapid growth in markets in low
income economies (Ruttan, 2001; Kaplinsky, 2010). This demand is driven mainly by low income
earners’ preference for function rather than position. As a result, consumers in developing countries
are accepting China’s strategy of producing low cost and inferior technologies into developing
countries (Kaplinsky and Prahalad, 2005). Note that the low income level of consumers in most
developing countries like Uganda is the main driving force for such low cost technologies. This may
also serve as a conduit for poor consumers to be included in technology access and utilization. As
observed by Chataway et al. (2013), the more inclusive a given innovation, the more likely
consumption decisions will be made at the individual or household level.
Relative factor prices are the second inducing source of technical change; this is driven by
process technologies. Wages in the AD economies are a fraction of those in the northern economies.
Therefore, new technologies produced in these economies are likely to be highly labour intensive
(Kaplinsky, 2010). In addition, because these technological innovations occur in the context of weak
infrastructure, innovation in the developing economies such as China may be more robust and do not
require high quality infrastructure (Hazarika, 2015; Kaplinsky, 2010). Moreover, because there is
weak standardization in these developing economies, technological innovations in these economies
may not take cognizance of international certification requirements. Furthermore, these technical
changes arise from small-scale indigenous firms and focus on lower acquisition cost. The lowering of
standard, coupled with their labour intensive nature and less reliance on infrastructure may point to
the fact that unskilled labour and low income consumers may be included in the utilization of such
technologies.
Trajectories of innovating firms are the third factor that induces the production of
technologies that are appropriate for developing countries. In their efforts to improve upon their
products and processes, firms are frequently confronted with the challenge of scanning through their
known contacts and data-sources mainly due to the availability of imperfect information. In the
5
context of routines, they draw on their experiences past knowledge and networks to keep track of the
changing environment and customer preferences (Kaplinsky, 2011). As such, these firms have their
own path-dependencies and trajectories (Dosi, 1984). These large multinational firms in the northern
economies mostly tend to focus on demands from their existing customers and disregard new
technologies that will not satisfy the needs of their existing customers (Christenson, 1997). This is
inconsistent with the growing belief that there is a huge market opportunity for transnational
corporations (TNCs) in developing economies (Prahalad, 2006). On the other hand, southern-based
trans-national corporations are in better position to develop technologies that are appropriate for low-
income economies (Kaplinsky, 2011). Nevertheless, available studies have not sufficiently captured
the inclusiveness of technologies from other emerging economies such as China relative those from
the northern economies.
However, these technologies have been perceived not to have inclusive attributes for the less
privilege in society, particularly women and rural dwellers. The Northern technologies were
produced to suit labour saving technological progress, assumes high-quality infrastructure and
produces products for high-income consumers, and therefore, difficult for the poor to acquire
(Stewart 1982, and Kaplinsky 2011). In addition, access to spare parts as well as the requisite
information required for maintaining and repairing some of the northern technologies in the garment
sector are limited (Bhalla, 1985). Some of the Northern made technologies produce on large scale and
are skills intensive; therefore require skilled labour to operate them efficiently (Kaplinsky, 1990). In
this regard, women are likely to be the worst affected. As indicated by Pearson (2000), women are
relatively less skilled with higher levels of illiteracy compared to men. This creates more barriers for
women when it comes to access and use of Northern technologies. Furthermore, women in
developing countries bear a disproportionate burden undertaking time and labour intensive unpaid
activities in their household. These include cooking, cleaning, fetching fuel or water, as well as child
and elder care (Gill et al. 2010). For instance, women in rural areas spend from 1 to 5 hours a day
gathering biomass for fuel and 1.6 hours a day collecting water in the dry season (Gill et al. 2010). This
6
makes it difficult for women to venture into skills and wealth creating activities that will enable them
adopt skills intensive technologies (Gill et al. 2010). Men on the other hand have full control over
technologies in the households and work places. Husbands at home are mostly responsible for
regulating the family radio, television, and even controlling when and how other family members use
them (Gill et al. 2010). At work, technologies meant for women are often co-opted by men once their
utility and profitability are established (Gill et al. 2010). This means that women who do gain access to
technologies do not see the economic benefits associated with it (Gill et al. 2010).
Technologies from the Northern economies are the most efficient. For example, Eckaus (1955)
argued that there was a limited range of efficient technologies available in a given period of time; and
these technologies are concentrated in Northern economies—Europe and North America. Building on
this assumption, Emmanuel (1982) posit that research and development are mainly concentrated in
developed economies where income levels are high; as such technological progress can only originate
from these economies. He goes further to explain that the economically efficient techniques are
always owned by transnational corporations in the Northern economies. He adds that all efficient
technologies are capital intensive and that labour intensive techniques tend to use more of both
capital and labour per unit of output and so they are economically inefficient. Thus, developing
countries will incur economic costs (i.e. reduction in output and growth) if they use labour intensive
technologies. Furthermore, there has been an intensive body of research in favour of the availability
of alternative technologies. Studies such as Sen (1968); Jenkins (1975); Stewart (1982); and Kaplinsky
(1990) have all laid credence with empirical evidence to the fact that there are efficient alternative
technologies, although they do not make up the full spectrum assumed in the neo-classical
framework. Over the past three decades, the global division of technological capabilities has been
shifting from the Northern economies towards emerging economies particularly China (Kaplinsky
2009). The very large size of China, coupled with its middle income status (only until recently they
were low income economies) and, its growing technological capabilities is making it the dominant
source of technological innovation for poor consumers in developing countries like Uganda
7
(Kaplinsky 2009). Again, the structure of the Chinese economy is different from those of the West,
hence by hypothesis, their technologies may be distinctive (Kaplinsky 2009). This is because the
Chinese technologies are also assumed to be labour intensive, easier to access, less capital intensive,
require minimum skills and are tolerant to poor infrastructure (Kaplinsky, 2009). Wade (1990)
indicates that the Asians (led by China) rely heavily on small scale relatively un-mechanised
technologies innovations and therefore are more inclusive compared those from Latin American
economies. These attributes of the Chinese innovations mimics Ghandi’s idea of the use of small
labour intensive technologies. Ghandi argued that the reproduction of the Soviet growth path would
reinforce massive processes of exclusion. This would seek to promote the choice and development
which are more labour intensive and small scale (Chataway et al. 2013). Thus, these assumed
characteristics of technological change from China are likely to be inclusive of the less privileged—
women and rural dwellers in Uganda. However, these assumptions are yet to be validated, and the
level of returns for Chinese technologies has not been explored enough in available studies.
The garment sector in Uganda
The sector’s average contribution to employment in the manufacturing sector was 4.1 % in 2008. This
increased to 4.9 % in 2009 and remained the same in 2010 but declined to 4.6 % in 2012. Over 56 % of
the total labour forces across the value chain in the garment sector are women who are mostly
employees rather than employers. (GoU, 2009). This makes it relatively difficult for women to become
entrepreneurs in the garment sector. Among others, this is attributed to women’s inability to access
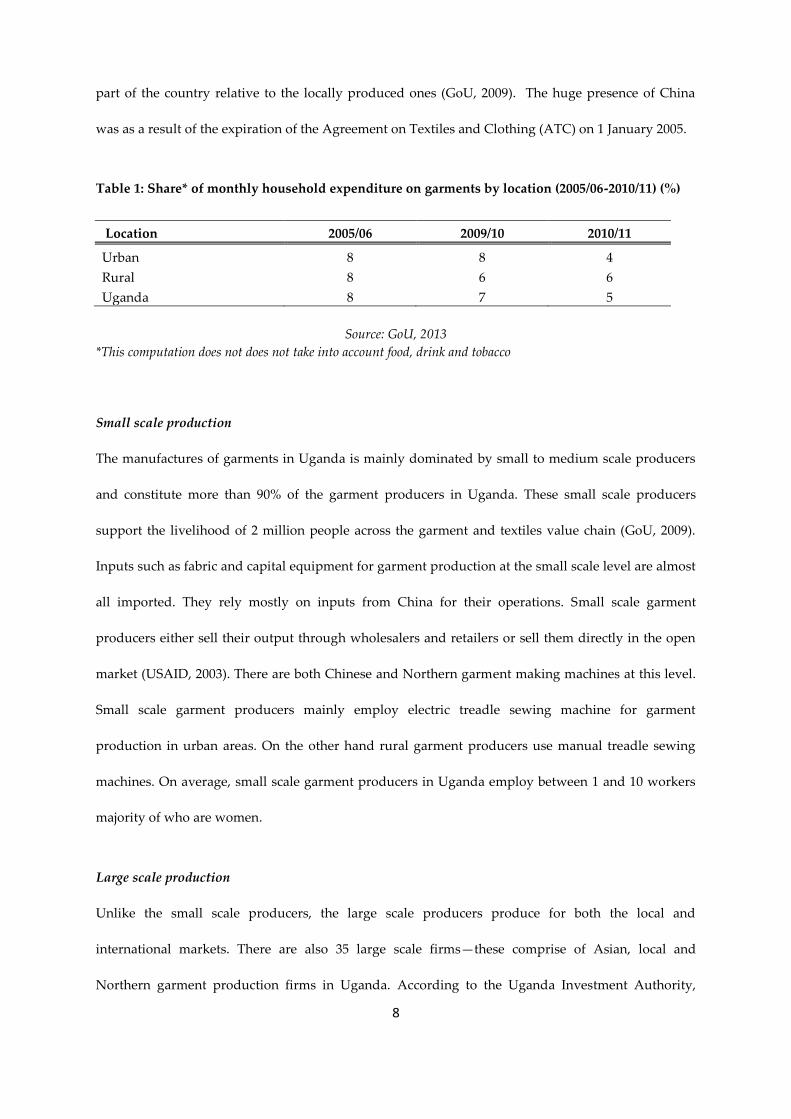
the requisite capital equipment for the production of garment. As shown in table 1, consumers on
average spent 7 % of their income in 2009/10 on garments. This declined to 5 % in 2010/11. Rural
households spent an average of 6 % of their income on garment in both 2009/10 and 2010/11. This was
lower than the urban household expenditure in 2009/10 but higher in 2010/11. Households mostly
spend on cheap garments from China or imported second hand clothes from the United Kingdom.
The National Textile Policy of Uganda observes that Chinese made garment are available in every
8
part of the country relative to the locally produced ones (GoU, 2009). The huge presence of China
was as a result of the expiration of the Agreement on Textiles and Clothing (ATC) on 1 January 2005.
Table 1: Share* of monthly household expenditure on garments by location (2005/06-2010/11) (%)
Location 2005/06 2009/10 2010/11
Urban 8 8 4
Rural 8 6 6
Uganda 8 7 5
Source: GoU, 2013
*This computation does not does not take into account food, drink and tobacco
Small scale production
The manufactures of garments in Uganda is mainly dominated by small to medium scale producers
and constitute more than 90% of the garment producers in Uganda. These small scale producers
support the livelihood of 2 million people across the garment and textiles value chain (GoU, 2009).
Inputs such as fabric and capital equipment for garment production at the small scale level are almost
all imported. They rely mostly on inputs from China for their operations. Small scale garment
producers either sell their output through wholesalers and retailers or sell them directly in the open
market (USAID, 2003). There are both Chinese and Northern garment making machines at this level.
Small scale garment producers mainly employ electric treadle sewing machine for garment
production in urban areas. On the other hand rural garment producers use manual treadle sewing
machines. On average, small scale garment producers in Uganda employ between 1 and 10 workers
majority of who are women.
Large scale production
Unlike the small scale producers, the large scale producers produce for both the local and
international markets. There are also 35 large scale firms—these comprise of Asian, local and
Northern garment production firms in Uganda. According to the Uganda Investment Authority,
9
China (and India) own more than 50% of the firms at this level of the value chain (UIA, 2013). These
firms have some sense of how international markets are organized and how to go about finding
contract opportunities. They mainly export garment to countries like Rwanda, Democratic Republic
of Congo, and other countries in the Great Lake regions (UIA, 2013). However, garment and textiles
exports into the international market have continuously been impeded by high cost of doing business
in terms of high transportation, energy and finance which leads to low competitiveness of garment
exports from Uganda. Similar to the small scale producers, 90% of the fabrics used for garment
production are imported (UIA, 2013). The large scale firms import them on their own instead of
procuring them from the local wholesalers or retailers. Furthermore, there are both Chinese and
Northern sewing machines at this level of the value chain.
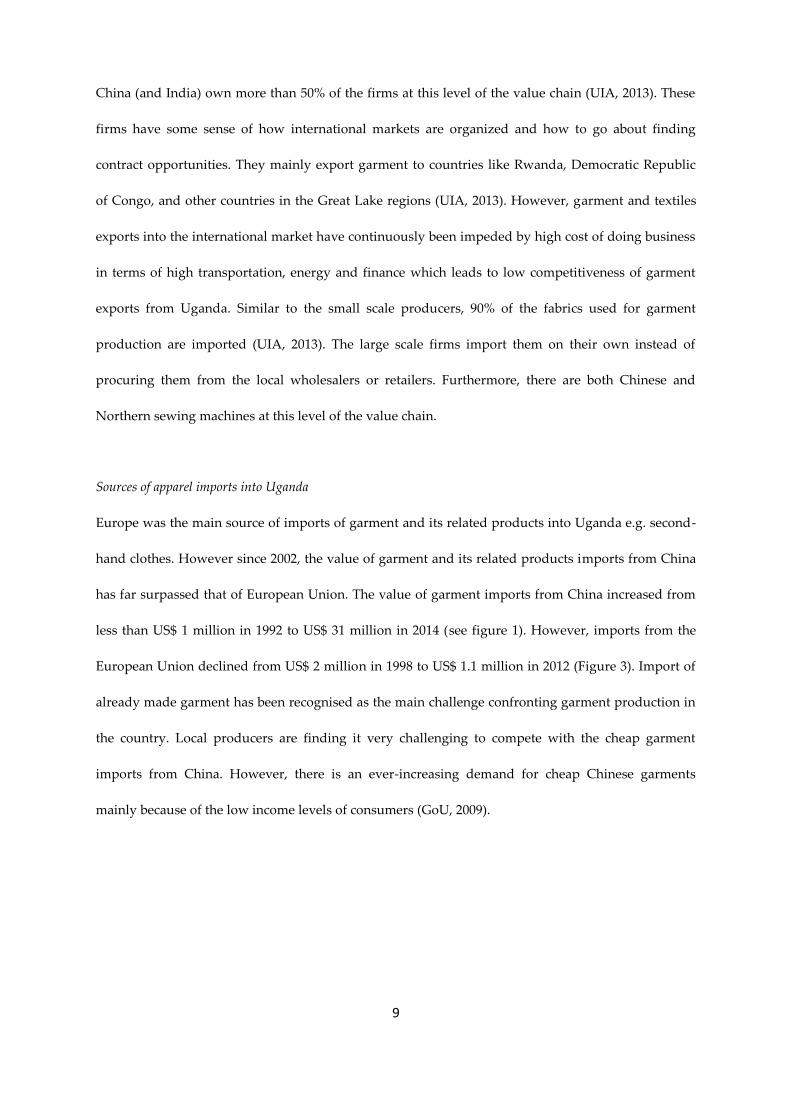
Sources of apparel imports into Uganda
Europe was the main source of imports of garment and its related products into Uganda e.g. second-
hand clothes. However since 2002, the value of garment and its related products imports from China
has far surpassed that of European Union. The value of garment imports from China increased from
less than US$ 1 million in 1992 to US$ 31 million in 2014 (see figure 1). However, imports from the
European Union declined from US$ 2 million in 1998 to US$ 1.1 million in 2012 (Figure 3). Import of
already made garment has been recognised as the main challenge confronting garment production in
the country. Local producers are finding it very challenging to compete with the cheap garment
imports from China. However, there is an ever-increasing demand for cheap Chinese garments
mainly because of the low income levels of consumers (GoU, 2009).
10
Figure 1: Imports of apparel/clothing/accessories into Uganda (000 US$)
Source: WITS-COMTRADE database, Product Code 84, Accessed 15/03/2014
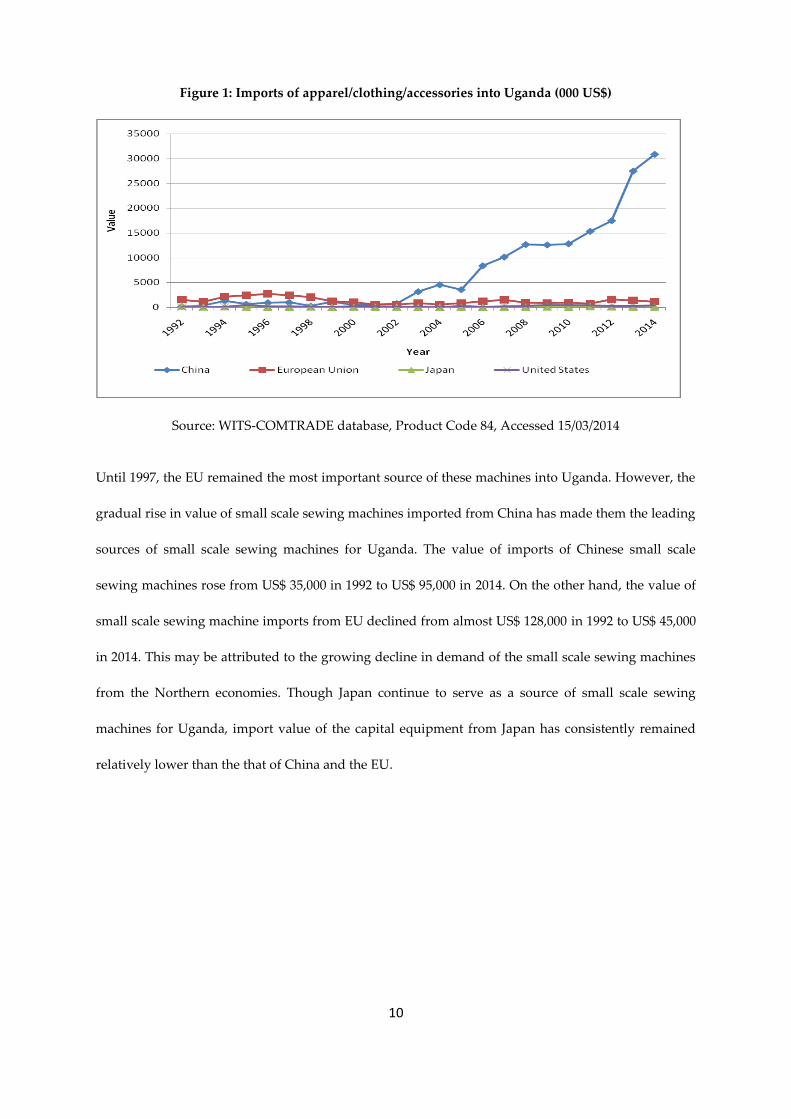
Until 1997, the EU remained the most important source of these machines into Uganda. However, the
gradual rise in value of small scale sewing machines imported from China has made them the leading
sources of small scale sewing machines for Uganda. The value of imports of Chinese small scale
sewing machines rose from US$ 35,000 in 1992 to US$ 95,000 in 2014. On the other hand, the value of
small scale sewing machine imports from EU declined from almost US$ 128,000 in 1992 to US$ 45,000
in 2014. This may be attributed to the growing decline in demand of the small scale sewing machines
from the Northern economies. Though Japan continue to serve as a source of small scale sewing
machines for Uganda, import value of the capital equipment from Japan has consistently remained
relatively lower than the that of China and the EU.
11
Figure 2: Trends in the import of small scale garment making machines into Uganda (‘000 US$)
Source: WITS-COMTRADE, SITC 3, Product Code 72433, Accessed 17/03/2014
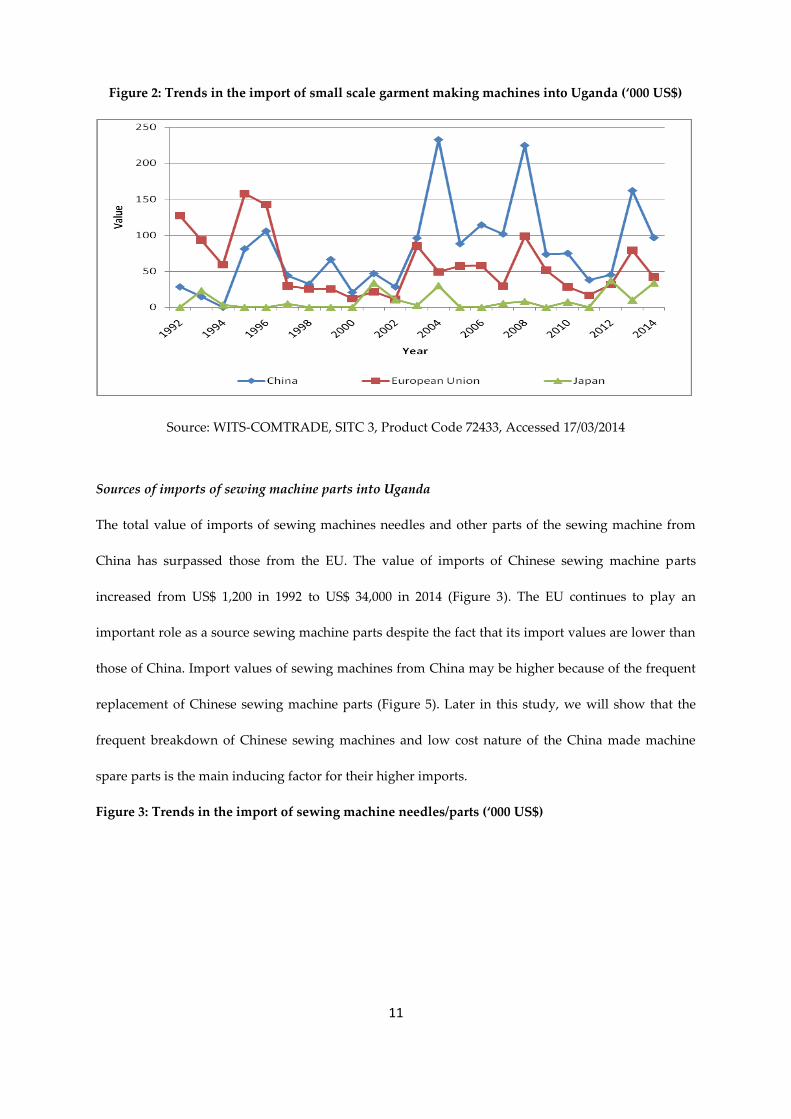
Sources of imports of sewing machine parts into Uganda
The total value of imports of sewing machines needles and other parts of the sewing machine from
China has surpassed those from the EU. The value of imports of Chinese sewing machine parts
increased from US$ 1,200 in 1992 to US$ 34,000 in 2014 (Figure 3). The EU continues to play an
important role as a source sewing machine parts despite the fact that its import values are lower than
those of China. Import values of sewing machines from China may be higher because of the frequent
replacement of Chinese sewing machine parts (Figure 5). Later in this study, we will show that the
frequent breakdown of Chinese sewing machines and low cost nature of the China made machine
spare parts is the main inducing factor for their higher imports.
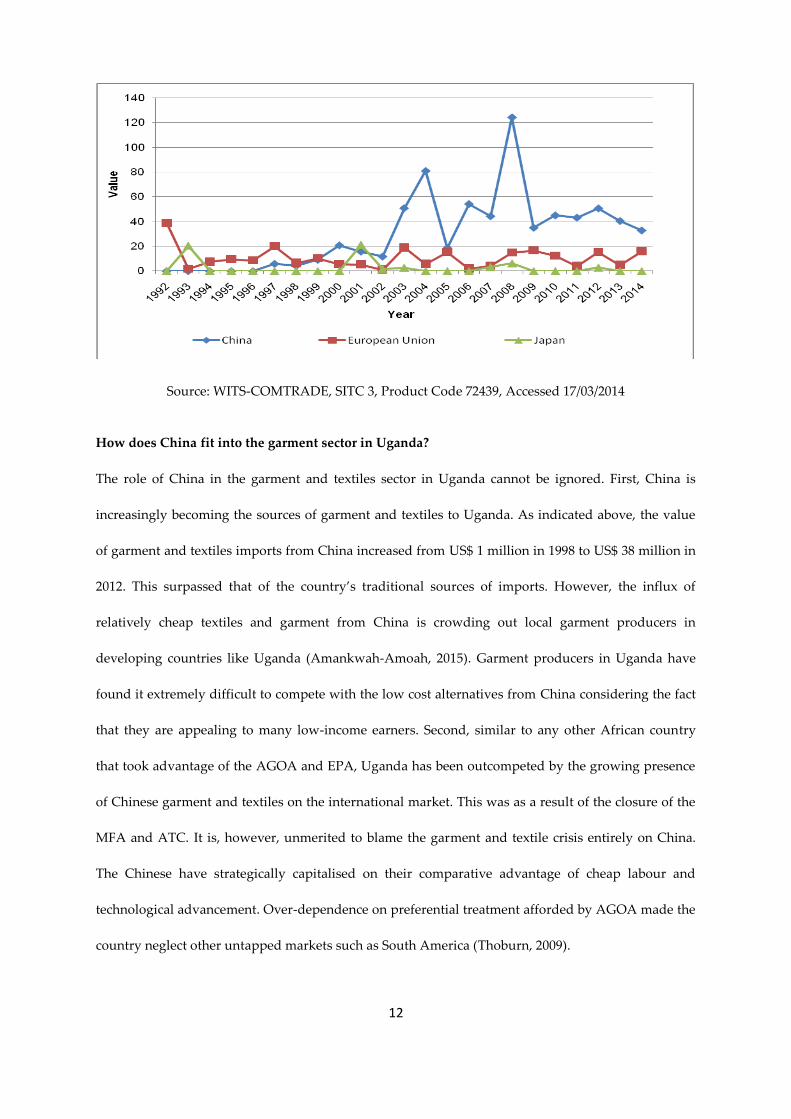
Figure 3: Trends in the import of sewing machine needles/parts (‘000 US$)
12
Source: WITS-COMTRADE, SITC 3, Product Code 72439, Accessed 17/03/2014
How does China fit into the garment sector in Uganda?
The role of China in the garment and textiles sector in Uganda cannot be ignored. First, China is
increasingly becoming the sources of garment and textiles to Uganda. As indicated above, the value
of garment and textiles imports from China increased from US$ 1 million in 1998 to US$ 38 million in
2012. This surpassed that of the country’s traditional sources of imports. However, the influx of
relatively cheap textiles and garment from China is crowding out local garment producers in
developing countries like Uganda (Amankwah-Amoah, 2015). Garment producers in Uganda have
found it extremely difficult to compete with the low cost alternatives from China considering the fact
that they are appealing to many low-income earners. Second, similar to any other African country
that took advantage of the AGOA and EPA, Uganda has been outcompeted by the growing presence
of Chinese garment and textiles on the international market. This was as a result of the closure of the
MFA and ATC. It is, however, unmerited to blame the garment and textile crisis entirely on China.
The Chinese have strategically capitalised on their comparative advantage of cheap labour and
technological advancement. Over-dependence on preferential treatment afforded by AGOA made the
country neglect other untapped markets such as South America (Thoburn, 2009).
13
Thirdly, prices of garments and textiles produced in Uganda are uncompetitive. This is
mainly because of the high cost of production in the country (GoU, 2008). Chinese traders in the
garment and textile sector in Uganda have only exacerbated the situation by providing fierce
competition to local retailers. As a result, the demand for Chinese products has soared at the expense
of locally produced goods. Even Africa’s traditional export markets have now also succumbed to
China’s domination in the garment and textile industry. While the economic activities of Chinese
companies may stimulate local development to an extent, their dominant presence has stirred up
some resentment amongst the locals. For example, Chinese clothing manufacturers in Kampala have
been under fire for failing to meet legal minimum wage and working conditions (The Ugandan
Monitor, 2012). There also exists a strong presence and influence of labour unions in Uganda, which
often exacerbate existing tensions in their bid to protect the workers’ welfare. The recent emergence
and escalation of Chinese produced Ugandan prints has also contributed to the strained relations
between the two parties. This was a profitable niche market segment that Ugandan producers
enjoyed and dominated as Ugandan prints were in demand not only in East African region but also in
Northern countries. Now China has also entered the market and is actively competing in the same
market. The manufacturing of Ugandan prints in China is seen as an insult to the Ugandan people
and manufacturers who feel rights to commercial enterprise based on Ugandan cultural heritage
should remain in the country. Finally, lack of capital and technological investment and creation of a
domestic value chain have also contributed to the current predicament. However relative to their
Northern counterparts, China is increasingly becoming the dominant source of sewing machines in
the country. As indicated above, the assumed nature of the Chinese technology is likely to make it
inclusive but we lack empirical evidence to support this assertion. In this regard, our study compares
Chinese and Northern garment machines in Uganda; with emphasis on women and rural dwellers to
ascertain the inclusiveness of these technologies and potential for poverty alleviation.
Operational framework
14
Conceptual framework
Women and rural dwellers as the less privilege group in society in Uganda. Poverty is largely as a
result of consumption power (Chataway et al. 2013). The power of the poor to consume products is
loosely linked to the participation of the poor in processes of production (Chataway et al. 2013). In this
regard, we expected inclusive innovations to create jobs, increase productivity and profitability for
women and rural dwellers. We therefore followed Chataway et al. (2013) in assessing the inclusive
nature of Northern and Chinese sewing machines in the garment sector in Uganda. This enabled us to
consider the following indicators:
(a) Whether women and rural dwellers are involved in the ownership of the Chinese innovations
compared to the Northern ones.
(b) How the Chinese sewing machines, relative to the Northern ones are affecting the capacity of rural
dwellers and women to be owners. For instance, capital and skills intensive equipment may preclude
the poor from ownership.
(c) How the character of the Chinese sewing machine enable rural dwellers and women go into
production; and whether it requires large or small scale production units.
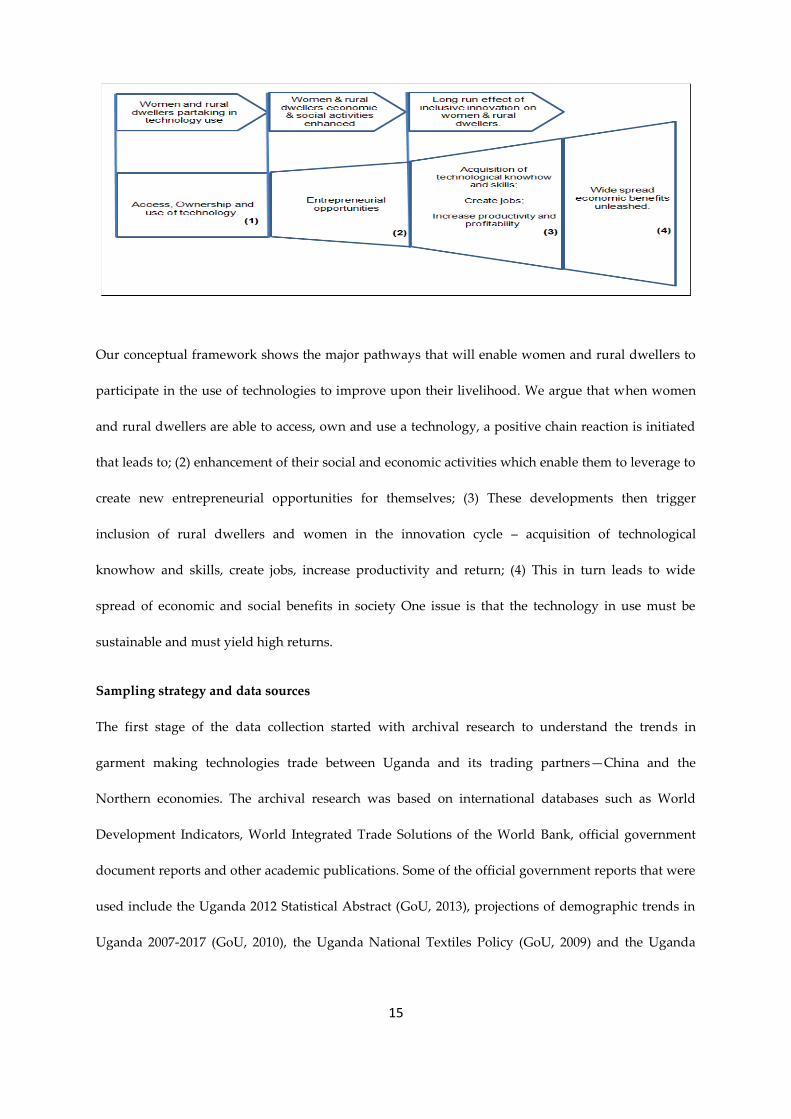
Figure 4: Inclusiveness of Northern and Chinese technological innovations in Uganda
15
Our conceptual framework shows the major pathways that will enable women and rural dwellers to
participate in the use of technologies to improve upon their livelihood. We argue that when women
and rural dwellers are able to access, own and use a technology, a positive chain reaction is initiated
that leads to; (2) enhancement of their social and economic activities which enable them to leverage to
create new entrepreneurial opportunities for themselves; (3) These developments then trigger
inclusion of rural dwellers and women in the innovation cycle – acquisition of technological
knowhow and skills, create jobs, increase productivity and return; (4) This in turn leads to wide
spread of economic and social benefits in society One issue is that the technology in use must be
sustainable and must yield high returns.
Sampling strategy and data sources
The first stage of the data collection started with archival research to understand the trends in
garment making technologies trade between Uganda and its trading partners—China and the
Northern economies. The archival research was based on international databases such as World
Development Indicators, World Integrated Trade Solutions of the World Bank, official government
document reports and other academic publications. Some of the official government reports that were
used include the Uganda 2012 Statistical Abstract (GoU, 2013), projections of demographic trends in
Uganda 2007-2017 (GoU, 2010), the Uganda National Textiles Policy (GoU, 2009) and the Uganda
16
Industrial Policy (GoU, 2008). These archival documents provided detailed time series data on trends
in the import of garment making machines in Uganda.
For primary data collection purposes, we obtained the list of registered garment producers
from the Ugandan Ministry of Trade, Industry and Cooperatives (MTIC). The list contained 594
registered small scale garment producers across the four regions or provinces of the country. All the
firms on the list were also part of the MITC‘s cooperative union and met the ILO’s (2002) definition
small scale firms which are normally non-agricultural firm with an average of 1 to 10 employees. We
had no specific sampling procedure to follow so we started by selecting the 4th registered member
whose enterprise was some few metres away from our research base in Kampala. We then selected
every fourth person on the list until we moved through the list. A total of 147 garment producers
were finally sampled. These garment producers made up of 43% males and 57% females were single
entrepreneurs—sole proprietors and/or owners of the garment making machine they use for their
work.
The main data for our empirical inquiry was collected using semi-structured interviews. Interviews
took place at the work shed of respondents and covered their perspectives on the garment
technologies they employ in their everyday work. Each interview lasted for an hour and was
transcribed within 24 hours of collection. In addition, the survey was conducted in Entebbe, Jinja and
Kampala (52 respondents). I also conducted the survey in the Eastern (36 respondents), Northern (33
respondents) and Northern (26 respondents) regions of Uganda.
The full data analysis followed four stages. First the short survey data was analysed using
excel spreadsheet to develop demographic profiles of our respondents and the relative technology
ownership patterns. Next, we meticulously sifted through the interview data collated and cross-
checked what we thought were salient narratives with other vital objective information we gleaned
from the databases, official government documents, and archival information to overcome possible
biases in what we heard in the field (Ritchie and Spencer, 1994). Following this, the disparate data
were triangulated (Jick, 1979) into a whole, and analysed drawing on theoretical insight from the
17
technology inclusiveness literature. Identified segments and categories were then analysed and
interpreted iteratively until common themes emerged and became saturated (Strauss, 1978; Suddaby,
2006). We present the fine details of our findings in the next section.
COMPARING THE INCLUSIVENESS OF THE ALTERNATIVE SEWING MACHINES
Access to garment making technologies by location
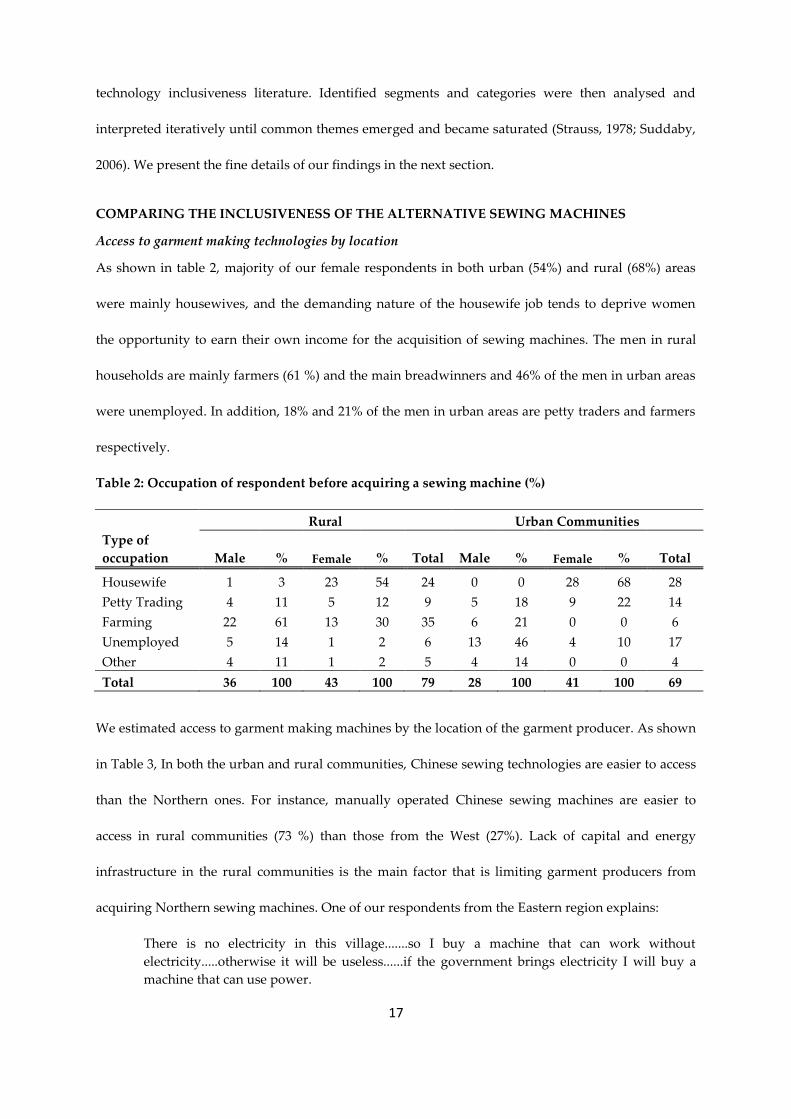
As shown in table 2, majority of our female respondents in both urban (54%) and rural (68%) areas
were mainly housewives, and the demanding nature of the housewife job tends to deprive women
the opportunity to earn their own income for the acquisition of sewing machines. The men in rural
households are mainly farmers (61 %) and the main breadwinners and 46% of the men in urban areas
were unemployed. In addition, 18% and 21% of the men in urban areas are petty traders and farmers
respectively.
Table 2: Occupation of respondent before acquiring a sewing machine (%)
Rural Urban Communities
Type of
occupation Male % Female % Total Male % Female % Total
Housewife 1 3 23 54 24 0 0 28 68 28
Petty Trading 4 11 5 12 9 5 18 9 22 14
Farming 22 61 13 30 35 6 21 0 0 6
Unemployed 5 14 1 2 6 13 46 4 10 17
Other 4 11 1 2 5 4 14 0 0 4
Total 36 100 43 100 79 28 100 41 100 69
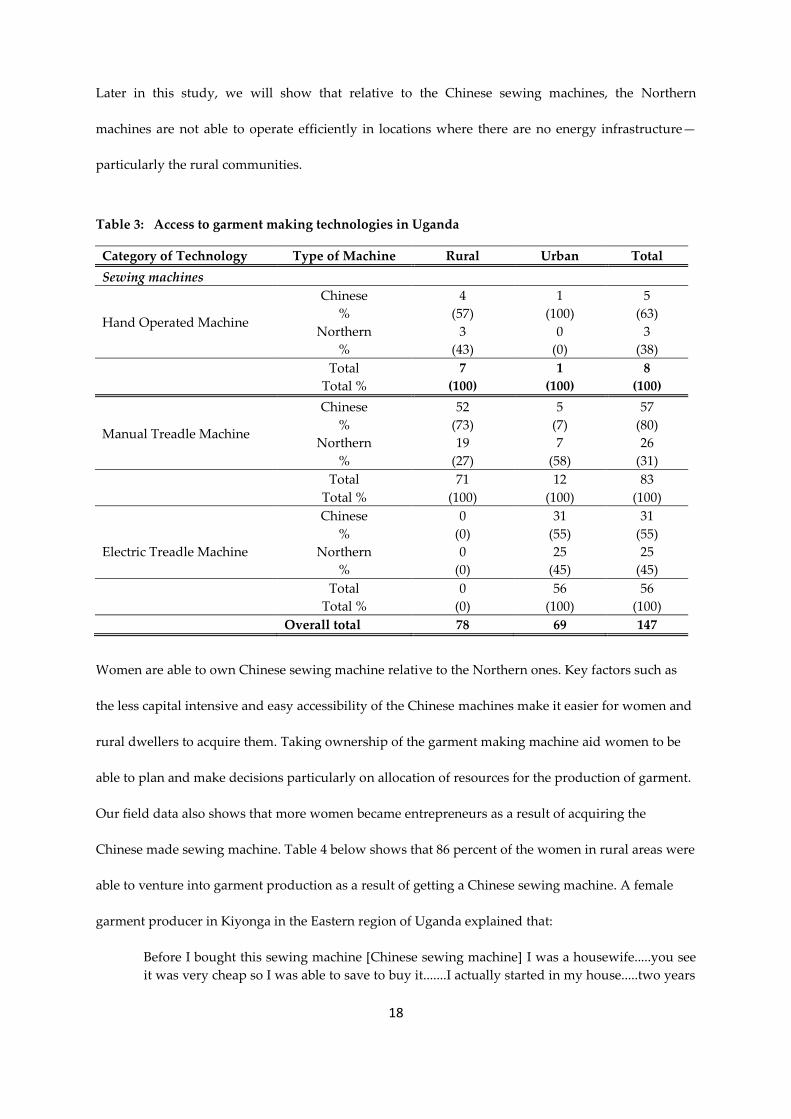
We estimated access to garment making machines by the location of the garment producer. As shown
in Table 3, In both the urban and rural communities, Chinese sewing technologies are easier to access
than the Northern ones. For instance, manually operated Chinese sewing machines are easier to
access in rural communities (73 %) than those from the West (27%). Lack of capital and energy
infrastructure in the rural communities is the main factor that is limiting garment producers from
acquiring Northern sewing machines. One of our respondents from the Eastern region explains:
There is no electricity in this village.......so I buy a machine that can work without
electricity.....otherwise it will be useless......if the government brings electricity I will buy a
machine that can use power.
18
Later in this study, we will show that relative to the Chinese sewing machines, the Northern
machines are not able to operate efficiently in locations where there are no energy infrastructure—
particularly the rural communities.
Table 3: Access to garment making technologies in Uganda
Category of Technology Type of Machine Rural Urban Total
Sewing machines
Hand Operated Machine
Chinese 4 1 5
% (57) (100) (63)
Northern 3 0 3
% (43) (0) (38)
Total 7 1 8
Total % (100) (100) (100)
Manual Treadle Machine
Chinese 52 5 57
% (73) (7) (80)
Northern 19 7 26
% (27) (58) (31)
Total 71 12 83
Total % (100) (100) (100)
Electric Treadle Machine
Chinese 0 31 31
% (0) (55) (55)
Northern 0 25 25
% (0) (45) (45)
Total 0 56 56
Total % (0) (100) (100)
Overall total 78 69 147
Women are able to own Chinese sewing machine relative to the Northern ones. Key factors such as
the less capital intensive and easy accessibility of the Chinese machines make it easier for women and
rural dwellers to acquire them. Taking ownership of the garment making machine aid women to be
able to plan and make decisions particularly on allocation of resources for the production of garment.
Our field data also shows that more women became entrepreneurs as a result of acquiring the
Chinese made sewing machine. Table 4 below shows that 86 percent of the women in rural areas were
able to venture into garment production as a result of getting a Chinese sewing machine. A female
garment producer in Kiyonga in the Eastern region of Uganda explained that:
Before I bought this sewing machine [Chinese sewing machine] I was a housewife.....you see
it was very cheap so I was able to save to buy it.......I actually started in my house.....two years
19
later I was able to buy two and so I decided to open [establish] my own shop [garment
making firm]....it is better than housewife job.
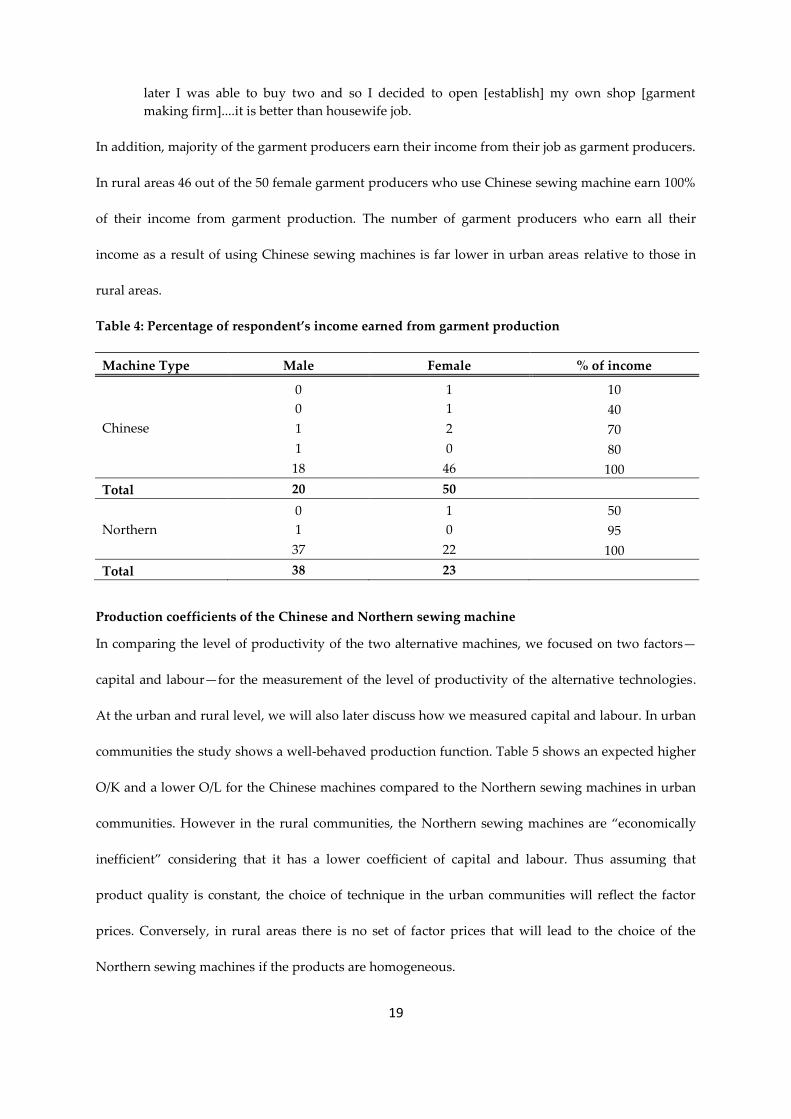
In addition, majority of the garment producers earn their income from their job as garment producers.
In rural areas 46 out of the 50 female garment producers who use Chinese sewing machine earn 100%
of their income from garment production. The number of garment producers who earn all their
income as a result of using Chinese sewing machines is far lower in urban areas relative to those in
rural areas.
Table 4: Percentage of respondent’s income earned from garment production
Machine Type Male Female % of income
Chinese
0 1 10
0 1 40
1 2 70
1 0 80
18 46 100
Total 20 50
Northern
0 1 50
1 0 95
37 22 100
Total 38 23
Production coefficients of the Chinese and Northern sewing machine
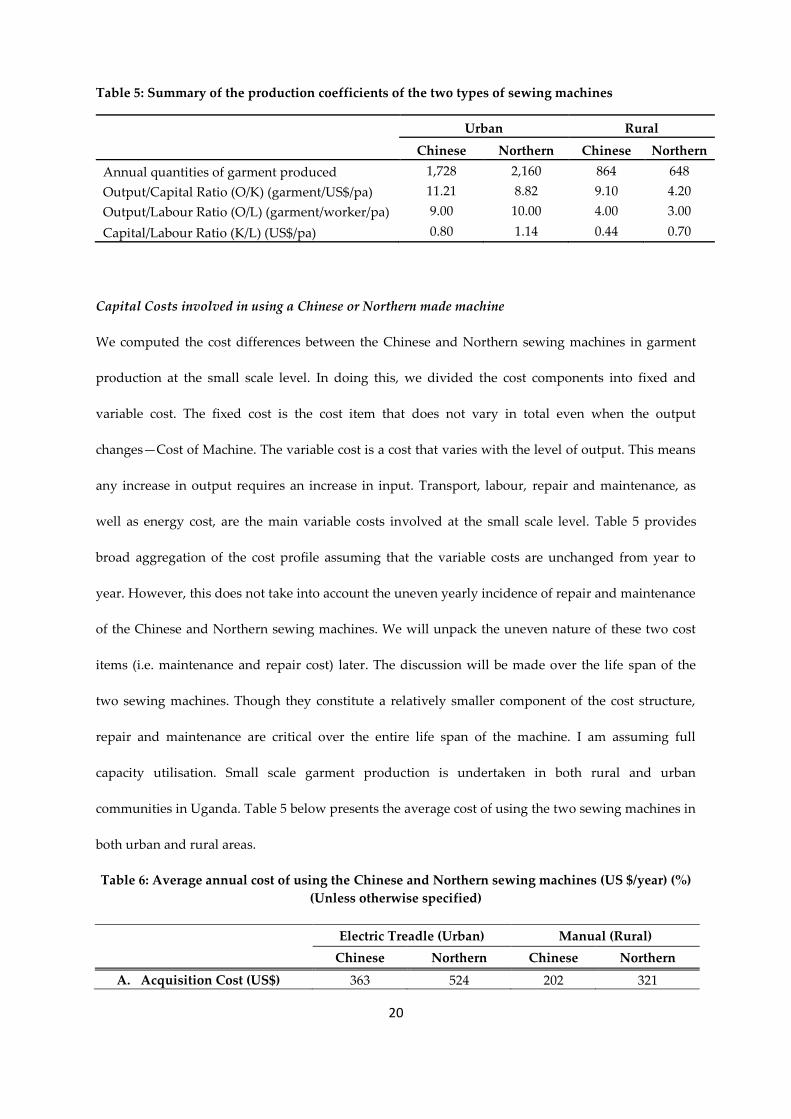
In comparing the level of productivity of the two alternative machines, we focused on two factors—
capital and labour—for the measurement of the level of productivity of the alternative technologies.
At the urban and rural level, we will also later discuss how we measured capital and labour. In urban
communities the study shows a well-behaved production function. Table 5 shows an expected higher
O/K and a lower O/L for the Chinese machines compared to the Northern sewing machines in urban
communities. However in the rural communities, the Northern sewing machines are “economically
inefficient” considering that it has a lower coefficient of capital and labour. Thus assuming that
product quality is constant, the choice of technique in the urban communities will reflect the factor
prices. Conversely, in rural areas there is no set of factor prices that will lead to the choice of the
Northern sewing machines if the products are homogeneous.
20
Table 5: Summary of the production coefficients of the two types of sewing machines
Urban Rural
Chinese Northern Chinese Northern
Annual quantities of garment produced 1,728 2,160 864 648
Output/Capital Ratio (O/K) (garment/US$/pa) 11.21 8.82 9.10 4.20
Output/Labour Ratio (O/L) (garment/worker/pa) 9.00 10.00 4.00 3.00
Capital/Labour Ratio (K/L) (US$/pa) 0.80 1.14 0.44 0.70
Capital Costs involved in using a Chinese or Northern made machine
We computed the cost differences between the Chinese and Northern sewing machines in garment
production at the small scale level. In doing this, we divided the cost components into fixed and
variable cost. The fixed cost is the cost item that does not vary in total even when the output
changes—Cost of Machine. The variable cost is a cost that varies with the level of output. This means
any increase in output requires an increase in input. Transport, labour, repair and maintenance, as
well as energy cost, are the main variable costs involved at the small scale level. Table 5 provides
broad aggregation of the cost profile assuming that the variable costs are unchanged from year to
year. However, this does not take into account the uneven yearly incidence of repair and maintenance
of the Chinese and Northern sewing machines. We will unpack the uneven nature of these two cost
items (i.e. maintenance and repair cost) later. The discussion will be made over the life span of the
two sewing machines. Though they constitute a relatively smaller component of the cost structure,
repair and maintenance are critical over the entire life span of the machine. I am assuming full
capacity utilisation. Small scale garment production is undertaken in both rural and urban
communities in Uganda. Table 5 below presents the average cost of using the two sewing machines in
both urban and rural areas.
Table 6: Average annual cost of using the Chinese and Northern sewing machines (US $/year) (%)
(Unless otherwise specified)
Electric Treadle (Urban) Manual (Rural)
Chinese Northern Chinese Northern
A. Acquisition Cost (US$) 363 524 202 321
21
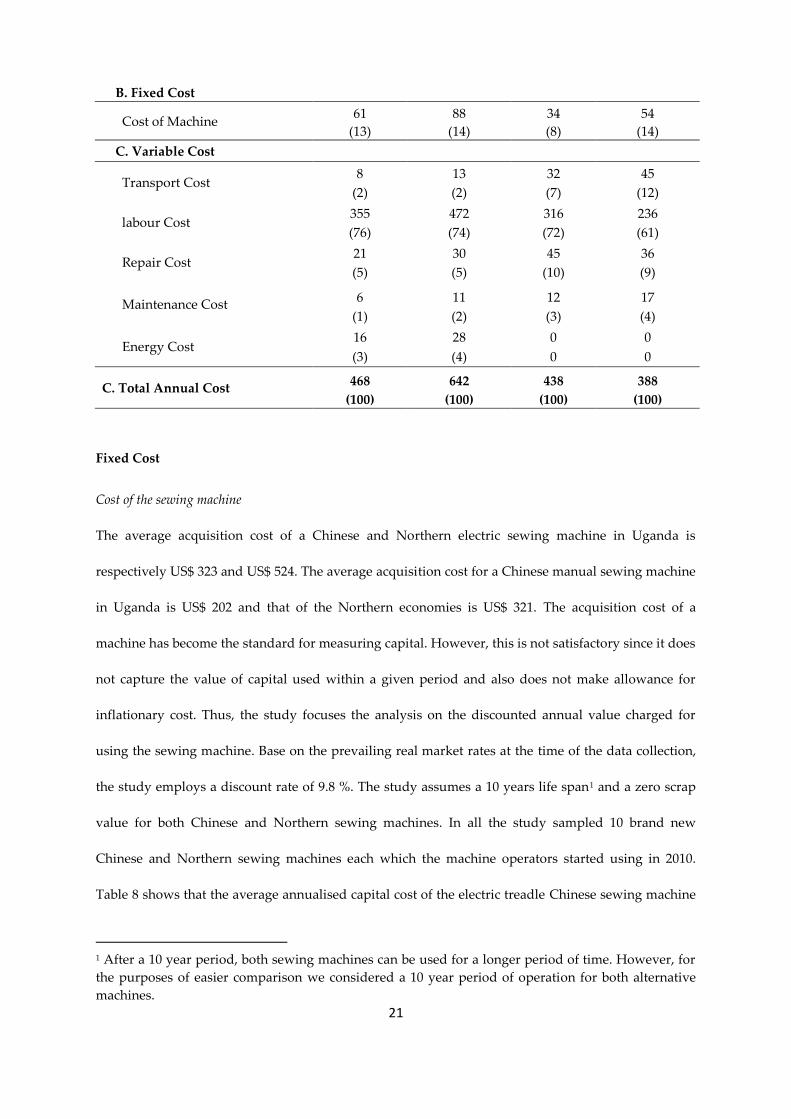
B. Fixed Cost
Cost of Machine
61 88 34 54
(13) (14) (8) (14)
C. Variable Cost
Transport Cost
8 13 32 45
(2) (2) (7) (12)
labour Cost 355 472 316 236
(76) (74) (72) (61)
Repair Cost 21 30 45 36
(5) (5) (10) (9)
Maintenance Cost 6 11 12 17
(1) (2) (3) (4)
Energy Cost 16 28 0 0
(3) (4) 0 0
C. Total Annual Cost 468 642 438 388
(100) (100) (100) (100)
Fixed Cost
Cost of the sewing machine
The average acquisition cost of a Chinese and Northern electric sewing machine in Uganda is
respectively US$ 323 and US$ 524. The average acquisition cost for a Chinese manual sewing machine
in Uganda is US$ 202 and that of the Northern economies is US$ 321. The acquisition cost of a
machine has become the standard for measuring capital. However, this is not satisfactory since it does
not capture the value of capital used within a given period and also does not make allowance for
inflationary cost. Thus, the study focuses the analysis on the discounted annual value charged for
using the sewing machine. Base on the prevailing real market rates at the time of the data collection,
the study employs a discount rate of 9.8 %. The study assumes a 10 years life span1 and a zero scrap
value for both Chinese and Northern sewing machines. In all the study sampled 10 brand new
Chinese and Northern sewing machines each which the machine operators started using in 2010.
Table 8 shows that the average annualised capital cost of the electric treadle Chinese sewing machine
1 After a 10 year period, both sewing machines can be used for a longer period of time. However, for
the purposes of easier comparison we considered a 10 year period of operation for both alternative
machines.
22
is US$ 61.00 in urban communities. This constitutes 13 % of total annual cost of production. That of
the Northern sewing machines is US$ 88, which is US$ 20 higher than the annual cost of the Chinese
sewing machines. In the rural areas, the cost of a manual Chinese sewing machine is US$ 34.00
whereas that of the manual Northern sewing machine is US$ 54.00. The cost of the manual Chinese
sewing machines and Northern sewing machines represents 8 % and 14 % of the total cost of
production respectively in the rural areas. Therefore the Northern sewing machines are more capital
intensive than the Chinese sewing machines. This annualised cost for the two sewing machines also
captures the cost of transporting the machine after it has been acquired.
Variable cost
Transport Cost
Transport cost does not directly affect the smooth operation of the sewing machine, but plays a
crucial role in determining the final selling price of the garment produced. It is the cost incurred by
the machine operator for moving the machine and its parts to a repairer for repair works. Relative to
the Chinese sewing machines, a garment producer will have to travel further distance to access the
parts of a Northern made machine in both urban and rural communities. The study estimates the
average cost of transport per kilometre in Uganda to be US$ 0.78. We measured the average cost of
transporting the machine by taking the product of average transport cost per kilometre and the total
distance travelled to access the machine. This is done at both the rural and urban levels. Sewing
machine repairers are mostly located in urban areas. This makes the cost of transporting sewing
machine within urban areas for repairs relatively cheaper than transporting the machine from rural
areas to the repairer in urban centres. The average cost of transporting a Chinese sewing machine and
its parts for repair works in urban communities is US$ 8. That of a Northern sewing machine is US$
13. Similarly, the cost of transporting the Northern sewing machine for rural works is higher than that
of those of the Chinese sewing machine.
Cost of energy of the sewing machine
23
Energy infrastructure is one of the key factors influencing garment producers to use an electric treadle
sewing machine in the urban communities. Rogale et al., (2005) indicates that using electricity for
sewing speeds up the sewing machine and thus increase productivity. This leads to an increase the
value and productivity yields in garment production (Rogale et al., 2005). However, this also means
that the garment producer will incur energy cost. Measuring the cost of energy consumed by a
sewing machine is difficult. The first issue is that garment producers do not have any system for
measuring energy cost per sewing machine. The monthly electricity bills include all the other
equipment such as pressing irons and electric cutters that are available at the tailoring shop. This
issue is compounded by the fact that both the Chinese and Northern sewing machine use a 5hp
electric motor for sewing. In situations where there are two or more small scale garment producers
sharing the same electric meter, the producers share the electric bills using a system I describe as a
points system. I use the point system to distinguish between the energy consumption rates of the two
types of sewing machines in consideration.
The point system is a crude method of rating the amount of power an electrical appliance
consumes. The higher the amount of electricity consumed by the electrical appliance, the more points
it gets. The challenge with the point system is that it does not capture obsolescence of the equipment as
cautioned by Stewart, (1982); given that obsolete capital equipment is more likely to consume more
energy than relatively new ones. Thus, the study assumes that the Chinese and Northern sewing
machine have a rate of 2.0 and 1.2 respectively. This assumption is based on the fact that the Northern
sewing machine weighs2 more than the Chinese made ones. In comparing the energy cost, the study
adopts the point system with the assumption that the alternative machines are in the same condition.
Using the Electricity Regulatory Authority of Uganda’s end user tariff rate for 2012, energy
consumption at the small scale garment production level is in the category of low voltage supply for
small general services. This category involves electricity supplied to residential houses, small shops
2 Note that energy requirement is directly proportional to the mass of an object (Perrett and Jeffery,
1922).
24
and kiosks, etc—metered at low voltage single phase and supplied at 240 volts (see UMEM, 2012). In
this category, the consumer pays US$ 0.036 for the first 15 kilowatts hour (Kwh) of energy consumed
(UMEM, 2012). Since the two technologies use 5 hp electric motors for garment production, it was
difficult to use only the motors in isolation to make any meaningful comparison. However, factoring
the points system into the equation and converting the horsepower of the electric motor into kilowatts
makes it possible for comparison. It is necessary to note that 1 horsepower hour is equivalent to 0.746
kWh (FAO, 1997). In addition, all things being equal an electric motor cannot operate to its full
capacity. On average, electric motors operate with a maximum load factor of 75 % (FAO, 1997).
According to the United States Congress (1993) a load factor is the average percentage of full
operating power that the electric motor uses. Hence, the study assumes a load factor of 75 % for the
electric motor and an average 8 hour machine working period per day. Therefore taking into account
the load factor of the electric motor, a 5 horsepower motor will consume a maximum of 2.80 kilowatts
hours of power a day.
The results show that garment producers who use electric treadle Chinese made machines
spend an average of US$ 16.00 per annum on energy (Table 8). On the other hand, users of electric
treadle Northern machines spend approximately US$ 28.00 per year on energy (Table 8). Garment
producers in the rural communities do not incur cost mainly because there is no electricity
infrastructure. The study takes note of the fact that garment producers in rural communities use their
man-power for the production process; however, this has already been captured as compensation for
labour as such the study only focuses on energy consumption in urban communities.
Repair cost
Another important component of the cost structure garments production is the repair cost of the
sewing machine. The study estimated cost of repair using two key indicators—the average cost of
spare parts and the rate charged by the sewing machine repairers per repair session. As indicated
earlier, the cost of repairs is uneven. The cost may depend on different factors. It may depend on the
extent of damage as well as the level of complication associated with the damage (Interviews, 2012).
25
The repairer will charge a higher rate if he (there were no female repairers) encounters more
challenges during repairs and vice versa. Again, the machine owner will have to incur higher repair
cost if part of the machine to be replaced is relatively expensive (Interviews, 2012). As the machine
ages, repair works becomes frequent because of an increased rate of wear and tear on the machine.
This leads to an increase in the cost of repairs of the machine. All these factors makes the repairs cost
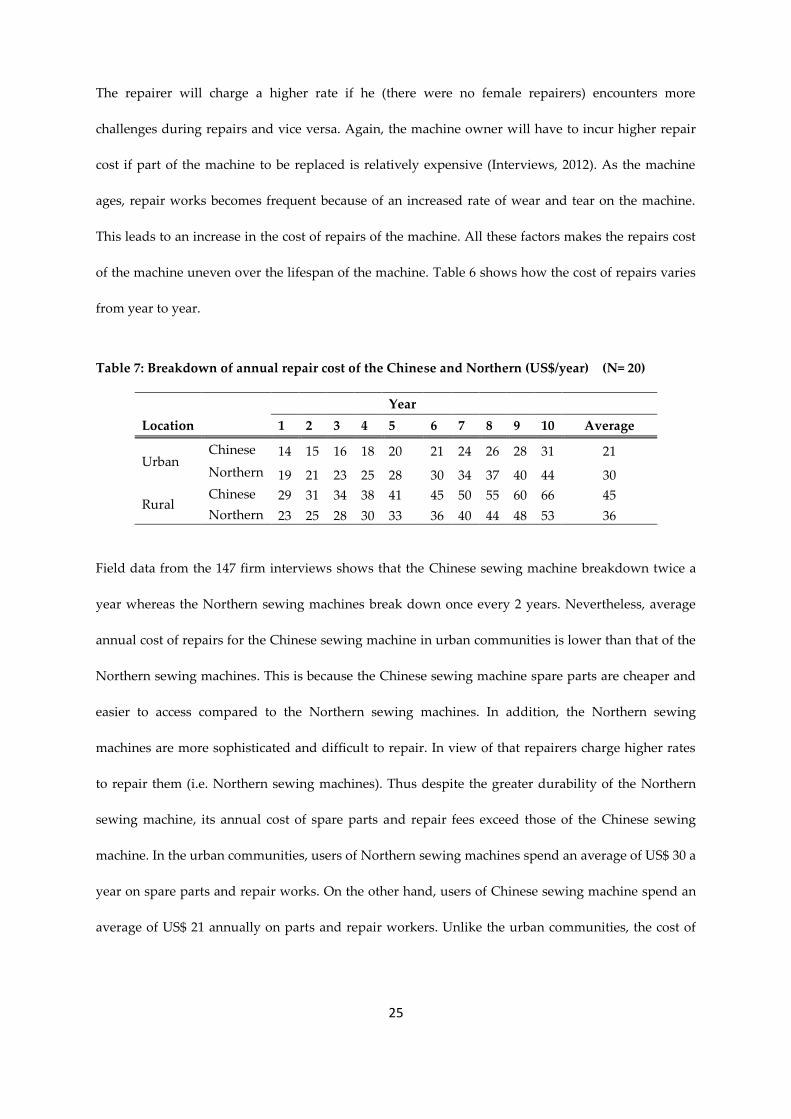
of the machine uneven over the lifespan of the machine. Table 6 shows how the cost of repairs varies
from year to year.
Table 7: Breakdown of annual repair cost of the Chinese and Northern (US$/year) (N= 20)
Year
Location 1 2 3 4 5 6 7 8 9 10 Average
Urban Chinese 14 15 16 18 20 21 24 26 28 31 21
Northern 19 21 23 25 28 30 34 37 40 44 30
Rural Chinese 29 31 34 38 41 45 50 55 60 66 45
Northern 23 25 28 30 33 36 40 44 48 53 36
Field data from the 147 firm interviews shows that the Chinese sewing machine breakdown twice a
year whereas the Northern sewing machines break down once every 2 years. Nevertheless, average
annual cost of repairs for the Chinese sewing machine in urban communities is lower than that of the
Northern sewing machines. This is because the Chinese sewing machine spare parts are cheaper and
easier to access compared to the Northern sewing machines. In addition, the Northern sewing
machines are more sophisticated and difficult to repair. In view of that repairers charge higher rates
to repair them (i.e. Northern sewing machines). Thus despite the greater durability of the Northern
sewing machine, its annual cost of spare parts and repair fees exceed those of the Chinese sewing
machine. In the urban communities, users of Northern sewing machines spend an average of US$ 30 a
year on spare parts and repair works. On the other hand, users of Chinese sewing machine spend an
average of US$ 21 annually on parts and repair workers. Unlike the urban communities, the cost of
26
repairs on the Chinese sewing machine is higher than the Northern sewing machines in the rural
communities.
Wright (2001) indicates that the many problems associated with sewing machines are caused
by dust, lint or thread ends. The robust nature of the Northern sewing machines enables it to
withstand the dusty environment in the rural communities to a greater extent than the Chinese
sewing machine. In rural communities the Chinese sewing machine break down 3 times a year
whereas that of the Northern sewing machines is once per year (Tables 8 and 9). On average, a
Chinese sewing machine user spends almost US$ 45 per year on repair works and users of the
Northern sewing machines spend US$ 36 per year (Tables 8 and 9). One of our female respondents’
puts it succinctly:
I have two of this machines [Chinese machine] and three of the British ones.......but I don’t use
these ones [British made ones] because they are broken down and the spare parts are
expensive and not common on the local market.....I have told a friend of mine who travelled
to Kenya last week to buy me some when he is coming back to Uganda.
In a related development, another had this to say:
I really like the British machines...they are very strong and can last long, the only reason why
we all use the Chinese machines here is because they are cheaper and as you can see.....there
is no electricity here and so we use the China ones....they are very simple and easy to use.
Relative to the Chinese sewing machine, the energy requirement and difficulty in accessing the parts
of the Northern sewing machine serves as a barrier for the less privileged to sustain its operation.
Women and rural dwellers find it difficult in sustaining the operation of the Northern sewing
machine. This is due to the capital and energy intensive nature and the difficulties associated with
access to parts of the Northern sewing machines, women and rural dwellers find it challenging in
sustaining its use.
Skills demand for repair works
There is generally high demand for repairers due to their limited number on the local market.
Interviews with the 5 sewing machine repairers show that out of an average weekly receipt of 25
27
Chinese sewing machines, they are only able to repair 15 of them. This means that repairers will not
be able to repair 40 % of the total Chinese sewing machine they receive. A sewing machine repairer
spends an average of 3 hours to repair a Chinese sewing machine. They are also able to repair 5 out of
an average weekly receipt of 15 Northern sewing machines. This means that a repairer will spend an
average of 8 hours per day to repair only 1 Northern sewing machine. The resultant effect is that the
repairers are able to repair only 33 % of the Northern sewing machines they receive a day. A sewing
machine repairer in Kampala explains that
This week alone I have more than 20 Chinese machines to repair my customers are all on
me.....we [repairers] are very few here so there is a lot of pressure on us. This is the main place
where people repair their machines.
In some cases, the machine users end up abandoning the sewing machines (particularly the Northern
sewing machines) when the repairers are unable to repair the sewing machines. This is as a result of
the complex nature of the machine damage or in some cases challenges in getting sewing machine
parts. Another garment producer at Kiyembe-Kampala indicates that
I bought a Singer sewing machine from the United Kingdom in 2006.....I really enjoyed using
that machine.......but it got damaged last year [2011] when my shop got burnt.....I sent it to
different repairers but none of them were able to repair it.....I had to abandon it because the
damage was too complicated......
The repairers are mainly located in these communities because they are able to access energy for the
equipment they use for the repair works. Thus, the few repairers available are overburdened with lots
of repair works. Contrary to standard literature that AD technologies are less skills intensive (Clark et
al 2009; Kaplinsky 2009), the frequent breakdown of the Chinese sewing machine has demand
implications for repair skills. Therefore both sewing machines require skills for repair works. Thus,
users of the Chinese sewing machine can easily lose valuable clients compared to those who use
Northern sewing machines since they may not be able to get their machines back from the repairers
on time for production. A Chinese sewing machine user in Keyembe in Kampala had this to say:
My machine [Chinese sewing machine] was not working [broken down] during the
Christmas holidays….but I had a lot of work to do for my customers…..So I disappointed
28
them……they don’t bring their material for me to sew again…..I lost them as my
customers…..all my friend who use the British machines did a lot of work [sewing].
Maintenance cost
Most problems associated with sewing machines can be traced to high concentration of dust, lint or
thread ends that have collected on the working parts of the sewing machine. A proper maintenance
culture of the sewing machine to some extent can avert these problems. Depending on the extent to
which the sewing machine is used, garment producers will have to maintain it accordingly. I observe
that the garment producers use soft nylon brushes to dust away lint under the needle plate and
around the feed dog of the sewing machine. The bobbin of the sewing machine is also another place
where lint and fuzz accumulate. Regular replacement of the throat plate, blunt and broken needles,
bobbin case and bobbin housing (hook mechanism) of the sewing machine is also vital to keep the
sewing machine efficient (Wright, 2001). After that the sewing machine should be oiled for proper
lubrication and then covered immediately after use (Wright, 2001).
Items that are used by the garment producer for maintenance activities vary between the two
sewing machine technologies. On the Ugandan local market, the cost of 125ml oil is US$ 1.07. In the
urban communities, users of Chinese sewing machine require an average of 125 ml of oil to lubricate
the machine every quarter of the year. In addition, they require 3 packets of needles every year for
proper maintenance of the machine. Each packet of Chinese sewing machine needle costs US$ 0.71.
Therefore, the Chinese sewing machine user will have to spend an average of US$ 2.14 annually on
needles. The Northern sewing machine users also require 250 ml of oil to lubricate the machine every
quarter of the year in rural communities. However, the Northern sewing machine requires only one
packet of needles annually. Each Northern made needle costs an average of US$ 2.86.
The difference is due to the frequent breakdown of Chinese sewing machine needles relative
to that of the Northern sewing machine. Similar to the repair cost, the annual cumulative cost of
maintenance of the Northern sewing machines is higher than that of the Chinese sewing machine. In
urban communities, the average maintenance cost of Northern sewing machines is US$ 11.00 whereas
29
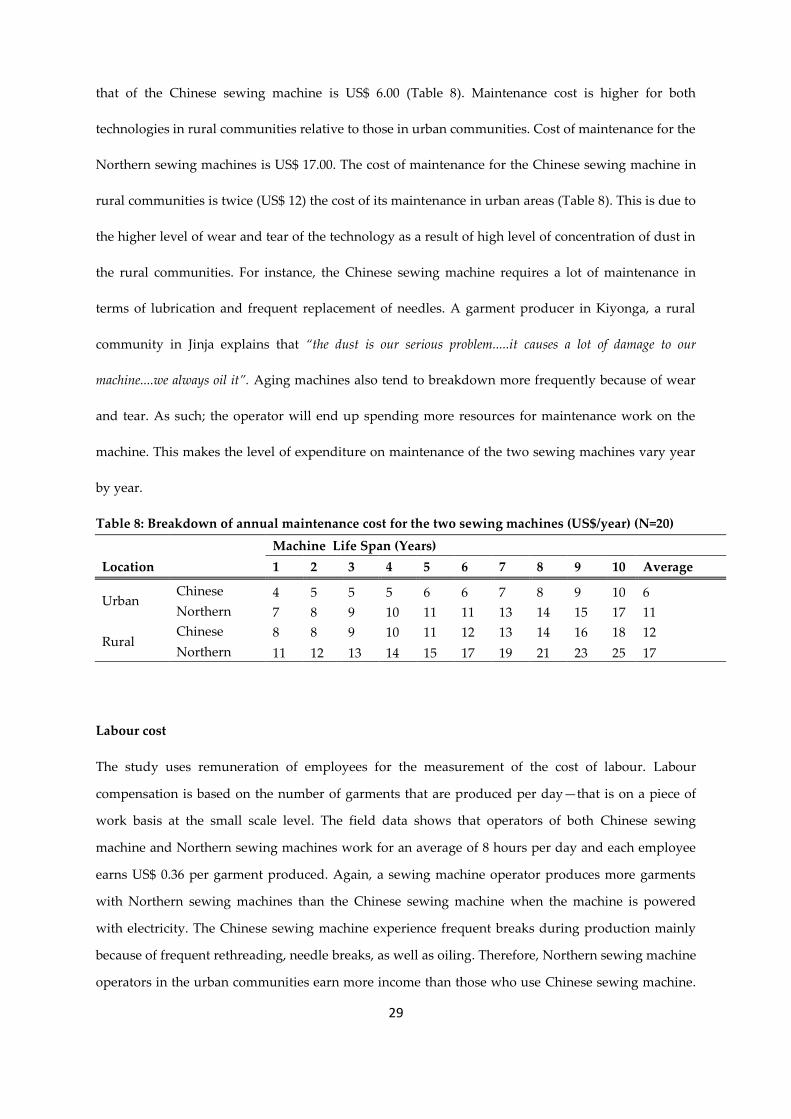
that of the Chinese sewing machine is US$ 6.00 (Table 8). Maintenance cost is higher for both
technologies in rural communities relative to those in urban communities. Cost of maintenance for the
Northern sewing machines is US$ 17.00. The cost of maintenance for the Chinese sewing machine in
rural communities is twice (US$ 12) the cost of its maintenance in urban areas (Table 8). This is due to
the higher level of wear and tear of the technology as a result of high level of concentration of dust in
the rural communities. For instance, the Chinese sewing machine requires a lot of maintenance in
terms of lubrication and frequent replacement of needles. A garment producer in Kiyonga, a rural
community in Jinja explains that “the dust is our serious problem.....it causes a lot of damage to our
machine....we always oil it”. Aging machines also tend to breakdown more frequently because of wear
and tear. As such; the operator will end up spending more resources for maintenance work on the
machine. This makes the level of expenditure on maintenance of the two sewing machines vary year
by year.
Table 8: Breakdown of annual maintenance cost for the two sewing machines (US$/year) (N=20)
Machine Life Span (Years)
Location 1 2 3 4 5 6 7 8 9 10 Average
Urban Chinese 4 5 5 5 6 6 7 8 9 10 6
Northern 7 8 9 10 11 11 13 14 15 17 11
Rural Chinese 8 8 9 10 11 12 13 14 16 18 12
Northern 11 12 13 14 15 17 19 21 23 25 17
Labour cost
The study uses remuneration of employees for the measurement of the cost of labour. Labour
compensation is based on the number of garments that are produced per day—that is on a piece of
work basis at the small scale level. The field data shows that operators of both Chinese sewing
machine and Northern sewing machines work for an average of 8 hours per day and each employee
earns US$ 0.36 per garment produced. Again, a sewing machine operator produces more garments
with Northern sewing machines than the Chinese sewing machine when the machine is powered
with electricity. The Chinese sewing machine experience frequent breaks during production mainly
because of frequent rethreading, needle breaks, as well as oiling. Therefore, Northern sewing machine
operators in the urban communities earn more income than those who use Chinese sewing machine.
30
On average, a Chinese sewing machine operator earns US$ 355 per annum (Table 8). This is lower
than a Northern sewing machine operator who earns an average of US$ 472 per annum (Table 8).
The situation is different for those in rural communities. The bulky nature of the manual
Northern sewing machine makes its operation more laborious than that of the Chinese sewing
machine. The manual Chinese sewing machines on the other hand are less bulky; as such it is easier
for the operator to operate compared to the Northern sewing machines ones. As such, operators using
Chinese sewing machine are able to produce more garments in the rural communities than those
using Northern sewing machines. On average, an operator of manual Chinese sewing machine earns
US$ 316 whereas those who use manual Northern sewing machines earn US$ 236 annually (Table 8).
Output of Chinese sewing machine and Northern sewing machines
The amount of value addition and quantity of garment produced is captured in this Section by using
a medium sized “kitenge” as a standard for measuring the output of both technologies. The location of
the garment firm affects the quantity of garments that can be produced within a given period. A
garment producer in an urban area is able to access energy to speed up garment production.
Producers in rural communities on the other hand have no access to energy infrastructure as such rate
of production is slower. Again, the amount of value added to a garment is determined by the
appearance and performance of the garment. A good appearance of a garment shows on the seams—
this is normally smooth fabric joins with uniform stitches (Aldrich 1994; and Carr and Latham, 1994).
Conversely a good appearance of garments occurs when the seam has achieved strength, durability,
security and comfort (Aldrich 1994; and Carr and Latham, 1994).
Though both the Chinese sewing machine and Northern sewing machines in urban areas use
a 5 hp electric motor, we observe that the Northern sewing machines work faster than that of the
Chinese sewing machine. The 5 hp electric motor enables both sewing machines to work at 1800
revolutions per minute (rpm) (Brother Sewing Machine Manual, 2009); however, the speed partly
leads to skipping of stitches as well as occasional breakdown of some parts of the Chinese sewing
machine. This leads to delays; and reduction in quality and quantity of output of the Chinese sewing
machine relative to the Northern sewing machines. A sewing machine repairer indicates that
31
I always advise the tailors not to fix the motor [5 hp electric motor] on the China
machines......they are too light [less bulky] for the speed [1800 rpm]......that is why they break
needles frequently.
Therefore, when using the Chinese sewing machine for the production of garments, a lot of skills are
required in handling the machine to avoid fabric damage. A respondent indicated that:
You need to be very skilful and experienced enough to be able to able to use the Chinese
sewing machine.....before you can sew with no errors.
As indicated above, the difference in output is due to the continuous interruption as a result of
frequent replacement of broken needles, rethreading and frequent oiling of the Chinese sewing
machine. This causes delays when using the Chinese sewing machine for production. Just as
indicated by Grills and Brown (1975) that an operator will have to spend time to make good a fault
incurred in the sewing operations. This affects the quantity of garment and reduces the value of the
garment produced with the Chinese sewing machine. Interviews with the 147 firms show that both
technologies use a daily average of 30 yards of fabric in the urban communities. However due to their
frequent mechanical issues, the Chinese sewing machine add relatively lower value to the garment.
Furthermore relative to the Northern sewing machines, this issue also makes the Chinese sewing
machine produce fewer quantities of garment. The Chinese sewing machine produce an average of 8
medium sized Kitenges a day (1728 Kitenges per annum) and that of a Northern sewing machine is
capable of producing 10 medium size kitenges a day (2160 Kitenges per annum). A “Kitenge” produced
with an Chinese sewing machine will add an average value of US$ 0.77 and that of the Northern
sewing machine is US$ 0.88.
Unlike the urban communities, the two technologies—Chinese sewing machine and Northern
sewing machines—are manually operated in rural communities. Ideally, the Northern sewing
machines are mainly meant to operate with electricity but it can easily be used manually by detaching
the 5 hp electric motor from the machine. However this comes with some challenges which affect the
32
output of the garment. Without the required pressure on the fabric from the presser foot3, the feed
dog4 of the sewing machine cannot do its job efficiently. This prevents the fabric from feeding
through; causing jams and damages to the fabric and hence reducing the quantity of the garment to
be produced per day. Garment producers in rural communities use paper makers for the production
of garments. Correcting errors on paper markers are difficult, time consuming and compromise the
value that is added to the garment. A garment producer in Kiyonga, a village close to Iganga in the
Eastern region of Uganda indicates that:
We only use paper and markers for the designing…..it wastes a lot of time and you can make
a lot of mistakes”.
Though the two sewing machines are generally slow when operating manually the Chinese sewing
machine are relatively more efficient. The manual treadle Chinese sewing machine and Northern
sewing machines respectively produce 4 and 3 Kitenges a day in rural communities. However, in
terms of value addition there is no difference between the two technologies at the rural level. The
study further estimates the percentage of waste that is produced as a result of using either a Chinese
sewing machine or a Northern sewing machine. This is not the waste caused as a result of labour
errors but due to mechanical issues related to the sewing machine. We compute this by taking the
difference between the fabric lengths after cutting has been made and the actual length that goes into
the production of the garment expressed as a percentage. This is on the assumption that both
technologies use homogeneous fabric to produce homogeneous output. The total annual value of
garment produced by the Northern sewing machines is the higher than the Chinese sewing machine.
However, the total value of garments produced by the in rural communities Northern sewing
machine is lower than that of the Chinese sewing machine (Table 9).
3 The bulky nature of the Northern sewing machines makes it difficult for the operators to exert
pressure on the presser foot and this causes a malfunctioning of the feed dog.
4 The feed dog of the sewing machine is responsible for pulling the fabric through the machine in
discrete steps, in-between stitches.
33
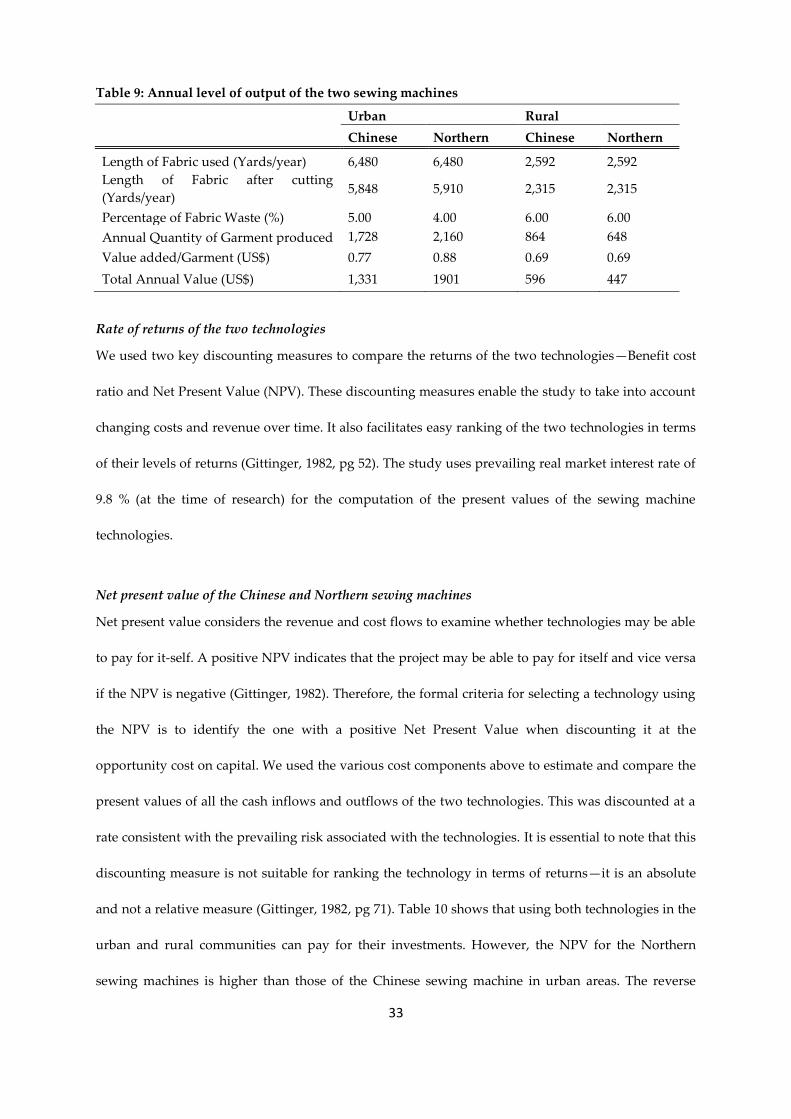
Table 9: Annual level of output of the two sewing machines
Urban Rural
Chinese Northern Chinese Northern
Length of Fabric used (Yards/year) 6,480 6,480 2,592 2,592
Length of Fabric after cutting
(Yards/year) 5,848 5,910 2,315 2,315
Percentage of Fabric Waste (%) 5.00 4.00 6.00 6.00
Annual Quantity of Garment produced 1,728 2,160 864 648
Value added/Garment (US$) 0.77 0.88 0.69 0.69
Total Annual Value (US$) 1,331 1901 596 447
Rate of returns of the two technologies
We used two key discounting measures to compare the returns of the two technologies—Benefit cost
ratio and Net Present Value (NPV). These discounting measures enable the study to take into account
changing costs and revenue over time. It also facilitates easy ranking of the two technologies in terms
of their levels of returns (Gittinger, 1982, pg 52). The study uses prevailing real market interest rate of
9.8 % (at the time of research) for the computation of the present values of the sewing machine
technologies.
Net present value of the Chinese and Northern sewing machines
Net present value considers the revenue and cost flows to examine whether technologies may be able
to pay for it-self. A positive NPV indicates that the project may be able to pay for itself and vice versa
if the NPV is negative (Gittinger, 1982). Therefore, the formal criteria for selecting a technology using
the NPV is to identify the one with a positive Net Present Value when discounting it at the
opportunity cost on capital. We used the various cost components above to estimate and compare the
present values of all the cash inflows and outflows of the two technologies. This was discounted at a
rate consistent with the prevailing risk associated with the technologies. It is essential to note that this
discounting measure is not suitable for ranking the technology in terms of returns—it is an absolute
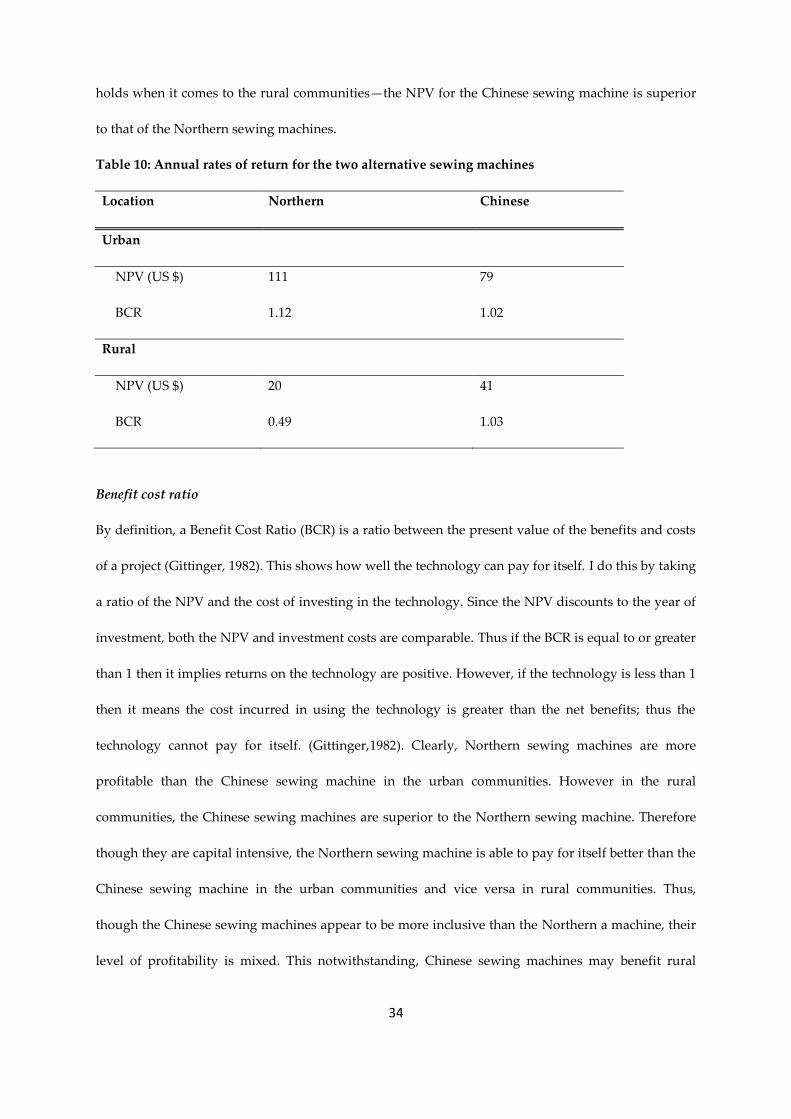
and not a relative measure (Gittinger, 1982, pg 71). Table 10 shows that using both technologies in the
urban and rural communities can pay for their investments. However, the NPV for the Northern
sewing machines is higher than those of the Chinese sewing machine in urban areas. The reverse
34
holds when it comes to the rural communities—the NPV for the Chinese sewing machine is superior
to that of the Northern sewing machines.
Table 10: Annual rates of return for the two alternative sewing machines
Location Northern Chinese
Urban
NPV (US $) 111 79
BCR 1.12 1.02
Rural
NPV (US $) 20 41
BCR 0.49 1.03
Benefit cost ratio
By definition, a Benefit Cost Ratio (BCR) is a ratio between the present value of the benefits and costs
of a project (Gittinger, 1982). This shows how well the technology can pay for itself. I do this by taking
a ratio of the NPV and the cost of investing in the technology. Since the NPV discounts to the year of
investment, both the NPV and investment costs are comparable. Thus if the BCR is equal to or greater
than 1 then it implies returns on the technology are positive. However, if the technology is less than 1
then it means the cost incurred in using the technology is greater than the net benefits; thus the
technology cannot pay for itself. (Gittinger,1982). Clearly, Northern sewing machines are more
profitable than the Chinese sewing machine in the urban communities. However in the rural
communities, the Chinese sewing machines are superior to the Northern sewing machine. Therefore
though they are capital intensive, the Northern sewing machine is able to pay for itself better than the
Chinese sewing machine in the urban communities and vice versa in rural communities. Thus,
though the Chinese sewing machines appear to be more inclusive than the Northern a machine, their
level of profitability is mixed. This notwithstanding, Chinese sewing machines may benefit rural
35
dwellers but may not serve well for women in urban areas. That is if one considers the fact that the
Chinese machines add less value and also yield lower returns relative to the Northern ones in the
presence of energy infrastructure. This also means that the Chinese sewing machine may not be
entirely inclusive in urban areas.
Summary and conclusion
Endemic poverty and the dwindling fortunes of Uganda in the global garment industry have partly
been attributed to the inability of rural dwellers and women to access and utilise technologies for
garment production in the country (GoU, 2014). Historically, the Northern economies, particularly
Britain and USA have been the main sources of technologies for small-scale garment producers in
Uganda. Over the past decade, China has become an important alternative source of these
technologies, particularly, sewing machines in Uganda. Preceding a national foresight exercise aimed
at enhancing the capabilities of small scale garment producers, we examined the potential
inclusiveness nature of Chinese and Northern sewing machines in Uganda. Drawing on inclusive
innovation, as a meta-theoretical lens, we compared the inclusiveness, profitability, productivity, job
and wealth creation attributes of Chinese and Northern garment making technologies in Uganda.
These comparisons are important because poverty is endemic in Uganda (both absolute and relative
poverty), despite the fact that Uganda achieved the MDG1 target of halving the proportion of people
living below $1 a day more than five years ahead of the 2015 deadline. This is against the backdrop
that high inequality rate and unemployment can offset the poverty reducing effect on the country’s
economic growth.
Our study shows that technology plays a very significant role in poverty reduction; and that
women and rural dwellers are the less privileged to technological innovations in the garment sector.
This is partly but largely because women in developing countries bear a disproportionate burden
undertaking time and labour intensive unpaid activities such as cooking, cleaning, fetching fuel or
water. This creates a barrier for women to venture into skills and wealth creating activities that will
36
enable them adopt skills intensive technologies (Gill et al. 2010). Rural dwellers also have no access to
energy in Uganda. As such they are unable to use technologies that require power to operate. They
are only able to use manual machines, which only produces lower quantities of garment. These
attributes excludes these two groups—women and rural dwellers—of technology consumers from
using technologies to improve upon their livelihood. Our study found that women and rural dwellers
that use Chinese sewing technologies are able to access, own and utilise them to improve their
livelihoods relative to the Northern ones. The Chinese garment making technologies contributes
positively towards the socioeconomic welfare by creating new entrepreneurial opportunities for
women and rural dwellers that use Chinese sewing machines. Thus, this paper further concludes that
the use of Chinese sewing machines spur the inclusion of rural dwellers and women in the use of
technologies—acquisition of technological knowhow, develop their skills and create jobs.
This is coupled with the fact that China has become the dominant source of garment making
technologies in Uganda. Furthermore, relative to the Northern machines, the Chinese sewing
machines are less capital intensive and are economically efficient in both rural and urban areas.
However, there is no set of factor prices that will result in the choice of Northern sewing machines if
the products are homogeneous. However, contrary to the assumptions in literature that the Chinese
sewing machines technologies are less skills intensive (Clark et al 2009; Kaplinsky 2009), the frequent
breakdown of the Chinese sewing machine will require skills for repairing them. I also conclude that
though the Chinese sewing machines may be inclusive, they may not be profitable relative to the
Northern ones.
We conclude that the Chinese machines add less value to garments relative to the Northern
ones. This is because it skips and produces weaker stitches. Furthermore, we conclude that the level
of profitability of the Chinese sewing machines is relatively lower than those from Northern
economies in urban areas. From this perspective, the Chinese sewing machines are more profitable
than the Northern machines in rural areas. It is therefore important for policy makers to note that
preference for function rather than position among low income consumers in most developing
37
countries like Uganda is the main driving force for such low cost technologies. As a result, garment
producers in Uganda are accepting China’s strategy of producing low cost and inferior quality
technologies into developing countries (Kaplinsky and Prahalad, 2005). This may also be the conduit
for poor consumers such as rural dwellers and women in particular to be included in technology
access and utilisation.
References
AEO (2012). “African Economic outlook: Uganda country report 2012”, published by AfDB, OECD,
UNDP, UNECA. www.africaneconomicoutlook.org.
Akoten, J. E., and Otsuka, K. (2007). From tailors to mini-manufacturers: The role of traders in the
performance of garment enterprises in Kenya. Journal of African Economies, 16(4), 564-595.
Aldrich, W. (1994). CAD in Clothing and Textiles, Wiley-Blackwell, John Wiley and Sons, (2nd
Edition), pages 51-62.
Amankwah-Amoah, J. (2015) Explaining declining industries in developing countries: The case of
textiles and apparel in Ghana." Competition & Change 19, 1, 19-35.
Amsalem, M. A. (1983). Technology choice in developing countries: the textile and pulp and paper
industries, 6th Edition, Cambridge, Mass: MIT Press, pages 10-25.
Bechhofer, F. and Paterson, L. (2000). Principles of Research Design in the Social Sciences, London:
Routledge, pages 145-152.
Bhalla, A.S. (1985). Technology and Employment in industry, International Labour Organization,
revised and enlarged edition, pages 25-42.
Brother Sewing Machine Manual (2009). A Brother sewing machine guide for knowing your sewing
machine, pages 4-34.
http://www.mdc.umn.edu/facility/files/electrical/Elec%20Manuals/Sewing%20Machine%20U
ser%20Manual.pdf
Carr, H. and Latham, B. (1994). The Technology of Clothing Manufacture, 2nd Edition, Blackwell
Science, pages 31-45.
Chandra, V. (2006). Technology, adaptation and exports: how some developing countries got it right?,
first edition, The World Bank, 1818 H Street NW, Washington, DC 20433, USA, pages 31-65.
Chataway, J., Hanlin, R. and Kaplinsky, R. (2013). “Inclusive innovation: a architecture for policy
development”, Innovation Knowledge and Development working paper No. 65.
Chen, S. and Ravallion, M. (2008). “The developing world is poorer than we thought, but no less
successful in the fight against poverty” Policy Research Working Paper 4703, pages 5-15.
38
Christiaensen, L., Chuhan-Pole, P. and Sanoh, A. (2013). “Africa’s growth, poverty and inequality
nexus - fostering shared prosperity” Mimeo, World Bank Washington.
Clark, N., Chataway, J., Hanlin, R., Kale, D., Kaplinsky, R., Muraguri, L., Papaioannou, T., Robbins, P.
and Wamae, W. (2009). “Below the radar: What does innovation in the Asian driver
economies have to offer other low income economies”. Economic and Social Research
Council, pages 14-19.
Cotton Development Organisation (2009), “The Ugandan Cotton Sector report for 2008” Republic of
Uganda.
Eckaus R S, (1955), "The Factor Proportions Problem in Underdeveloped Areas", American Economic
Review, Vol. 45, No. 4, pages 539-565.
Emmanuel, A. (1982). Appropriate or under-developed Technology?, J Wiley, Chichester, pages 3-22.
FAO (1997), Energy and Environment Basics, Second Edition, Regional Wood Energy Development
Programme in Asia of the Food and Agriculture Organisation. Report compiled by
Technology and Development Group University of Twente, Netherlands, RWEDP Report No.
29, GCP/RAS/154/NET, pages. 14-27.
Feder, G., & Umali, D. L. (1993). The adoption of agricultural innovations: a review. Technological
Forecasting and Social Change, 43(3), 215-239.
Gereffi, G. and Memedovic, O., (2003). The global apparel value chain: What prospects for upgrading by
developing countries (pp. 1-40). Vienna: United Nations Industrial Development Organization.
Gill, K., Brooks, K., McDongall, J., Patel, P. and Ashihan, K. (2010). “Bridging the technology gap
divide: How technology can advance women economically” An International Centre for
research on women paper, pages. 5-7.
Gittinger, J.P. (1982). Economic Analysis of Agricultural Projects, 2nd Edition, John Hopkins
University press, pages 12-39.
GoU (2012). “Government of Uganda Statistical Abstract, 2012”, report published by the Uganda
Bureau of statistics, pages 23-29.
GoU (2013). “Uganda Statistical Abstratct-2013”, a report produced by Uganda Bureau of Statistics,
pages 20-41.
GoU (2008). “Uganda Industrial Policy- A Framework for Uganda‘s Transformation, Competitiveness
and Prosperity” published by the Uganda Ministry of Tourism, Trade and Industry, pages 11-
34.
GoU (2009). “Uganda National Textiles Policy”, a document published by the Uganda Ministry of
Tourism, Trade, and Industry, pages 4-23.
GoU (2010). “Uganda National Development Plan 2010/11-2014/15”, pages. 7-25 this paper is available
on the IMF website as a Poverty Reduction Strategy Paper, also available on
http://www.imf.org.
39
GoU (2012). “Government of Uganda Statistical Abstract, 2012” report published by the Uganda
Bureau of statistics, pages 23-29.
Gereffi, G. and Memedovic, O. (2003). The global apparel value chain: What prospects for upgrading by
developing countries (pp. 1-40),Vienna: United Nations Industrial Development Organization.
Grills, R. and Brown, S. (1975), Productivity in sewing operations, Shirley Institute, ISBN-13:
9780903669122, pages 55-76.
Hazarika, B., Bezbaruah, M.P., and Goswami, K. (2015) Adoption of technology in the handloom
micro-enterprise in Assam: A double hurdle approach, Technological Forecasting and Social
Change, doi:10.1016/j.techfore.2015.08.009
Huang, Y. (2003), Selling China, Cambridge University Press: Cambridge, UK.
International Labour Organisation (2002). “Decent work and the informal economy”, Report VI,
International Labour Conference, 90th Session 2002, (Geneva).
International Cotton Advisory Committee (2006), “The Importance of Cotton in Africa” A paper
delivered at a conference organized by the Woodrow Wilson Center, the International Food &
Agricultural Trade Policy Council and the IDEA Centre on Cotton – The Next Steps for
Africa,” October 26, 2006, Washington, DC.
James, J. and Bhalla, A., 1993. Flexible specialization, new technologies and future industrialization in
developing countries. Futures, 25(6), pp.713-732.
Jenkins, R. (1975). Images and enterprises, Baltimore MD, The John Hopkins University Press.
Jick, T.D. (1979). Mixing qualitative and quantitative methods: Triangulation in action. Administrative
Science Quarterly, 1, 602-611.
Kaplinsky, R. (2011). Schumacher meets Schumpeter: Appropriate technology below the radar.
Research Policy, 40(2), pp.193-203.
Kaplinsky, R. (1990). The Economies of Small: Appropriate technology in a changing world, IT
Publications in association with Appropriate Technology International, pages 1-35.
Moghadam, V., 2015. Gender and globalization: Female labor and women's mobilization. Journal of
World-Systems Research, 5(2), pp.366-389.
Mytelka, L. (1991). Technological Change and the Global Relocation of Production in Textiles and
Clothing. Studies in Political Economy 36 (Fall): 109–143.
Paunov, C. (2013), “Innovation and Inclusive Development: A Discussion of the Main Policy Issues,
OECD Science, Technology and Industry Working Paper No. 2013/1, OECD Publishing.
Pearson, R. (2000). “Moving the Goalposts: Gender and Globalisation in the Twenty-first Century”,
Gender and Development, Vol. 8, No.1. 10-19.
Prahalad, C. K. (2006). The Fortune at the Bottom of the Pyramid. Pearson Education India.
Ravalion, M. (2007). “Inequality is bad for the poor”, in J. Micklewright and S. Jenkins (eds.),
Inequality and Poverty Re-Examined. Oxford: Oxford University Press
40
Ritchie, J Spencer, L. 1994. Qualitative data analysis for applied policy research. In: Bryman, A
Burgess, RG, eds. Analyzing Qualitative Data. London: Routledge.
Rogale D., Petrunić, I., Dragčević, Z. and Rogale, S. F. (2005) "Equipment and methods used to
investigate energy processing parameters of sewing technology operations", International
Journal of Clothing Science and Technology, Vol. 17 Issue: 3/4, pages 179 – 187.
Uganda National Power Distributo (UMEME), available at:
http://www.umeme.co.ug/index.php?page=ODI=
Schrank, A. (2004). Ready-to-wear development? Foreign investment, technology transfer, and
learning by watching in the apparel trade. Social Forces, 83(1), 123-156.
Sen, A.K. (1968), Choice of techniques, 3rd Edition, Oxford: Basil Blackwell; Delhi, Oxford University
Press.
Stewart, F. (1982). Technology and Underdevelopment, London, Macmillan, 2nd edition, pages 1-30.
Strauss, AL. 1978. Qualitative analysis for social scientist. Cambridge: Cambridge University Press.
Suddaby, R. 2006. From the editors: What grounded theory is not, Academy of Management Journal,
49(4): 633-642.
The Ugandan Monitor, 2012 Matisko, K. (2012). “Navigating Uganda‘s economy through five
decades” a published article in The Ugandan Daily Monitor, a leading news paper in Uganda,
October 9, 2012. http://www.monitor.co.ug/Business/Prosper/Navigating-Uganda-s-
economy-through-five-decades/-/688616/1528684/-/item/0/-/pad7tm/-/index.html.
Thoburn, J. (2009), “Vietnam as a Role Model for Development”, United Nations World Institute for
Development Economics Research [WIDER], Helsinki, Research Paper 2009/30, pages1-
12.www.wider.unu.edu/publications/working-papers/research-papers/en_GB/research-
papers/.
UIA (2013) “Uganda Investment Authority‘s performance in the financial year 2010/11” A press
briefing by the Uganda minister of finance, pages 1-2.
United States Congress (1993), “Industrial Energy Efficiency, Office of Technology Assessment”,
OTA-E-560 (Washington, DC: U.S. Government Printing Office), pages 6-11.
USAID (2003), “Report on Cotton- Textile Supply Chain in Uganda”, report published by USAID.
Regional Agriculture Trade Expansion Support Program, pages 6-21.
Wade, R. (1990). Governing the Market: Economic Theory and the Role of Government in East Asia's
Industrialization. Princeton University Press, Princeton.
World Bank (2013), Doing Business 2013: Smarter Regulations for Small and Medium-Size
Enterprises, 10th Edition, International Bank for Reconstruction and Development, pages 3-
21.
World Bank, (2014). “Pulse Africa: An analysis of issues shaping Africa’s economic future”, a
document produced by the Office of the Chief Economist for the Africa region, volume 8,
page 6-13.

41
Wright, S. (2001). “Sewing machine maintenance”, New Mexico State University, cooperative
Extension Service, College of Agriculture and Home Economics, Guide C-102,
http://aces.nmsu.edu/pubs/_c/C102/.
Yamagata, T. (2007) ‘Prospects for development of the garment industry in developing countries:
what has happened since the MFA phase-out?’, Discussion Paper No. 101, Tokyo: Institute of
Developing Economies.
Related Documents