Journal of Mining and Environment (JME) Vol. 12, No. 3, 2021, 667-677 Corresponding author: [email protected] (M. Sharma). Shahrood University of Technology Iranian Society of Mining Engineering (IRSME) Journal of Mining and Environment (JME) journal homepage: www.jme.shahroodut.ac.ir A Comparative Study of Machine Learning Methods for Prediction of Blast-Induced Ground Vibration Ankit Srivastava, Bhanwar Singh Choudhary and Mukul Sharma * Department of Mining Engineering, Indian Institute of Technology (ISM), Dhanbad, India Article Info Abstract Received 21 July 2021 Received in Revised form 28 September 2021 Accepted 1 October 2021 Published online 1 October 2021 DOI:10.22044/jme.2021.11012.2077 Blast-induced ground vibration (PPV) evaluation for a safe blasting is a long- established criterion used mainly by the empirical equations. However, the empirical equations are again considering a limited information. Therefore, using Machine Learning (ML) tools [Support Vector Machine (SVM) and Random Forest (RF)] can help in this context, and the same is applied in this work. A total of 73 blasts are monitored and recorded in this work. For the ML tools, the dataset is divided into the 80-20 ratio for the training and testing purposes in order to evaluate the performance capacity of the models. The prediction accuracies by the SVM and RF models in predicting the PPV values are satisfactory (up to 9% accuracy). The results obtained show that the coefficient of determination (R2) for RF and SVM is 0.81 and 0.75, respectively. Compared to the existing linear regressions, this work recommends using a machine learning regression model for the PPV prediction. Keywords Empirical Equation Ground Vibration Peak Particle Velocity Random Forest Regression Support Vector Regression 1. Introduction Blasting is a damaging and irreversible operation by its very nature. However, due to its economics and adaptability, it is used in the open cast mines. Working professional’s primary concern during blasting for excavation is a disruption to the excavation's boundary, which results in noticeable changes to the rock's appearance in the form of cracking, fragmentation, slabbing, back-break, and over-break [1-4]. If the magnitude of the damage and its impact on the surrounding rock can be anticipated, the blast design can be adjusted to minimize the ore and waste dilution and instability problems by adjusting the reverent parameters. Ground vibrations, air blast, and fly-rock generation are the three main disruptions caused by blasting in the surface mines. Almost all of these issues cause severe damages to the buildings near the blasting zone, and, aside from that, they can lead to ongoing tension with the residents living near the activity site. As a result, a vibration control study in mines is required to predict the blast-induced ground vibration components, which is critical for mitigating the negative consequences. Many researchers' use of empirical equations is one of the most recognized and highly used methods and procedures for the vibration prediction. The engineers have been using the scaled distance regression analysis in order to predict PPV for decades because it is the simplest and least complicated tool. The scaled distance is a term based on the amount of energy released by explosives in air shock generation and seismic waves and the impact of distance on ground wave attenuation [5], [6]. The scaled distance is determined by multiplying the distance between the energy source and the measured points on the field by the maximum charge weight per delay. [7] stated that the effect of charge weight per delay on PPV was much more pronounced than a far distance (> 50 m).

Welcome message from author
This document is posted to help you gain knowledge. Please leave a comment to let me know what you think about it! Share it to your friends and learn new things together.
Transcript
Journal of Mining and Environment (JME) Vol. 12, No. 3, 2021, 667-677
Corresponding author: [email protected] (M. Sharma).
Shahrood University of Technology
Iranian Society of Mining
Engineering (IRSME)
Journal of Mining and Environment (JME)
journal homepage: www.jme.shahroodut.ac.ir
A Comparative Study of Machine Learning Methods for Prediction of Blast-Induced Ground Vibration Ankit Srivastava, Bhanwar Singh Choudhary and Mukul Sharma*
Department of Mining Engineering, Indian Institute of Technology (ISM), Dhanbad, India
Article Info Abstract
Received 21 July 2021 Received in Revised form 28 September 2021 Accepted 1 October 2021 Published online 1 October 2021 DOI:10.22044/jme.2021.11012.2077
Blast-induced ground vibration (PPV) evaluation for a safe blasting is a long-established criterion used mainly by the empirical equations. However, the empirical equations are again considering a limited information. Therefore, using Machine Learning (ML) tools [Support Vector Machine (SVM) and Random Forest (RF)] can help in this context, and the same is applied in this work. A total of 73 blasts are monitored and recorded in this work. For the ML tools, the dataset is divided into the 80-20 ratio for the training and testing purposes in order to evaluate the performance capacity of the models. The prediction accuracies by the SVM and RF models in predicting the PPV values are satisfactory (up to 9% accuracy). The results obtained show that the coefficient of determination (R2) for RF and SVM is 0.81 and 0.75, respectively. Compared to the existing linear regressions, this work recommends using a machine learning regression model for the PPV prediction.
Keywords
Empirical Equation Ground Vibration Peak Particle Velocity Random Forest Regression Support Vector Regression
1. Introduction Blasting is a damaging and irreversible operation
by its very nature. However, due to its economics and adaptability, it is used in the open cast mines. Working professional’s primary concern during blasting for excavation is a disruption to the excavation's boundary, which results in noticeable changes to the rock's appearance in the form of cracking, fragmentation, slabbing, back-break, and over-break [1-4]. If the magnitude of the damage and its impact on the surrounding rock can be anticipated, the blast design can be adjusted to minimize the ore and waste dilution and instability problems by adjusting the reverent parameters.
Ground vibrations, air blast, and fly-rock generation are the three main disruptions caused by blasting in the surface mines. Almost all of these issues cause severe damages to the buildings near the blasting zone, and, aside from that, they can lead to ongoing tension with the residents living near the activity site. As a result, a vibration control study in
mines is required to predict the blast-induced ground vibration components, which is critical for mitigating the negative consequences.
Many researchers' use of empirical equations is one of the most recognized and highly used methods and procedures for the vibration prediction.
The engineers have been using the scaled distance regression analysis in order to predict PPV for decades because it is the simplest and least complicated tool. The scaled distance is a term based on the amount of energy released by explosives in air shock generation and seismic waves and the impact of distance on ground wave attenuation [5], [6]. The scaled distance is determined by multiplying the distance between the energy source and the measured points on the field by the maximum charge weight per delay. [7] stated that the effect of charge weight per delay on PPV was much more pronounced than a far distance (> 50 m).
Srivastava et al Journal of Mining & Environment, Vol. 12, No. 3, 2021
668
Although the approach is well-accepted due to its ease of use, it is merely an empirical approach that does not consider the inevitable phenomenon of blast wave superimposition. Many attempts have been
made to obtain the actual charge weight per delay, contributing to the superimposed waveforms resulting from production blasting.
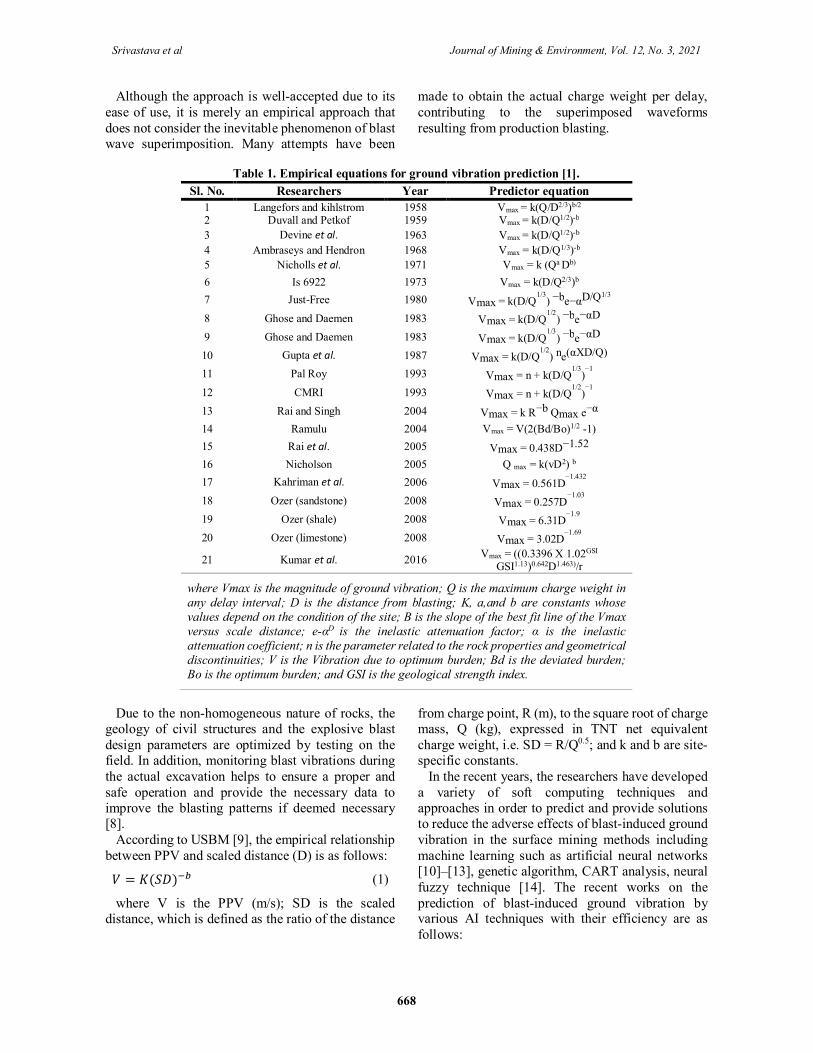
Table 1. Empirical equations for ground vibration prediction [1]. Sl. No. Researchers Year Predictor equation
1 Langefors and kihlstrom 1958 Vmax = k(Q/D2/3)b/2 2 Duvall and Petkof 1959 Vmax = k(D/Q1/2)-b 3 Devine et al. 1963 Vmax = k(D/Q1/2)-b 4 Ambraseys and Hendron 1968 Vmax = k(D/Q1/3)-b 5 Nicholls et al. 1971 Vmax = k (Qa Db) 6 Is 6922 1973 Vmax = k(D/Q2/3)b 7 Just-Free 1980 Vmax = k(D/Q
1/3) −be−αD/Q1/3
8 Ghose and Daemen 1983 Vmax = k(D/Q
1/2) −be−αD
9 Ghose and Daemen 1983 Vmax = k(D/Q1/3
) −be−αD 10 Gupta et al. 1987 Vmax = k(D/Q
1/2) ne(αXD/Q)
11 Pal Roy 1993 Vmax = n + k(D/Q1/3
)−1
12 CMRI 1993 Vmax = n + k(D/Q
1/2)−1
13 Rai and Singh 2004 Vmax = k R−b Qmax e−α 14 Ramulu 2004 Vmax = V(2(Bd/Bo)1/2 -1) 15 Rai et al. 2005 Vmax = 0.438D−1.52 16 Nicholson 2005 Q max = k(vD2) b 17 Kahriman et al. 2006 Vmax = 0.561D
−1.432
18 Ozer (sandstone) 2008 Vmax = 0.257D−1.03
19 Ozer (shale) 2008 Vmax = 6.31D
−1.9
20 Ozer (limestone) 2008 Vmax = 3.02D−1.69
21 Kumar et al. 2016 Vmax = ((0.3396 X 1.02GSI GSI1.13)0.642D1.463)/r
where Vmax is the magnitude of ground vibration; Q is the maximum charge weight in any delay interval; D is the distance from blasting; K, a,and b are constants whose values depend on the condition of the site; Β is the slope of the best fit line of the Vmax versus scale distance; e-αD is the inelastic attenuation factor; α is the inelastic attenuation coefficient; n is the parameter related to the rock properties and geometrical discontinuities; V is the Vibration due to optimum burden; Bd is the deviated burden; Bo is the optimum burden; and GSI is the geological strength index.
Due to the non-homogeneous nature of rocks, the
geology of civil structures and the explosive blast design parameters are optimized by testing on the field. In addition, monitoring blast vibrations during the actual excavation helps to ensure a proper and safe operation and provide the necessary data to improve the blasting patterns if deemed necessary [8].
According to USBM [9], the empirical relationship between PPV and scaled distance (D) is as follows:
= (ܦ)ܭ (1)
where V is the PPV (m/s); SD is the scaled distance, which is defined as the ratio of the distance
from charge point, R (m), to the square root of charge mass, Q (kg), expressed in TNT net equivalent charge weight, i.e. SD = R/Q0.5; and k and b are site-specific constants.
In the recent years, the researchers have developed a variety of soft computing techniques and approaches in order to predict and provide solutions to reduce the adverse effects of blast-induced ground vibration in the surface mining methods including machine learning such as artificial neural networks [10]–[13], genetic algorithm, CART analysis, neural fuzzy technique [14]. The recent works on the prediction of blast-induced ground vibration by various AI techniques with their efficiency are as follows:
Srivastava et al Journal of Mining & Environment, Vol. 12, No. 3, 2021
669
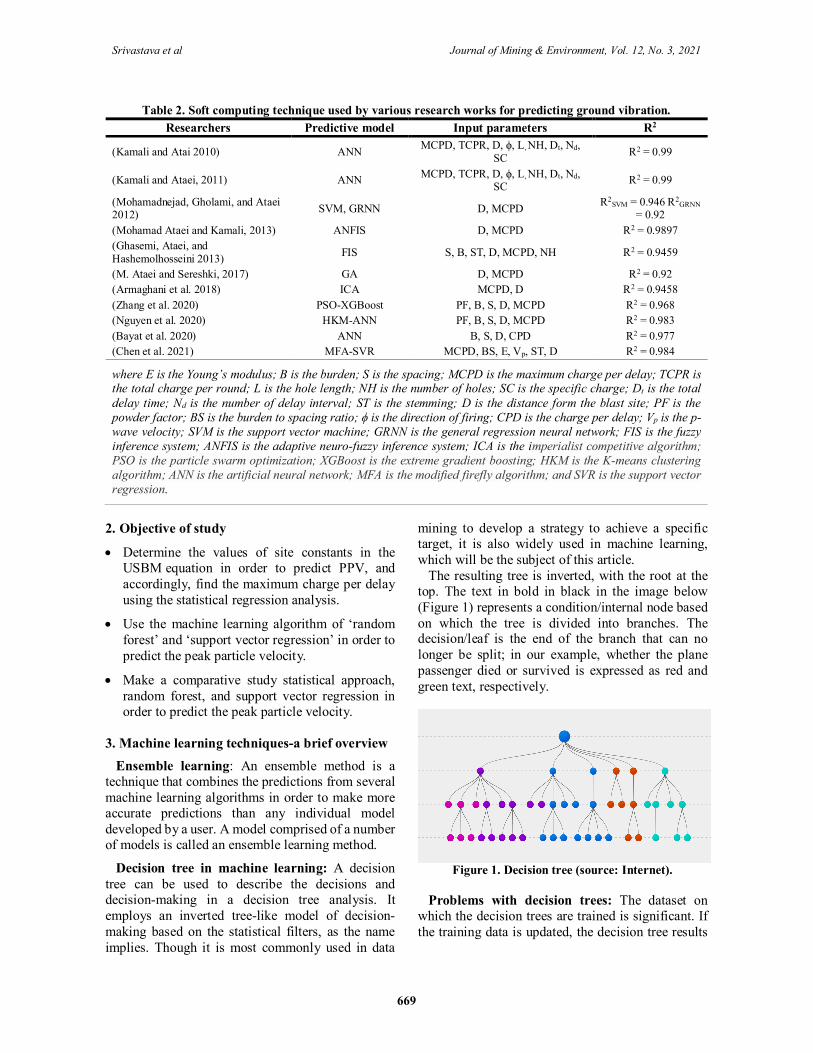
Table 2. Soft computing technique used by various research works for predicting ground vibration. Researchers Predictive model Input parameters R2
(Kamali and Atai 2010) ANN MCPD, TCPR, D, ϕ, L, NH, Dt, Nd, SC R2 = 0.99
(Kamali and Ataei, 2011) ANN MCPD, TCPR, D, ϕ, L, NH, Dt, Nd, SC R2 = 0.99
(Mohamadnejad, Gholami, and Ataei 2012) SVM, GRNN D, MCPD R2
SVM = 0.946 R2GRNN
= 0.92 (Mohamad Ataei and Kamali, 2013) ANFIS D, MCPD R2 = 0.9897 (Ghasemi, Ataei, and Hashemolhosseini 2013) FIS S, B, ST, D, MCPD, NH R2 = 0.9459
(M. Ataei and Sereshki, 2017) GA D, MCPD R2 = 0.92 (Armaghani et al. 2018) ICA MCPD, D R2 = 0.9458 (Zhang et al. 2020) PSO-XGBoost PF, B, S, D, MCPD R2 = 0.968 (Nguyen et al. 2020) HKM-ANN PF, B, S, D, MCPD R2 = 0.983 (Bayat et al. 2020) ANN B, S, D, CPD R2 = 0.977 (Chen et al. 2021) MFA-SVR MCPD, BS, E, Vp, ST, D R2 = 0.984
where E is the Young’s modulus; B is the burden; S is the spacing; MCPD is the maximum charge per delay; TCPR is the total charge per round; L is the hole length; NH is the number of holes; SC is the specific charge; Dt is the total delay time; Nd is the number of delay interval; ST is the stemming; D is the distance form the blast site; PF is the powder factor; BS is the burden to spacing ratio; ϕ is the direction of firing; CPD is the charge per delay; Vp is the p-wave velocity; SVM is the support vector machine; GRNN is the general regression neural network; FIS is the fuzzy inference system; ANFIS is the adaptive neuro-fuzzy inference system; ICA is the imperialist competitive algorithm; PSO is the particle swarm optimization; XGBoost is the extreme gradient boosting; HKM is the K-means clustering algorithm; ANN is the artificial neural network; MFA is the modified firefly algorithm; and SVR is the support vector regression.
2. Objective of study
Determine the values of site constants in the USBM equation in order to predict PPV, and accordingly, find the maximum charge per delay using the statistical regression analysis.
Use the machine learning algorithm of ‘random forest’ and ‘support vector regression’ in order to predict the peak particle velocity.
Make a comparative study statistical approach, random forest, and support vector regression in order to predict the peak particle velocity.
3. Machine learning techniques-a brief overview Ensemble learning: An ensemble method is a
technique that combines the predictions from several machine learning algorithms in order to make more accurate predictions than any individual model developed by a user. A model comprised of a number of models is called an ensemble learning method.
Decision tree in machine learning: A decision tree can be used to describe the decisions and decision-making in a decision tree analysis. It employs an inverted tree-like model of decision-making based on the statistical filters, as the name implies. Though it is most commonly used in data
mining to develop a strategy to achieve a specific target, it is also widely used in machine learning, which will be the subject of this article.
The resulting tree is inverted, with the root at the top. The text in bold in black in the image below (Figure 1) represents a condition/internal node based on which the tree is divided into branches. The decision/leaf is the end of the branch that can no longer be split; in our example, whether the plane passenger died or survived is expressed as red and green text, respectively.
Figure 1. Decision tree (source: Internet).
Problems with decision trees: The dataset on which the decision trees are trained is significant. If the training data is updated, the decision tree results
Srivastava et al Journal of Mining & Environment, Vol. 12, No. 3, 2021
670
will be somewhat different, which will have an equivalent impact on the prediction.
Also since the algorithm cannot be moved back after the split is made, the decision trees are challenging to train, and have a high chance of overfitting the dataset. They also appear to find the local optima.
We use the random forest algorithm to fix these flaws in a decision tree model, which demonstrates the power of integrating several decision trees into a single model for a more accurate prediction.
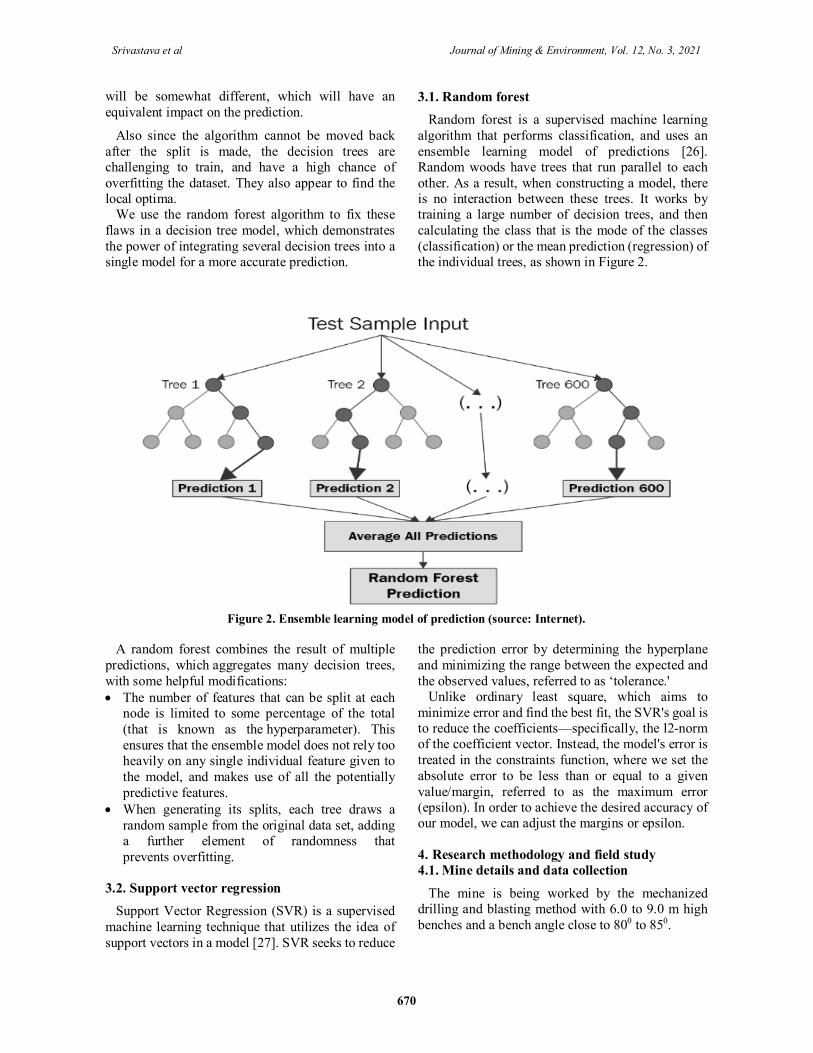
3.1. Random forest Random forest is a supervised machine learning
algorithm that performs classification, and uses an ensemble learning model of predictions [26]. Random woods have trees that run parallel to each other. As a result, when constructing a model, there is no interaction between these trees. It works by training a large number of decision trees, and then calculating the class that is the mode of the classes (classification) or the mean prediction (regression) of the individual trees, as shown in Figure 2.
Figure 2. Ensemble learning model of prediction (source: Internet).
A random forest combines the result of multiple predictions, which aggregates many decision trees, with some helpful modifications: The number of features that can be split at each
node is limited to some percentage of the total (that is known as the hyperparameter). This ensures that the ensemble model does not rely too heavily on any single individual feature given to the model, and makes use of all the potentially predictive features.
When generating its splits, each tree draws a random sample from the original data set, adding a further element of randomness that prevents overfitting.
3.2. Support vector regression Support Vector Regression (SVR) is a supervised
machine learning technique that utilizes the idea of support vectors in a model [27]. SVR seeks to reduce
the prediction error by determining the hyperplane and minimizing the range between the expected and the observed values, referred to as ‘tolerance.'
Unlike ordinary least square, which aims to minimize error and find the best fit, the SVR's goal is to reduce the coefficients—specifically, the l2-norm of the coefficient vector. Instead, the model's error is treated in the constraints function, where we set the absolute error to be less than or equal to a given value/margin, referred to as the maximum error (epsilon). In order to achieve the desired accuracy of our model, we can adjust the margins or epsilon.
4. Research methodology and field study 4.1. Mine details and data collection
The mine is being worked by the mechanized drilling and blasting method with 6.0 to 9.0 m high benches and a bench angle close to 800 to 850.
Srivastava et al Journal of Mining & Environment, Vol. 12, No. 3, 2021
671
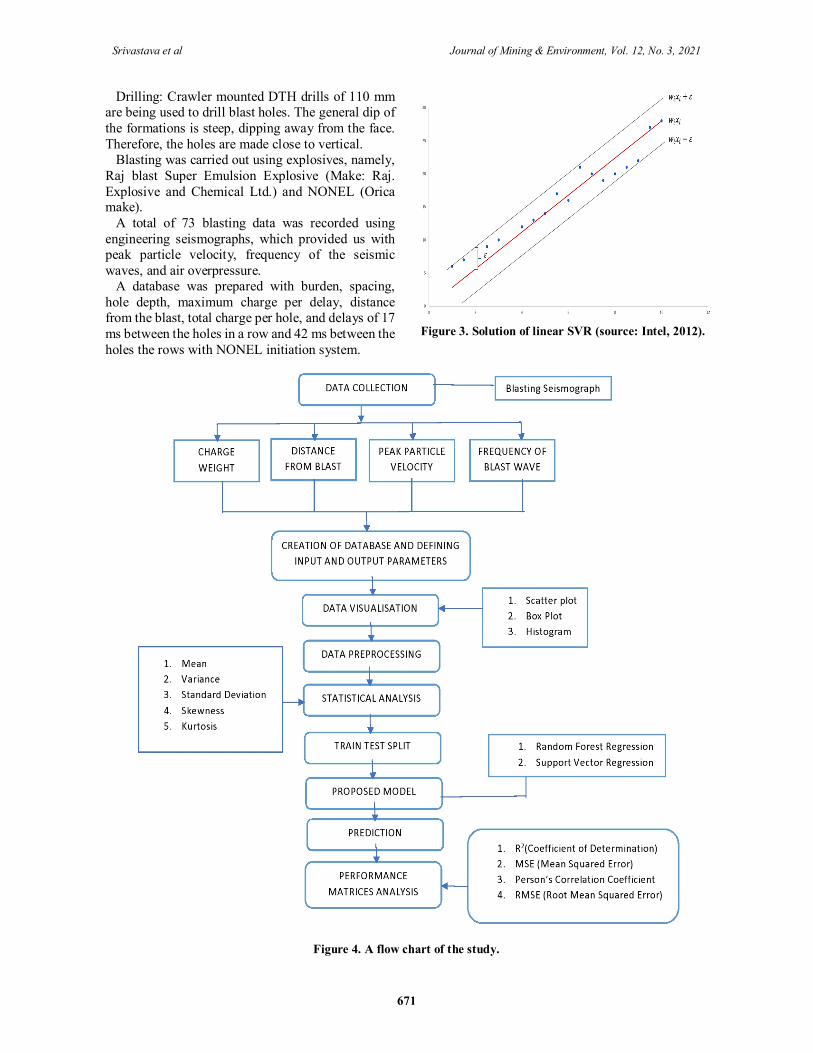
Drilling: Crawler mounted DTH drills of 110 mm are being used to drill blast holes. The general dip of the formations is steep, dipping away from the face. Therefore, the holes are made close to vertical.
Blasting was carried out using explosives, namely, Raj blast Super Emulsion Explosive (Make: Raj. Explosive and Chemical Ltd.) and NONEL (Orica make).
A total of 73 blasting data was recorded using engineering seismographs, which provided us with peak particle velocity, frequency of the seismic waves, and air overpressure.
A database was prepared with burden, spacing, hole depth, maximum charge per delay, distance from the blast, total charge per hole, and delays of 17 ms between the holes in a row and 42 ms between the holes the rows with NONEL initiation system.
Figure 3. Solution of linear SVR (source: Intel, 2012).
Figure 4. A flow chart of the study.
Srivastava et al Journal of Mining & Environment, Vol. 12, No. 3, 2021
672
Table 3. Statistical information of data collected. Sl. No. Variables Minimum Maximum
1. Burden (m) 3.5 3.5 2. Spacing (m) 4.0 4.5 3. Hole depth (m) 7.0 8.5 4. Charge per hole (kg) 26.0 48.3 5. Charge per round (kg) 215 645 6. Stemming length (m) 2.50 3.25 7. Number of blast hole per round 9 20 8. Powder Factor (Te/kg) 3.50 4.25 9. Maximum charge per delay (kg) 28.4 200
10. Distance (m) 50 450 11. PPV (mm/s) 2 59.90
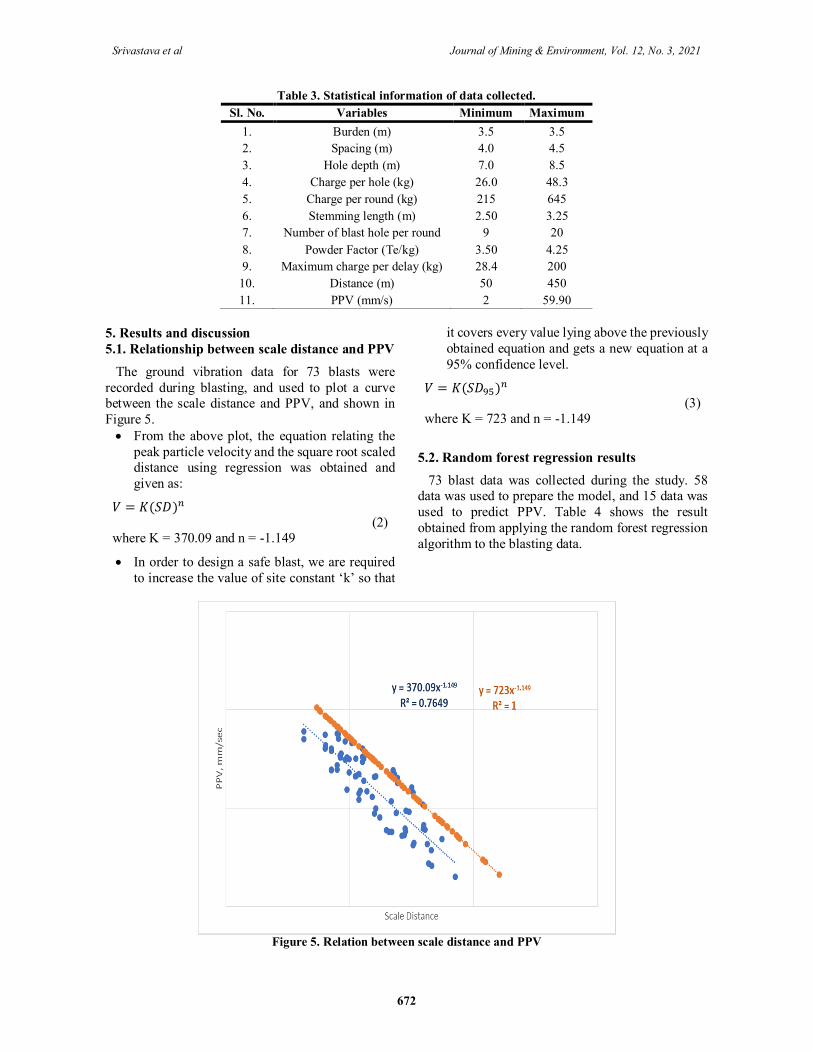
5. Results and discussion 5.1. Relationship between scale distance and PPV
The ground vibration data for 73 blasts were recorded during blasting, and used to plot a curve between the scale distance and PPV, and shown in Figure 5. From the above plot, the equation relating the
peak particle velocity and the square root scaled distance using regression was obtained and given as:
= (ܦ)ܭ(2)
where K = 370.09 and n = -1.149
In order to design a safe blast, we are required to increase the value of site constant ‘k’ so that
it covers every value lying above the previously obtained equation and gets a new equation at a 95% confidence level.
= (ଽହܦ)ܭ(3)
where K = 723 and n = -1.149
5.2. Random forest regression results 73 blast data was collected during the study. 58
data was used to prepare the model, and 15 data was used to predict PPV. Table 4 shows the result obtained from applying the random forest regression algorithm to the blasting data.
Figure 5. Relation between scale distance and PPV
Srivastava et al Journal of Mining & Environment, Vol. 12, No. 3, 2021
673
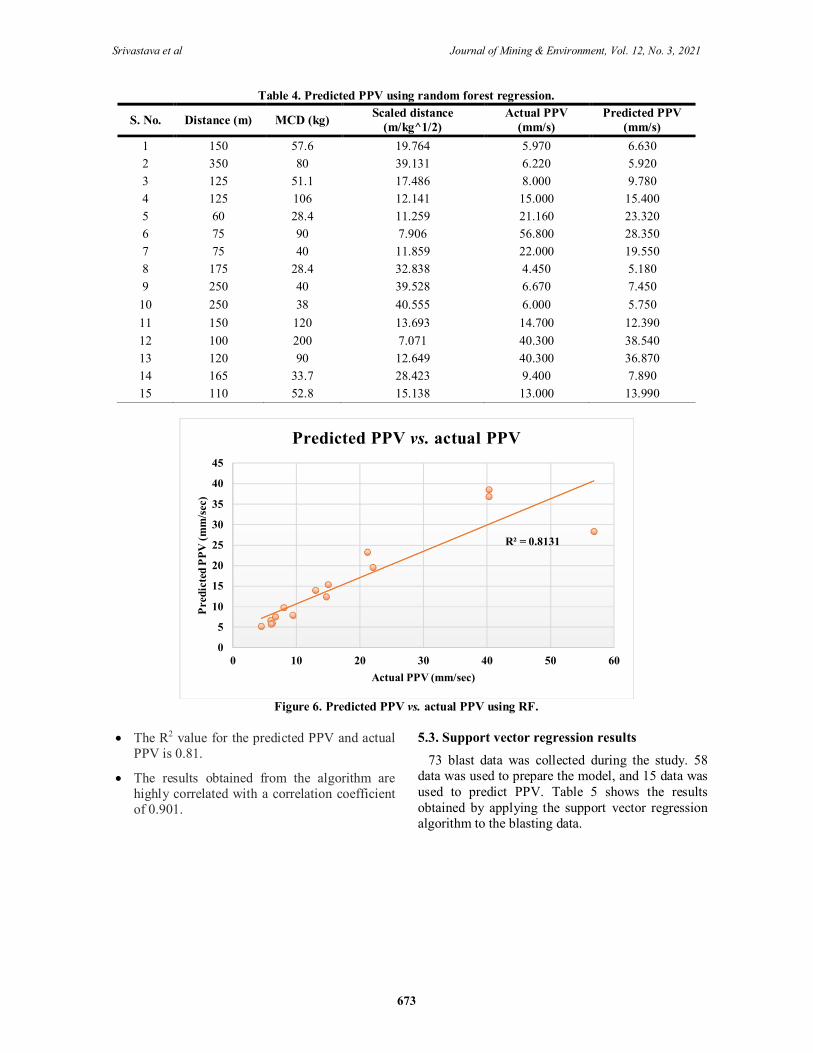
Table 4. Predicted PPV using random forest regression.
S. No. Distance (m) MCD (kg) Scaled distance (m/kg^1/2)
Actual PPV (mm/s)
Predicted PPV (mm/s)
1 150 57.6 19.764 5.970 6.630 2 350 80 39.131 6.220 5.920 3 125 51.1 17.486 8.000 9.780 4 125 106 12.141 15.000 15.400 5 60 28.4 11.259 21.160 23.320 6 75 90 7.906 56.800 28.350 7 75 40 11.859 22.000 19.550 8 175 28.4 32.838 4.450 5.180 9 250 40 39.528 6.670 7.450
10 250 38 40.555 6.000 5.750 11 150 120 13.693 14.700 12.390 12 100 200 7.071 40.300 38.540 13 120 90 12.649 40.300 36.870 14 165 33.7 28.423 9.400 7.890 15 110 52.8 15.138 13.000 13.990
Figure 6. Predicted PPV vs. actual PPV using RF.
The R2 value for the predicted PPV and actual PPV is 0.81.
The results obtained from the algorithm are highly correlated with a correlation coefficient of 0.901.
5.3. Support vector regression results 73 blast data was collected during the study. 58
data was used to prepare the model, and 15 data was used to predict PPV. Table 5 shows the results obtained by applying the support vector regression algorithm to the blasting data.
R² = 0.8131
0
5
10
15
20
25
30
35
40
45
0 10 20 30 40 50 60
Pred
icte
d PP
V (m
m/s
ec)
Actual PPV (mm/sec)
Predicted PPV vs. actual PPV
Srivastava et al Journal of Mining & Environment, Vol. 12, No. 3, 2021
674
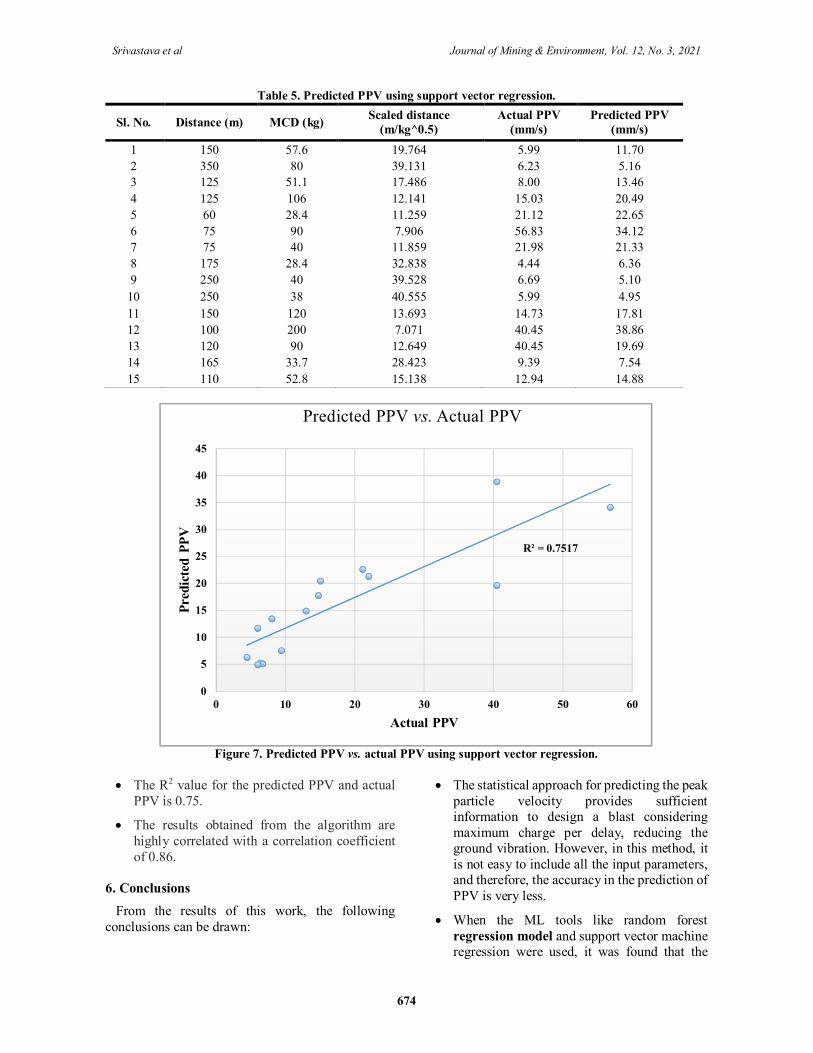
Table 5. Predicted PPV using support vector regression.
Sl. No. Distance (m) MCD (kg) Scaled distance (m/kg^0.5)
Actual PPV (mm/s)
Predicted PPV (mm/s)
1 150 57.6 19.764 5.99 11.70 2 350 80 39.131 6.23 5.16 3 125 51.1 17.486 8.00 13.46 4 125 106 12.141 15.03 20.49 5 60 28.4 11.259 21.12 22.65 6 75 90 7.906 56.83 34.12 7 75 40 11.859 21.98 21.33 8 175 28.4 32.838 4.44 6.36 9 250 40 39.528 6.69 5.10
10 250 38 40.555 5.99 4.95 11 150 120 13.693 14.73 17.81 12 100 200 7.071 40.45 38.86 13 120 90 12.649 40.45 19.69 14 165 33.7 28.423 9.39 7.54 15 110 52.8 15.138 12.94 14.88
Figure 7. Predicted PPV vs. actual PPV using support vector regression.
The R2 value for the predicted PPV and actual PPV is 0.75.
The results obtained from the algorithm are highly correlated with a correlation coefficient of 0.86.
6. Conclusions From the results of this work, the following
conclusions can be drawn:
The statistical approach for predicting the peak particle velocity provides sufficient information to design a blast considering maximum charge per delay, reducing the ground vibration. However, in this method, it is not easy to include all the input parameters, and therefore, the accuracy in the prediction of PPV is very less.
When the ML tools like random forest regression model and support vector machine regression were used, it was found that the
R² = 0.7517
0
5
10
15
20
25
30
35
40
45
0 10 20 30 40 50 60
Pred
icte
d PP
V
Actual PPV
Predicted PPV vs. Actual PPV

Srivastava et al Journal of Mining & Environment, Vol. 12, No. 3, 2021
675
random forest regression model had a better prediction capability than the support vector machine regression.
Funding acknowledgment This research work received no specific grant from
any funding agency in the public, commercial or not-for-profit sectors.
References [1]. Sharma, M., Choudhary, B.S., Kumar, H. and Agrawal, H. (2021). Optimization of Delay Sequencing in Multi-Row Blast using Single Hole Blast Concepts. Journal of The Institution of Engineers (India): Series D, 1-8.
[2]. Agrawal, H. and Mishra, A.K. (2019). Modified scaled distance regression analysis approach for prediction of blast-induced ground vibration in multi-hole blasting. Journal of Rock Mechanics and Geotechnical Engineering. 11 (1): 202-207.
[3]. Sharma, M., Agrawal, H. and Choudhary, B.S. (2021). Multivariate regression and genetic programming for prediction of backbreak in open-pit blasting. Neural Computing and Applications, 1-12.
[4]. Agrawal, H. and Mishra, A.K. (2018). Probabilistic analysis on scattering effect of initiation systems and concept of modified charge per delay for prediction of blast induced ground vibrations. Measurement. 130: 306-317.
[5]. Siskind, D.E. (1980). Structure response and damage produced by ground vibration from surface mine blasting (Vol. 8507). US Department of the Interior, Bureau of Mines.
[6]. Siskind, D.E. (1994). Surface mine blasting near pressurized transmission pipelines.
[7]. Ataei, M. (2010). Evaluation of blast induced ground vibrations from underground excavation at Karoun 3 area. Mining Technology. 119 (1): 7-13.
[8]. Tripathy, G.R., Shirke, R.R. and Kudale, M.D. (2016). Safety of engineered structures against blast vibrations: A case study. Journal of Rock Mechanics and Geotechnical Engineering. 8 (2): 248-255.
[9]. Duvall, W.I. and Fogelson, D.E. (1962). Review of criteria for estimating damage to residences from blasting vibrations (Vol. 5968). US Department of the Interior, Bureau of Mines.
[10]. Sayadi, A., Monjezi, M., Talebi, N. and Khandelwal, M. (2013). A comparative study on the application of various artificial neural networks to simultaneous prediction of rock fragmentation and backbreak. Journal of Rock Mechanics and Geotechnical Engineering. 5 (4): 318-324.
[11]. Saadat, M., Khandelwal, M. and Monjezi, M. (2014).
An ANN-based approach to predict blast-induced ground vibration of Gol-E-Gohar iron ore mine, Iran. Journal of Rock Mechanics and Geotechnical Engineering. 6 (1): 67-76.
[12]. Amnieh, H.B. and Bahadori, M. (2014). Safe vibrations of spilling basin explosions at “Gotvand Olya Dam” using artificial neural network. Archives of Mining Sciences.
[13]. Biswas, A., Sarkar, S. and Gupta, R. (2016). Application of artificial neural network for performance evaluation of vertical axis wind turbine rotor. International Journal of Ambient Energy. 37 (2): 209-218.
[14]. Rao, Y.S. (2012). Prediction of ground vibrations in opencast mine using nonlinear regression analysis. International Journal of Engineering Science and Technology. 4 (9).
[15]. Kamali, M. and Ataei, M. (2010). Prediction of blast induced ground vibrations in Karoun III power plant and dam: a neural network. Journal of the Southern African Institute of Mining and Metallurgy. 110 (8): 481-490.
[16]. Kamali, M. and Ataei, M. (2011). Prediction of blast induced vibrations in the structures of Karoun III power plant and dam. Journal of Vibration and Control. 17 (4): 541-548.
[17]. Mohamadnejad, M., Gholami, R. and Ataei, M. (2012). Comparison of intelligence science techniques and empirical methods for prediction of blasting vibrations. Tunnelling and Underground Space Technology, 28, 238-244.
[18]. Ataei, M. and Kamali, M. (2013). Prediction of blast-induced vibration by adaptive neuro-fuzzy inference system in Karoun 3 power plant and dam. Journal of Vibration and Control. 19 (12): 1906-1914.
[19]. Ghasemi, E., Ataei, M. and Hashemolhosseini, H. (2013). Development of a fuzzy model for predicting ground vibration caused by rock blasting in surface mining. Journal of Vibration and Control. 19 (5): 755-770.
[20]. Ataei, M. and Sereshki, F. (2017). Improved prediction of blast-induced vibrations in limestone mines using Genetic Algorithm. Journal of Mining and Environment. 8 (2): 291-304.
[21]. Armaghani, D. J., Hasanipanah, M., Amnieh, H. B. and Mohamad, E. T. (2018). Feasibility of ICA in approximating ground vibration resulting from mine blasting. Neural Computing and Applications. 29 (9): 457-465.
[22]. Zhang, X., Nguyen, H., Bui, X.N., Tran, Q.H., Nguyen, D.A., Bui, D.T. and Moayedi, H. (2020). Novel soft computing model for predicting blast-induced ground vibration in open-pit mines based on particle swarm optimization and XGBoost. Natural Resources Research. 29 (2): 711-721.
[23]. Nguyen, H., Drebenstedt, C., Bui, X.N. and Bui, D.T. (2020). Prediction of blast-induced ground vibration in an

Srivastava et al Journal of Mining & Environment, Vol. 12, No. 3, 2021
676
open-pit mine by a novel hybrid model based on clustering and artificial neural network. Natural Resources Research. 29 (2): 691-709.
[24]. Bayat, P., Monjezi, M., Rezakhah, M. and Armaghani, D.J. (2020). Artificial neural network and firefly algorithm for estimation and minimization of ground vibration induced by blasting in a mine. Natural Resources Research. 29: 4121-4132.
[25]. Chen, W., Hasanipanah, M., Nikafshan Rad, H., Jahed Armaghani, D. and Tahir, M.M. (2021). A new design of evolutionary hybrid optimization of SVR model
in predicting the blast-induced ground vibration. Engineering with Computers. 37 (2): 1455-1471.
[26]. Breiman, L. (2001). Random Forest, vol. 45. Mach Learn, 1.
[27]. Longjun, D., Xibing, L., Ming, X. and Qiyue, L. (2011). Comparisons of random forest and support vector machine for predicting blasting vibration characteristic parameters. Procedia Engineering. 26: 1772-1781.

1400دوره دوازدهم، شماره سوم، سال ،زیستو محیط پژوهشی معدن -نشریه علمی و همکاران واستاوایریش
از انفجار یناش ،نیارتعاشات زم ینیبشیپ يبرا نیماش يریادگی يهاروش میاناي مقایسهمطالعه
رمال شو موک يچودار نگیر س، بهانوواستاوایرشی تیآنک
، هنددانباد، (ISM)هند يمعدن ، موسسه فناور یگروه مهندس
01/10/2021پذیرش 21/05/2021ارسال
[email protected]* نویسنده مسئول مکاتبات:
چکیده:
حال، نی. با اردیگیمورد استفاده قرار م یاست که عمدتا توسط معادالت تجرب یمیقد اریمع کی من،یانفجار ا کی يبرا )PPV(از انفجار یناش نیارتعاش زم یابیارز یو جنگل تصادف )SVM( نیماش بانیبردار پشت( )ML( نیماش يریادگی ياستفاده از ابزارها ن،ی. بنابرارندیگیرا در نظر م ياطالعات محدود یمعادالت تجرب
(RF) ( يابزارها يکار نظارت و ثبت شده است. برا نیانفجار در ا 73کار اعمال شده است. در مجموع نیامر در ا نیکمک کند، و هم نهیزم نیدر ا تواندیم ML ، RFو SVM يمدل ها ینیب شیشده است. دقت پ میتقس شیآزما واهداف آموزش يبرا 80-20عملکرد مدلها به نسبت تیظرف یابیها به منظور ارزمجموعه داده
81/0 بیبه ترت SVMو RF يبرا )R2( نییتع بیکه ضر دهدیبدست آمده نشان م جیدرصد دقت). نتا 9از شیبخش است (ب تیرضا PPV ریمقاد ینیبشیدر پ .کندیم هیتوص PPV ینیب شیپ يرا برا ML ونیاز مدل رگرس هپژوهش استفاد نیموجود، ا یخط يهاونیرگرس ریبا سا سهیاست. در مقا 75/0و
.بانیبردار پشت ونی، رگرسیجنگل تصادف ونی، رگرسسرعت ذراتحد نهایت ، نی، ارتعاش زمیمعادله تجرب کلمات کلیدي:
Related Documents