James Madison University JMU Scholarly Commons Masters eses e Graduate School Fall 12-18-2010 A comparative social, economic and environmental study of how Malta could best achieve its 2020 “20-20-20” goals Charles G. Sinn James Madison University Follow this and additional works at: hps://commons.lib.jmu.edu/master201019 Part of the Oil, Gas, and Energy Commons is esis is brought to you for free and open access by the e Graduate School at JMU Scholarly Commons. It has been accepted for inclusion in Masters eses by an authorized administrator of JMU Scholarly Commons. For more information, please contact [email protected]. Recommended Citation Sinn, Charles G., "A comparative social, economic and environmental study of how Malta could best achieve its 2020 “20-20-20” goals" (2010). Masters eses. 431. hps://commons.lib.jmu.edu/master201019/431

Welcome message from author
This document is posted to help you gain knowledge. Please leave a comment to let me know what you think about it! Share it to your friends and learn new things together.
Transcript
James Madison UniversityJMU Scholarly Commons
Masters Theses The Graduate School
Fall 12-18-2010
A comparative social, economic and environmentalstudy of how Malta could best achieve its 2020“20-20-20” goalsCharles G. SinnJames Madison University
Follow this and additional works at: https://commons.lib.jmu.edu/master201019Part of the Oil, Gas, and Energy Commons
This Thesis is brought to you for free and open access by the The Graduate School at JMU Scholarly Commons. It has been accepted for inclusion inMasters Theses by an authorized administrator of JMU Scholarly Commons. For more information, please contact [email protected].
Recommended CitationSinn, Charles G., "A comparative social, economic and environmental study of how Malta could best achieve its 2020 “20-20-20” goals"(2010). Masters Theses. 431.https://commons.lib.jmu.edu/master201019/431
A Comparative Social, Economic and Environmental
Study of how Malta could best achieve its 2020
“20-20-20” goals
Charles Gordon Sinn
Master of Science in Sustainable Environmental Resource
Management / Master of Science in Integrated Science &
Technology
University of Malta / James Madison University
October 2010
ii
A Comparative Social, Economic and Environmental
Study of how Malta could best achieve its 2020
“20-20-20” goals
A dissertation presented in partial fulfilment of the requirements for the Degree of
Master of Science in Sustainable Environmental Resource Management/ Master of
Science in Integrated Science & Technology
Charles Gordon Sinn
October 2010
Michael Deaton, Robert Ghirlando, Jonathan Miles
University of Malta – James Madison University
i
ABSTRACT
Charles Gordon Sinn
A Comparative Social, Economic and Environmental Study of how Malta would
best achieve its 2020 “20-20-20” goals
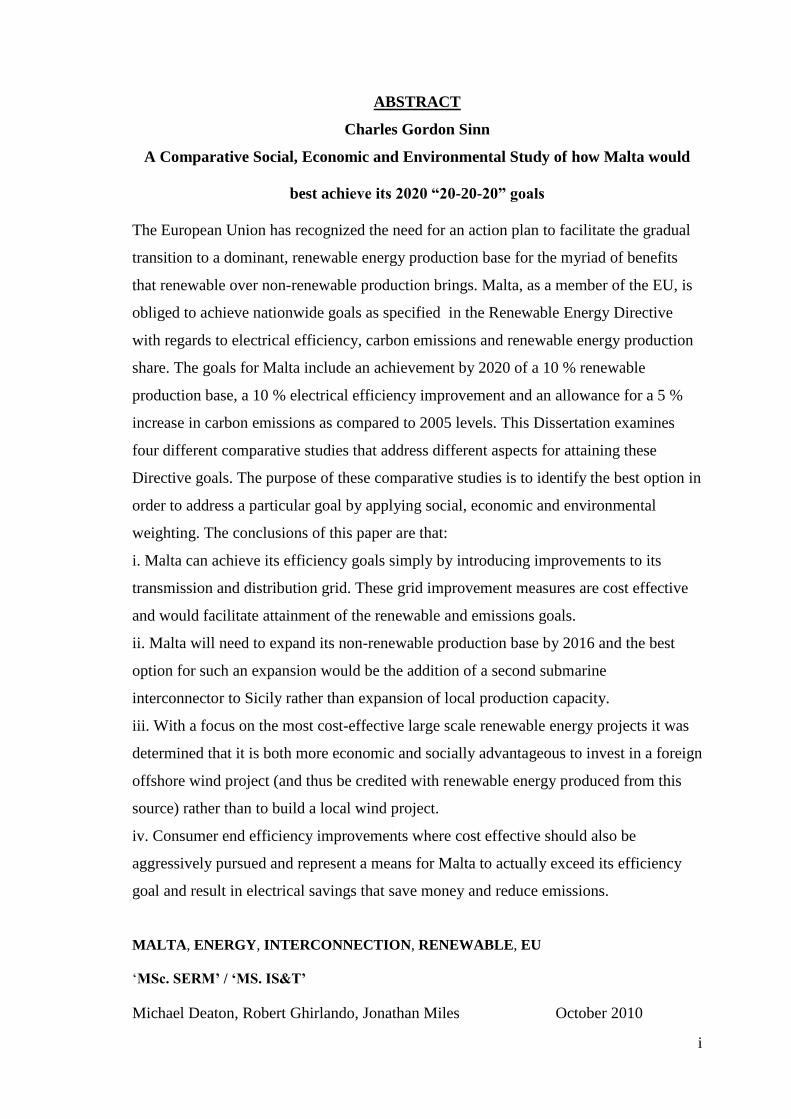
The European Union has recognized the need for an action plan to facilitate the gradual
transition to a dominant, renewable energy production base for the myriad of benefits
that renewable over non-renewable production brings. Malta, as a member of the EU, is
obliged to achieve nationwide goals as specified in the Renewable Energy Directive
with regards to electrical efficiency, carbon emissions and renewable energy production
share. The goals for Malta include an achievement by 2020 of a 10 % renewable
production base, a 10 % electrical efficiency improvement and an allowance for a 5 %
increase in carbon emissions as compared to 2005 levels. This Dissertation examines
four different comparative studies that address different aspects for attaining these
Directive goals. The purpose of these comparative studies is to identify the best option in
order to address a particular goal by applying social, economic and environmental
weighting. The conclusions of this paper are that:
i. Malta can achieve its efficiency goals simply by introducing improvements to its
transmission and distribution grid. These grid improvement measures are cost effective
and would facilitate attainment of the renewable and emissions goals.
ii. Malta will need to expand its non-renewable production base by 2016 and the best
option for such an expansion would be the addition of a second submarine
interconnector to Sicily rather than expansion of local production capacity.
iii. With a focus on the most cost-effective large scale renewable energy projects it was
determined that it is both more economic and socially advantageous to invest in a foreign
offshore wind project (and thus be credited with renewable energy produced from this
source) rather than to build a local wind project.
iv. Consumer end efficiency improvements where cost effective should also be
aggressively pursued and represent a means for Malta to actually exceed its efficiency
goal and result in electrical savings that save money and reduce emissions.
MALTA, ENERGY, INTERCONNECTION, RENEWABLE, EU
„MSc. SERM‟ / „MS. IS&T‟
Michael Deaton, Robert Ghirlando, Jonathan Miles October 2010

ii
Statement of Authenticity
I, Charles Sinn, declare that the work contained herein is
my own
_________________
iii
Dedication
This Dissertation is dedicated to Malta and its people. When I moved to the Island
fifteen years ago the Maltese people welcomed me warmly and I soon felt at home even
though I was a foreigner in a new country. I have lived the most enjoyable years of my
life on this Island and when I first thought what my Dissertation would be about, I
immediately focused on a topic of local significance, one that would have real relevance
for the Island and its people. It is my hope that this dissertation can provide some help
for the Island to achieve its 2020 renewable goals in the most optimal way possible.
This Dissertation was accomplished with the thought of repaying the favor of the
Maltese peoples‟ hospitality.

iv
List of Acknowledgements
I would like to thank Dr. Jonathan J. Miles for inviting me to apply to the SERM course;
without his notice I may not have been aware of the existence of the course. Thanks to
him also for his excellent supervision. A special thanks to Prof. Robert Ghirlando and
Dr. Michael L. Deaton whose continuous help and feedback proved invaluable. I
appreciate the referrals provided by Prof. Ghirlando who gave direction and information
that likely would not have been available without those contacts; also Joe Vasallo at
Enemalta was extremely helpful. All of my supervisors made themselves available even
on weekends and generously shared their expertise.
I am grateful to James Madison University and University of Malta and the very helpful
staff of both institutions. Dr. Miles wore many hats throughout the course and
orchestrated an extremely stimulating and edifying course. His enthusiasm was
contagious.
Also a special thanks to my family and friends who supported me during the entire
course.
v
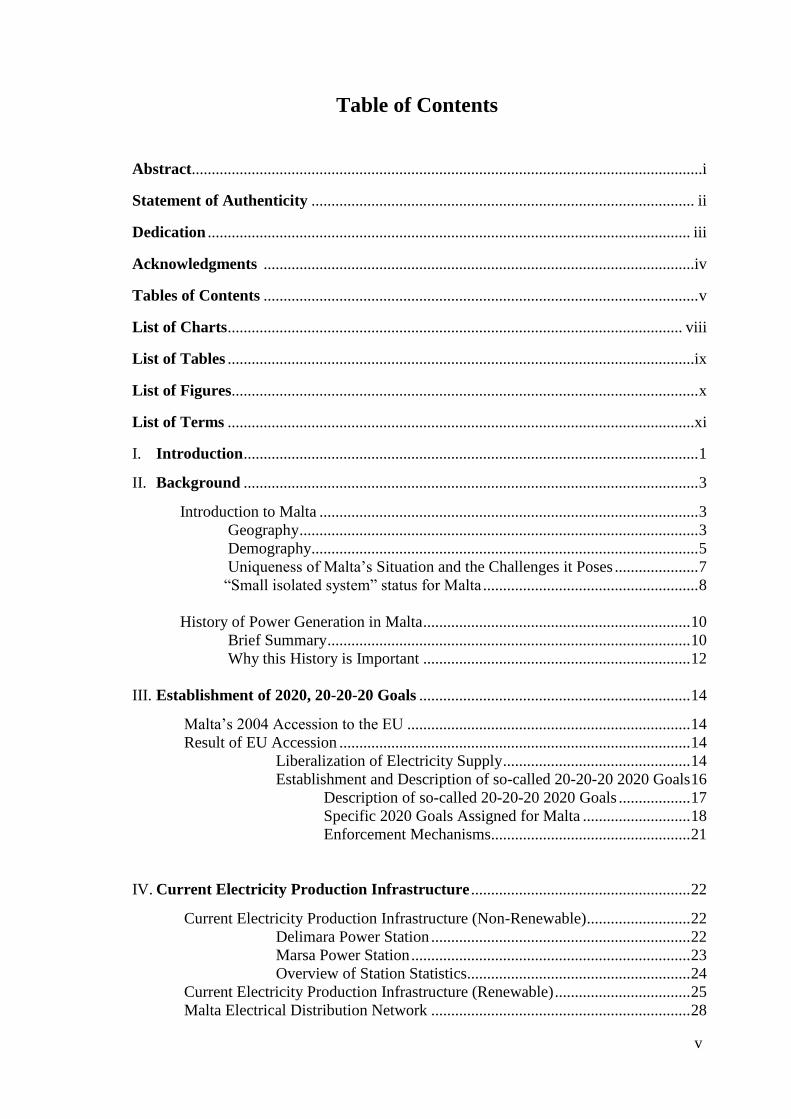
Table of Contents
Abstract................................................................................................................................i
Statement of Authenticity ................................................................................................ ii
Dedication ......................................................................................................................... iii
Acknowledgments ............................................................................................................iv
Tables of Contents ............................................................................................................. v
List of Charts .................................................................................................................. viii
List of Tables .....................................................................................................................ix
List of Figures..................................................................................................................... x
List of Terms .....................................................................................................................xi
I. Introduction .................................................................................................................. 1
II. Background .................................................................................................................. 3
Introduction to Malta ............................................................................................... 3
Geography .................................................................................................... 3
Demography................................................................................................. 5
Uniqueness of Malta‟s Situation and the Challenges it Poses ..................... 7
“Small isolated system” status for Malta ...................................................... 8
History of Power Generation in Malta ................................................................... 10
Brief Summary ........................................................................................... 10
Why this History is Important ................................................................... 12
III. Establishment of 2020, 20-20-20 Goals .................................................................... 14
Malta‟s 2004 Accession to the EU ....................................................................... 14
Result of EU Accession ........................................................................................ 14
Liberalization of Electricity Supply ............................................... 14
Establishment and Description of so-called 20-20-20 2020 Goals 16
Description of so-called 20-20-20 2020 Goals .................. 17
Specific 2020 Goals Assigned for Malta ........................... 18
Enforcement Mechanisms.................................................. 21
IV. Current Electricity Production Infrastructure ....................................................... 22
Current Electricity Production Infrastructure (Non-Renewable) .......................... 22
Delimara Power Station ................................................................. 22
Marsa Power Station ...................................................................... 23
Overview of Station Statistics........................................................ 24
Current Electricity Production Infrastructure (Renewable) .................................. 25
Malta Electrical Distribution Network ................................................................. 28
vi
Malta Energy Breakdown and Projections ........................................................... 31
V. Problems with Current Electricity Production ....................................................... 41
Effective Monopoly of Production ....................................................................... 41
Pseudo Private-Public Corporation ....................................................................... 41
Debt ....................................................................................................................... 42
Losses in Distribution (Technical and Theft) ....................................................... 46
Old Inefficient Power Production Facilities (Marsa) ............................................ 46
Emissions .............................................................................................................. 47
Energy Shortfall (If Marsa is closed in 2012)....................................................... 50
VI. How Should the 2020 Goals be Achieved?............................................................... 55
2020 Scenarios (Analysis of Economic, Environmental and Social consequences)55
Four Comparison Studies Listed in order of Importance to reach 2020 Targets ... 55
1. Power Losses in Electrical Transmission and Distribution Systems ................. 55
Transmission and Distribution Losses in General ..................................... 55
Electric Power Transmission and Distribution Power Losses for Malta ... 59
Electric Power Transmission and Distribution Losses for the EU
Countries .................................................................................................... 60
Technical Transmission and Distribution Power Losses for Malta ........... 63
Non-Technical Transmission and Distribution Power Losses for Malta ... 64
Methods for Dealing with Theft and Fraud ....................................... 66
i. Investigation and Surveillance ................................................... 66
ii. Technical Methods ................................................................... 67
iii. Honesty and Transparency in Governance and Human
Development .................................................................................. 68
Corruption Perceptions Index vs. Transmission and
Distribution Power Losses ................................................. 68
Human Development Index vs. Transmission and
Distribution Power Losses ................................................. 70
iv. Public Relations Programs ....................................................... 73
2. Interconnectors Versus the Addition of Local Production Capacity (Delimara
Extension) .............................................................................................................. 73
i. The Delimara Extension ......................................................................... 74
Planned Expansions to Existing Non-Renewable Production
Infrastructure .................................................................................. 74
Criticism of the Project .................................................................. 75
ii. The Malta-Sicily Interconnection .......................................................... 75
Economic Comparison ............................................................................... 80
Relative Advantages .................................................................................. 86
Expansion of Local Generation ..................................................... 86
Interconnection .............................................................................. 86
Relative Disadvantages .............................................................................. 86
vii
Expansion of Local Generation ..................................................... 86
Interconnection .............................................................................. 86
3. Investment in Renewable Projects in other EU Countries (North Sea) and
being Statistically Transferred with Renewable Energy Generation Versus
Investment in Local Renewable Projects ............................................................... 87
Directive Cooperation Methods ................................................................. 87
Is-Sikka l-Bajda ......................................................................................... 89
Comparison of Power Efficiency of Sikka l-Bajda with Power Efficiency
at Gunfleet Sands, U.K. (A Recently Constructed [2008-2010] North Sea
Offshore Wind Farm)................................................................................. 91
Sikka l-Bajda (projected) vs. Gunfleet Sands, U.K. (actual) ..................... 92
Risk of Construction at Sikka l-Bajda ....................................................... 93
Quantification of Capital Costs (capex) for Installing a Wind Farm at Is-
Sikka l-Bajda.............................................................................................. 94
Economic Comparison ............................................................................... 98
Quantification of Benefit to Local Economy ............................... 102
Imports and Joint Projects with Non-EU Countries ................................ 103
4. Consumer End Efficiency Improvements ........................................................ 104
Measures Taken by End-Users to Increase Energy Efficiency and Thus
Decrease Energy Consumption ................................................................ 105
Domestic Sector ........................................................................... 105
Example of Energy Savings from Industry (Reverse Osmosis
Plants) .......................................................................................... 108
Conservation Voltage Reduction ............................................................. 109
VII. Consequences of Non-Achievement ................................................................. 110
VIII. Conclusions ......................................................................................................... 112
IX. Appendices ........................................................................................................... 116
Appendix A: Case Studies ............................................................................................... 117
Appendix B: Electrical Division Revenue Projections .................................................... 128
Appendix C: Italy: Electricity Price Data ........................................................................ 130
Appendix D: Incidence of Cancer ................................................................................... 132
Appendix E: Wind Farm Statistics .................................................................................. 134
X. References……………………………………………………………………....141
viii
List of Charts
1- Malta projected population for the next three decades- 6
2- Renewable Share Trajectory for Malta showing the renewable share goal for each
interim year leading up to 2020- 20
3- Annual electricity generation by year for the two Maltese power production plants-
24
4- Malta photo voltaic registered installed capacity- 26
5- Mata photo voltaic Installed capacity breakdown by sector- 27
6- Malta total imports of fossil fuels- 31
7- Malta fuel imports by type for 2008- 32
8- Electrical consumption for Malta breakdown by sector in 2008- 33
9- Malta average electricity generated by month for 2008- 33
10- Historical power generated (MWh) in Malta for the period 1990-2006- 34
11- Malta future electricity production projections- 35
12- Forecasting Malta power demand based upon last three years- 37
13- Graphical comparison of energy intensity of Malta‟s economy with the EU average-
40
14- Cumulative year by year loss of Enemalta showing an unsustainable financial trend-
43
15- Enemalta profits as plotted against the price of crude oil- 44
16- Enemalta profits by division- 45
17- Liquid (solvent) value of Enemalta with time- 46
18- N2O emissions in Malta by sector- 50
19- CO2 emissions in Malta by sector- 50
20- Peak load for summer and winter- 52
21- Malta peak load projections forecast to 2020- 53
22- Increase in Billing Rate % vs Power Loss- 57
23- Transmission and Distribution Losses by country- 61
24- TPL% loss Malta at 13.1% and 4.55%- 62
25- Bill % increase due to NTTPL%- 66
26- Corruptions Perceptions Index by country- 69
27- TPL% vs CPI- 70
28- Human Development Index by country- 71
29- TPL% vs HDI- 72
30- August 2010 Italian Energy Breakdown by sector- 78
31- Average Italian electricity prices per annum- 81
32- Forecasting price appreciation factor for electricity prices in Sicily- 82
33- Wind energy potential in the North Sea- 93
34- Best case scenario economic comparison- 100
35- Worst case scenario economic comparison- 100
36- Conservative case scenario economic comparison- 101
37- Conservative case scenario economic comparison factoring in the difference in
electricity pricing for Malta and the UK- 102
38- Malta domestic electricity consumption by appliance- 106
A1- Population by country- 118
A2- Land Area km2 by country- 119
A3- GDP by country- 120
A4- GDP per Capita by country- 121
ix
A5- Electrical Energy Consumption by country- 122
A6- Electric Energy Consumption per capita by country- 123
A7- Public Debt % GDP by country- 124
A8- Current Account Balance by country- 125
A9- Balance of Payments % GDP by country- 126
A10- Fiscal Surplus or Deficit as % GDP by country- 127
B1- Enemalta Electrical Division Turnover projection- 129
C1- Italy electricity price data- 130
C2- Italy electricity price data- 130
C3- Italy electricity price data- 130
C4- Italy electricity price data- 131
E1- Capital cost of onshore and offshore wind- 136
E2- Apex of the curve for cost of installing wind farms- 137
E3- Cost of wind energy for offshore wind farms constructed in 2007- 139
List of Tables
1- Depiction of change of demographics for Malta with time - 7
2- Table of EU Climate Guidelines by Member State - 19
3- Power generating infrastructure currently installed at Delimara - 22
4- Power generating infrastructure currently installed at Marsa - 23
5- Fuel Consumption, Fuel Rates and Station Thermal Efficiency data for all of the
power production infrastructure - 25
6- Historical average electricity generated by month - 34
7- Future electricity production projects, Enemalta - 36
8- Average electricity prices for industry and households 1991 – 2006 - 38
9- Energy intensity of the economy for 1993 – 2004 - 39
10- Comparative emissions of CO2 per unit power (cleanliness of energy) of traditional
power generation for various EU countries - 48
11- Transmission and Distribution Power Losses (TPL) (2000) by Region in Percent -
56
12- Electricity produced (kWh) by destination - 59
13- TPL% for EU countries (2004) - 60
14- The projected, undiscounted cumulative losses - 62
15- Forecasted TTPL for Malta - 63
16- Compilation of Enemalta inspection results - 64
17- Percent increase in billing rate due to losses - 65
18- Corruptions Perceptions Index (CPI) - 68
19- Human Development Index - 71
20- Comparison between Malta-Sicily interconnection and Delimara Extension - 80
21- Results of calculations done for the Delimara Extension to determine the price of
electricity for the unit - 81
22- Economics of Malta-Sicily Interconnection - 83
23- Economics of Delimara Extension with original waste disposal cost estimates - 84
24- Economics of Delimara Extension with revised waste disposal cost estimates - 85
25- Comparison of Sikka l-Bajda Wind Farm and Gunfleet Sands Wind Farm - 92
x
26- Investment cost escalation for offshore wind farms with distance from shore - 96
27- Sikka l-Bajda best case economic scenario - 98
28- Sikka l-Bajda worst case economic scenario - 98
29- Sikka l-Bajda conservative case economic scenario – 99
30- Gunfleet Sands economics - 99
31- Estimates of possible energy savings for Malta - 107
A1- Population (1000‟s) as at Jan. 1, 2008 - 118
A2- Land Area in km2
- 119
A3-Total GDP per annum by Country for 2009 est. in Millions of Purchasing Power
Parity Dollars - 120
A4- GDP per capita per annum - 121
A5- Total Electrical Energy Consumption in Giga Watt hours per annum - 122
A6- Electrical Energy Consumption per capita per annum - 123
A7- Public Debt Percent of GDP for 2009 - 124
A8-Current Account Balance (1,000,000‟s) in exchange rate corrected US dollars, 2009 -
125
A9- Current Account Balance as Percent of GDP - 126
A10- Fiscal Surplus or Deficit as Percent of GDP – 127
B1-Enemalta Electrical Division Turnover Projections – 128
D1- Rates of Cancer: Incidence and Mortality by Region for 2000-03 & 2004-07 - 132
List of Figures
1- Map of Malta with power plants – 4
2- Map of the European Community – 15
3- Malta transmission network – 30
4- Malta SO2 emissions volume as recorded in a 2005 study – 49
5- Proposed submarine route from Sicily to Malta – 76
6- May 2007 map of Italy highlighting price premium in Sicily and Sardinia – 78
7- One of the two dolines (sink holes) at Sikka l-Bajda found during 2010 geophysics
study – 94
D1- EIA Delimara health impact region – 133
E1- European distribution of wind density – 134
E2- European costs of wind generation – 135
E3- Mediterranean wind potential – 136
E4- Location of potential offshore sites in Malta – 138
E5- Photomontage of Sikka l-Bajda from Ghadira Bay – 140
xi
List of Terms
AA Appropriate Assessment
ARMS Automated Revenue Management Services Ltd
Bn
New billing rate Bn for that Utility to receive the same income as before
with a loss
Bo Proper billing rate for a Utility operating with no energy losses
BOE Barrel of Oil Equivalent
BWSC Burmeister & Wain Scandinavian Contractor
capex Capital Expenditure
CFL Compact Fluorescent Lightbulb
CoWE Committee on Wind Energy
CPI Corruptions Perceptions Index
CVR Conservation Voltage Reduction
DHIR Department of Health Information and Research
DOI Department of Information
Ec Self Consumption by Utility
EC European Commission
ECJ European Court of Justice
EEA European Environmental Agency
Eg Energy Produced by the Utility
EIA Environmental Impact Assessment
EIS Environmental Impact Statement
Es Energy Sold to End User Customers
EU European Union
EWEA European Wind Energy Association
HDI Human Development Index
HFO Heavy Fuel Oil
IPPC Integrated Pollution Prevention and Control
MML Mott MacDonald Ltd.
MRA Malta Resource Authority
MRRA Ministry for Resources and Rural Affairs
MS Member States
MTA Malta Tourism Authority
MWh Megawatt Hours
NAO National Audit Office
NAP National Action Plans
NCAR National Centre for Atmospheric Research
NSO National Statistics Office
NTTPL Non-Technical Transmission and Distribution Power Losses
O&M Operating and Maintenance Expense
OPEX Operating Expenditure
PDS Project Description Statement
PSWH Passive Solar Water Heaters
RCA Rural Conservation Area
xii
RE Renewable Energy
RES Renewable Energy Sources
RO Reverse Osmosis
SEP Summary of Economic Projections
SPA Special Protected Area
TPL Transmission and Distribution Power Losses
TTPL Technical Transmission and Distribution Power Losses
WHO World Health Organization
WSC Water Services Corporation
1
I. Introduction
It is often said that the only thing more important for a country than power is water.
However, for Malta which has a deteriorating natural aquifer system and no clean
surface freshwater to speak of, one could say that the two are equally important. Due to
the deteriorating condition of the natural aquifer systems and their impact on water
production (mainly due to unsustainable overexploitation resulting in poor water
quality), production has been increasingly shifted to Reverse Osmosis with Plants
(located at Pembroke, Cirkewwa and Ghar Lapsi) which currently supply more than 60
% of the drinking water on the Maltese Islands. [1] The vulnerability of Malta‟s natural
water system means that any long term blackout could result in an emergency situation
where Malta would have to depend upon foreign imports of water. Additionally,
electricity is the lifeline of modern society; and thus, populations are almost entirely
dependent on it. Therefore any threat to future energy security must be taken very
seriously.
Malta is a country with a number of threats to its future energy security. Enemalta
Corporation essentially holds a monopoly position on electricity production, supply and
distribution due to lack of competition. This trend will continue for the foreseeable
future due to the difficulty of market penetration as well as the government‟s propensity
to subsidize electricity prices (by keeping the price of electricity lower than it costs to
produce resulting in Enemalta losing money) for the sake of popularity. The result is a
corporation that has over three hundred million Euros (as of 2007) in debt to loans [2]
and which continues to lose money at an accelerated rate. [3] As a consequence
Enemalta is unmotivated to be innovative and proactive in its energy policy, especially
in terms of pursuing renewable investments as this would result in the spending of
capital that it simply does not have, or incurring additional debt.
Furthermore, Malta depends almost exclusively upon foreign imports of oil to fuel its
generating facilities as it does not have any known exploitable fossil fuel resources. The
only realistic prospect the country has to reduce its high dependence on foreign imports
to fuel its non-renewable production facilities is to invest in power generation derived
from renewable sources. With Malta‟s 2004 accession to the European Union (EU) and
2
subsequent kick start of its renewable energy interest due to the requirement that 10 %
of electrical energy production be sourced from renewable sources by 2020, the country
now has a genuine interest in increasing its energy security by investing in local
production of renewable energy.
Another prospect that Malta may consider in order to reduce dependence on fuel
imports to is to lay a submarine cable to another country from where it may import
electricity. One could say that this does not solve the problem of a transition to
renewable energy; however, electrical interconnection brings with it a great number of
benefits. For instance, a trans-national cable could be used to import cheaper electricity,
green electricity, and also might be used to stabilize the local energy ring as well as
provide an emergency source for electricity should local production fail.
The purpose of this thesis is to outline how Malta has reached its present power
situation, what the situation is today, why it is not sustainable, the different options
Malta has available to meet its 2020 requirements by the EU for its renewable share,
and how it can proceed toward a more sustainable power generation future.
3
II. Background
Introduction to Malta
Geography
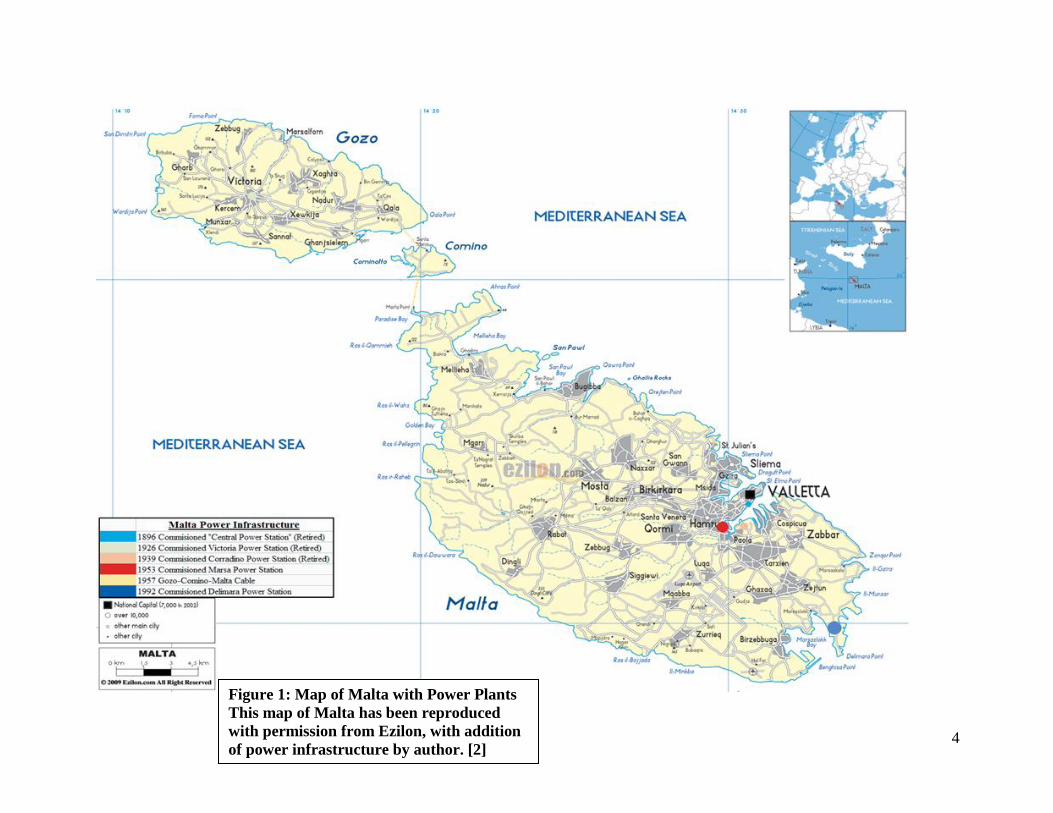
The Republic of Malta is an archipelago nation state and consists of three inhabited
islands (and multiple non-inhabited micro islands) called Malta, Gozo, and Comino.
The land area of Malta is 316 km2
[Appendix A-2]. It is located in the Mediterranean
Sea [refer to Figure 1 for location] and is about 93 km south of Sicily and 288 km east
of Tunisia. The fact that it is located right in the middle of the major (and only) nautical
east-west shipping route through the Mediterranean has meant that the Island has
throughout history possessed political power beyond its size [1]. Its central
Mediterranean location has also resulted in thriving tourism (with over one million
tourists a year) and shipping sectors.
4
Figure 1: Map of Malta with Power Plants
This map of Malta has been reproduced
with permission from Ezilon, with addition
of power infrastructure by author. [2]
5
Demography
As of 31st December 2008 the total population of the country of Malta was 413,609. [3] This
number is based upon extrapolation from census surveys which are carried out on a decennial
timeframe, with the last being in 2005.
The island of Malta is by far the largest and most populated of the Maltese Islands with a total
population of 382,177. Gozo is the second most populated with a total population of 31,432.
Comino is by far the smallest and least populated inhabited island having a negligible farmer
population of around 8. [3]
The combination of land area and total population results in a population density of 1,309
people/km2. This is by far the highest within the European Union. Malta‟s population density
is over ten times the EU Average of 116 people/km2 and three times the next highest, the
Netherlands which has 396.9 people/km2. [4]
6
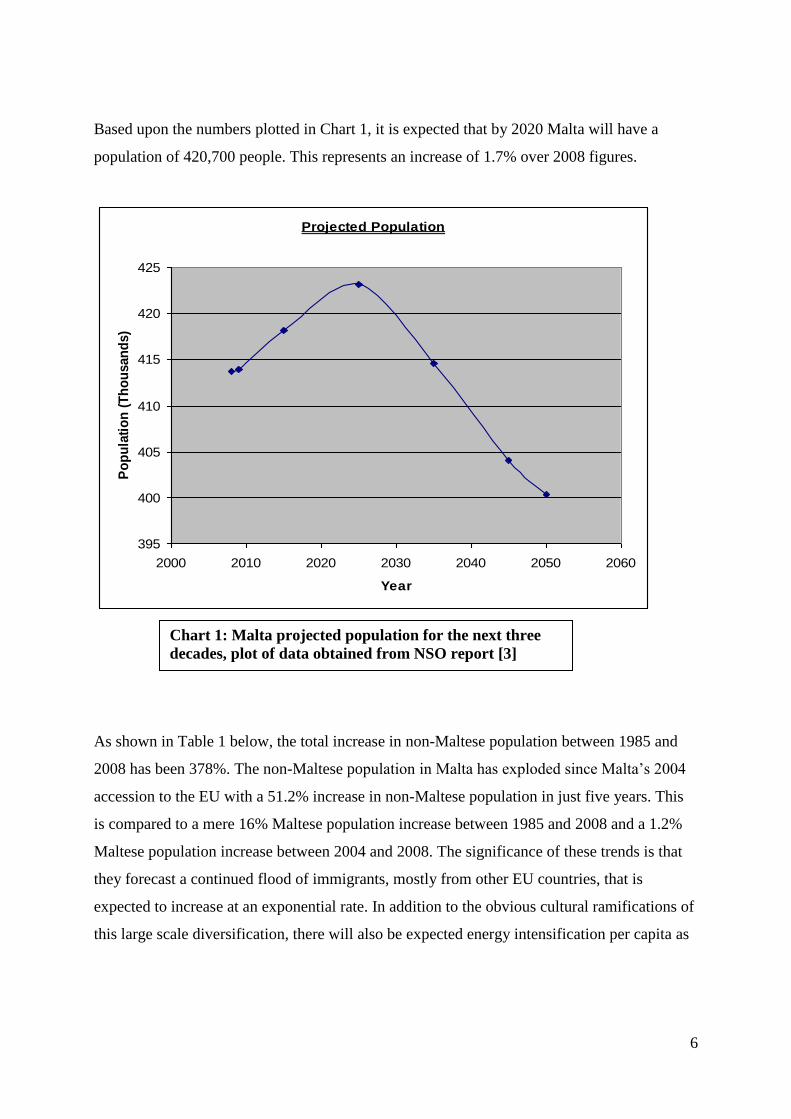
Based upon the numbers plotted in Chart 1, it is expected that by 2020 Malta will have a
population of 420,700 people. This represents an increase of 1.7% over 2008 figures.
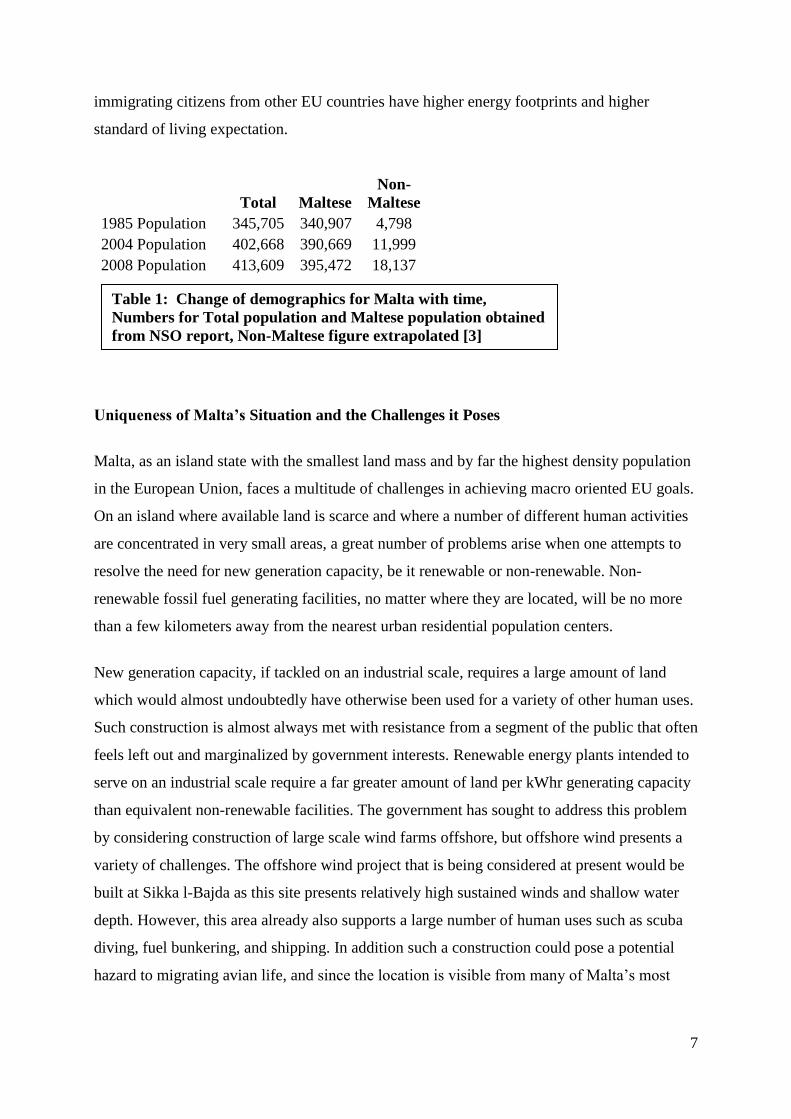
As shown in Table 1 below, the total increase in non-Maltese population between 1985 and
2008 has been 378%. The non-Maltese population in Malta has exploded since Malta‟s 2004
accession to the EU with a 51.2% increase in non-Maltese population in just five years. This
is compared to a mere 16% Maltese population increase between 1985 and 2008 and a 1.2%
Maltese population increase between 2004 and 2008. The significance of these trends is that
they forecast a continued flood of immigrants, mostly from other EU countries, that is
expected to increase at an exponential rate. In addition to the obvious cultural ramifications of
this large scale diversification, there will also be expected energy intensification per capita as
Projected Population
395
400
405
410
415
420
425
2000 2010 2020 2030 2040 2050 2060
Year
Po
pu
lati
on
(T
ho
usan
ds)
Chart 1: Malta projected population for the next three
decades, plot of data obtained from NSO report [3]
7
immigrating citizens from other EU countries have higher energy footprints and higher
standard of living expectation.
Total Maltese
Non-
Maltese
1985 Population 345,705 340,907 4,798
2004 Population 402,668 390,669 11,999
2008 Population 413,609 395,472 18,137
Uniqueness of Malta‟s Situation and the Challenges it Poses
Malta, as an island state with the smallest land mass and by far the highest density population
in the European Union, faces a multitude of challenges in achieving macro oriented EU goals.
On an island where available land is scarce and where a number of different human activities
are concentrated in very small areas, a great number of problems arise when one attempts to
resolve the need for new generation capacity, be it renewable or non-renewable. Non-
renewable fossil fuel generating facilities, no matter where they are located, will be no more
than a few kilometers away from the nearest urban residential population centers.
New generation capacity, if tackled on an industrial scale, requires a large amount of land
which would almost undoubtedly have otherwise been used for a variety of other human uses.
Such construction is almost always met with resistance from a segment of the public that often
feels left out and marginalized by government interests. Renewable energy plants intended to
serve on an industrial scale require a far greater amount of land per kWhr generating capacity
than equivalent non-renewable facilities. The government has sought to address this problem
by considering construction of large scale wind farms offshore, but offshore wind presents a
variety of challenges. The offshore wind project that is being considered at present would be
built at Sikka l-Bajda as this site presents relatively high sustained winds and shallow water
depth. However, this area already also supports a large number of human uses such as scuba
diving, fuel bunkering, and shipping. In addition such a construction could pose a potential
hazard to migrating avian life, and since the location is visible from many of Malta‟s most
Table 1: Change of demographics for Malta with time,
Numbers for Total population and Maltese population obtained
from NSO report, Non-Maltese figure extrapolated [3]
8
popular northern beaches, many consider it a potential disruption to the aesthetic scenery and
fear that tourism could be negatively impacted.
This multitude and variety of conflicting human use interests set in a small area lead to
„spatial misfits‟. The term „spatial misfits‟, as applied to Malta, was used by Eng. Charles
Yousif (Institute for Sustainable Energy, University of Malta) in a study he performed
concerning Malta‟s RE policy implementation process and the resulting conundrum of
applying EU policies to drastically different demographic situations.
An excerpt from the „spatial misfit‟ study:
“Malta is a highly interesting case for such study, since all levels of policy
implementation are very closely knit…and consequently EU influences can
be directly seen”…“insularity and size confine the actor network to a small
group of multiple actors, often connected through friendships and familiar
relationships as well as economical and financial ties. This creates personal and
direct links between and within the governance levels, which are characterized by
antagonism and/or sympathy and often follow unwritten rules.” [5]
“Spatial misfits in a multi-level renewable energy policy implementation process on the Small
Island State of Malta” Kotzebue, Yousif, et al.
In addition to misfits arising from land-use conflicts there also is a high degree of misfits
arising from the different levels of policy making lobbies and the different agendas that they
have regarding renewable energy policy. For example, the Prime Minister can be considered
the highest level policy maker for the Maltese Islands, but his agenda is very macro orientated
as it is influenced by the highest level policy maker, the European Union. In this sense his
agenda can be biased toward macro-scale projects that may be a better fit in another larger EU
country rather than Malta. [6]
“Small isolated system” status of Malta
The original definition of a “small” island came from UNESCO‟s Man and the Biosphere
Programme and is defined as an island with an area less than 10,000 km2 and a population of
less than 500,000. [7] Within the EU this definition of a “small” island as applied to the EU
was confirmed in the Treaty of Amsterdam. Notably, Gozo was confirmed even before
Malta‟s accession to the EU as a member of the Small Islands Commission. [8] With Malta‟s
9
accession to the EU, the Nation itself became a member and received assistance from the EU
Cohesion Fund.
A “small isolated system” is defined by the EU‟s Electricity Liberalization Directive as one
with “consumption less than 2500 GWh in the year 1996, where less than 5% of the annual
consumption is obtained through interconnection with other systems”. [9]
Malta will fit under the definition for a “small” island for the foreseeable future. Demographic
projections predict that Malta‟s population will peak at 424,000 in 2025 and with an area of
316 km2
it will fit well within the definition of a “small” island. The importance of this is that
it will be entitled to special subsidies under the EU Cohesion Fund.
The definition for a “Small isolated system” is more specific; Malta will likely fit under the
electrical “consumption” clause given that even the highest estimates for the next 50 years in
Malta are less than 2500 GWh. However, the definition includes a clause that states that a
“Small isolated system” is one with less than 5% of annual consumption that is obtained
through interconnections with other systems. The installation of the 200 MW Malta-Sicily
cable (as will be discussed in detail in Section VI.2) could put this status in jeopardy since,
even if the cable was used at only one quarter capacity to import electricity from Sicily then
Malta would be obtaining more than 5% of its total electricity from an interconnection.
The EU itself has recognized the fact that small islands require special treatment due to their
unique socio-economic situations. Small islands suffer from the fact that they tend to have
small inefficient markets, limited local resources, require large amounts of imports that are
expensive (due to costly transport links), have higher living costs and a sensitive natural
environment.
„Economies of scale‟ is a major factor in determining the economics behind power
production. As a consequence of their status, small island states will have much lower
economies of scale and will produce electricity at a higher cost per kilowatt hour.
Technological improvements have reduced the impact of economies of scale with regard to
construction of generating facilities; however, it is still a driver in determining factors such as
fuel source. This fact rules out many other fuel alternatives for small isolated island states
10
such as natural gas and other fuels that are difficult to transport and which require a built up
infrastructure with unique and large economies of scale just for the transportation. [10]
EU directives and regulations are not always applicable in an island context and must be
tailored in order to cater to the unique factors under which member island states exist. The EU
has recognized this and has allocated additional funds to which islands are entitled in order to
subsidize works deemed appropriate by the European Commission (EC). [11]
History of Power Generation in Malta (Refer to Figure 1 for locations of
plants)
Brief Summary
Malta‟s early history of power generation was dictated by British policies and agendas when it
existed under the direct rule of the British Empire until 21st September 1964.
In 1882 the first public use of electrical appliances occurred in the Maltese Islands. Electric
lighting was first introduced during an opera at the Royal Opera House and later that year
Piazza San Giorgio in Valletta was lit up by electric lighting. In 1890 plans were made for a
wide-scale installation of electric lighting on the Maltese Islands along with the installation of
generating capacity to supply the electricity. [12]
In 1894 the public electricity service was formed. Between 1894 and 1896 “The Central
Power Station” as it was known at the time was constructed at the limits of Floriana. The
system consisted of four individual steam units which had a combined generating capacity of
350kW. The following three decades saw a continued expansion of the electrical grid to meet
demand (mostly from street lighting) and an expansion of the main power station.
In 1925 the first generating capacity on the island of Gozo was installed to power street
lighting. This generating capacity was expanded over the years to reach a total of 380 kW by
1953, enough capacity to allow for the provision of electricity to rural villages. [12]
11
In 1935 proposals for a larger generating plant were brought up due to the need for increased
generating capacity to meet demand. These proposals included the reiteration of an earlier
1920 recommendation for the conversion of the single-phase hundred cycle distribution
network to a three-phase fifty cycle operation system which would be a costly investment but
which would result in a much more efficient transmission grid. These plans were interrupted
by the outbreak of war in Europe (1939-1945) and the subsequent devastation to the
infrastructure of the Maltese Islands by relentless Axis bombing which was especially fierce
during 1941-1943. In 1949 Malta received economic reparations under the Marshall Aid
Scheme to finance the construction of a new power station and equipment to replace the
outdated one in Floriana. [12]
With the post-war grant funds, a new power station was constructed and inaugurated in 1953
in the excavated galleries at the base of Jesuit Hill, Marsa. This original underground
installation is known as Marsa “A”. The total installed capacity of this new station was 15
MW. [12] A feasibility study was commissioned by the government in 1954 to resolve the
issue of supplying electricity to remote villages. The report included recommendations that it
was more economical to supply Gozo from the power station in Malta. In 1957 there was a
large scale extension to the electrical grid including the construction of two submarine cables
from Marfa to Comino and from Comino to Gozo. In 1959 the power station in Gozo was
permanently shut down and the island entered into a dependence on the main island of Malta
for electricity. [12]
A further result of this study was the grid-wide conversion from single-phase hundred cycle to
a three-phase fifty cycle. The conversion project lasted 3 years between 1954 and 1957 and
included the laying of 11kV three-phase cables and the constructions of substations to connect
the lines to the 415/240V rated mains. [12]
In 1965 a 5.7 MW gas turbo alternator was installed at the power station in Marsa. This
additional installation essentially filled the underground tunnel which housed the first power
station at Marsa and so it was decided to construct a new power station on the grounds over it.
This new power station is now known as Marsa “B” power station. With the construction of
12
the new power station, the stations at Floriana and Corradino became defunct and were
decommissioned in 1960 and 1992 respectively. [12]
In 1966 the new power station, which is better known as the Marsa “B” Power Station, was
inaugurated. The new power station was constructed with two 12.5 MW turbo alternator units.
The Marsa “B” Power Station was further expanded over the years (1966-1990) until its total
generating capacity ultimately reached 267 MW. [12] In 1992 the Delimara Power Station
was commissioned. Its original construction included two 60 MW conventional steam units.
Delimara has been further expanded over the years to reach a total capacity of 304 MW. [13]
Why this History is Important
A glimpse into Malta‟s history of power generation reveals that all of the past production
facilities were constructed (except for Marsa “B” and Delimara) and most of the transmission
infrastructure was built while Malta was under the direct rule of the British Empire. Malta‟s
energy policies were very much guided by British interests and much of the technology and
expertise during this period was imported. However, Malta managed to proceed successfully
without much incident on its own after a difficult and dramatic transition period that occurred
after its Independence in 1964.
The Industrial Revolution saw Malta, along with the rest of Europe, develop a dependence on
high density fuel sources to power the new marvelously productive machinery that brought
about a period of unprecedented growth and development. During the period between the late
1800s and early 1900s environmental considerations were barely a factor in determining
energy policy. There were a number of reasons for this including, the lack of understanding of
the implications of fossil fuel burning, cheap fossil fuels, and a lack of economical (as
compared to non-renewable) renewable technology. Hydroelectric technology was the one
economical renewable technology at the time, which in appropriate locations can be applied in
an extremely efficient and cost effective way. Malta has no free-flowing rivers and so could
not apply this technology while, technologies such as solar and wind had not yet been
developed to function on an economical and commercial level. A glimpse into history shows
13
us how Malta reached the almost total dependence on non-renewable power generation and
thus foreign imports of fossil fuels that it has. [14]
The situation today is very different from what it was decades ago: Renewable technologies
such as wind and solar have become economically feasible (especially when environmental
damage due to fossil fuel burning is factored in), and the technologies exist for their
implementation on industrial commercial scale.
14
III. Establishment of 2020, 20-20-20 Goals
Malta‟s 2004 Accession to the EU
On May 1, 2004 Malta along with nine other countries officially joined the European Union,
representing the most significant transition for Malta since secession from British rule in
1964. As a member of the Union it is obliged to meet macro goals and directives as set by the
EU but it is free to implement the changes in order to meet the objectives as it sees fit at a
national level. [1]
Result of EU Accession
Liberalization of Electricity Supply
In 2001 the Malta Resources Authority (MRA) was established and with its creation, the
regulatory powers that Enemalta had over the electricity and fuel sectors were removed.
Instead, under the MRA Act, Enemalta was left to perform its services (generation and
distribution of electricity and importation and distribution of fuels) on a licensee basis. [7]
With Malta‟s accession to the European Union and in accordance with the EU Electricity
Directive, Enemalta would no longer hold the legal monopoly powers it had traditionally held
over electricity generation, thus opening up the possibility of market penetration and
competition. However, subsequent developments have shown this scenario still to be unlikely.
In theory the liberalization allows consumers the choice between different suppliers but with
no competition there is still no choice. To date the fuel market has still not been liberalized.
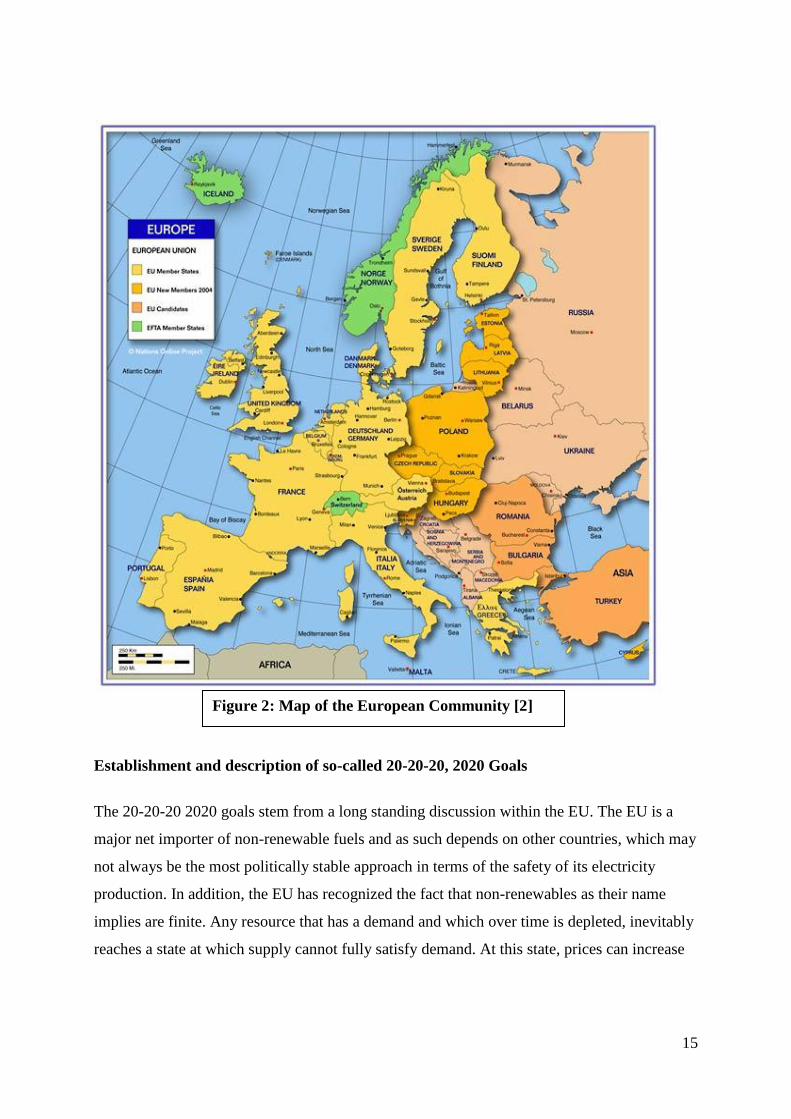
Figure 2 on the opposite page displays the European Union as it stood in 2004. The original
EU-15 Member States (MS) was expanded to 25 nations in the 2004 enlargement to make up
what is known as the EU-25. Of the candidate states shown on this map Romania and
Bulgaria joined in 2007, thus creating the EU-27 of today:
15
Establishment and description of so-called 20-20-20, 2020 Goals
The 20-20-20 2020 goals stem from a long standing discussion within the EU. The EU is a
major net importer of non-renewable fuels and as such depends on other countries, which may
not always be the most politically stable approach in terms of the safety of its electricity
production. In addition, the EU has recognized the fact that non-renewables as their name
implies are finite. Any resource that has a demand and which over time is depleted, inevitably
reaches a state at which supply cannot fully satisfy demand. At this state, prices can increase
Figure 2: Map of the European Community [2]
16
dramatically as consumers (and producers) try to outbid one another for desperately needed
fuel sources.
Non renewable sources of energy are finite and will eventually deplete; the resulting depletion
will lead to escalating prices for such energy as the non renewable sources become less
available. No clear estimate of when exactly the last drop of oil, lump of coal, gallon of
natural gas will take place; however, predictions vary from as early as 50 years from now to
300 years [8]. Given the finite nature of non renewable energy it is important to make the
transition to renewable electrical production as soon as possible. If a last-minute approach is
adopted, such a sudden transition would put immense strains on the economies of the future as
consumption from other industries may have to be sacrificed as the development of renewable
facilities occurs. The construction and eventual decommissioning of renewable energy
infrastructure is very energy intensive. Therefore, the ideal situation is one in which
renewable infrastructure is already established so that it can provide a source for the energy
needed to produce future renewable energy.
Apart from the economic strain that would occur from a delayed transition, the earlier the
transition toward an energy mix that blends greater amounts of renewable energy, the less
severe its impact on the environment will be since the scientific community has recognized
the fact that recent global-climate change has been caused mostly by human activities
(specifically emissions). [9]
The original proposal for a binding target on renewable energy in the EU was the Renewable
Energy Directive that was put forward in January 2008. After nearly one year of debating and
addition of amendments to the original proposal, Member States agreed upon the 2009 EU
Renewable Energy Directive which put into force mandatory targets for renewable shares for
each of the Member States. The overall target of the directive is for the EU as a whole to
reach a total 20 % renewable energy share by the target year of 2020. Because of different
conditions for each of the Member States (such as installed renewable base, economic status
and renewable potential) each Member State was assigned its own legally binding target
which, when averaged collectively, reaches 20%. [1]
17
Part of the directive is the inclusion of an indicative trajectory which outlines non-binding
goals that Member States should achieve in the years leading up to 2020. By 2012 states
should be 20 % of the way towards the target, 30% by 2014; 45 % by 2016; 65 % by 2018;
100 % by 2020. These targets refer to overall energy consumption, including the transport
sector. It is expected that renewable sources will provide 35 % of power within the EU for
electricity generation with wind being the largest contributor, accounting for more than a third
of total renewable production. [3]
Description of so-called 20-20-20, 2020 Goals
The “20-20-20” 2020 goal as outlined in Directive 2009/28/EC of the European Parliament is
a three pronged action plan that seeks to tackle the problems of global warming, energy
security, and fossil fuel dependence by increasing renewable share, decreasing greenhouse gas
emissions, and improving energy efficiency. With this plan, the EU seeks to achieve a total
energy production from renewable sources of 20 %, carbon emission reduction of 20 %
(compared to 1990 levels), and reduction in consumption of primary energy by 20 %
(compared with projected business-as-usual levels) by 2020.
Energy share falls into two categories: Transport Energy and Electrical Energy. The EU seeks
to achieve a 10 % biofuel share in the transport energy mix by 2020 meaning that the
renewable energy goals for electrical energy production are on average actually significantly
higher than 20 %. [4]
Specific 2020 Goals Assigned for Malta
When developing the Union wide 20-20-20 goals, the European Union recognized the fact
that different Member States had very different starting conditions. Some Member States
(such as Sweden) already had a 20% renewable share while other Member States (such as
Malta) had less than a 1% renewable share. Also, different member states have different
strengths of economies and capacity to absorb the interim financial challenges that occurs
during a transition. In recognition of this fact, the EU assigned different goals for each of its
member states which accounted for these factors.
18
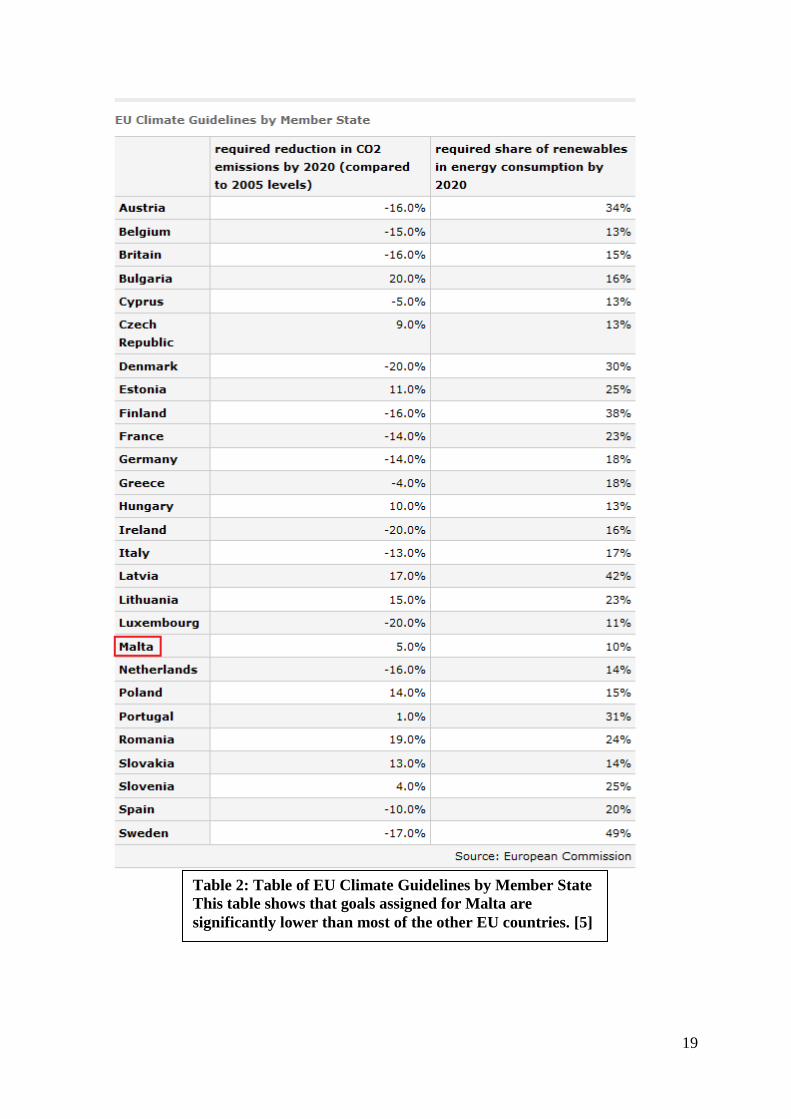
Malta was assigned the lowest required share of renewable energy consumption by 2020 of
10%. The government of Malta has stated that it intends to achieve a 10% target of renewable
energy in the transport sector through a mix of biofuel and electric vehicle initiatives. This
leaves the Maltese electricity sector with a goal of 10% renewable energy production by 2020.
Malta was also assigned one of the lower goals concerning reduction of its CO2 emissions. In
fact, the goal allows for an increase in CO2 emissions by 2020 of 5% over what they were in
2005. Emissions of CO2 in 2005 were 2600 Gg (Giga grams). This suggests that Malta must
have CO2 emissions of less than 2730 Gg in 2020 to meet its goal.
The EU Directive 2006/32/EC which came into effect in 2008 gave Malta an obligation to
increase its energy efficiency by 1% per year.
19
Table 2: Table of EU Climate Guidelines by Member State
This table shows that goals assigned for Malta are
significantly lower than most of the other EU countries. [5]
20
Article 4 of the Directive 2009/28/EC on Renewable Energy outlines the requirement that
Member States submit a National Action Plan (NAP) on a biannual basis in which the
Member State outlines how it intends to reach its national targets. The plan is to include
breakdowns of sector projections, efficiency projections and the detailing of plans to meet
these goals. The European Commission may find that a NAP is inadequate. If this is the case
then it has the right to consider infringement proceedings against the particular Member State.
Any significant shortfalls over a two year period during interim trajectory requires that the
Member State must submit an amended NAP stating how it will make up the shortfall.
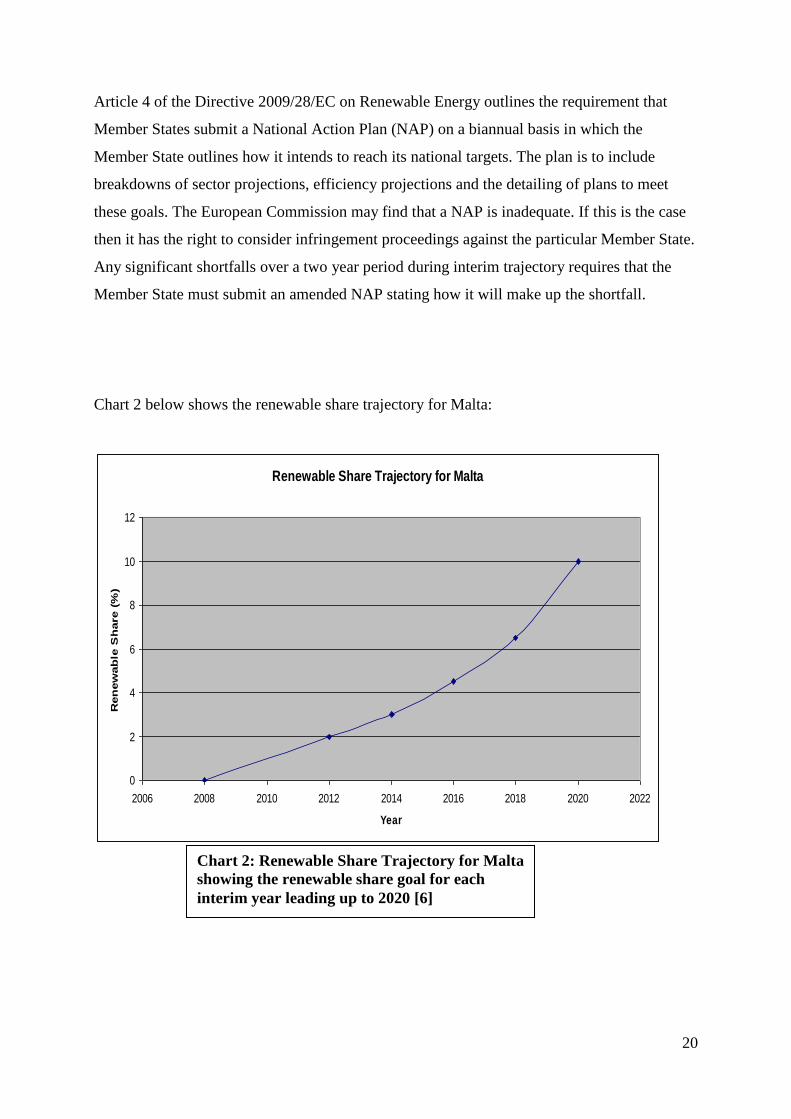
Chart 2 below shows the renewable share trajectory for Malta:
Renewable Share Trajectory for Malta
0
2
4
6
8
10
12
2006 2008 2010 2012 2014 2016 2018 2020 2022
Year
Ren
ew
ab
le S
hare (
%)
Chart 2: Renewable Share Trajectory for Malta
showing the renewable share goal for each
interim year leading up to 2020 [6]

21
Enforcement Mechanisms:
The Directive specifies that EU Member States have a legal obligation to ensure that 2020
targets are met. The European Commission can initiate infringement proceedings if a Member
State does not enact so-called “appropriate measures” in reaching its interim trajectory. The
results of such infringement proceedings include the need for an issuance of a new national
action plan to address the previous plan‟s shortcomings and if this new plan is still found as
not being satisfactory then fines and other penalties can be enacted.
22
IV. Current Electricity Production Infrastructure
Non-Renewable
The islands of Gozo and Comino have no permanent generating capacity of their own and are
interconnected by a single electricity grid to Malta. The main island of Malta is home to the
two major fossil-fuel power production facilities located at Marsa and Delimara which have a
total combined nominal installed capacity of 571 MW.
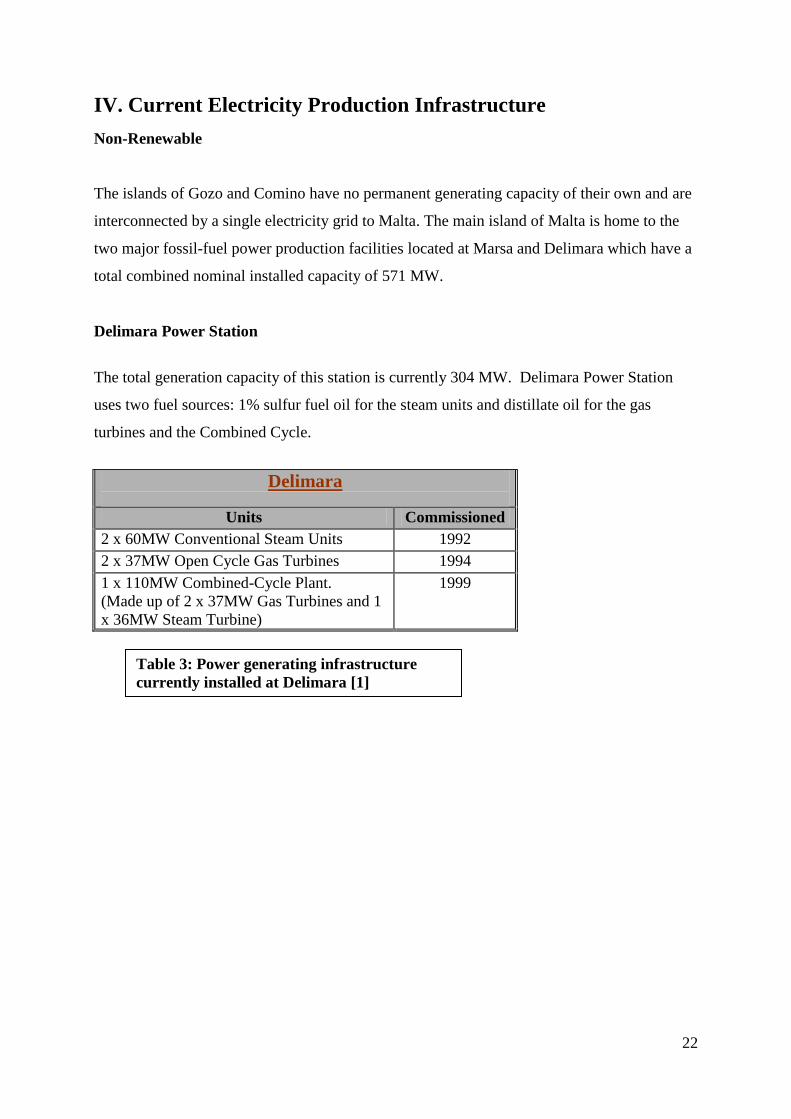
Delimara Power Station
The total generation capacity of this station is currently 304 MW. Delimara Power Station
uses two fuel sources: 1% sulfur fuel oil for the steam units and distillate oil for the gas
turbines and the Combined Cycle.
Delimara
Units Commissioned
2 x 60MW Conventional Steam Units 1992
2 x 37MW Open Cycle Gas Turbines 1994
1 x 110MW Combined-Cycle Plant.
(Made up of 2 x 37MW Gas Turbines and 1
x 36MW Steam Turbine)
1999
Table 3: Power generating infrastructure
currently installed at Delimara [1]
23
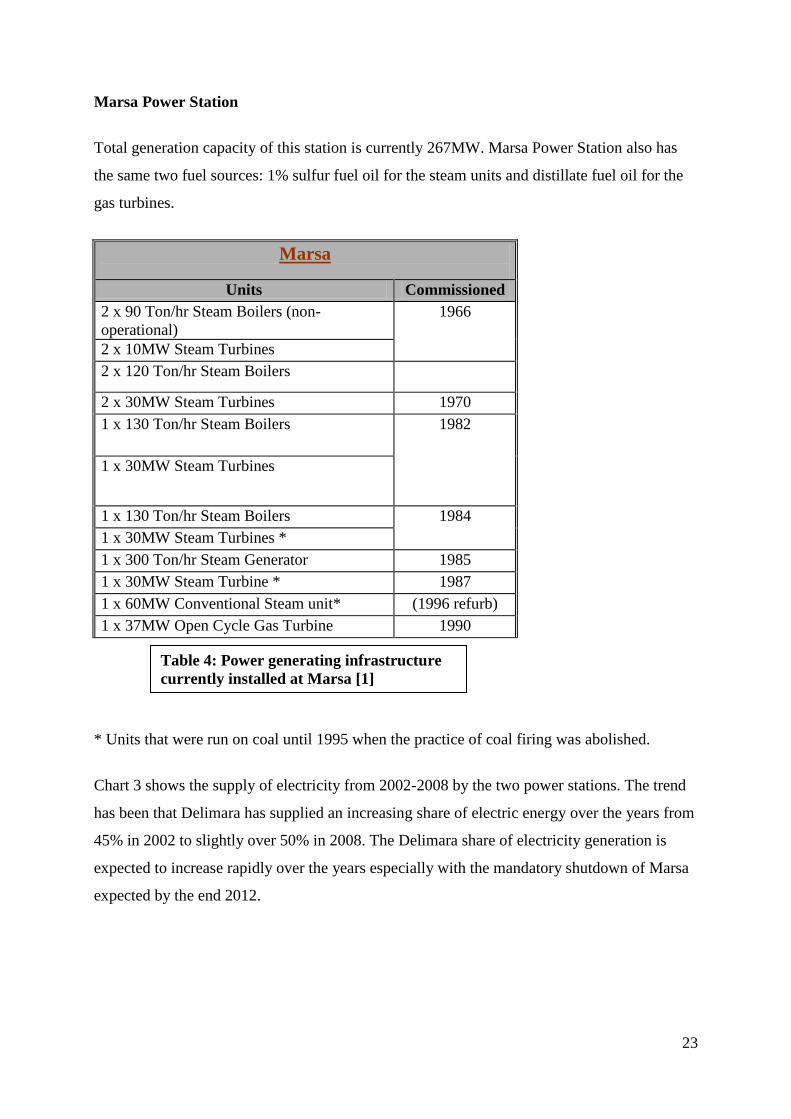
Marsa Power Station
Total generation capacity of this station is currently 267MW. Marsa Power Station also has
the same two fuel sources: 1% sulfur fuel oil for the steam units and distillate fuel oil for the
gas turbines.
Marsa
Units Commissioned
2 x 90 Ton/hr Steam Boilers (non-
operational)
1966
2 x 10MW Steam Turbines
2 x 120 Ton/hr Steam Boilers
2 x 30MW Steam Turbines 1970
1 x 130 Ton/hr Steam Boilers 1982
1 x 30MW Steam Turbines
1 x 130 Ton/hr Steam Boilers 1984
1 x 30MW Steam Turbines *
1 x 300 Ton/hr Steam Generator 1985
1 x 30MW Steam Turbine * 1987
1 x 60MW Conventional Steam unit* (1996 refurb)
1 x 37MW Open Cycle Gas Turbine 1990
* Units that were run on coal until 1995 when the practice of coal firing was abolished.
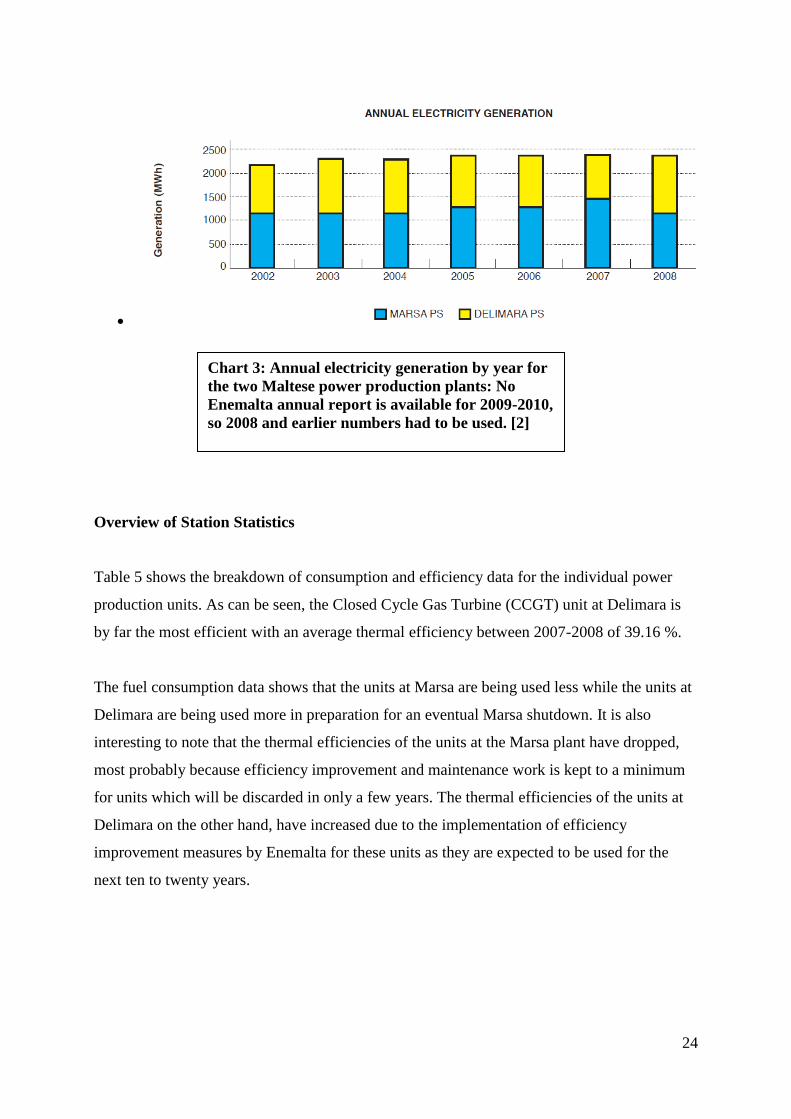
Chart 3 shows the supply of electricity from 2002-2008 by the two power stations. The trend
has been that Delimara has supplied an increasing share of electric energy over the years from
45% in 2002 to slightly over 50% in 2008. The Delimara share of electricity generation is
expected to increase rapidly over the years especially with the mandatory shutdown of Marsa
expected by the end 2012.
Table 4: Power generating infrastructure
currently installed at Marsa [1]
24
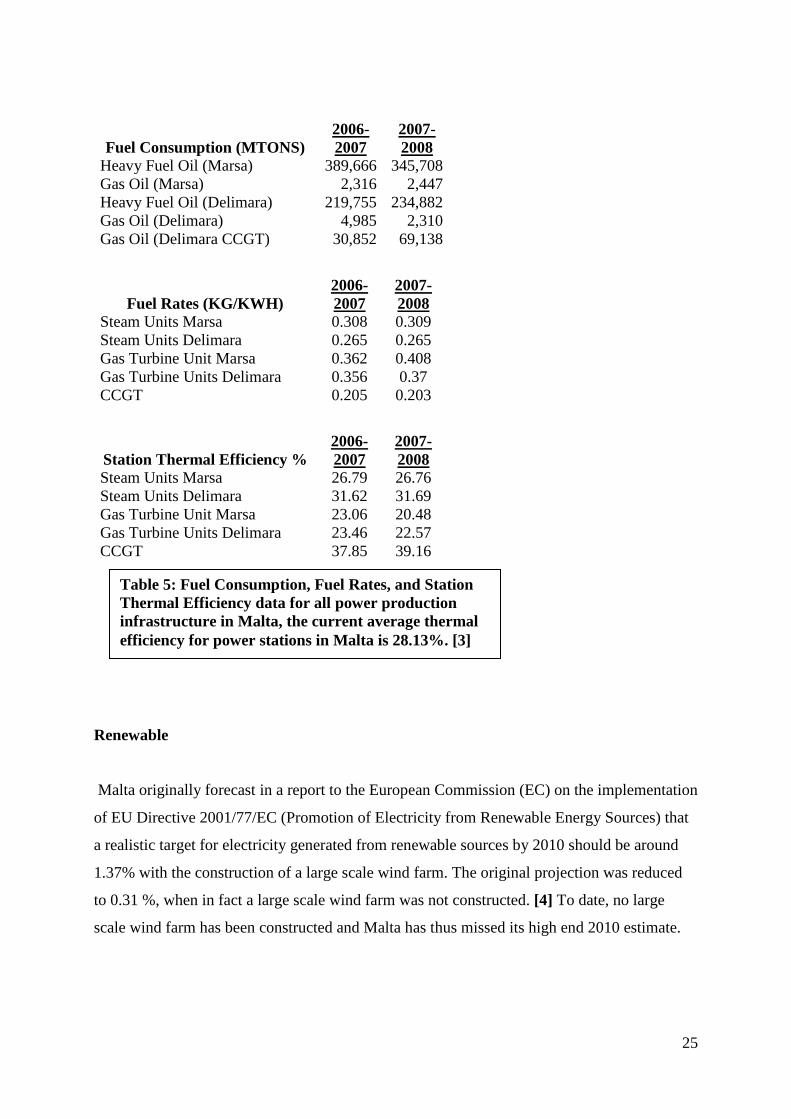
Overview of Station Statistics
Table 5 shows the breakdown of consumption and efficiency data for the individual power
production units. As can be seen, the Closed Cycle Gas Turbine (CCGT) unit at Delimara is
by far the most efficient with an average thermal efficiency between 2007-2008 of 39.16 %.
The fuel consumption data shows that the units at Marsa are being used less while the units at
Delimara are being used more in preparation for an eventual Marsa shutdown. It is also
interesting to note that the thermal efficiencies of the units at the Marsa plant have dropped,
most probably because efficiency improvement and maintenance work is kept to a minimum
for units which will be discarded in only a few years. The thermal efficiencies of the units at
Delimara on the other hand, have increased due to the implementation of efficiency
improvement measures by Enemalta for these units as they are expected to be used for the
next ten to twenty years.
Chart 3: Annual electricity generation by year for
the two Maltese power production plants: No
Enemalta annual report is available for 2009-2010,
so 2008 and earlier numbers had to be used. [2]
25
Fuel Consumption (MTONS)
2006-
2007
2007-
2008
Heavy Fuel Oil (Marsa) 389,666 345,708
Gas Oil (Marsa) 2,316 2,447
Heavy Fuel Oil (Delimara) 219,755 234,882
Gas Oil (Delimara) 4,985 2,310
Gas Oil (Delimara CCGT) 30,852 69,138
Fuel Rates (KG/KWH)
2006-
2007
2007-
2008
Steam Units Marsa 0.308 0.309
Steam Units Delimara 0.265 0.265
Gas Turbine Unit Marsa 0.362 0.408
Gas Turbine Units Delimara 0.356 0.37
CCGT 0.205 0.203
Station Thermal Efficiency %
2006-
2007
2007-
2008
Steam Units Marsa 26.79 26.76
Steam Units Delimara 31.62 31.69
Gas Turbine Unit Marsa 23.06 20.48
Gas Turbine Units Delimara 23.46 22.57
CCGT 37.85 39.16
Renewable
Malta originally forecast in a report to the European Commission (EC) on the implementation
of EU Directive 2001/77/EC (Promotion of Electricity from Renewable Energy Sources) that
a realistic target for electricity generated from renewable sources by 2010 should be around
1.37% with the construction of a large scale wind farm. The original projection was reduced
to 0.31 %, when in fact a large scale wind farm was not constructed. [4] To date, no large
scale wind farm has been constructed and Malta has thus missed its high end 2010 estimate.
Table 5: Fuel Consumption, Fuel Rates, and Station
Thermal Efficiency data for all power production
infrastructure in Malta, the current average thermal
efficiency for power stations in Malta is 28.13%. [3]
26
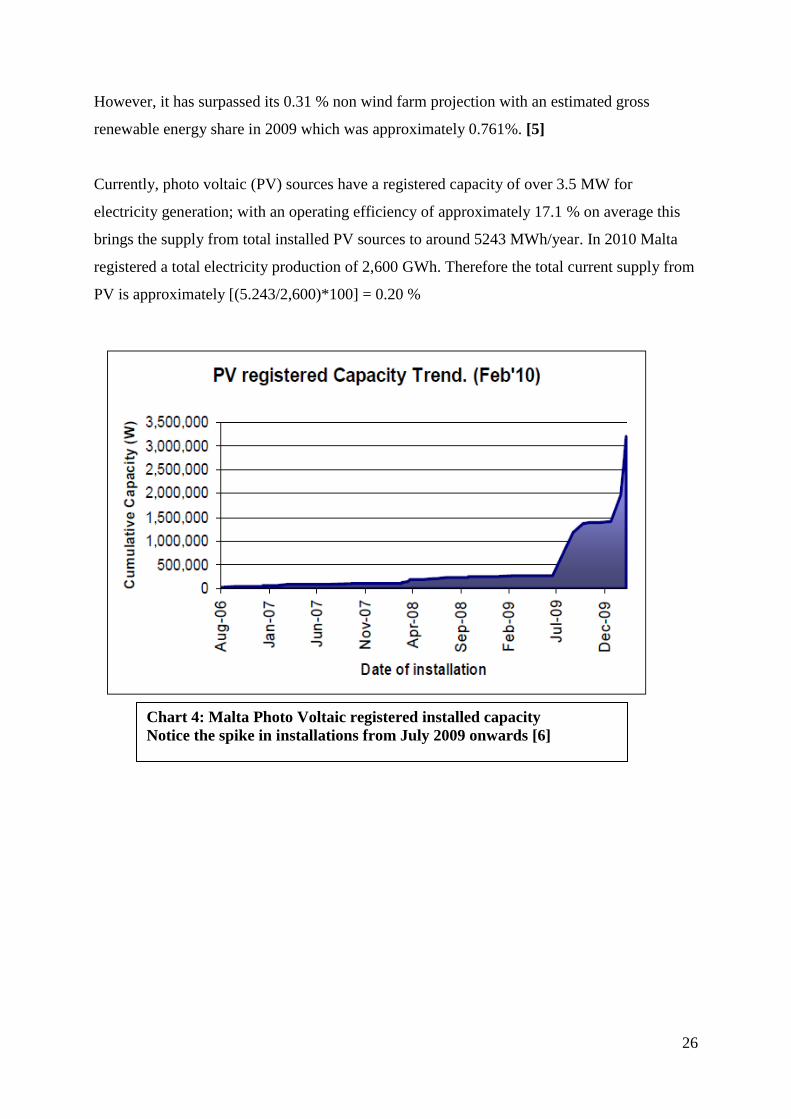
However, it has surpassed its 0.31 % non wind farm projection with an estimated gross
renewable energy share in 2009 which was approximately 0.761%. [5]
Currently, photo voltaic (PV) sources have a registered capacity of over 3.5 MW for
electricity generation; with an operating efficiency of approximately 17.1 % on average this
brings the supply from total installed PV sources to around 5243 MWh/year. In 2010 Malta
registered a total electricity production of 2,600 GWh. Therefore the total current supply from
PV is approximately [(5.243/2,600)*100] = 0.20 %
Chart 4: Malta Photo Voltaic registered installed capacity
Notice the spike in installations from July 2009 onwards [6]
27
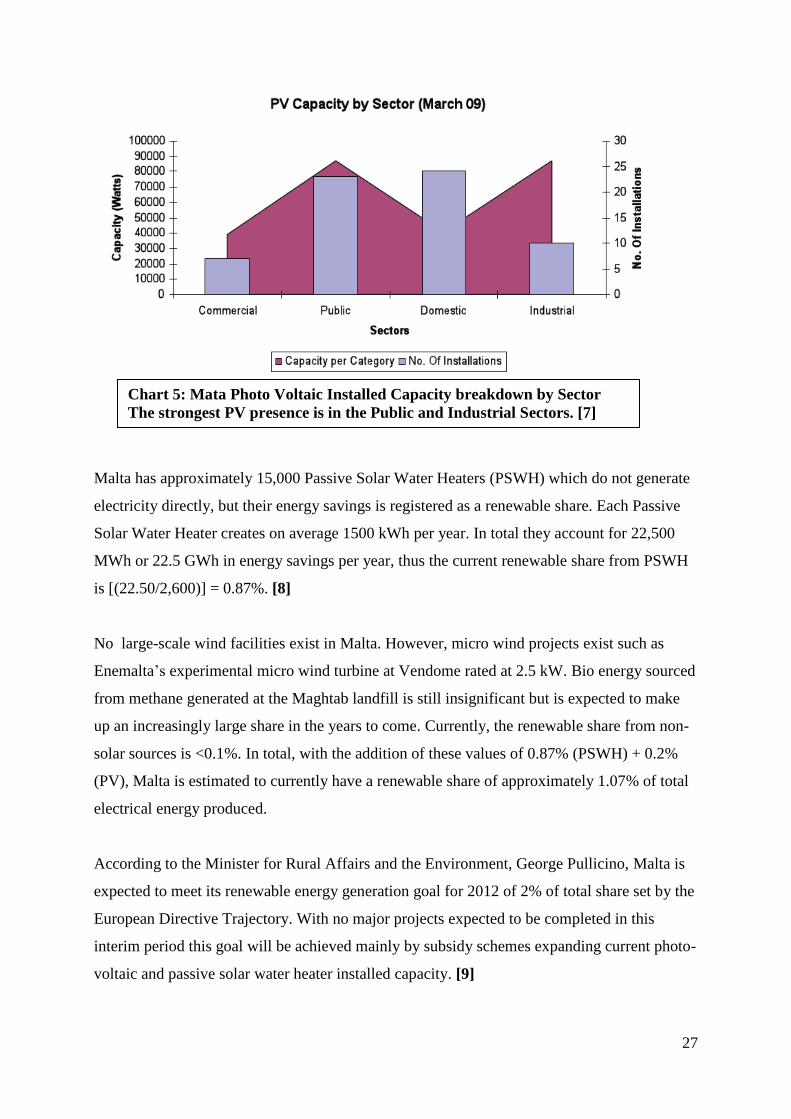
Malta has approximately 15,000 Passive Solar Water Heaters (PSWH) which do not generate
electricity directly, but their energy savings is registered as a renewable share. Each Passive
Solar Water Heater creates on average 1500 kWh per year. In total they account for 22,500
MWh or 22.5 GWh in energy savings per year, thus the current renewable share from PSWH
is [(22.50/2,600)] = 0.87%. [8]
No large-scale wind facilities exist in Malta. However, micro wind projects exist such as
Enemalta‟s experimental micro wind turbine at Vendome rated at 2.5 kW. Bio energy sourced
from methane generated at the Maghtab landfill is still insignificant but is expected to make
up an increasingly large share in the years to come. Currently, the renewable share from non-
solar sources is <0.1%. In total, with the addition of these values of 0.87% (PSWH) + 0.2%
(PV), Malta is estimated to currently have a renewable share of approximately 1.07% of total
electrical energy produced.
According to the Minister for Rural Affairs and the Environment, George Pullicino, Malta is
expected to meet its renewable energy generation goal for 2012 of 2% of total share set by the
European Directive Trajectory. With no major projects expected to be completed in this
interim period this goal will be achieved mainly by subsidy schemes expanding current photo-
voltaic and passive solar water heater installed capacity. [9]
Chart 5: Mata Photo Voltaic Installed Capacity breakdown by Sector
The strongest PV presence is in the Public and Industrial Sectors. [7]
28
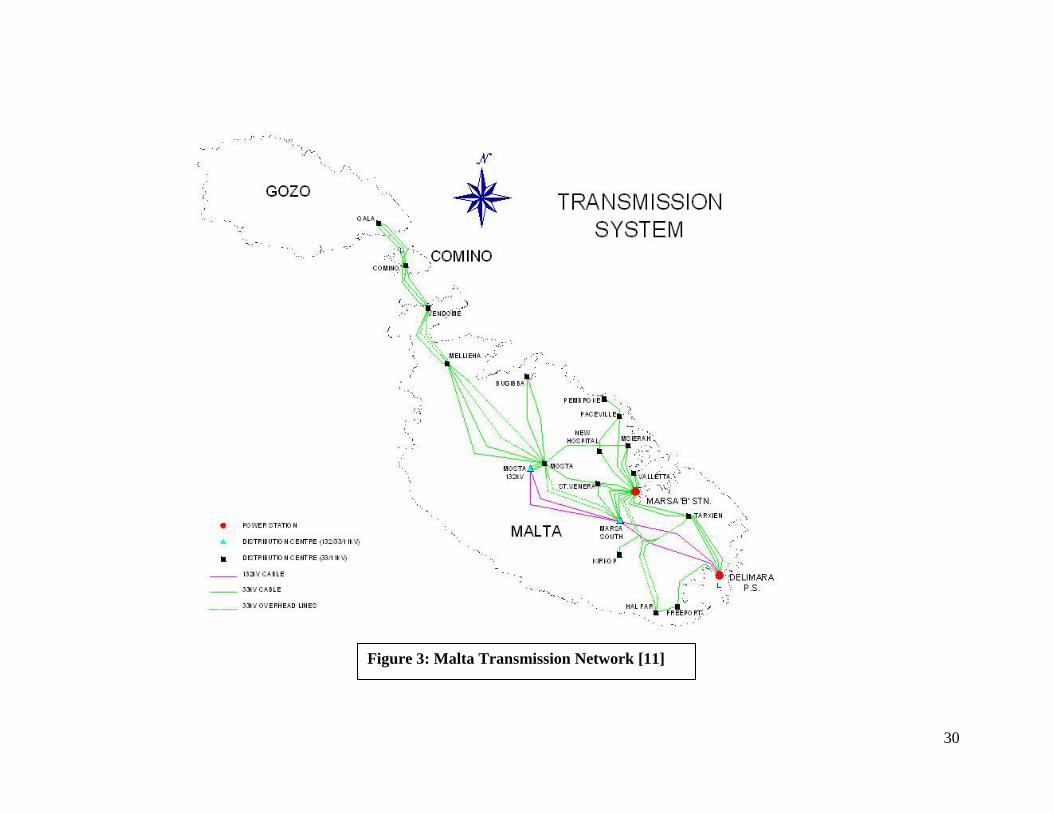
Malta‟s Electrical Distribution Network
Electricity is supplied to the Maltese Islands from the two major power stations at four voltage
levels of 132 kV, 33 kV, 11 kV and 400/230V operating at an AC (Alternating Current)
frequency of 50 Hz.
The transmission system is classified into two major rings:
i. A 132 kV circuit (8 km long) which connects the Delimara Power station directly
to the 132 kV step-down distribution center located in south Marsa and Mosta
(pink ring on map of Malta transmission network). The 132 kV is stepped-down at
these distribution centers to 33 kV where it is in turn transmitted by the 33 kV
system.
ii. A 33 kV system which is extensive with up to 4 parallel lines, essentially covering
the entire islands from Delimara in the South East to Qala in Gozo. It consists of
both overhead lines (60 km) and underground cables (154 km) and is strategically
located to be in close proximity to the major population centers of Malta. Eighteen
Distribution Centers, located strategically throughout the Maltese Islands step-
down the 33kV into 11 kV.
The distribution system is classified into two major rings:
i. An 11 kV ring that spreads throughout the Maltese Islands and is for the most part
underground. The 11 kV circuit is by far the most extensive with a total of 1041
km of underground cable and 159 km of overhead cable. There are a total of 1207
substations that step down the 11 kV voltage to 400/230V which is the rating at
which it can safely be transmitted to end-user customers. Some customers (major
industrial facilities) are supplied directly with electricity rated at 11 kV.
ii. An end-user low voltage system that is rated at 400/230 V with an acceptable
voltage tolerance of +10 % to – 6 %. This system is three-phase* with four wires
(with three of the wires for the phases and one for the ground, safety) by far the
29
most extensive and if its total length were to be calculated it would be many times
the length of the 11 kV system.
*A three-phase system is one in which three conductors carry voltages at waveforms that are
1/3 of a cycle offset in phase. The result is a balanced, continuous power supply with which
efficiencies are greater than a conventional single-phase system. [10] [11]
Malta Transmission Network is shown on next page Figure 3:
30
Figure 3: Malta Transmission Network [11]
31
Malta Energy Breakdown and Projections
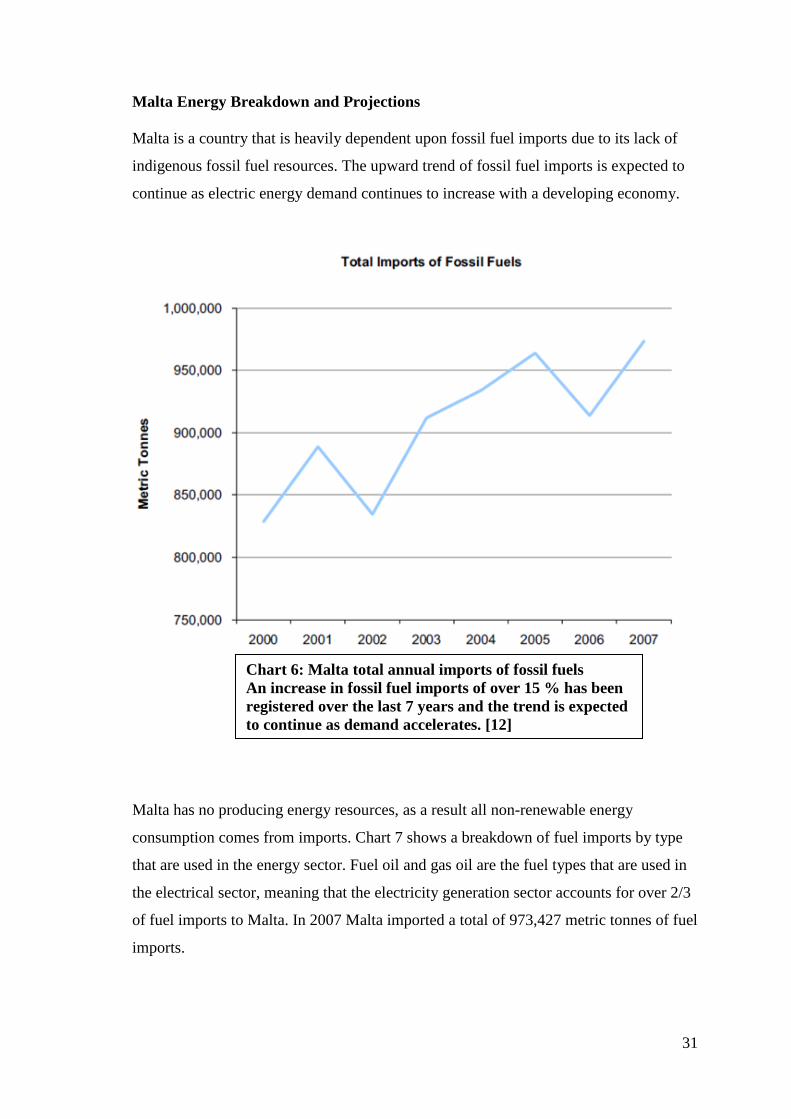
Malta is a country that is heavily dependent upon fossil fuel imports due to its lack of
indigenous fossil fuel resources. The upward trend of fossil fuel imports is expected to
continue as electric energy demand continues to increase with a developing economy.
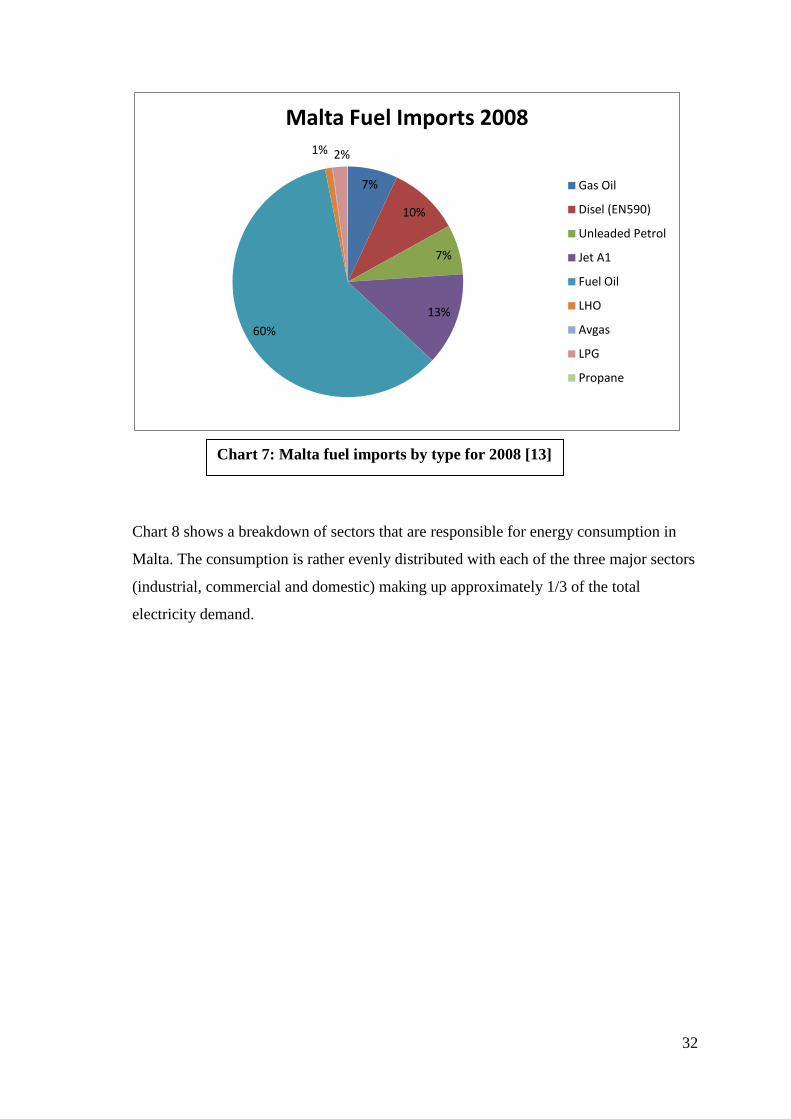
Malta has no producing energy resources, as a result all non-renewable energy
consumption comes from imports. Chart 7 shows a breakdown of fuel imports by type
that are used in the energy sector. Fuel oil and gas oil are the fuel types that are used in
the electrical sector, meaning that the electricity generation sector accounts for over 2/3
of fuel imports to Malta. In 2007 Malta imported a total of 973,427 metric tonnes of fuel
imports.
Chart 6: Malta total annual imports of fossil fuels
An increase in fossil fuel imports of over 15 % has been
registered over the last 7 years and the trend is expected
to continue as demand accelerates. [12]
32
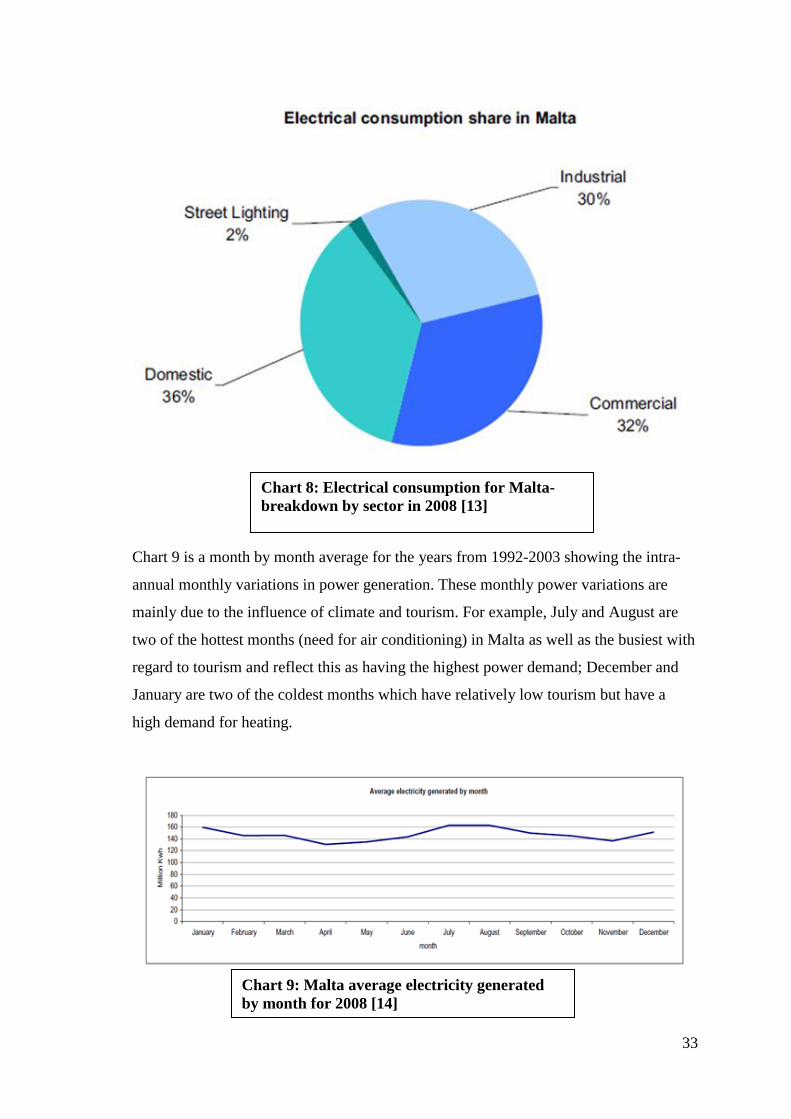
Chart 8 shows a breakdown of sectors that are responsible for energy consumption in
Malta. The consumption is rather evenly distributed with each of the three major sectors
(industrial, commercial and domestic) making up approximately 1/3 of the total
electricity demand.
7%
10%
7%
13%
60%
1% 2%
Malta Fuel Imports 2008
Gas Oil
Disel (EN590)
Unleaded Petrol
Jet A1
Fuel Oil
LHO
Avgas
LPG
Propane
Chart 7: Malta fuel imports by type for 2008 [13]
33
Chart 9 is a month by month average for the years from 1992-2003 showing the intra-
annual monthly variations in power generation. These monthly power variations are
mainly due to the influence of climate and tourism. For example, July and August are
two of the hottest months (need for air conditioning) in Malta as well as the busiest with
regard to tourism and reflect this as having the highest power demand; December and
January are two of the coldest months which have relatively low tourism but have a
high demand for heating.
Chart 8: Electrical consumption for Malta-
breakdown by sector in 2008 [13]
Chart 9: Malta average electricity generated
by month for 2008 [14]
34
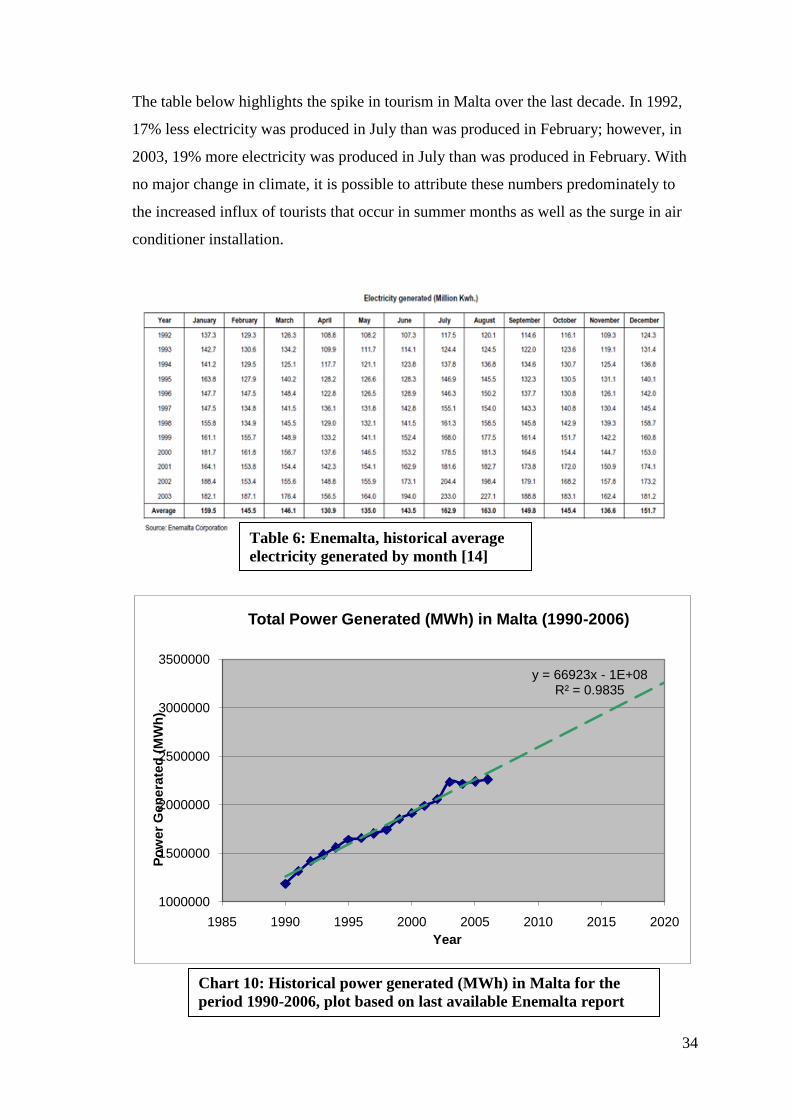
The table below highlights the spike in tourism in Malta over the last decade. In 1992,
17% less electricity was produced in July than was produced in February; however, in
2003, 19% more electricity was produced in July than was produced in February. With
no major change in climate, it is possible to attribute these numbers predominately to
the increased influx of tourists that occur in summer months as well as the surge in air
conditioner installation.
y = 66923x - 1E+08R² = 0.9835
1000000
1500000
2000000
2500000
3000000
3500000
1985 1990 1995 2000 2005 2010 2015 2020
Po
wer
Gen
era
ted
(M
Wh
)
Year
Total Power Generated (MWh) in Malta (1990-2006)
Table 6: Enemalta, historical average
electricity generated by month [14]
Chart 10: Historical power generated (MWh) in Malta for the
period 1990-2006, plot based on last available Enemalta report
data [15]
35
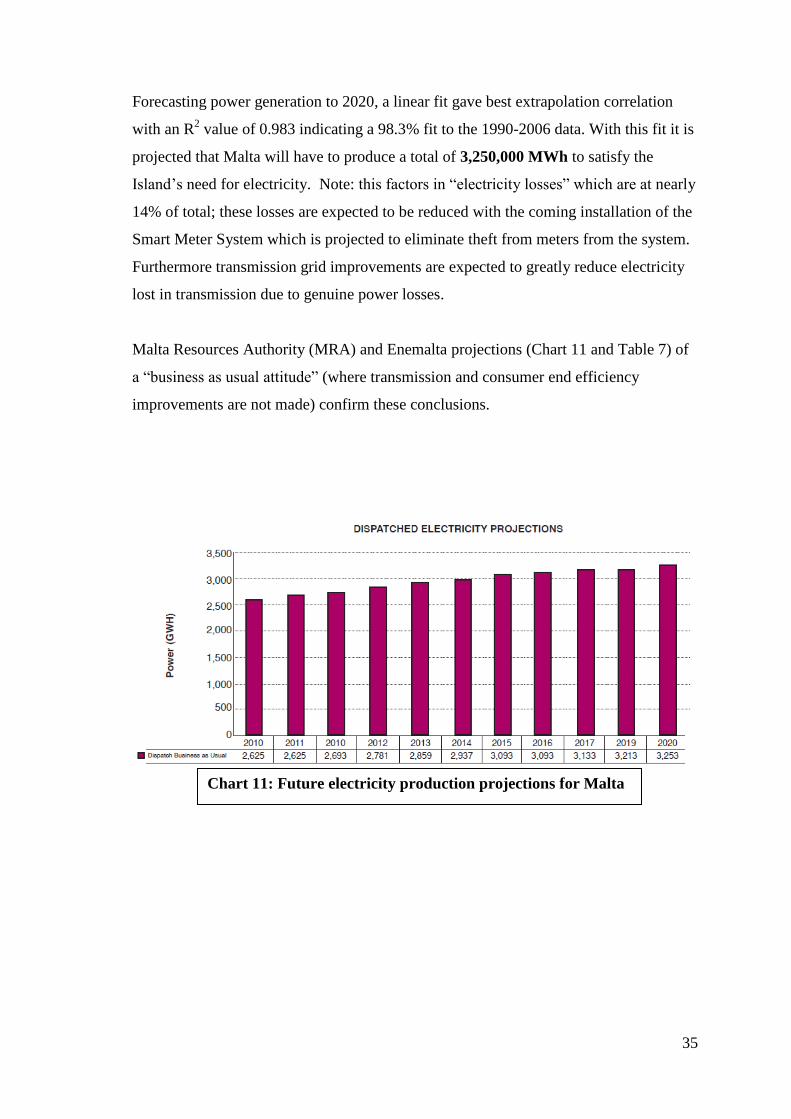
Forecasting power generation to 2020, a linear fit gave best extrapolation correlation
with an R2 value of 0.983 indicating a 98.3% fit to the 1990-2006 data. With this fit it is
projected that Malta will have to produce a total of 3,250,000 MWh to satisfy the
Island‟s need for electricity. Note: this factors in “electricity losses” which are at nearly
14% of total; these losses are expected to be reduced with the coming installation of the
Smart Meter System which is projected to eliminate theft from meters from the system.
Furthermore transmission grid improvements are expected to greatly reduce electricity
lost in transmission due to genuine power losses.
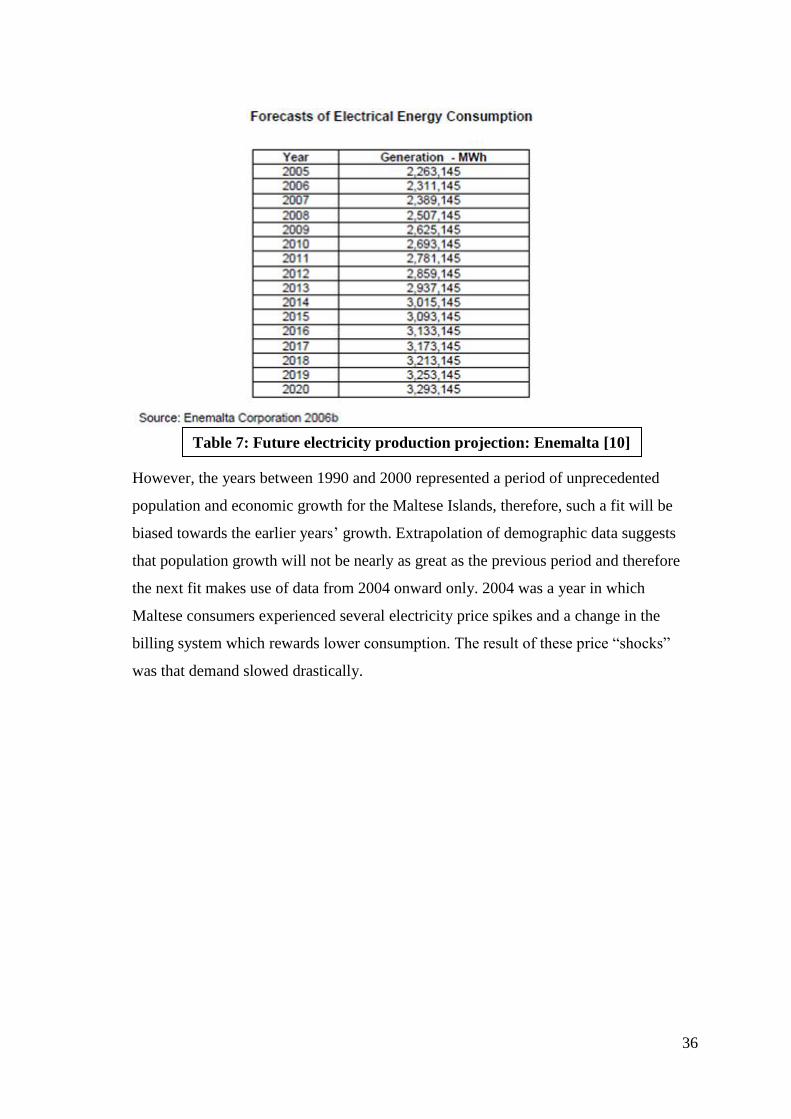
Malta Resources Authority (MRA) and Enemalta projections (Chart 11 and Table 7) of
a “business as usual attitude” (where transmission and consumer end efficiency
improvements are not made) confirm these conclusions.
Chart 11: Future electricity production projections for Malta
[7]
36
However, the years between 1990 and 2000 represented a period of unprecedented
population and economic growth for the Maltese Islands, therefore, such a fit will be
biased towards the earlier years‟ growth. Extrapolation of demographic data suggests
that population growth will not be nearly as great as the previous period and therefore
the next fit makes use of data from 2004 onward only. 2004 was a year in which
Maltese consumers experienced several electricity price spikes and a change in the
billing system which rewards lower consumption. The result of these price “shocks”
was that demand slowed drastically.
Table 7: Future electricity production projection: Enemalta [10]
37
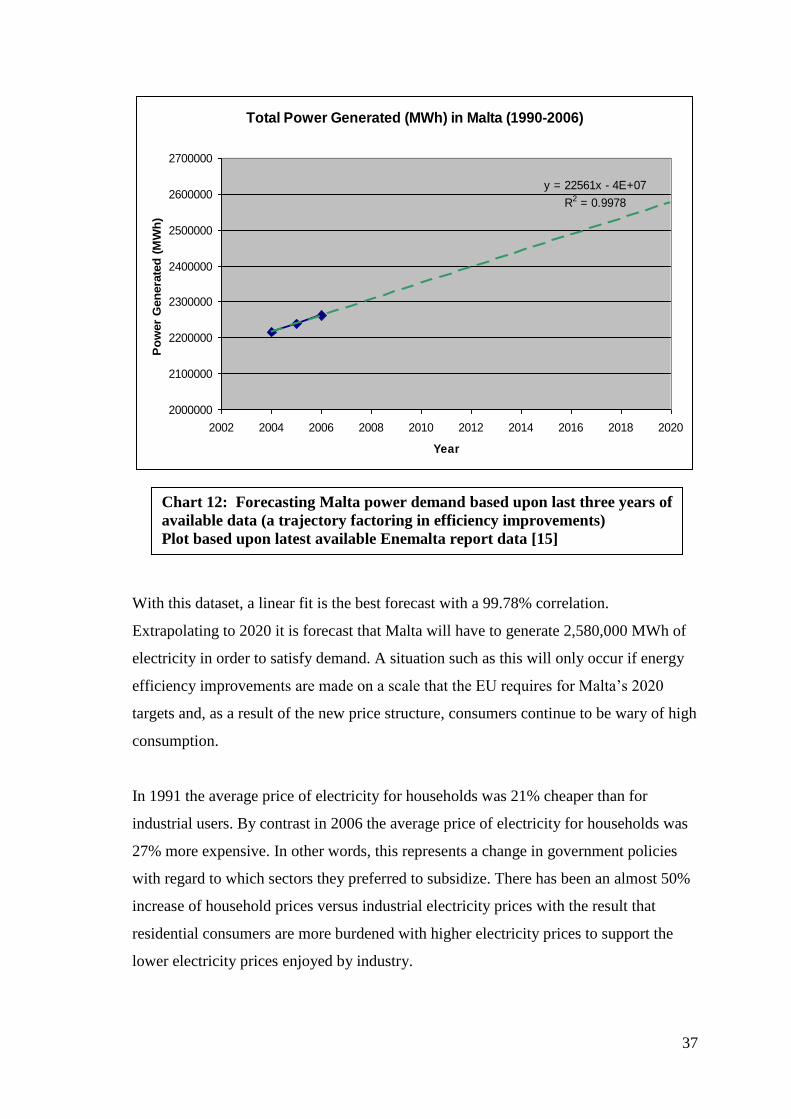
With this dataset, a linear fit is the best forecast with a 99.78% correlation.
Extrapolating to 2020 it is forecast that Malta will have to generate 2,580,000 MWh of
electricity in order to satisfy demand. A situation such as this will only occur if energy
efficiency improvements are made on a scale that the EU requires for Malta‟s 2020
targets and, as a result of the new price structure, consumers continue to be wary of high
consumption.
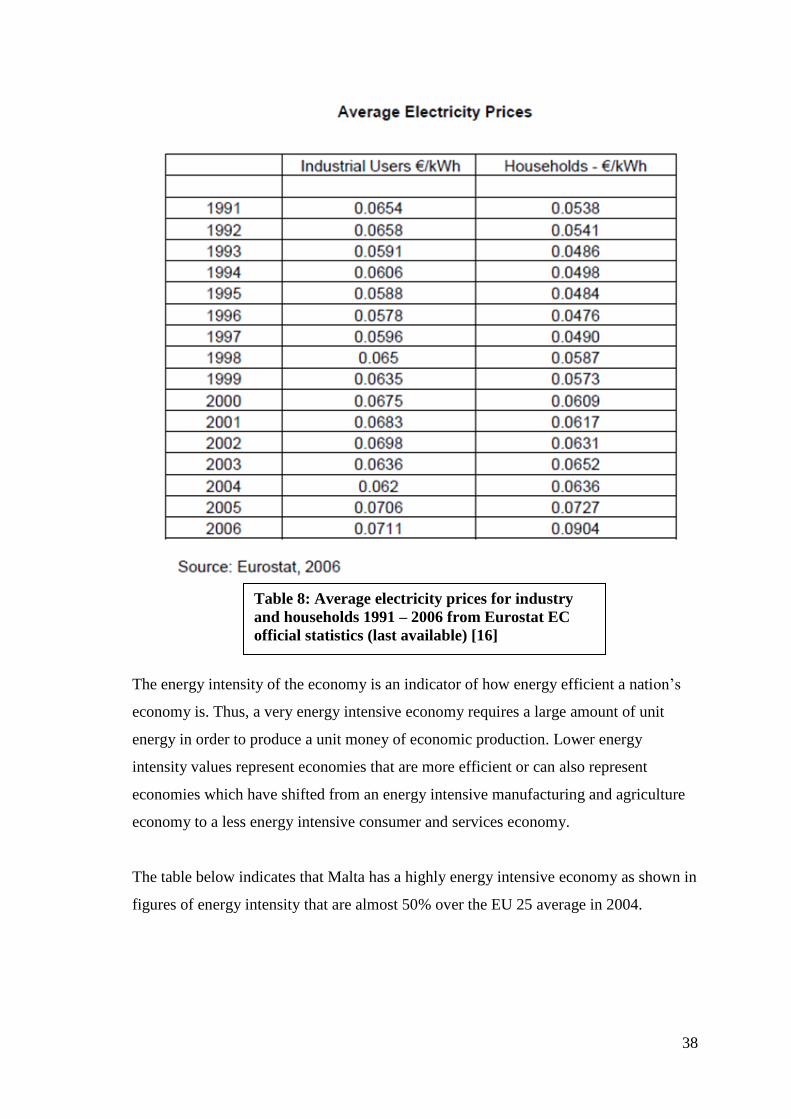
In 1991 the average price of electricity for households was 21% cheaper than for
industrial users. By contrast in 2006 the average price of electricity for households was
27% more expensive. In other words, this represents a change in government policies
with regard to which sectors they preferred to subsidize. There has been an almost 50%
increase of household prices versus industrial electricity prices with the result that
residential consumers are more burdened with higher electricity prices to support the
lower electricity prices enjoyed by industry.
Total Power Generated (MWh) in Malta (1990-2006)
y = 22561x - 4E+07
R2 = 0.9978
2000000
2100000
2200000
2300000
2400000
2500000
2600000
2700000
2002 2004 2006 2008 2010 2012 2014 2016 2018 2020
Year
Po
wer
Gen
era
ted
(M
Wh
)
Chart 12: Forecasting Malta power demand based upon last three years of
available data (a trajectory factoring in efficiency improvements)
Plot based upon latest available Enemalta report data [15]
38
The energy intensity of the economy is an indicator of how energy efficient a nation‟s
economy is. Thus, a very energy intensive economy requires a large amount of unit
energy in order to produce a unit money of economic production. Lower energy
intensity values represent economies that are more efficient or can also represent
economies which have shifted from an energy intensive manufacturing and agriculture
economy to a less energy intensive consumer and services economy.
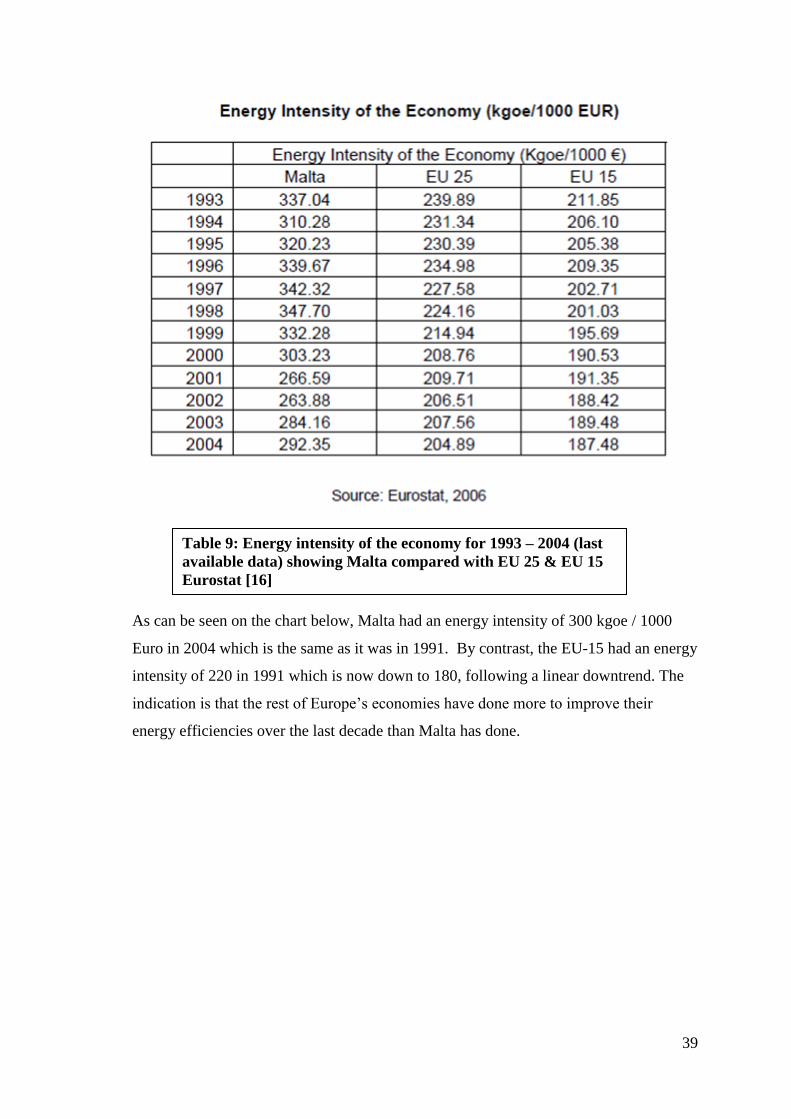
The table below indicates that Malta has a highly energy intensive economy as shown in
figures of energy intensity that are almost 50% over the EU 25 average in 2004.
Table 8: Average electricity prices for industry
and households 1991 – 2006 from Eurostat EC
official statistics (last available) [16]
39
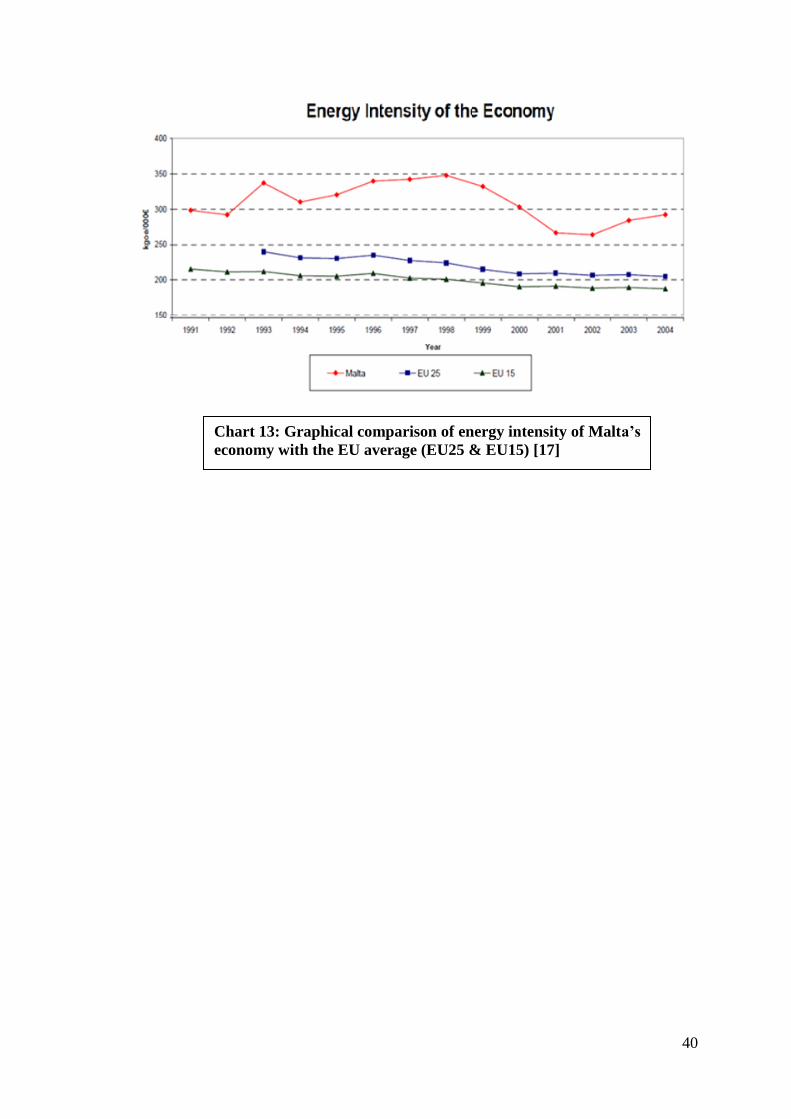
As can be seen on the chart below, Malta had an energy intensity of 300 kgoe / 1000
Euro in 2004 which is the same as it was in 1991. By contrast, the EU-15 had an energy
intensity of 220 in 1991 which is now down to 180, following a linear downtrend. The
indication is that the rest of Europe‟s economies have done more to improve their
energy efficiencies over the last decade than Malta has done.
Table 9: Energy intensity of the economy for 1993 – 2004 (last
available data) showing Malta compared with EU 25 & EU 15
Eurostat [16]
40
Chart 13: Graphical comparison of energy intensity of Malta‟s
economy with the EU average (EU25 & EU15) [17]
41
V. Problems with Current Electricity Production
Effective Monopoly of Production
As discussed earlier, with Malta‟s accession to the European Union in 2004, the Malta
electric energy market became liberalized. This market liberalization gives the right for
other companies to compete in the Maltese energy market. However, with no electrical
interconnection and a heavily entrenched market presence of the only producer
(Enemalta) coupled with a small island state economy, it does not make economic sense
for any other power company to try to establish a presence in Malta and compete in the
energy market.
The problem with an effective monopoly, as has been proven time and time again
throughout history, is that there is no incentive for improvement of quality and
efficiency. A company with a monopoly has no need to improve its products as it has no
competitor offering any alternative. The result in almost every case of market monopoly
is a higher cost of poorer quality products passed on to the consumer.
On 23rd
October, 2010 Enemalta was featured on the Times of Malta front page
headline: “Enemalta, WSC, buses top list of complaints”. The index was based upon
a European Commission survey the purpose of which was to identify markets that may
be underperforming for consumers.
“The most recent EU survey released earlier this week in which the
over whelming majority of Maltese identified the electricity sector as
the most problematic the Island is facing due to lack of competition.” Ivan Camilleri, Brussels, Times of Malta, 23
rd October 2010, page 1.
As will be discussed later, the Malta-Sicily interconnection may change this
monopolistic dynamic.
Pseudo Private-Public Corporation
Enemalta “Corporation” exists as an independent entity in the sense that it should be
responsible for managing itself in a way that makes the most business sense. Enemalta
is not traded on the Malta Stock Exchange and the only equity holder in the company is
42
the Government of Malta. This close link between Government and the Corporation
means that the Government ultimately dictates company policies with regard to projects
of large operational significance. Government decisions can often be politically
motivated and do not always represent the best interests of the Country, but rather the
best interests of the ruling political party, with the consequence that less than ideal
decisions are sometimes made.
Eng. Charles Yousif observed in his work on Malta‟s Energy policy:
“Malta‟s concerned actors partly neglect the place but act according to
personal motivation, perception and capacities…both the EU RE policy
framework and the national interaction process influence the
implementation process, which can lead to spatial mismatches.”
„Spatial misfits in a multi-level renewable energy policy implementation process on the
Small Island State of Malta’. Kotzebue, Bressers, Yousif , University of Malta 2010.
Reference Section II: Background [3]
Debt
Debt is a major burden on any company as it hinders the ability of a company to operate
and develop effectively since capital and timeframe of investment are restricted to short-
sighted results that relieve the burden of debt.
Due to Enemalta‟s monopolistic status, its financial status and health essentially
represent the overall viability of Malta‟s power production. This is crucial as to why an
analysis of Enemalta‟s financial health and how it has performed historically is
important since it is possible to deduce forward looking trends on the Company‟s
sustainability and thus the energy market of Malta. For the purpose of analysis the
latest financial statement available from Enemalta was used which is for 2007. Emails
sent to Enemalta asking where the subsequent financial statements could be found were
unanswered.
The graph below is a plot of cumulative year by year losses incurred by Enemalta dating
back to 2000. The Company suffered its greatest losses in 2008 and 2009 [2] when oil
prices spiked to record levels and consumer prices were not raised sufficiently in order
to compensate for the spikes in oil prices. In order for Enemalta to raise prices that
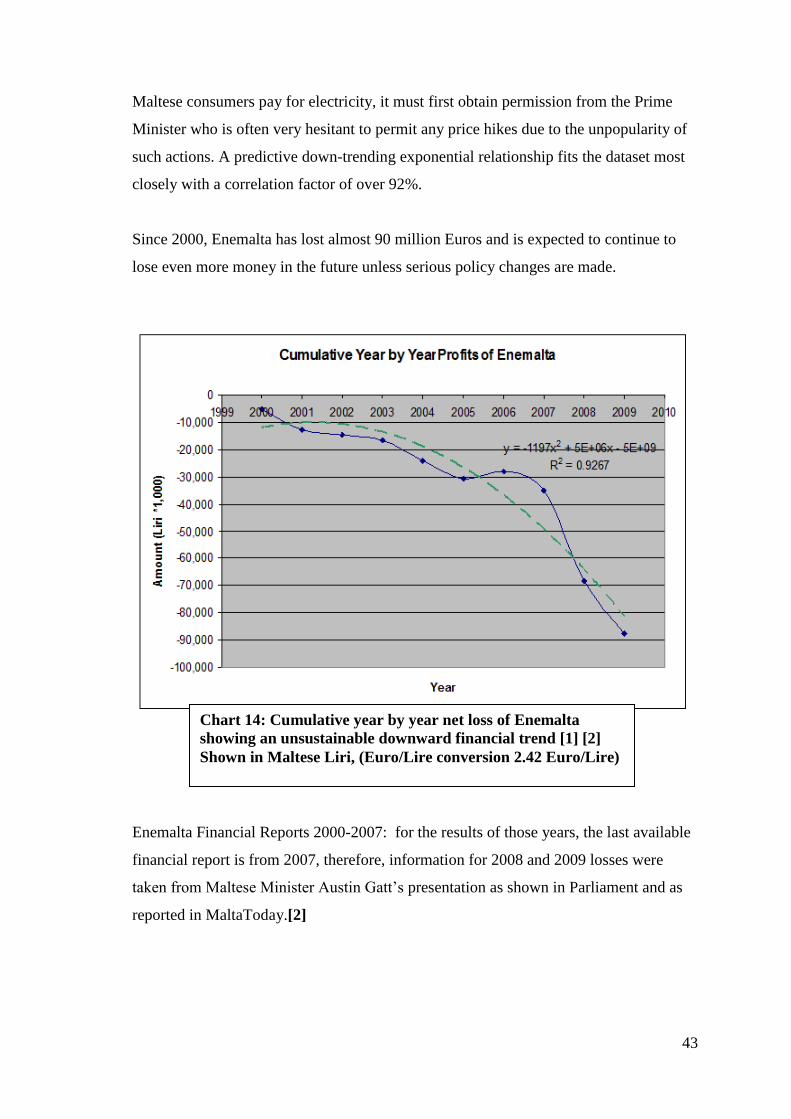
43
Maltese consumers pay for electricity, it must first obtain permission from the Prime
Minister who is often very hesitant to permit any price hikes due to the unpopularity of
such actions. A predictive down-trending exponential relationship fits the dataset most
closely with a correlation factor of over 92%.
Since 2000, Enemalta has lost almost 90 million Euros and is expected to continue to
lose even more money in the future unless serious policy changes are made.
Enemalta Financial Reports 2000-2007: for the results of those years, the last available
financial report is from 2007, therefore, information for 2008 and 2009 losses were
taken from Maltese Minister Austin Gatt‟s presentation as shown in Parliament and as
reported in MaltaToday.[2]
Chart 14: Cumulative year by year net loss of Enemalta
showing an unsustainable downward financial trend [1] [2]
Shown in Maltese Liri, (Euro/Lire conversion 2.42 Euro/Lire)
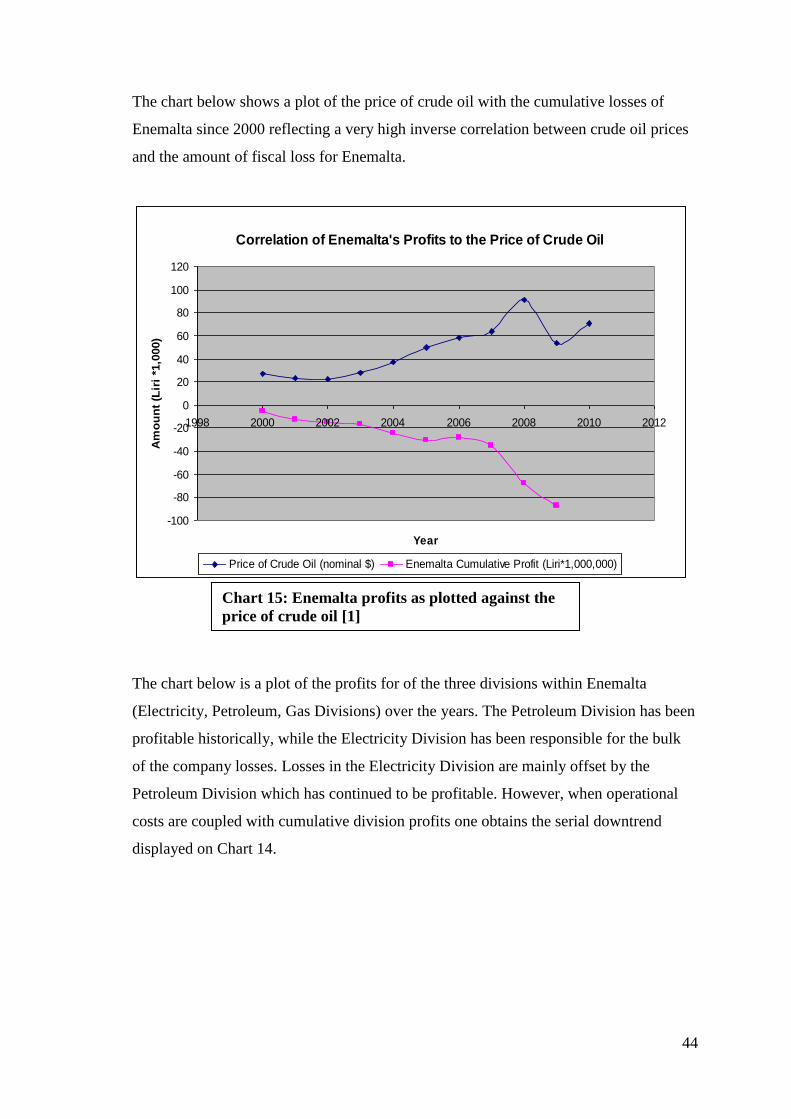
44
The chart below shows a plot of the price of crude oil with the cumulative losses of
Enemalta since 2000 reflecting a very high inverse correlation between crude oil prices
and the amount of fiscal loss for Enemalta.
The chart below is a plot of the profits for of the three divisions within Enemalta
(Electricity, Petroleum, Gas Divisions) over the years. The Petroleum Division has been
profitable historically, while the Electricity Division has been responsible for the bulk
of the company losses. Losses in the Electricity Division are mainly offset by the
Petroleum Division which has continued to be profitable. However, when operational
costs are coupled with cumulative division profits one obtains the serial downtrend
displayed on Chart 14.
Correlation of Enemalta's Profits to the Price of Crude Oil
-100
-80
-60
-40
-20
0
20
40
60
80
100
120
1998 2000 2002 2004 2006 2008 2010 2012
Year
Am
ou
nt
(Lir
i *1
,000)
Price of Crude Oil (nominal $) Enemalta Cumulative Profit (Liri*1,000,000)
Chart 15: Enemalta profits as plotted against the
price of crude oil [1]
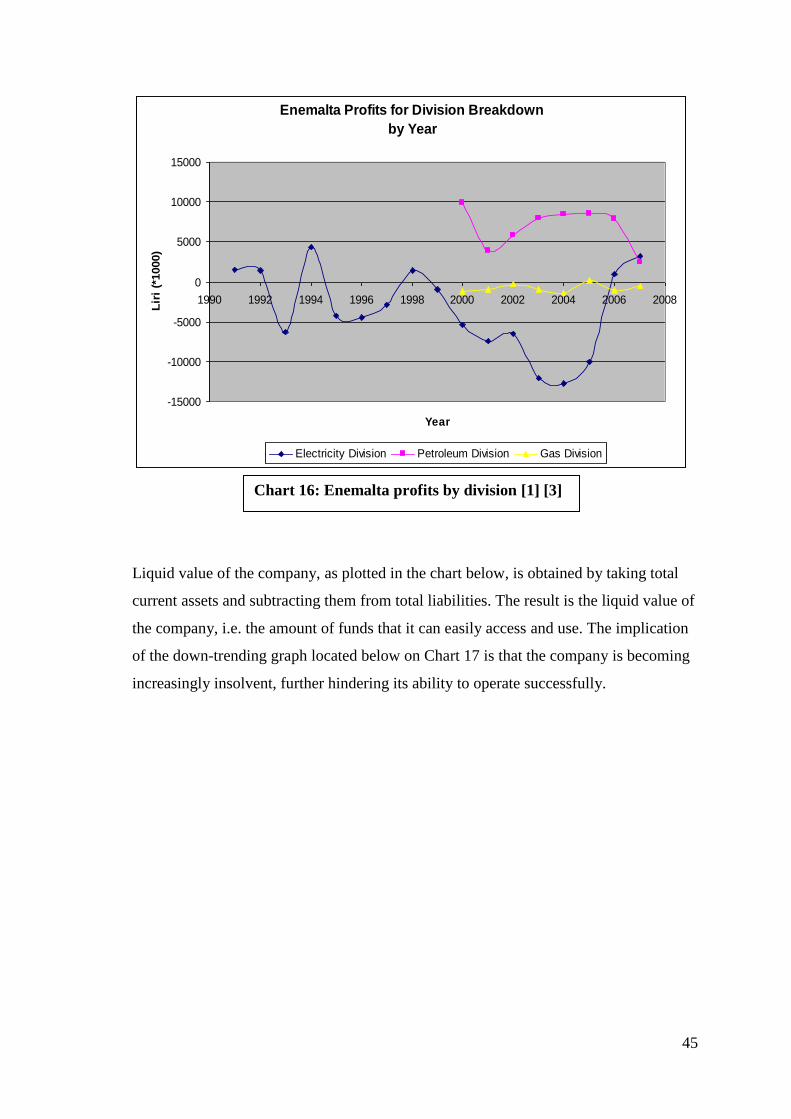
45
Liquid value of the company, as plotted in the chart below, is obtained by taking total
current assets and subtracting them from total liabilities. The result is the liquid value of
the company, i.e. the amount of funds that it can easily access and use. The implication
of the down-trending graph located below on Chart 17 is that the company is becoming
increasingly insolvent, further hindering its ability to operate successfully.
Enemalta Profits for Division Breakdown
by Year
-15000
-10000
-5000
0
5000
10000
15000
1990 1992 1994 1996 1998 2000 2002 2004 2006 2008
Year
Lir
i (*
1000)
Electricity Division Petroleum Division Gas Division
Chart 16: Enemalta profits by division [1] [3]
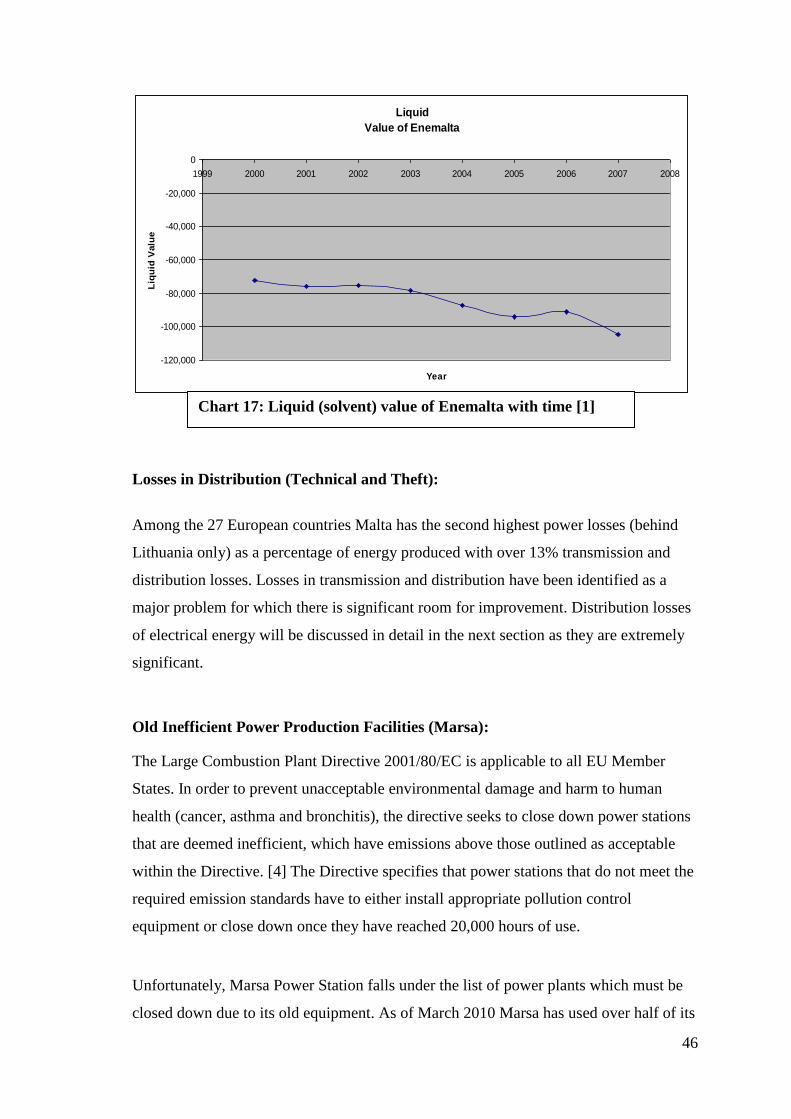
46
Losses in Distribution (Technical and Theft):
Among the 27 European countries Malta has the second highest power losses (behind
Lithuania only) as a percentage of energy produced with over 13% transmission and
distribution losses. Losses in transmission and distribution have been identified as a
major problem for which there is significant room for improvement. Distribution losses
of electrical energy will be discussed in detail in the next section as they are extremely
significant.
Old Inefficient Power Production Facilities (Marsa):
The Large Combustion Plant Directive 2001/80/EC is applicable to all EU Member
States. In order to prevent unacceptable environmental damage and harm to human
health (cancer, asthma and bronchitis), the directive seeks to close down power stations
that are deemed inefficient, which have emissions above those outlined as acceptable
within the Directive. [4] The Directive specifies that power stations that do not meet the
required emission standards have to either install appropriate pollution control
equipment or close down once they have reached 20,000 hours of use.
Unfortunately, Marsa Power Station falls under the list of power plants which must be
closed down due to its old equipment. As of March 2010 Marsa has used over half of its
Liquid
Value of Enemalta
-120,000
-100,000
-80,000
-60,000
-40,000
-20,000
0
1999 2000 2001 2002 2003 2004 2005 2006 2007 2008
Year
Liq
uid
Valu
e
Chart 17: Liquid (solvent) value of Enemalta with time [1]
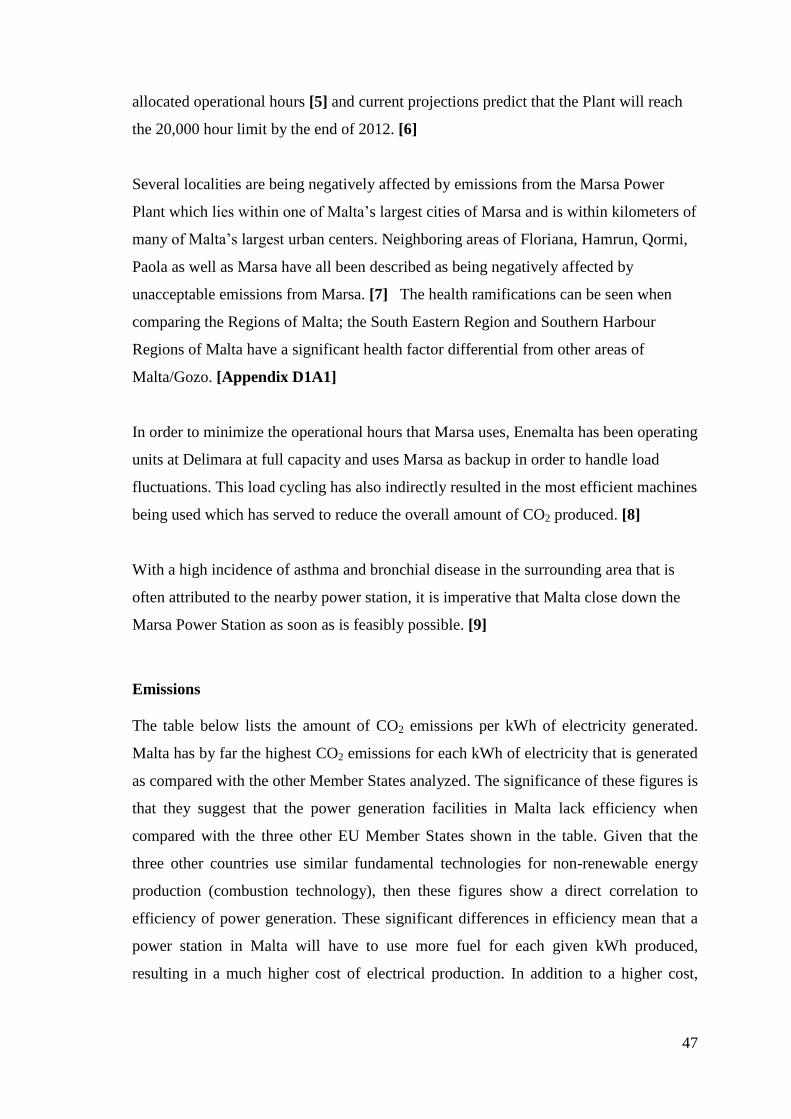
47
allocated operational hours [5] and current projections predict that the Plant will reach
the 20,000 hour limit by the end of 2012. [6]
Several localities are being negatively affected by emissions from the Marsa Power
Plant which lies within one of Malta‟s largest cities of Marsa and is within kilometers of
many of Malta‟s largest urban centers. Neighboring areas of Floriana, Hamrun, Qormi,
Paola as well as Marsa have all been described as being negatively affected by
unacceptable emissions from Marsa. [7] The health ramifications can be seen when
comparing the Regions of Malta; the South Eastern Region and Southern Harbour
Regions of Malta have a significant health factor differential from other areas of
Malta/Gozo. [Appendix D1A1]
In order to minimize the operational hours that Marsa uses, Enemalta has been operating
units at Delimara at full capacity and uses Marsa as backup in order to handle load
fluctuations. This load cycling has also indirectly resulted in the most efficient machines
being used which has served to reduce the overall amount of CO2 produced. [8]
With a high incidence of asthma and bronchial disease in the surrounding area that is
often attributed to the nearby power station, it is imperative that Malta close down the
Marsa Power Station as soon as is feasibly possible. [9]
Emissions
The table below lists the amount of CO2 emissions per kWh of electricity generated.
Malta has by far the highest CO2 emissions for each kWh of electricity that is generated
as compared with the other Member States analyzed. The significance of these figures is
that they suggest that the power generation facilities in Malta lack efficiency when
compared with the three other EU Member States shown in the table. Given that the
three other countries use similar fundamental technologies for non-renewable energy
production (combustion technology), then these figures show a direct correlation to
efficiency of power generation. These significant differences in efficiency mean that a
power station in Malta will have to use more fuel for each given kWh produced,
resulting in a much higher cost of electrical production. In addition to a higher cost,
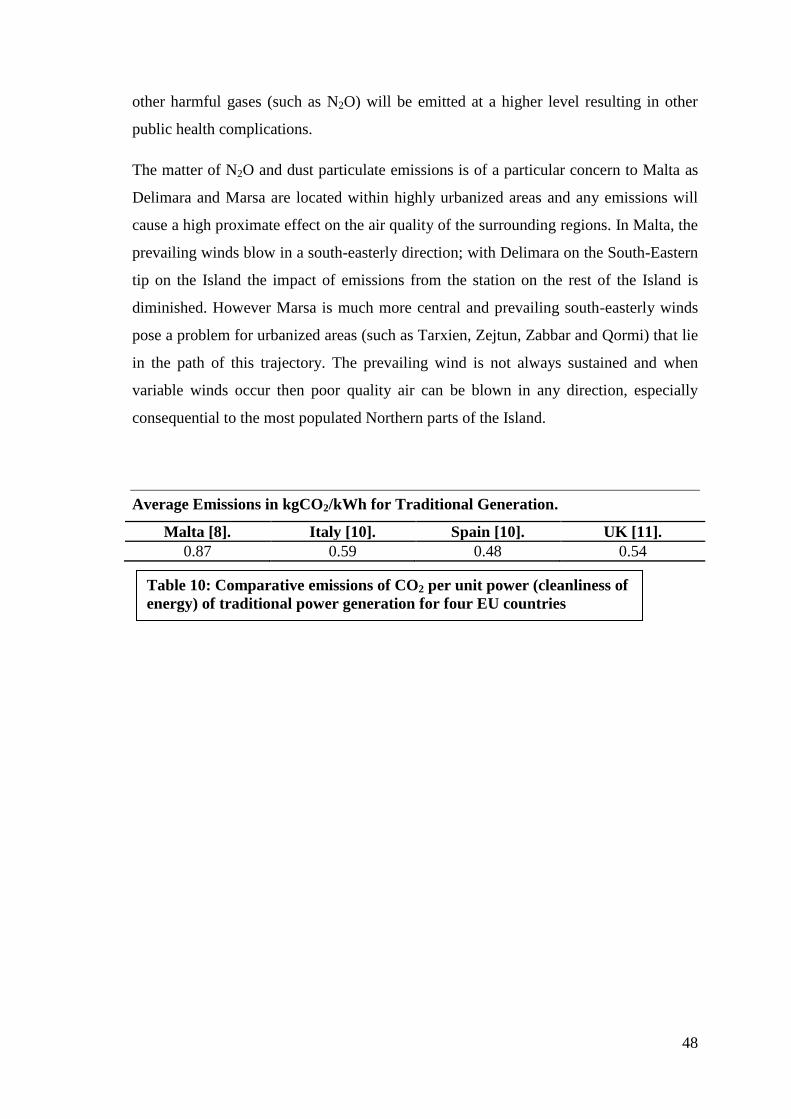
48
other harmful gases (such as N2O) will be emitted at a higher level resulting in other
public health complications.
The matter of N2O and dust particulate emissions is of a particular concern to Malta as
Delimara and Marsa are located within highly urbanized areas and any emissions will
cause a high proximate effect on the air quality of the surrounding regions. In Malta, the
prevailing winds blow in a south-easterly direction; with Delimara on the South-Eastern
tip on the Island the impact of emissions from the station on the rest of the Island is
diminished. However Marsa is much more central and prevailing south-easterly winds
pose a problem for urbanized areas (such as Tarxien, Zejtun, Zabbar and Qormi) that lie
in the path of this trajectory. The prevailing wind is not always sustained and when
variable winds occur then poor quality air can be blown in any direction, especially
consequential to the most populated Northern parts of the Island.
Average Emissions in kgCO2/kWh for Traditional Generation.
Malta [8]. Italy [10]. Spain [10]. UK [11].
0.87 0.59 0.48 0.54
Table 10: Comparative emissions of CO2 per unit power (cleanliness of
energy) of traditional power generation for four EU countries
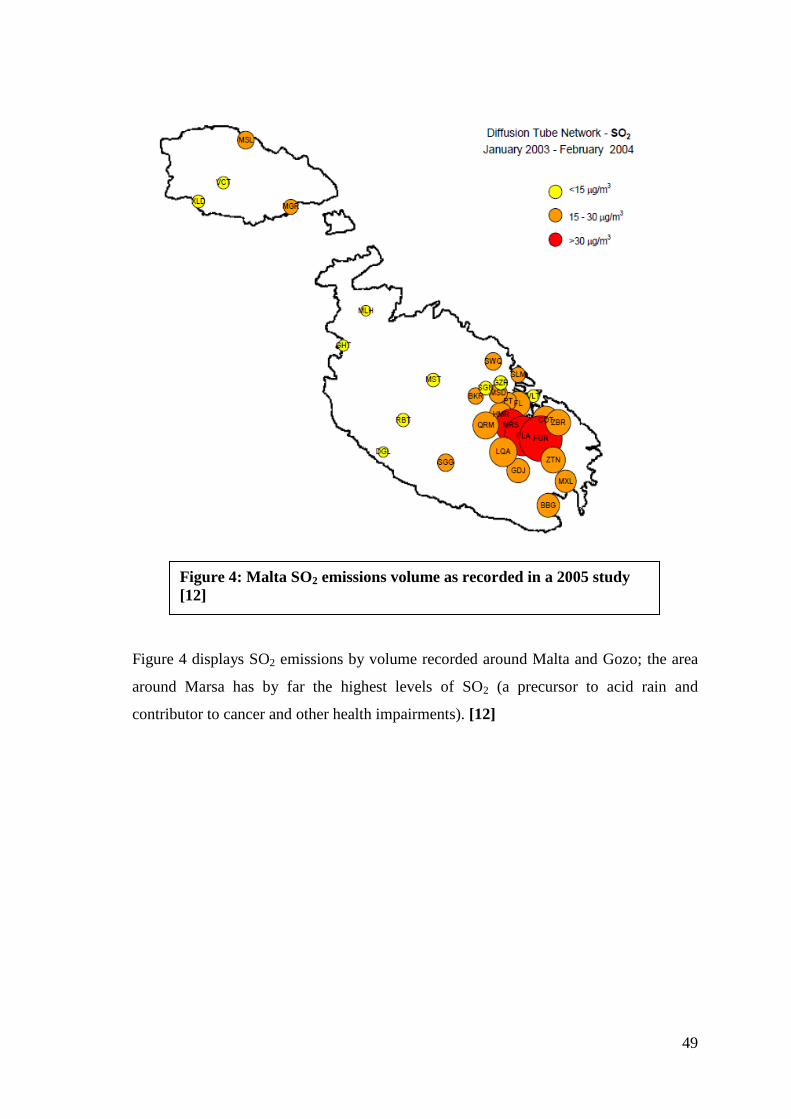
49
Figure 4 displays SO2 emissions by volume recorded around Malta and Gozo; the area
around Marsa has by far the highest levels of SO2 (a precursor to acid rain and
contributor to cancer and other health impairments). [12]
Figure 4: Malta SO2 emissions volume as recorded in a 2005 study
[12]
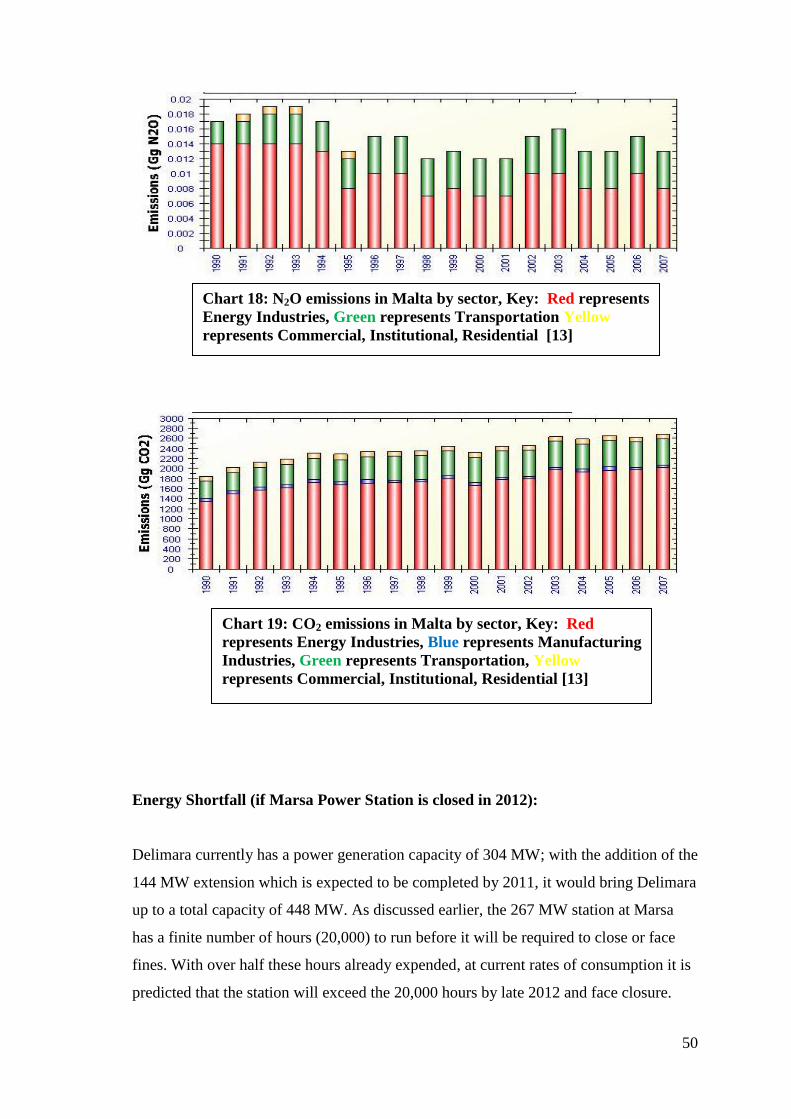
50
Energy Shortfall (if Marsa Power Station is closed in 2012):
Delimara currently has a power generation capacity of 304 MW; with the addition of the
144 MW extension which is expected to be completed by 2011, it would bring Delimara
up to a total capacity of 448 MW. As discussed earlier, the 267 MW station at Marsa
has a finite number of hours (20,000) to run before it will be required to close or face
fines. With over half these hours already expended, at current rates of consumption it is
predicted that the station will exceed the 20,000 hours by late 2012 and face closure.
Chart 18: N2O emissions in Malta by sector, Key: Red represents
Energy Industries, Green represents Transportation Yellow
represents Commercial, Institutional, Residential [13]
Chart 19: CO2 emissions in Malta by sector, Key: Red
represents Energy Industries, Blue represents Manufacturing
Industries, Green represents Transportation, Yellow
represents Commercial, Institutional, Residential [13]
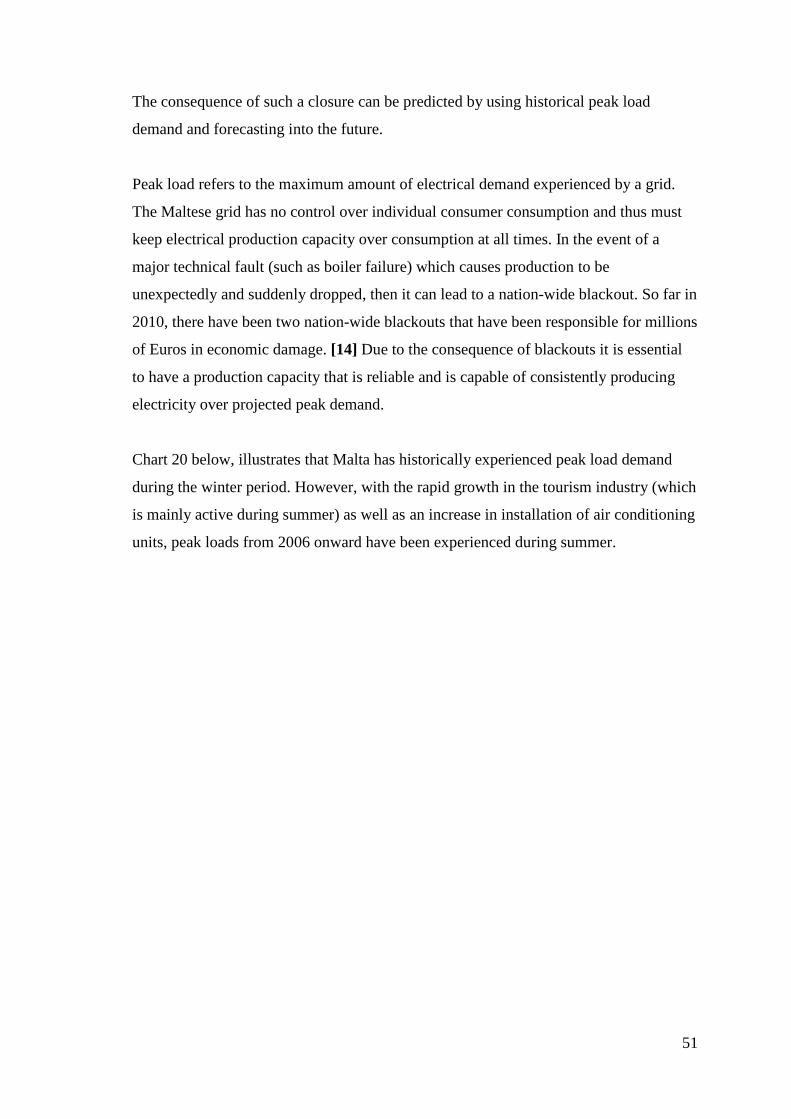
51
The consequence of such a closure can be predicted by using historical peak load
demand and forecasting into the future.
Peak load refers to the maximum amount of electrical demand experienced by a grid.
The Maltese grid has no control over individual consumer consumption and thus must
keep electrical production capacity over consumption at all times. In the event of a
major technical fault (such as boiler failure) which causes production to be
unexpectedly and suddenly dropped, then it can lead to a nation-wide blackout. So far in
2010, there have been two nation-wide blackouts that have been responsible for millions
of Euros in economic damage. [14] Due to the consequence of blackouts it is essential
to have a production capacity that is reliable and is capable of consistently producing
electricity over projected peak demand.
Chart 20 below, illustrates that Malta has historically experienced peak load demand
during the winter period. However, with the rapid growth in the tourism industry (which
is mainly active during summer) as well as an increase in installation of air conditioning
units, peak loads from 2006 onward have been experienced during summer.
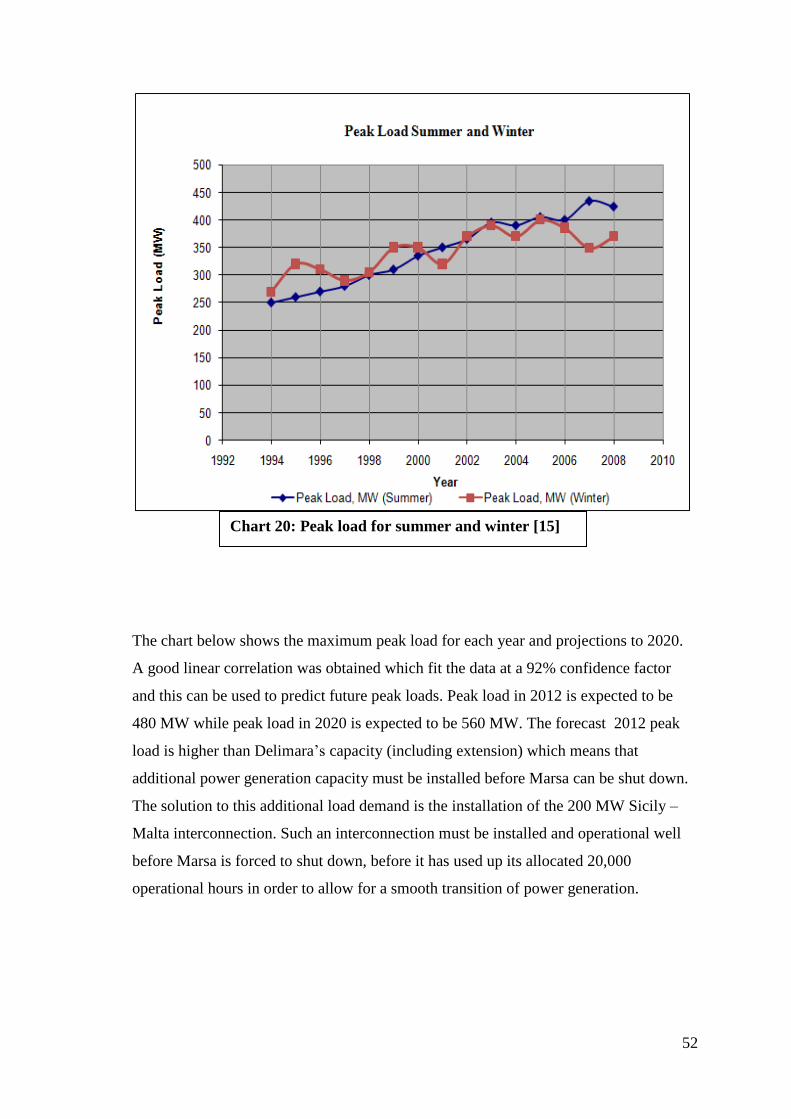
52
The chart below shows the maximum peak load for each year and projections to 2020.
A good linear correlation was obtained which fit the data at a 92% confidence factor
and this can be used to predict future peak loads. Peak load in 2012 is expected to be
480 MW while peak load in 2020 is expected to be 560 MW. The forecast 2012 peak
load is higher than Delimara‟s capacity (including extension) which means that
additional power generation capacity must be installed before Marsa can be shut down.
The solution to this additional load demand is the installation of the 200 MW Sicily –
Malta interconnection. Such an interconnection must be installed and operational well
before Marsa is forced to shut down, before it has used up its allocated 20,000
operational hours in order to allow for a smooth transition of power generation.
Chart 20: Peak load for summer and winter [15]
53
Delimara with extension (448 MW) and Malta-Sicily interconnection (200 MW) would
give the Island a total capacity of 648 MW. The contribution from renewable sources
with regard to capacity is more difficult to calculate as it can fluctuate dramatically from
sub 10% to values over 40%.
With an average hourly production of 371 MW projected for 2020, if it is assumed that
Malta will reach its goals of 10% renewable share by then, it will require that 37.1
MW/hr average will be provided from renewable sources. This would increase effective
total island capacity to (648 + 37.1 ) 685.1 MW. However, power contribution from
renewable sources can fluctuate dramatically on an hourly, daily or monthly basis. For
example, wind speeds can be low enough to cause a wind farm to produce at less than
10% of capacity and incident sunlight at night time can reach effective zero values
causing solar production to generate at 0% of capacity. Therefore, one must be careful
when considering installed renewable energy base as capacity since, if peak load
occurred at a worst case scenario (late afternoon, low winds), then renewable
contribution as a percentage of its efficiency could be 10% or less. With efficiency
Chart 21: Malta peak load projections forecast to 2020 [15]
54
factors on average of 25% then this will result in an effective installed renewable base
of 14.8 MW.
If a worst case renewable production scenario (10% efficiency) is considered for the
occurrence of peak load, then at the time the Island would have an effective total
capacity of 662.8 MW (14.8 + 648).
With peak load forecast to be over 560 MW by 2020, the gap between generation
capacity and peak load would be only 102.8 MW (662.8 – 560 or 15.5%) which would
leave no room for machine failure. It is an accepted rule in power production that a
country should have capacity well over peak load (over 20%) and enough back up
systems such that it can afford the failure of one system without plunging the entire
grid into black out.
If for any reason there is a failure of the interconnection or of the Delimara extension at
these projected times of peak load demand then supply would plunge below demand
and result in a nation wide blackout. With the increased demand projected by 2020, the
extension and interconnection by themselves are not adequate when the importance of
energy security and reliability is factored in. This indicates that Malta will have to
consider another option (in the range of 140 – 200 MW) to bolster its power production
capacity by 2020.
There is very little reason to achieve the 20-20-20 goals if by 2020 the power capacity
situation is not adequate, resulting in a system prone to blackouts during peak load
situations. Malta has two options in order to bolster its reliable energy capacity:
boosting local production capacity or increasing capacity via the installation of an
additional interconnection. If the Delimara extension is considered as a model example
for the bolstering of local energy capacity then this can be compared to the installation
of an additional interconnection and the relative strengths of the two options considered.
55
VI. How Should the 2020 Goals be Achieved?
With the bankruptcy of the US Investment banking firm Lehman Brothers in September
of 2008, the world financial system was on the precipice of collapse, and was only
saved (albeit temporary) by the extraordinary „quantitative easing‟ measures taken by
the central banks of the major countries. The EU was forced to set up a guarantee
package of close to a trillion Euros in order to save some Member States from sovereign
debt default in 2010. The viability of these measures is still in doubt, and the outcome
will seriously affect the ability of Malta to finance the projects envisioned in this
dissertation. It is well beyond the scope of this dissertation to predict the future
availability and cost of money which hinges on this outcome. This dissertation therefore
addresses each analysis with respect to the economics, the environmental impact, and
the sociological impact of the projects considered in a normal, non-crisis setting.
2020 Scenarios (Analysis of Economic & Environmental consequences)
Four comparison studies in order of importance to reach 2020 targets:
1. Power Losses in Electrical Transmission and Distribution Systems
Transmission and Distribution Losses in General:
Electric power systems are typically composed of an electric power generating facility
connected to a transmission system which then connects to a distribution system which
supplies power to the end user. The power supplied to the transmission system is net of
the power used by the generating facility itself. The transmission system transmits
power at high voltage (usually >100,000 Volts AC) at distances up to thousands of
kilometers. For shorter distances (<50 kilometers) lower voltages are used (for example,
32,000 Volts AC). The voltage is then stepped down (to 100-400 volts AC) for use in a
distribution system which distributes to many end user customers. Transmission and
distribution power losses (TPL) in general represents the discrepancy between the
energy produced by the utility (Eg) the net of self consumption (Ec) and the energy sold
to end user customers (Es) and is represented as:
TPL = Eg –Ec –Es (1)
From equation 1 above the total energy either lost or self consumed by the producer in a
system (TPL + Ec) is then:
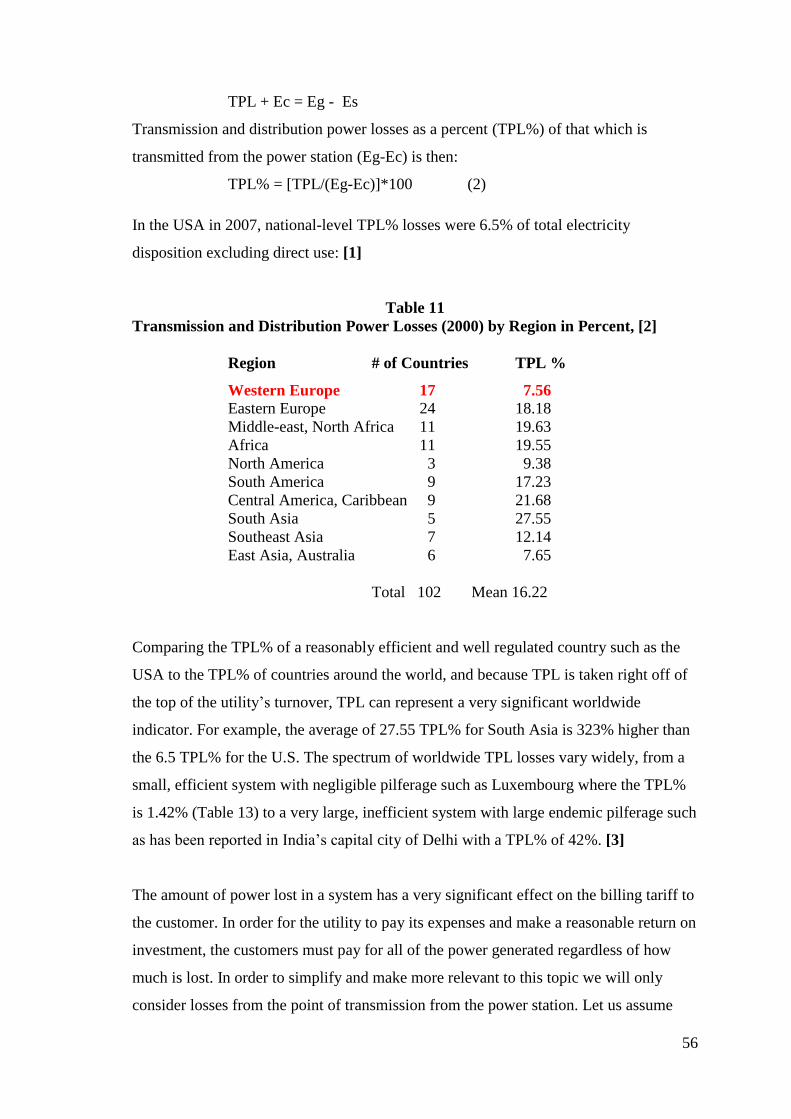
56
TPL + Ec = Eg - Es
Transmission and distribution power losses as a percent (TPL%) of that which is
transmitted from the power station (Eg-Ec) is then:
TPL% = [TPL/(Eg-Ec)]*100 (2)
In the USA in 2007, national-level TPL% losses were 6.5% of total electricity
disposition excluding direct use: [1]
Table 11
Transmission and Distribution Power Losses (2000) by Region in Percent, [2]
Region # of Countries TPL %
Western Europe 17 7.56
Eastern Europe 24 18.18
Middle-east, North Africa 11 19.63
Africa 11 19.55
North America 3 9.38
South America 9 17.23
Central America, Caribbean 9 21.68
South Asia 5 27.55
Southeast Asia 7 12.14
East Asia, Australia 6 7.65
Total 102 Mean 16.22
Comparing the TPL% of a reasonably efficient and well regulated country such as the
USA to the TPL% of countries around the world, and because TPL is taken right off of
the top of the utility‟s turnover, TPL can represent a very significant worldwide
indicator. For example, the average of 27.55 TPL% for South Asia is 323% higher than
the 6.5 TPL% for the U.S. The spectrum of worldwide TPL losses vary widely, from a
small, efficient system with negligible pilferage such as Luxembourg where the TPL%
is 1.42% (Table 13) to a very large, inefficient system with large endemic pilferage such
as has been reported in India‟s capital city of Delhi with a TPL% of 42%. [3]
The amount of power lost in a system has a very significant effect on the billing tariff to
the customer. In order for the utility to pay its expenses and make a reasonable return on
investment, the customers must pay for all of the power generated regardless of how
much is lost. In order to simplify and make more relevant to this topic we will only
consider losses from the point of transmission from the power station. Let us assume
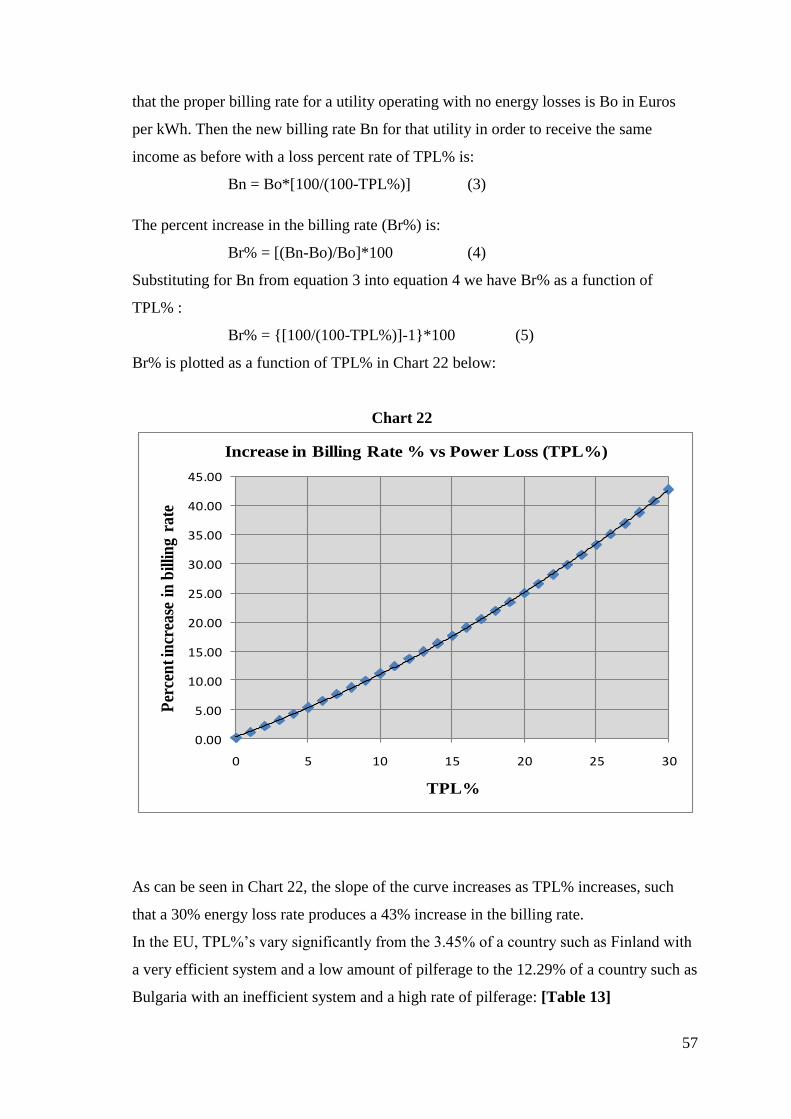
57
that the proper billing rate for a utility operating with no energy losses is Bo in Euros
per kWh. Then the new billing rate Bn for that utility in order to receive the same
income as before with a loss percent rate of TPL% is:
Bn = Bo*[100/(100-TPL%)] (3)
The percent increase in the billing rate (Br%) is:
Br% = [(Bn-Bo)/Bo]*100 (4)
Substituting for Bn from equation 3 into equation 4 we have Br% as a function of
TPL% :
Br% = {[100/(100-TPL%)]-1}*100 (5)
Br% is plotted as a function of TPL% in Chart 22 below:
Chart 22
0.00
5.00
10.00
15.00
20.00
25.00
30.00
35.00
40.00
45.00
0 5 10 15 20 25 30
Per
cen
t in
crea
se i
n b
illi
ng
ra
te
TPL%
Increase in Billing Rate % vs Power Loss (TPL%)
As can be seen in Chart 22, the slope of the curve increases as TPL% increases, such
that a 30% energy loss rate produces a 43% increase in the billing rate.
In the EU, TPL%‟s vary significantly from the 3.45% of a country such as Finland with
a very efficient system and a low amount of pilferage to the 12.29% of a country such as
Bulgaria with an inefficient system and a high rate of pilferage: [Table 13]
58
Transmission and Distribution Power Losses are the sum of two types of power
loss- Technical (TTPL) and non-Technical (NTTPL):
TPL% = TTPL% + NTTPL% (6)
Technical Transmission and Distribution Power Losses (TTPL) are power losses
caused by technical factors such as: Resistive heat losses in transmission and
distribution lines, transformers, and other equipment due to electrical resistance;
magnetic losses, where energy dissipates into a magnetic field; and the dielectric effect,
where energy is absorbed in the insulating material. In alternating current circuits, the
inductance and capacitance of the phase conductors can be significant. This causes
reactive currents which cause additional losses in the transmission circuits. TTPL can be
reduced and optimized by installing capacitors in key areas in order to improve the
power factor, transmission lines can be upgraded to a higher voltage in order to reduce
resistive heat losses, and more efficient transformers and other equipment can be
installed. In AC transmission systems efficiency can be improved by using transformers
to step up the voltage for transmission and then using transformers to step down the
voltage for final distribution to the end users. This reduces the electrical current in the
transmission conductors while keeping the power transmitted nearly equal to the power
input. According to Joule‟s Law (Q = I2*R*t) the energy losses are proportional to the
square of the current; reducing the current by a factor of two will lower energy lost to
conductive resistance by a factor of four. Long distance transmission (thousands of
kilometers) of electricity can be cheap and efficient. In the U.S. costs are US$0.005-
0.02/kWh. [4] It is impossible to eliminate all TTPL, however by the use of efficiently
designed systems and with equipment of high efficiency the losses can be minimized.
Non-Technical Transmission and Distribution Power Losses (NTTPL) are all
transmission and distribution losses which are not TTPL. The largest component of
NTTPL is pilferage. [5] The theft of electric power is a loss right off the top of the
revenue stream of the power company such that even a 1% theft loss, which is very low,
results in a serious bottom line loss. For example if the power company had profits of
5% of turnover, then even a 1% theft loss would cause a 20% profit loss and a 5% theft
loss would cause a 100% profit loss. Because of this leverage onto the bottom line,
those power companies that are privatized have put great effort into reducing theft
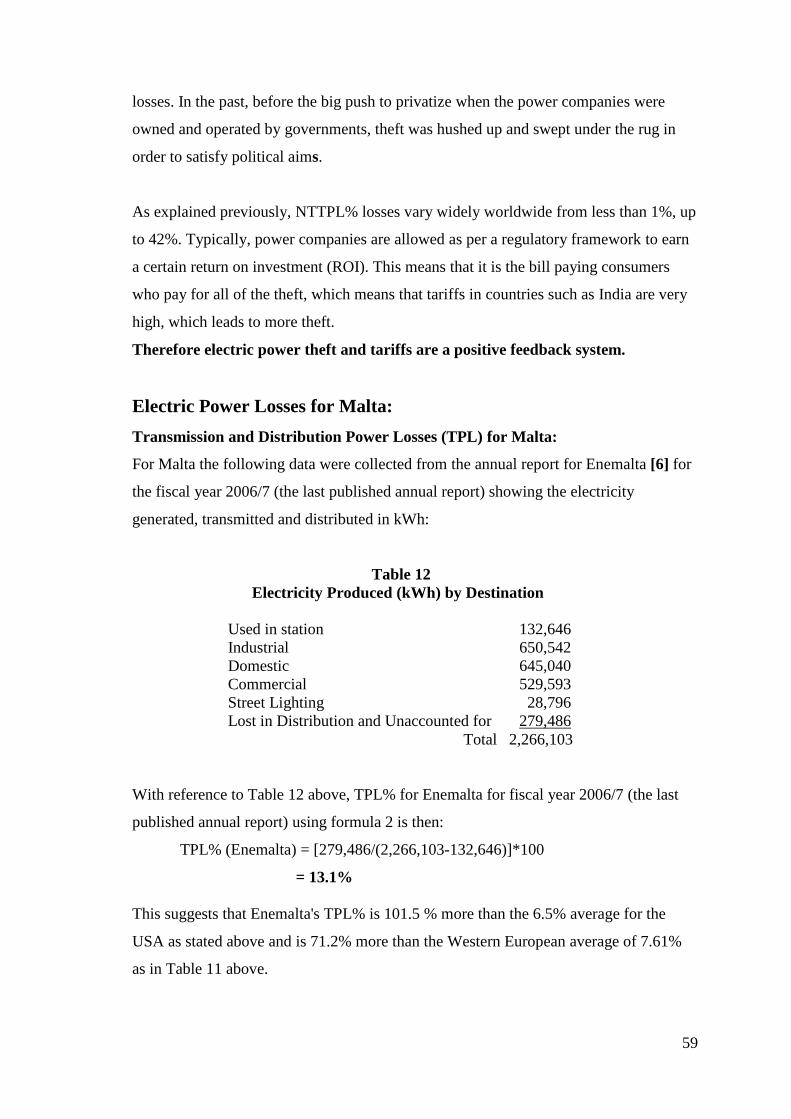
59
losses. In the past, before the big push to privatize when the power companies were
owned and operated by governments, theft was hushed up and swept under the rug in
order to satisfy political aims.
As explained previously, NTTPL% losses vary widely worldwide from less than 1%, up
to 42%. Typically, power companies are allowed as per a regulatory framework to earn
a certain return on investment (ROI). This means that it is the bill paying consumers
who pay for all of the theft, which means that tariffs in countries such as India are very
high, which leads to more theft.
Therefore electric power theft and tariffs are a positive feedback system.
Electric Power Losses for Malta:
Transmission and Distribution Power Losses (TPL) for Malta:
For Malta the following data were collected from the annual report for Enemalta [6] for
the fiscal year 2006/7 (the last published annual report) showing the electricity
generated, transmitted and distributed in kWh:
Table 12
Electricity Produced (kWh) by Destination
Used in station 132,646
Industrial 650,542
Domestic 645,040
Commercial 529,593
Street Lighting 28,796
Lost in Distribution and Unaccounted for 279,486
Total 2,266,103
With reference to Table 12 above, TPL% for Enemalta for fiscal year 2006/7 (the last
published annual report) using formula 2 is then:
TPL% (Enemalta) = [279,486/(2,266,103-132,646)]*100
= 13.1%
This suggests that Enemalta's TPL% is 101.5 % more than the 6.5% average for the
USA as stated above and is 71.2% more than the Western European average of 7.61%
as in Table 11 above.
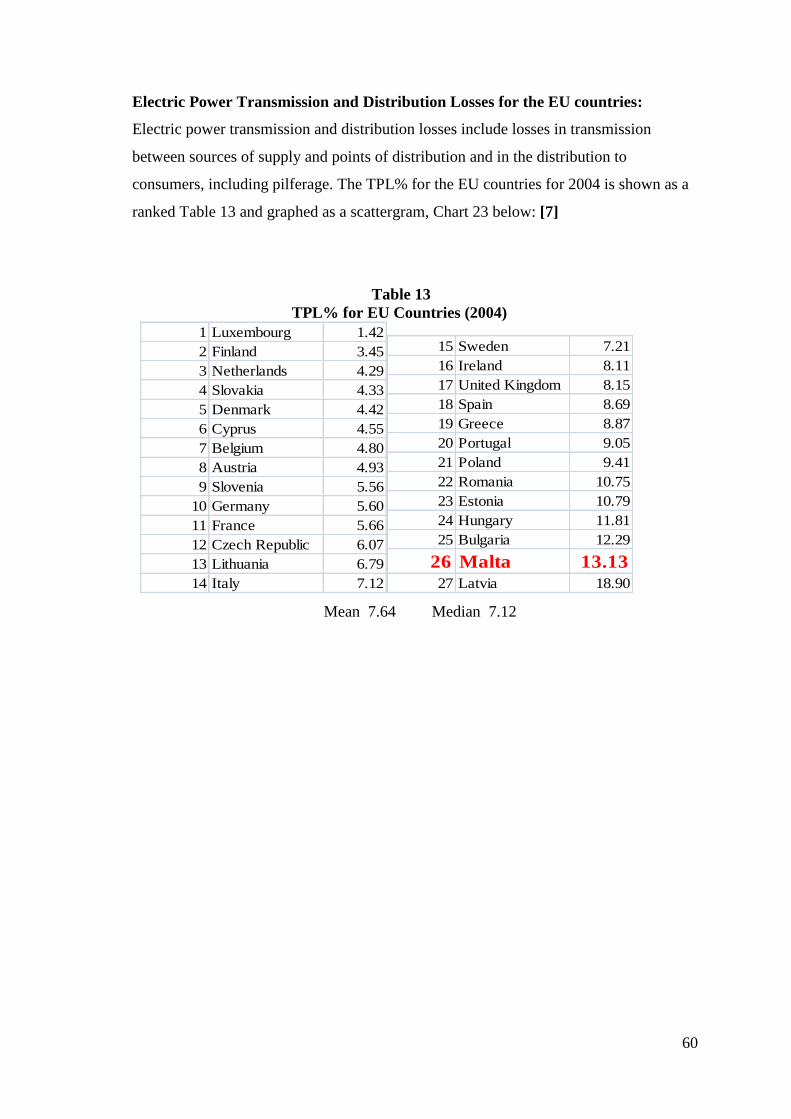
60
Electric Power Transmission and Distribution Losses for the EU countries:
Electric power transmission and distribution losses include losses in transmission
between sources of supply and points of distribution and in the distribution to
consumers, including pilferage. The TPL% for the EU countries for 2004 is shown as a
ranked Table 13 and graphed as a scattergram, Chart 23 below: [7]
Table 13
TPL% for EU Countries (2004)
1 Luxembourg 1.42
2 Finland 3.45
3 Netherlands 4.29
4 Slovakia 4.33
5 Denmark 4.42
6 Cyprus 4.55
7 Belgium 4.80
8 Austria 4.93
9 Slovenia 5.56
10 Germany 5.60
11 France 5.66
12 Czech Republic 6.07
13 Lithuania 6.79
14 Italy 7.12
15 Sweden 7.21
16 Ireland 8.11
17 United Kingdom 8.15
18 Spain 8.69
19 Greece 8.87
20 Portugal 9.05
21 Poland 9.41
22 Romania 10.75
23 Estonia 10.79
24 Hungary 11.81
25 Bulgaria 12.29
26 Malta 13.1327 Latvia 18.90
Mean 7.64 Median 7.12
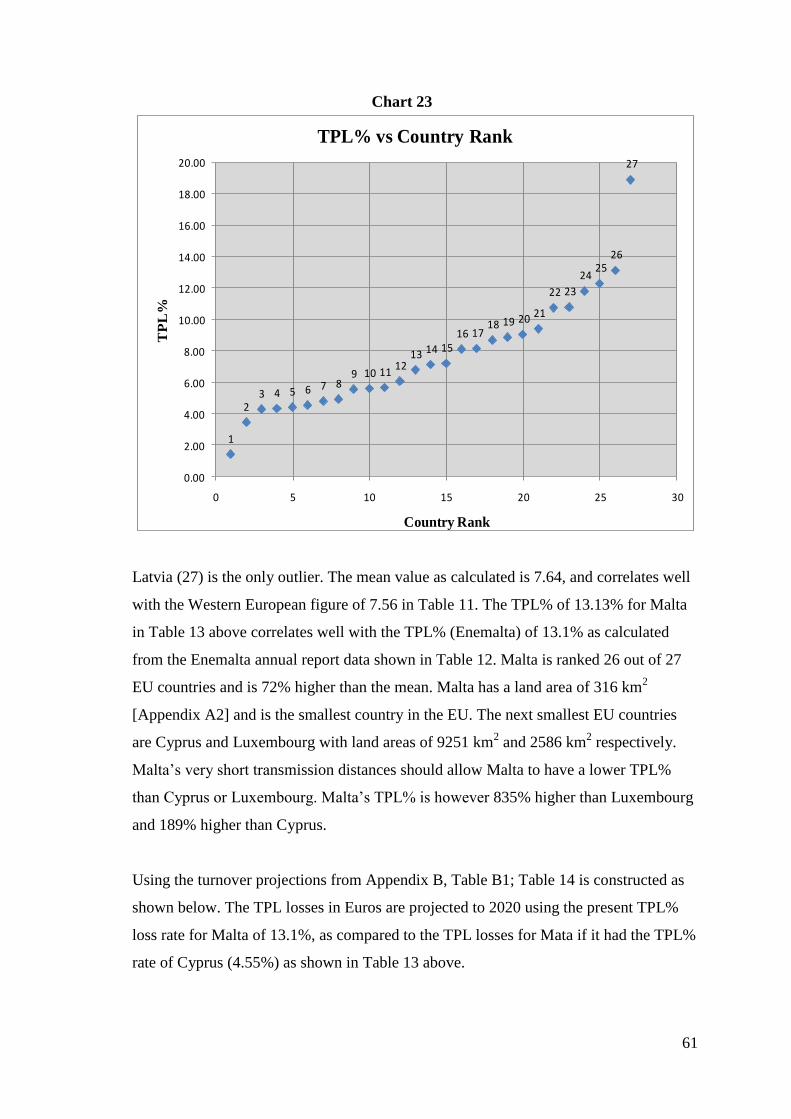
61
Chart 23
1
23 4 5 6 7 8
9 10 1112
13 14 1516 17
18 19 20 21
22 23
2425
26
27
0.00
2.00
4.00
6.00
8.00
10.00
12.00
14.00
16.00
18.00
20.00
0 5 10 15 20 25 30
TP
L%
Country Rank
TPL% vs Country Rank
Latvia (27) is the only outlier. The mean value as calculated is 7.64, and correlates well
with the Western European figure of 7.56 in Table 11. The TPL% of 13.13% for Malta
in Table 13 above correlates well with the TPL% (Enemalta) of 13.1% as calculated
from the Enemalta annual report data shown in Table 12. Malta is ranked 26 out of 27
EU countries and is 72% higher than the mean. Malta has a land area of 316 km2
[Appendix A2] and is the smallest country in the EU. The next smallest EU countries
are Cyprus and Luxembourg with land areas of 9251 km2 and 2586 km
2 respectively.
Malta‟s very short transmission distances should allow Malta to have a lower TPL%
than Cyprus or Luxembourg. Malta‟s TPL% is however 835% higher than Luxembourg
and 189% higher than Cyprus.
Using the turnover projections from Appendix B, Table B1; Table 14 is constructed as
shown below. The TPL losses in Euros are projected to 2020 using the present TPL%
loss rate for Malta of 13.1%, as compared to the TPL losses for Mata if it had the TPL%
rate of Cyprus (4.55%) as shown in Table 13 above.
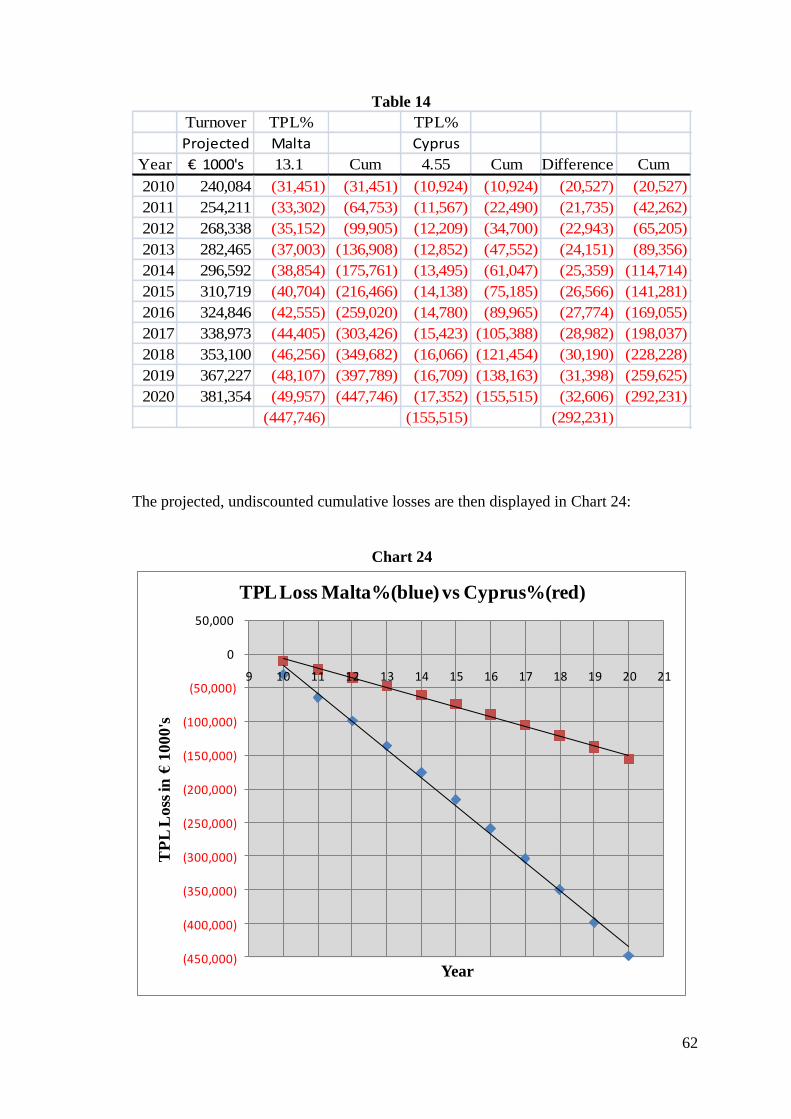
62
Table 14
Turnover TPL% TPL%
Projected Malta Cyprus
Year € 1000's 13.1 Cum 4.55 Cum Difference Cum
2010 240,084 (31,451) (31,451) (10,924) (10,924) (20,527) (20,527)
2011 254,211 (33,302) (64,753) (11,567) (22,490) (21,735) (42,262)
2012 268,338 (35,152) (99,905) (12,209) (34,700) (22,943) (65,205)
2013 282,465 (37,003) (136,908) (12,852) (47,552) (24,151) (89,356)
2014 296,592 (38,854) (175,761) (13,495) (61,047) (25,359) (114,714)
2015 310,719 (40,704) (216,466) (14,138) (75,185) (26,566) (141,281)
2016 324,846 (42,555) (259,020) (14,780) (89,965) (27,774) (169,055)
2017 338,973 (44,405) (303,426) (15,423) (105,388) (28,982) (198,037)
2018 353,100 (46,256) (349,682) (16,066) (121,454) (30,190) (228,228)
2019 367,227 (48,107) (397,789) (16,709) (138,163) (31,398) (259,625)
2020 381,354 (49,957) (447,746) (17,352) (155,515) (32,606) (292,231)
(447,746) (155,515) (292,231)
The projected, undiscounted cumulative losses are then displayed in Chart 24:
Chart 24
(450,000)
(400,000)
(350,000)
(300,000)
(250,000)
(200,000)
(150,000)
(100,000)
(50,000)
0
50,000
9 10 11 12 13 14 15 16 17 18 19 20 21
TP
L L
oss
in €
10
00
's
Year
TPL Loss Malta%(blue) vs Cyprus%(red)
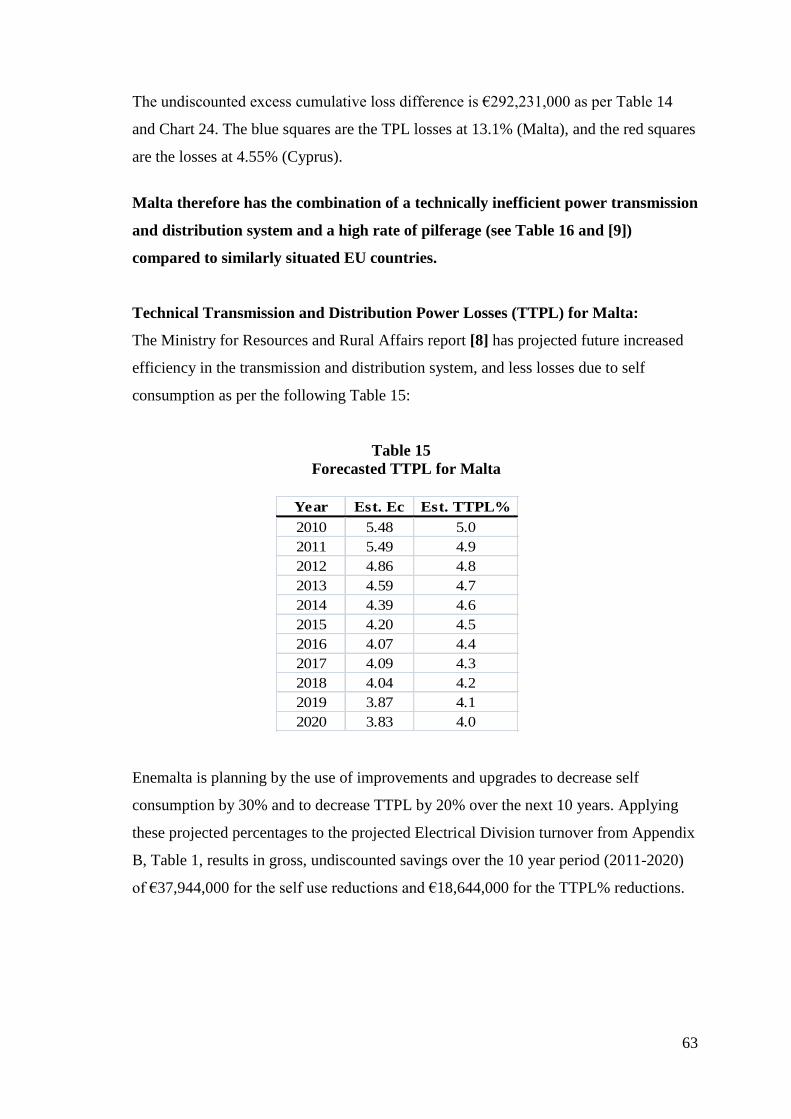
63
The undiscounted excess cumulative loss difference is €292,231,000 as per Table 14
and Chart 24. The blue squares are the TPL losses at 13.1% (Malta), and the red squares
are the losses at 4.55% (Cyprus).
Malta therefore has the combination of a technically inefficient power transmission
and distribution system and a high rate of pilferage (see Table 16 and [9])
compared to similarly situated EU countries.
Technical Transmission and Distribution Power Losses (TTPL) for Malta:
The Ministry for Resources and Rural Affairs report [8] has projected future increased
efficiency in the transmission and distribution system, and less losses due to self
consumption as per the following Table 15:
Table 15
Forecasted TTPL for Malta
Year Est. Ec Est. TTPL%
2010 5.48 5.0
2011 5.49 4.9
2012 4.86 4.8
2013 4.59 4.7
2014 4.39 4.6
2015 4.20 4.5
2016 4.07 4.4
2017 4.09 4.3
2018 4.04 4.2
2019 3.87 4.1
2020 3.83 4.0
Enemalta is planning by the use of improvements and upgrades to decrease self
consumption by 30% and to decrease TTPL by 20% over the next 10 years. Applying
these projected percentages to the projected Electrical Division turnover from Appendix
B, Table 1, results in gross, undiscounted savings over the 10 year period (2011-2020)
of €37,944,000 for the self use reductions and €18,644,000 for the TTPL% reductions.
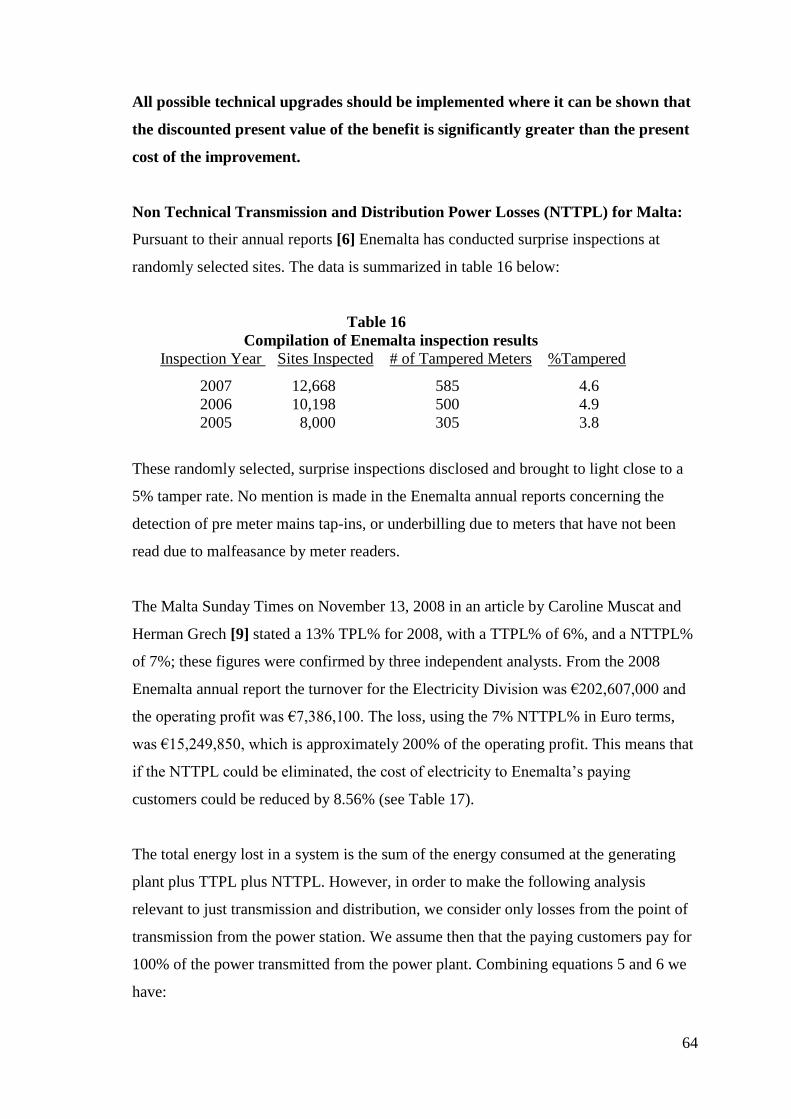
64
All possible technical upgrades should be implemented where it can be shown that
the discounted present value of the benefit is significantly greater than the present
cost of the improvement.
Non Technical Transmission and Distribution Power Losses (NTTPL) for Malta:
Pursuant to their annual reports [6] Enemalta has conducted surprise inspections at
randomly selected sites. The data is summarized in table 16 below:
Table 16
Compilation of Enemalta inspection results
Inspection Year Sites Inspected # of Tampered Meters %Tampered
2007 12,668 585 4.6
2006 10,198 500 4.9
2005 8,000 305 3.8
These randomly selected, surprise inspections disclosed and brought to light close to a
5% tamper rate. No mention is made in the Enemalta annual reports concerning the
detection of pre meter mains tap-ins, or underbilling due to meters that have not been
read due to malfeasance by meter readers.
The Malta Sunday Times on November 13, 2008 in an article by Caroline Muscat and
Herman Grech [9] stated a 13% TPL% for 2008, with a TTPL% of 6%, and a NTTPL%
of 7%; these figures were confirmed by three independent analysts. From the 2008
Enemalta annual report the turnover for the Electricity Division was €202,607,000 and
the operating profit was €7,386,100. The loss, using the 7% NTTPL% in Euro terms,
was €15,249,850, which is approximately 200% of the operating profit. This means that
if the NTTPL could be eliminated, the cost of electricity to Enemalta‟s paying
customers could be reduced by 8.56% (see Table 17).
The total energy lost in a system is the sum of the energy consumed at the generating
plant plus TTPL plus NTTPL. However, in order to make the following analysis
relevant to just transmission and distribution, we consider only losses from the point of
transmission from the power station. We assume then that the paying customers pay for
100% of the power transmitted from the power plant. Combining equations 5 and 6 we
have:
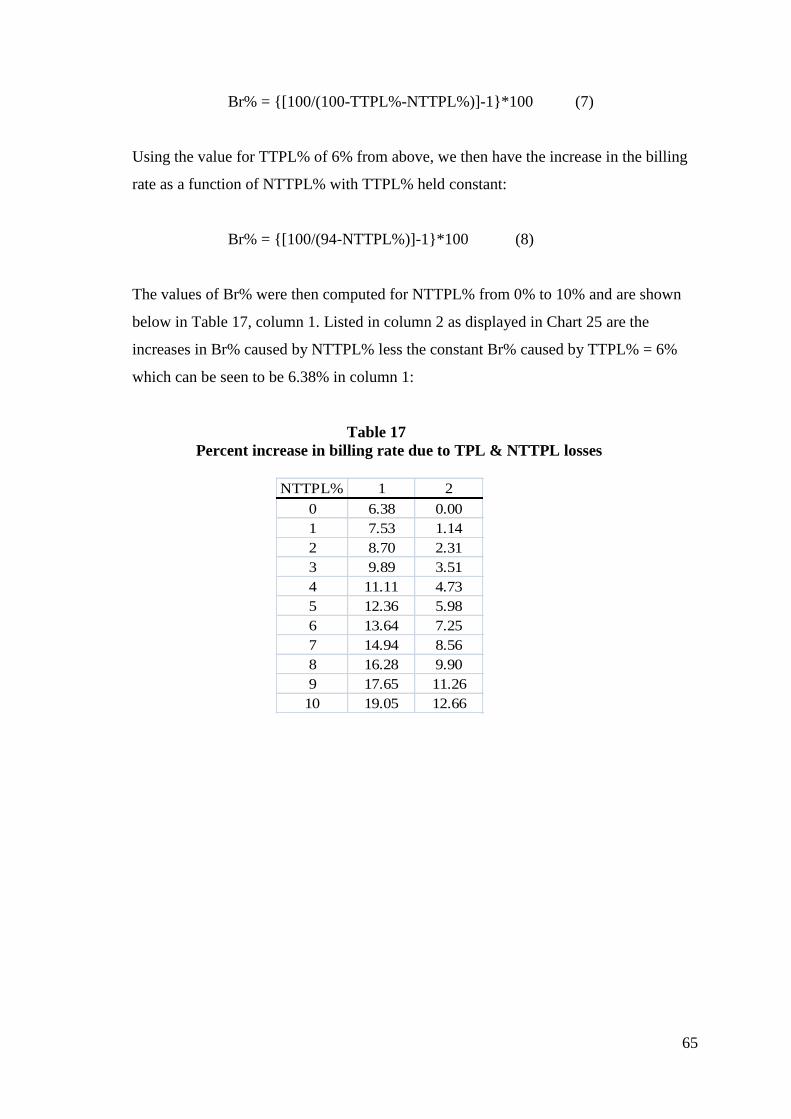
65
Br% = {[100/(100-TTPL%-NTTPL%)]-1}*100 (7)
Using the value for TTPL% of 6% from above, we then have the increase in the billing
rate as a function of NTTPL% with TTPL% held constant:
Br% = {[100/(94-NTTPL%)]-1}*100 (8)
The values of Br% were then computed for NTTPL% from 0% to 10% and are shown
below in Table 17, column 1. Listed in column 2 as displayed in Chart 25 are the
increases in Br% caused by NTTPL% less the constant Br% caused by TTPL% = 6%
which can be seen to be 6.38% in column 1:
Table 17
Percent increase in billing rate due to TPL & NTTPL losses
NTTPL% 1 2
0 6.38 0.00
1 7.53 1.14
2 8.70 2.31
3 9.89 3.51
4 11.11 4.73
5 12.36 5.98
6 13.64 7.25
7 14.94 8.56
8 16.28 9.90
9 17.65 11.26
10 19.05 12.66
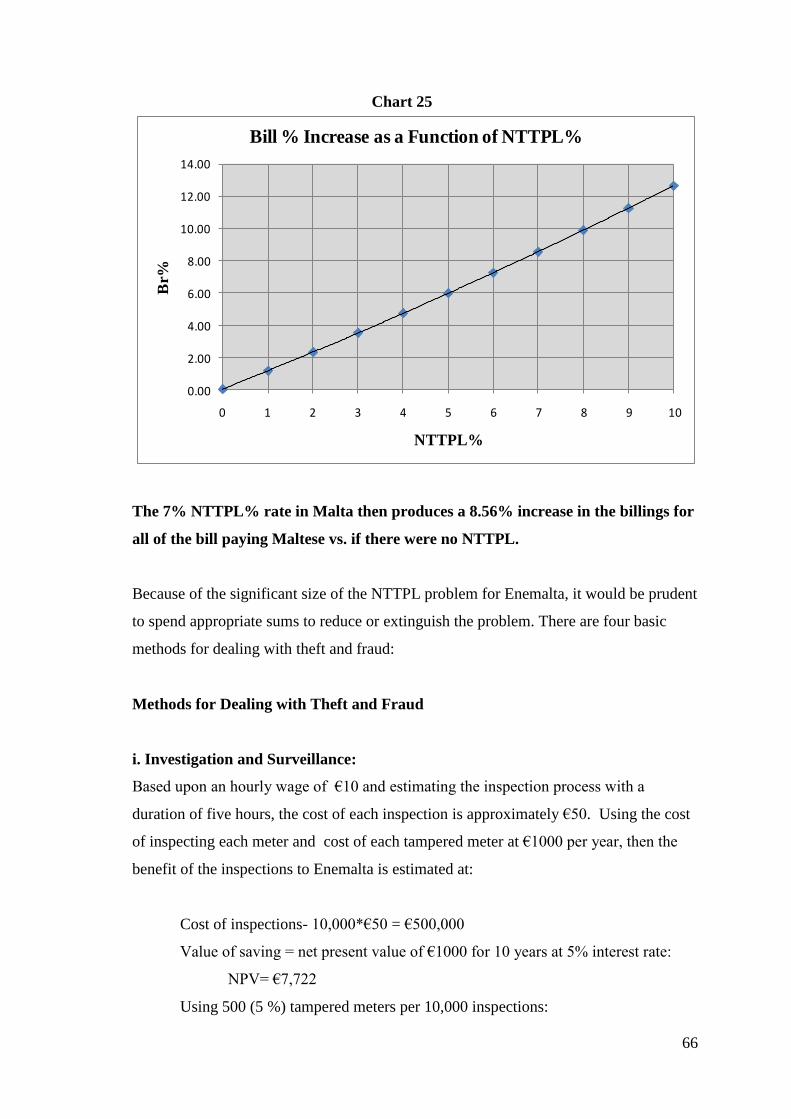
66
Chart 25
0.00
2.00
4.00
6.00
8.00
10.00
12.00
14.00
0 1 2 3 4 5 6 7 8 9 10
Br%
NTTPL%
Bill % Increase as a Function of NTTPL%
The 7% NTTPL% rate in Malta then produces a 8.56% increase in the billings for
all of the bill paying Maltese vs. if there were no NTTPL.
Because of the significant size of the NTTPL problem for Enemalta, it would be prudent
to spend appropriate sums to reduce or extinguish the problem. There are four basic
methods for dealing with theft and fraud:
Methods for Dealing with Theft and Fraud
i. Investigation and Surveillance:
Based upon an hourly wage of €10 and estimating the inspection process with a
duration of five hours, the cost of each inspection is approximately €50. Using the cost
of inspecting each meter and cost of each tampered meter at €1000 per year, then the
benefit of the inspections to Enemalta is estimated at:
Cost of inspections- 10,000*€50 = €500,000
Value of saving = net present value of €1000 for 10 years at 5% interest rate:
NPV= €7,722
Using 500 (5 %) tampered meters per 10,000 inspections:
67
= €7,722*500
= €3,861,000
Profit from each 10,000 inspections = €3,861,000 -€500,000
= €3,361,000
If these assumptions are close to reality then it is imperative that this profit
potential be harvested by greatly increasing the number of inspections.
ii. Technical Methods:
The installation of new smart meters will not only eliminate meter tampering which is
quite easy with the present electro-mechanical meters [9], but will also provide real time
information in order to implement real time energy balance and expedite the integration
of all billing and accounting functions. Algorithms will be used to detect illegal loads
almost immediately and narrow the investigation to just one user. A great deal of effort
is presently being undertaken by utilities worldwide to detect theft and fraud in energy
systems through the use of Artificial Neural Networks, Support Vector Machines, and
other computer systems [10]. The elimination of meter tampering is a big step, but it
does not solve the problem of tapping into the mains before the meter. The computer
oriented systems mentioned above will hopefully help in this regard. It will be very
difficult to detect theft when the mains are already tapped into in order to provide free
energy for only part of a user‟s needs leaving the rest on the meter. It must be
anticipated that smart thieves will obtain information concerning the detection
algorithms and will design their theft accordingly.
The Smart Grid is estimated to cost €71,000,000 [11]. The following is an estimate of
the value of this system from the standpoint of the meter theft savings alone. We assume
that the Smart System will reduce meter theft from 5% to 1%, and that the total gross
revenue stream to the Electric Division of Enemalta is € 3,417,909,000 over the 11 year
period 2010-2020 (from Table B1 Appendix B). The gross undiscounted savings due to
the reduction in meter theft over the 11 year period is then € 136,716,000. The
discounted net present value of the 4% savings stream at a 6% use of money rate is
€95,445,000. This means that the entire cost of the Smart Grid can be recaptured
from theft loss savings alone.
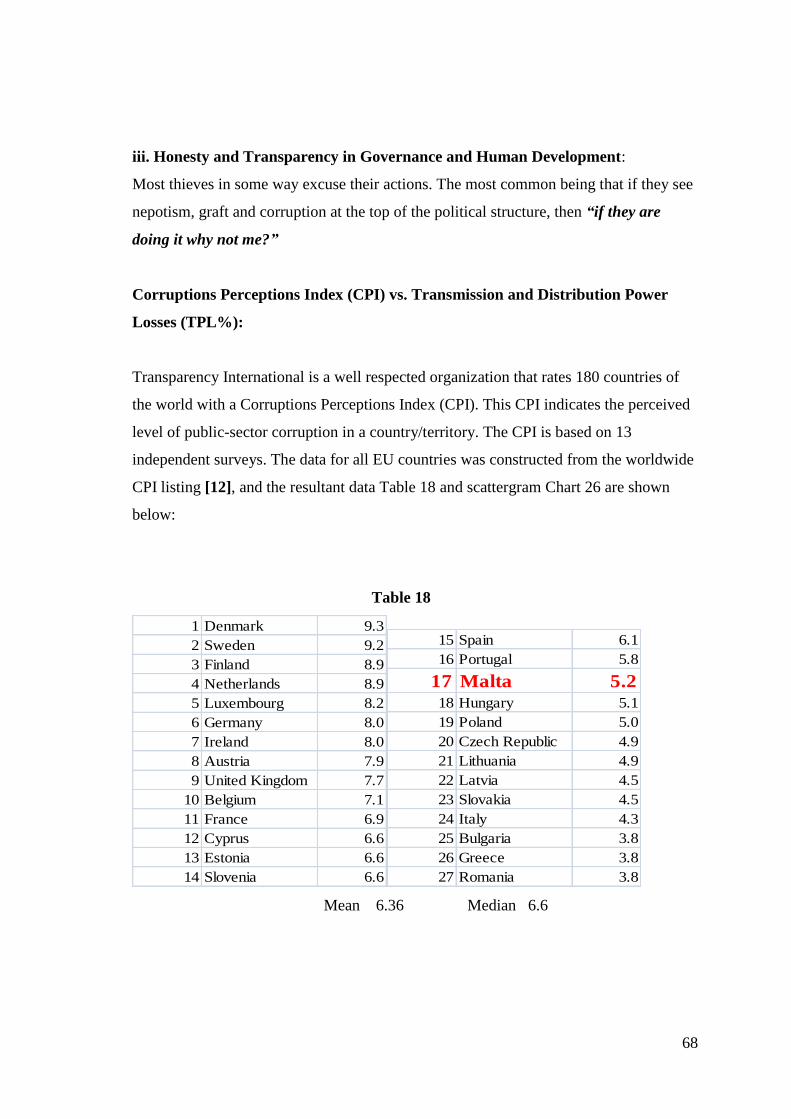
68
iii. Honesty and Transparency in Governance and Human Development:
Most thieves in some way excuse their actions. The most common being that if they see
nepotism, graft and corruption at the top of the political structure, then “if they are
doing it why not me?”
Corruptions Perceptions Index (CPI) vs. Transmission and Distribution Power
Losses (TPL%):
Transparency International is a well respected organization that rates 180 countries of
the world with a Corruptions Perceptions Index (CPI). This CPI indicates the perceived
level of public-sector corruption in a country/territory. The CPI is based on 13
independent surveys. The data for all EU countries was constructed from the worldwide
CPI listing [12], and the resultant data Table 18 and scattergram Chart 26 are shown
below:
Table 18
1 Denmark 9.3
2 Sweden 9.2
3 Finland 8.9
4 Netherlands 8.9
5 Luxembourg 8.2
6 Germany 8.0
7 Ireland 8.0
8 Austria 7.9
9 United Kingdom 7.7
10 Belgium 7.1
11 France 6.9
12 Cyprus 6.6
13 Estonia 6.6
14 Slovenia 6.6
15 Spain 6.1
16 Portugal 5.8
17 Malta 5.218 Hungary 5.1
19 Poland 5.0
20 Czech Republic 4.9
21 Lithuania 4.9
22 Latvia 4.5
23 Slovakia 4.5
24 Italy 4.3
25 Bulgaria 3.8
26 Greece 3.8
27 Romania 3.8
Mean 6.36 Median 6.6
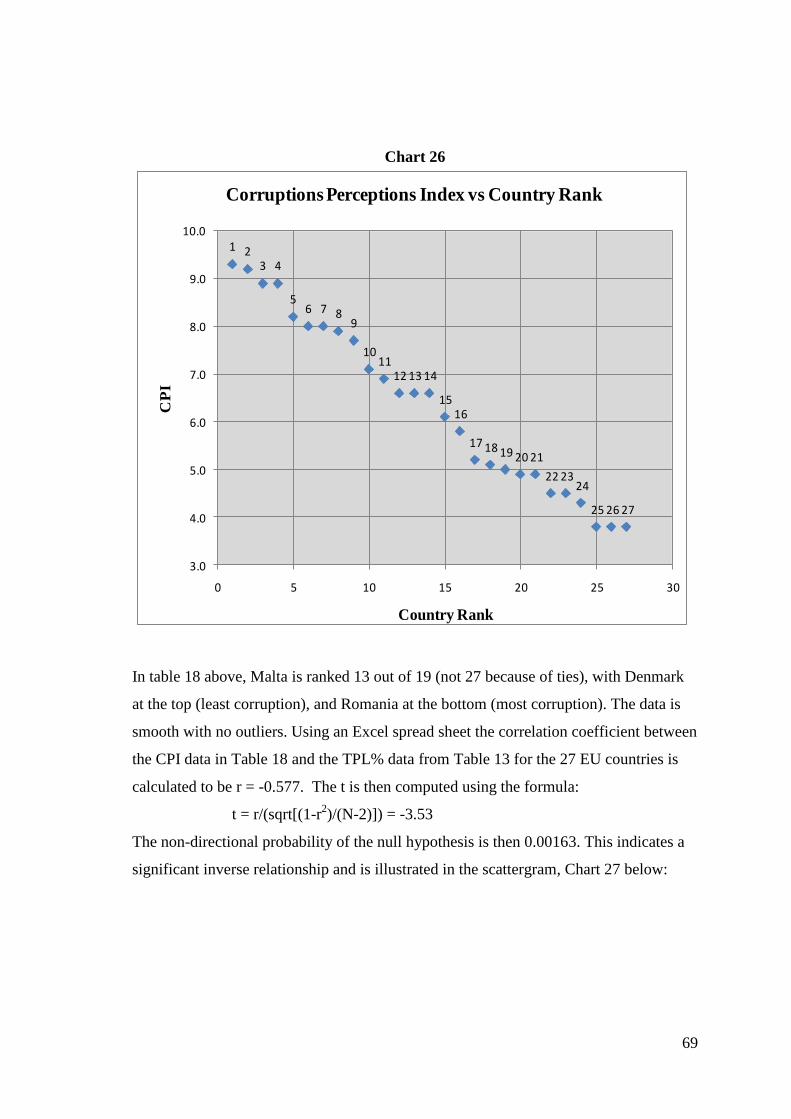
69
Chart 26
1 23 4
56 7 8
9
1011
12 13 14
1516
17 18 19 20 21
22 2324
25 26 27
3.0
4.0
5.0
6.0
7.0
8.0
9.0
10.0
0 5 10 15 20 25 30
CP
I
Country Rank
Corruptions Perceptions Index vs Country Rank
In table 18 above, Malta is ranked 13 out of 19 (not 27 because of ties), with Denmark
at the top (least corruption), and Romania at the bottom (most corruption). The data is
smooth with no outliers. Using an Excel spread sheet the correlation coefficient between
the CPI data in Table 18 and the TPL% data from Table 13 for the 27 EU countries is
calculated to be r = -0.577. The t is then computed using the formula:
t = r/(sqrt[(1-r2)/(N-2)]) = -3.53
The non-directional probability of the null hypothesis is then 0.00163. This indicates a
significant inverse relationship and is illustrated in the scattergram, Chart 27 below:
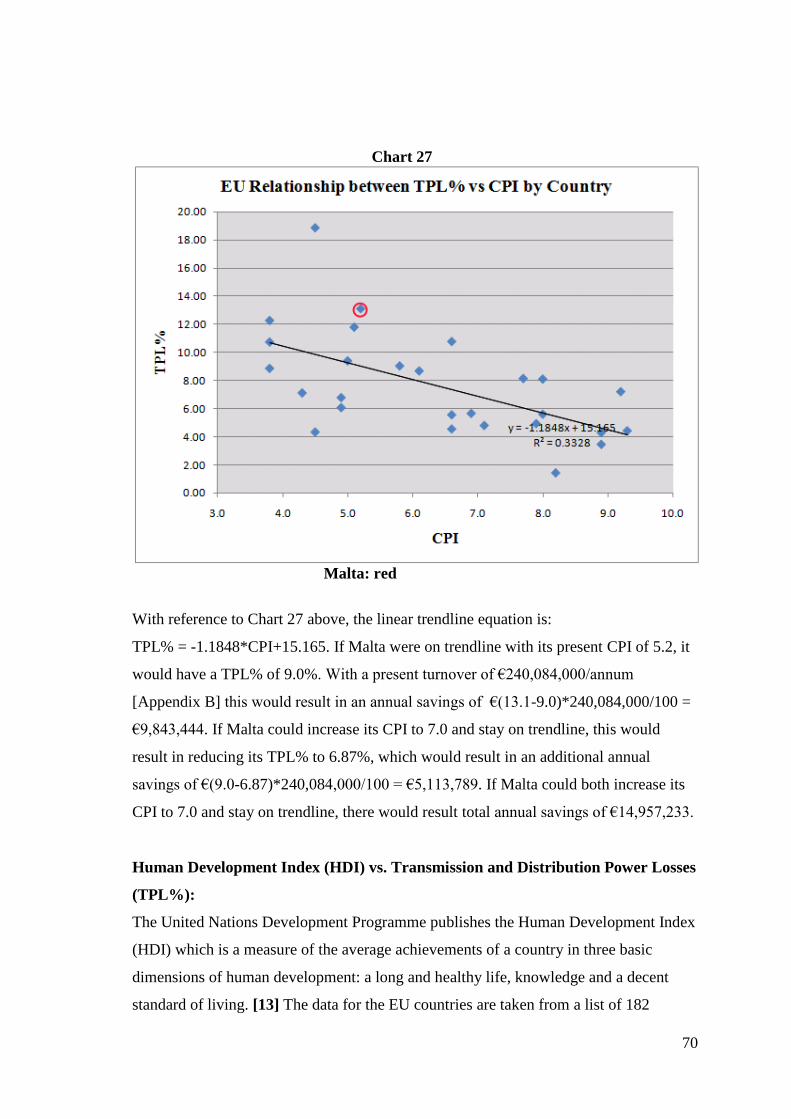
70
Chart 27
Malta: red
With reference to Chart 27 above, the linear trendline equation is:
TPL% = -1.1848*CPI+15.165. If Malta were on trendline with its present CPI of 5.2, it
would have a TPL% of 9.0%. With a present turnover of €240,084,000/annum
[Appendix B] this would result in an annual savings of €(13.1-9.0)*240,084,000/100 =
€9,843,444. If Malta could increase its CPI to 7.0 and stay on trendline, this would
result in reducing its TPL% to 6.87%, which would result in an additional annual
savings of €(9.0-6.87)*240,084,000/100 = €5,113,789. If Malta could both increase its
CPI to 7.0 and stay on trendline, there would result total annual savings of €14,957,233.
Human Development Index (HDI) vs. Transmission and Distribution Power Losses
(TPL%):
The United Nations Development Programme publishes the Human Development Index
(HDI) which is a measure of the average achievements of a country in three basic
dimensions of human development: a long and healthy life, knowledge and a decent
standard of living. [13] The data for the EU countries are taken from a list of 182
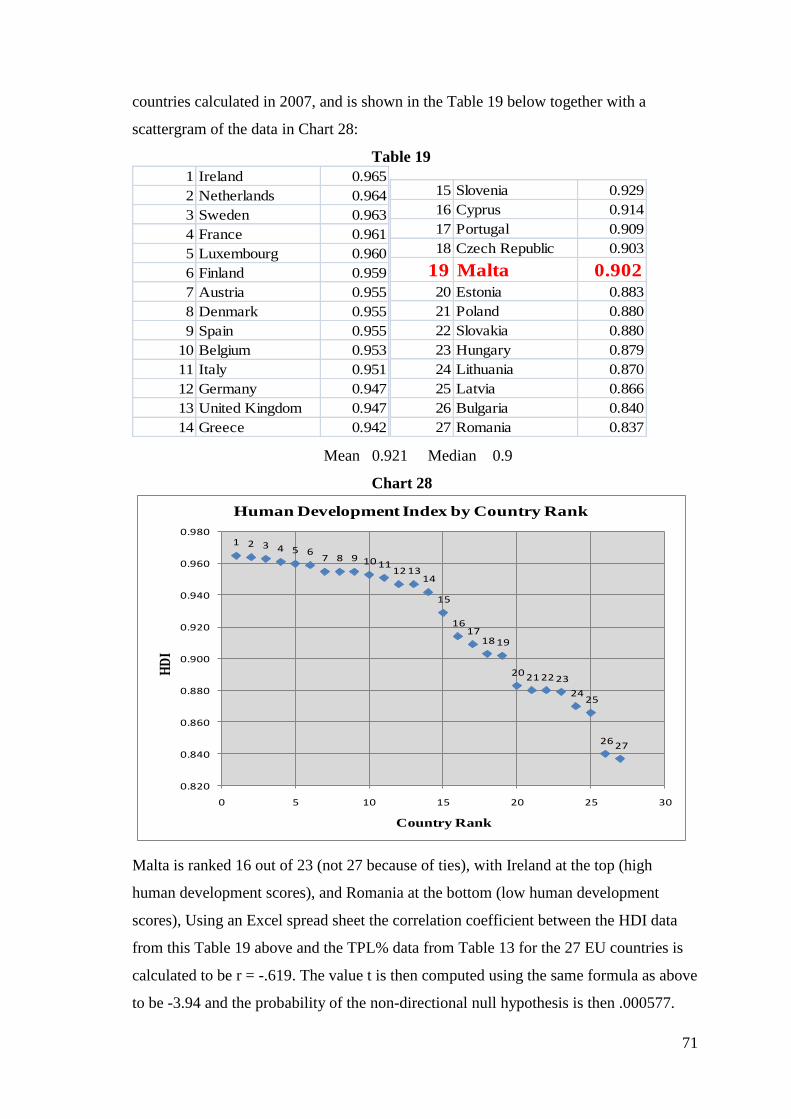
71
countries calculated in 2007, and is shown in the Table 19 below together with a
scattergram of the data in Chart 28:
Table 19
1 Ireland 0.965
2 Netherlands 0.964
3 Sweden 0.963
4 France 0.961
5 Luxembourg 0.960
6 Finland 0.959
7 Austria 0.955
8 Denmark 0.955
9 Spain 0.955
10 Belgium 0.953
11 Italy 0.951
12 Germany 0.947
13 United Kingdom 0.947
14 Greece 0.942
15 Slovenia 0.929
16 Cyprus 0.914
17 Portugal 0.909
18 Czech Republic 0.903
19 Malta 0.90220 Estonia 0.883
21 Poland 0.880
22 Slovakia 0.880
23 Hungary 0.879
24 Lithuania 0.870
25 Latvia 0.866
26 Bulgaria 0.840
27 Romania 0.837
Mean 0.921 Median 0.9
Chart 28
1 2 3 4 5 67 8 9 10 11
12 1314
15
1617
18 19
20 21 22 23
2425
26 27
0.820
0.840
0.860
0.880
0.900
0.920
0.940
0.960
0.980
0 5 10 15 20 25 30
HD
I
Country Rank
Human Development Index by Country Rank
Malta is ranked 16 out of 23 (not 27 because of ties), with Ireland at the top (high
human development scores), and Romania at the bottom (low human development
scores), Using an Excel spread sheet the correlation coefficient between the HDI data
from this Table 19 above and the TPL% data from Table 13 for the 27 EU countries is
calculated to be r = -.619. The value t is then computed using the same formula as above
to be -3.94 and the probability of the non-directional null hypothesis is then .000577.
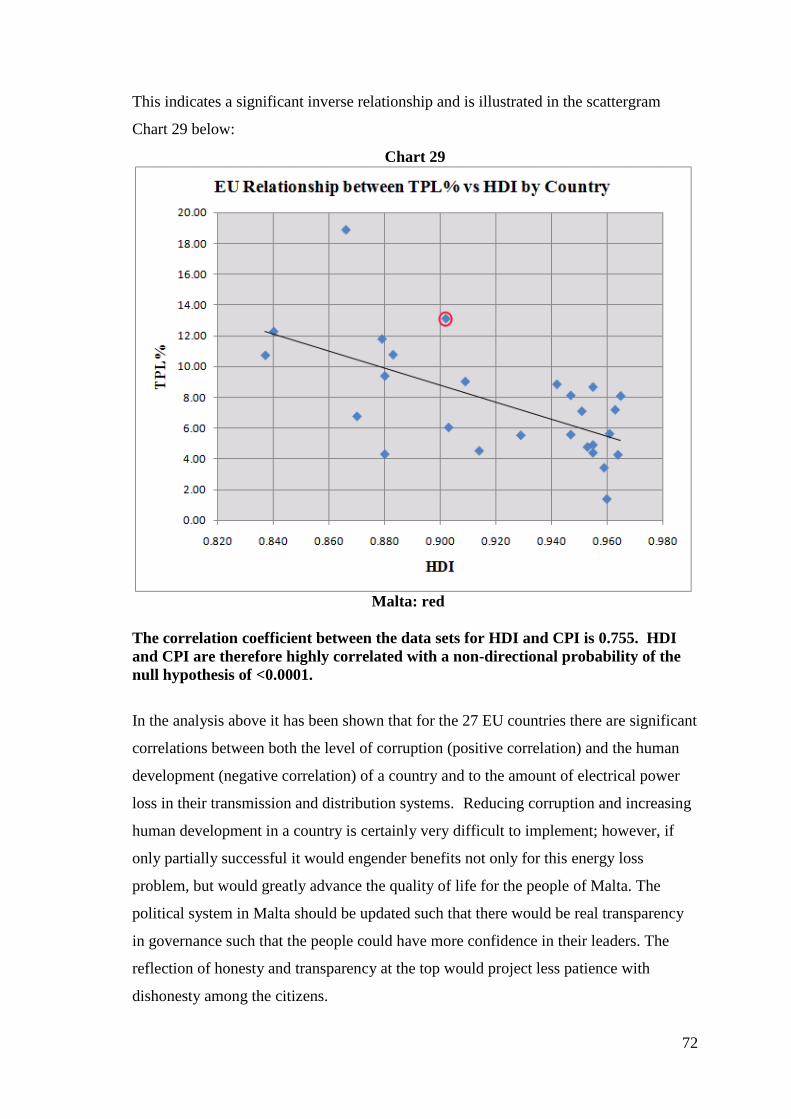
72
This indicates a significant inverse relationship and is illustrated in the scattergram
Chart 29 below:
Chart 29
Malta: red
The correlation coefficient between the data sets for HDI and CPI is 0.755. HDI
and CPI are therefore highly correlated with a non-directional probability of the
null hypothesis of <0.0001.
In the analysis above it has been shown that for the 27 EU countries there are significant
correlations between both the level of corruption (positive correlation) and the human
development (negative correlation) of a country and to the amount of electrical power
loss in their transmission and distribution systems. Reducing corruption and increasing
human development in a country is certainly very difficult to implement; however, if
only partially successful it would engender benefits not only for this energy loss
problem, but would greatly advance the quality of life for the people of Malta. The
political system in Malta should be updated such that there would be real transparency
in governance such that the people could have more confidence in their leaders. The
reflection of honesty and transparency at the top would project less patience with
dishonesty among the citizens.
73
iv. Public Relations Programs:
It is recommended that Enemalta spend at least €3,000,000 per year on a public
relations program to explain to the Maltese people that a theft from Enemalta is not a
theft from some foreign entity, but is a theft from the people of Malta who pay their
bills. Church and other ethical teachers would be enlisted and supported to convey the
message that electricity theft is just as wrong as for example stealing a car. Success with
these measures will add much needed financial strength to Enemalta, which will be of
vital importance in fulfilling Malta‟s future energy needs.
An International Utilities Revenue Protection Association (IURPA) has been
established to promote the detection and prevention of power theft. (1) website-
http://www.iurpa.org. They have regional revenue protection groups, but the United
Kingdom is the only EU country that has formed a regional group- website-
http://www.ukrpa.co.uk. Malta should perhaps form a regional protective group.
2. Interconnectors versus the addition of Local Production Capacity
(Delimara Extension)
In this paper we have identified the need for additional power capacity in addition to
that which is already planned (in the section Energy Shortfall). It is important to identify
the best option for this additional capacity. By choosing the best option for this
additional capacity in order to achieve the “20-20-20” goals, it will make the eventual
complete transition to a renewable base that much easier.
The reason why renewable production is not considered a viable option for expansion of
base load capacity is due to the variability in their electrical outputs. A base load
capacity source must be consistent in that if it is a 150 MW source then it must be able
to produce at full capacity within a few hours. In order for a wind farm to guarantee 150
MW of production it would have to be over 1500 MW (Mott Macdonald 2009) which is
simply not viable for the Maltese Islands. Solar sources also cannot be considered since
their production essentially stops during the night. Therefore, until an efficient means of
storing electrical energy in very large quantities is developed, renewable sources cannot
be considered as alternatives for base load or emergency power production capacity.
The viable options for expansion of Malta‟s electrical capacity are either:
74
i. Expansion of local non-renewable capacity
ii. Undersea interconnections
The Delimara Extension has been promoted by the Maltese government and Enemalta
as the best option for expansion of local power production, and therefore will be used as
an analogue for the best option for expansion of local capacity. The Malta-Sicily
interconnection was billed as the best option for interconnection and therefore will be
used as an analogue for the best option for interconnection.
The criteria for choosing the best option will include economics, environmental impact
and reliability. No recent study has been performed which compares the relative merits
of the two options, so derivations and a certain amount of assumptions (which will be
explained) had to be made in order to produce meaningful results.
i. The Delimara Power Extension
Planned Expansions to Existing Non-Renewable Production Infrastructure
The Delimara expansion is a 144 MW combined cycle diesel set of 8 x 18 MW piston
engines and one 10 MW steam turbine which will have operating efficiencies of up to
55%, compared to an average of 28% operating efficiency of other steam and gas units.
The Danish company BSWC (Burmeister and Wain Scandinavian Contractor A/S) was
awarded the contract for the construction and five year maintenance contract of the
extension for a total cost to Enemalta of €183 million. This project is expected to be
completed in 2011. [1]
The cost of electrical energy generation with the BWSC diesel engines, factoring in
current fuel prices is expected to be €c12.467 per kWh. CO2 emissions generated by
diesel engines are 0.5894kg / kWh whilst CO2 emissions generated by gas engines are
0.5605kg / kWh, making the difference negligible. [1]
According to Enemalta, the Delimara power extension would result in a total reduction
of dust emissions, reduce the annual emissions of CO2 by 470,000 tons, NOx by 2,300
tons and SO2 by 6,300 tons due to abatement technology and high efficiency equipment.
Additionally annual fuel consumption would be reduced by 218,000 tons. [2]
75
Unfortunately with the addition of a “confidentiality clause” within the BWSC /
Enemalta contract, more detailed information concerning the project cannot be found,
and statistics have to be taken at face value as provided by Enemalta. The
confidentiality clause includes a provision that would cost Malta a significant amount in
fines should details of the contract circulate without permission from BSWC. Such a
confidentiality clause is unprecedented for the construction of a power generation
facility in Malta (and anywhere else for that matter) and its inclusion has given rise to
much public criticism regarding the project. [3] [4]
Criticism of the project:
The Labour Party opposition and the public have voiced criticism of the project on
multiple occasions. They have expressed the opinion that Enemalta should have pursued
gas-fired technology and that the use of heavy fuel oil will be detrimental to public
health.
A University of Malta Department of Physics Professor, Edward Mallia had urged not
to use HFO (Heavy Fuel Oil) in the extension since Malta does not have the
infrastructure to dispose of the estimated 14,000 ton/year toxic sludge byproduct created
by the burning process. The waste would have to be transported away from the facility,
which according to the original Environmental Impact Assessment (EIA) could cost up
to €12 million per year. [5] [6]
ii. The Malta-Sicily Interconnection:
In 2010 the contractor ABB was chosen to install a submarine interconnector between
Malta and Sicily, as well as the auxiliary power infrastructure. The cable system will be
a “high voltage AC three-core submarine XLPE cable operated at 220 kV”. [7]
The landing points are Pembroke in Malta and Marina di Ragusa in Sicily as can be
seen in the figure below of the proposed 95 km submarine cable route.
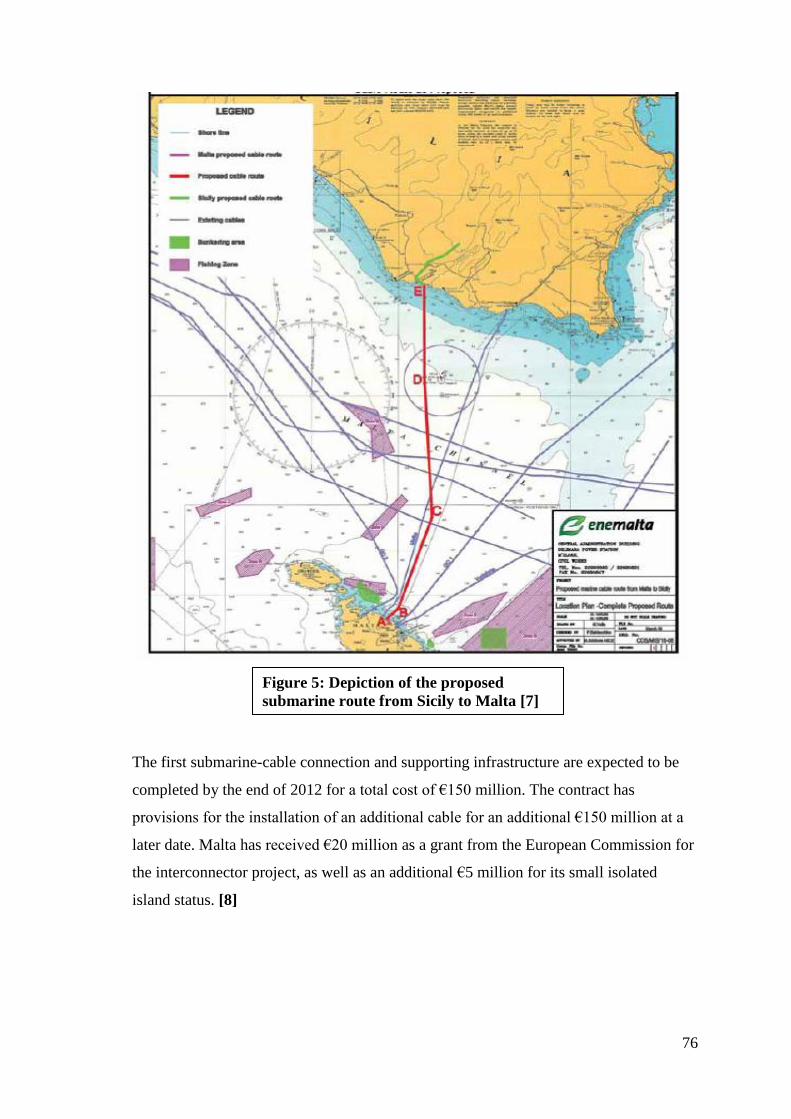
76
The first submarine-cable connection and supporting infrastructure are expected to be
completed by the end of 2012 for a total cost of €150 million. The contract has
provisions for the installation of an additional cable for an additional €150 million at a
later date. Malta has received €20 million as a grant from the European Commission for
the interconnector project, as well as an additional €5 million for its small isolated
island status. [8]
Figure 5: Depiction of the proposed
submarine route from Sicily to Malta [7]
77
Directly from the 2009 tender:
“i. All equipment shall be sized so that each interconnector can continuously
deliver approximately 250MVA at the receiving end at power factors ranging
between 0.95 leading and 0.95 lagging in any direction at an ambient temperature
of 45°C
ii. In case of an emergency the interconnectors shall be able to transmit an
overload of 70-80% for 1 hour even if the system is loaded at 90%, without
exceeding allowable temperatures and without causing any damage to the
equipment” [7]
Bidders did not meet all the specifications of the 2009 tender and so a new revised
tender was issued in 2010 which included slight changes. One of these changes is that
the requirement is for the cable to be able to transmit 200 MW of power at a capacity
factor of 0.95. The average losses across the cable and system infrastructure is expected
to be in the range of 4-7% and the cable is expected to have an operational lifespan of
25-40 years at which point in time it will have to be replaced. [9]
Power would be purchased by Enemalta from the Italian Electricity Market or GME
(Gestore dei Mercati Energetici) which is freely traded and operates in real time. GME
is divided into Italian geographical sectors with Sicily accounting for one of these.
Electricity prices in Sicily are typically higher than they are in Southern Italy but Terna
(an Italian Electricity Distributor) and other companies are expecting to expand the
capacity of the connection from Sicily to the Italian main land and thus reduce Sicilian
market prices.
Sicily has two power transmission grids. The 220 kV grid is not sufficiently developed
for handling the forecast demand increases while the 380 kV grid is not a complete ring
which means that any fault on the line would disrupt the entire network. Significant
strengthening of the transmission grid is underway and a completion of the 380 kV grid
is expected in the next few years.
In 2007 Sicily obtained over 7% of its energy supply from renewable sources (703 MW
capacity from hydropower, 854.2MW from wind and 1.5 from photo voltaics). This
large renewables base coupled with a high capacity of conventional thermal, means that
Sicily is a net exporter of electricity and in 2007 exported 1.4 GWh of electricity to the
Italian mainland via a single 380 kV submarine interconnection. With a number of
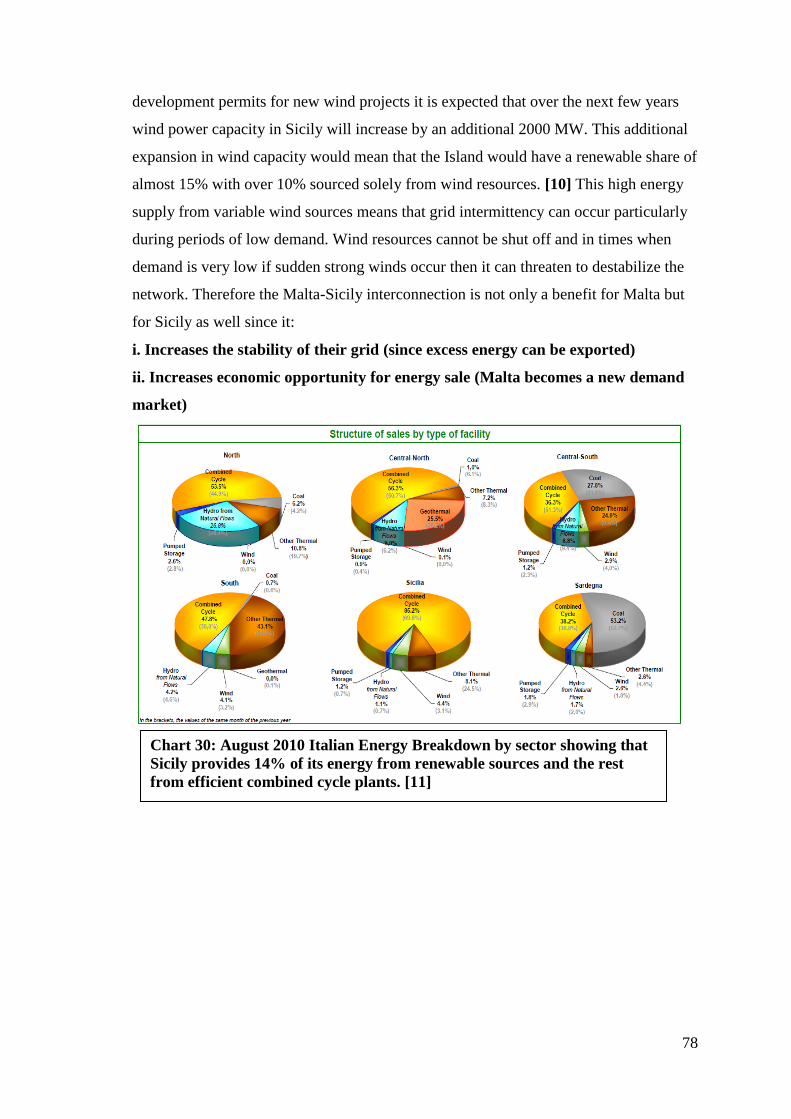
78
development permits for new wind projects it is expected that over the next few years
wind power capacity in Sicily will increase by an additional 2000 MW. This additional
expansion in wind capacity would mean that the Island would have a renewable share of
almost 15% with over 10% sourced solely from wind resources. [10] This high energy
supply from variable wind sources means that grid intermittency can occur particularly
during periods of low demand. Wind resources cannot be shut off and in times when
demand is very low if sudden strong winds occur then it can threaten to destabilize the
network. Therefore the Malta-Sicily interconnection is not only a benefit for Malta but
for Sicily as well since it:
i. Increases the stability of their grid (since excess energy can be exported)
ii. Increases economic opportunity for energy sale (Malta becomes a new demand
market)
Chart 30: August 2010 Italian Energy Breakdown by sector showing that
Sicily provides 14% of its energy from renewable sources and the rest
from efficient combined cycle plants. [11]
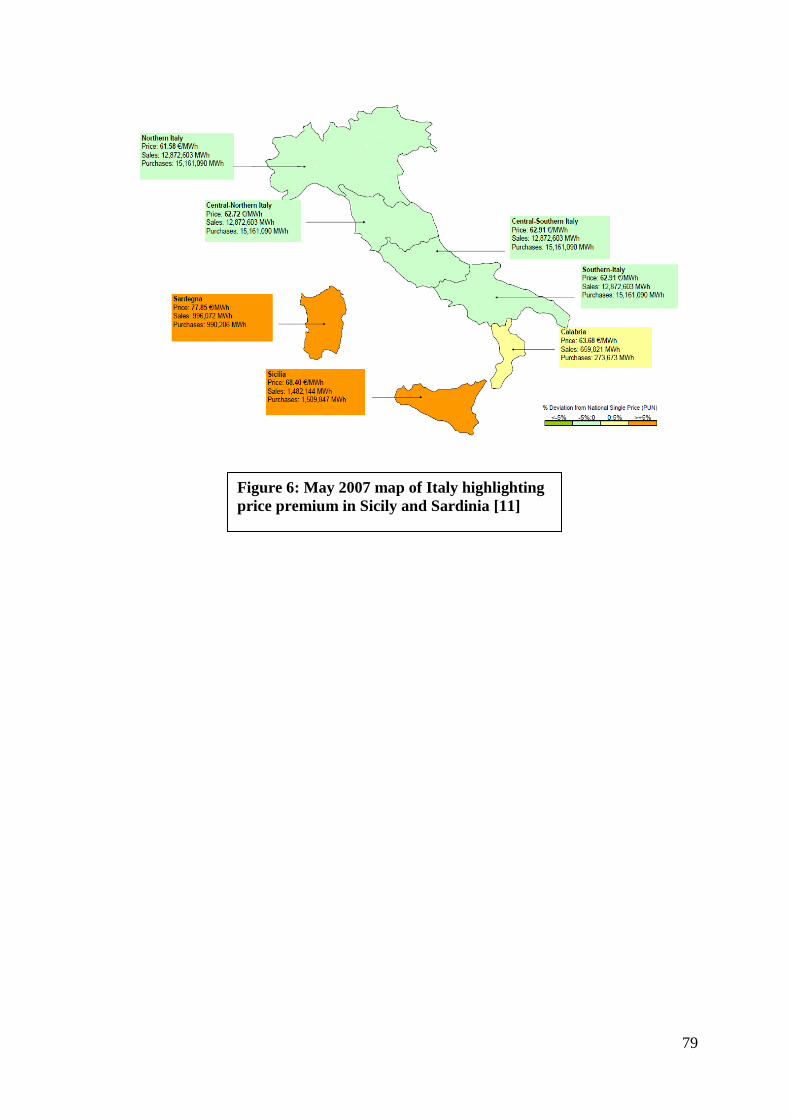
79
Figure 6: May 2007 map of Italy highlighting
price premium in Sicily and Sardinia [11]
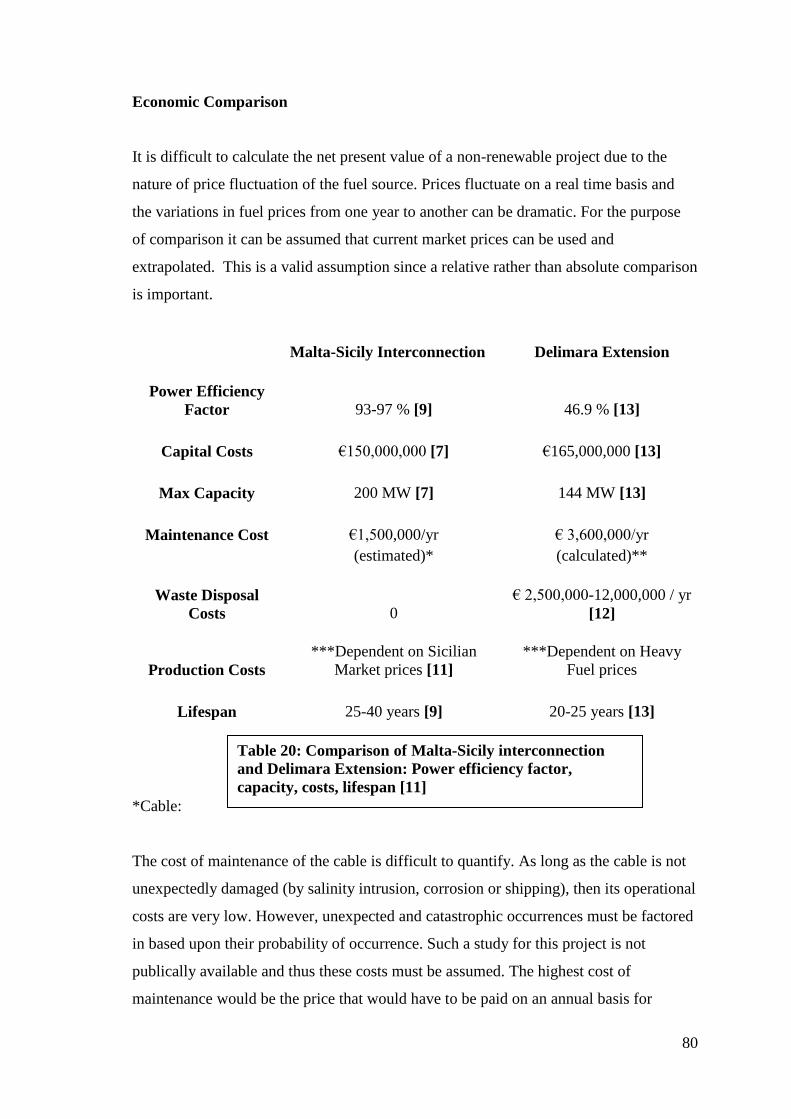
80
Economic Comparison
It is difficult to calculate the net present value of a non-renewable project due to the
nature of price fluctuation of the fuel source. Prices fluctuate on a real time basis and
the variations in fuel prices from one year to another can be dramatic. For the purpose
of comparison it can be assumed that current market prices can be used and
extrapolated. This is a valid assumption since a relative rather than absolute comparison
is important.
Malta-Sicily Interconnection Delimara Extension
Power Efficiency
Factor 93-97 % [9] 46.9 % [13]
Capital Costs €150,000,000 [7] €165,000,000 [13]
Max Capacity 200 MW [7] 144 MW [13]
Maintenance Cost €1,500,000/yr € 3,600,000/yr
(estimated)* (calculated)**
Waste Disposal
Costs 0
€ 2,500,000-12,000,000 / yr
[12]
Production Costs
***Dependent on Sicilian
Market prices [11]
***Dependent on Heavy
Fuel prices
Lifespan 25-40 years [9] 20-25 years [13]
*Cable:
The cost of maintenance of the cable is difficult to quantify. As long as the cable is not
unexpectedly damaged (by salinity intrusion, corrosion or shipping), then its operational
costs are very low. However, unexpected and catastrophic occurrences must be factored
in based upon their probability of occurrence. Such a study for this project is not
publically available and thus these costs must be assumed. The highest cost of
maintenance would be the price that would have to be paid on an annual basis for
Table 20: Comparison of Malta-Sicily interconnection
and Delimara Extension: Power efficiency factor,
capacity, costs, lifespan [11]
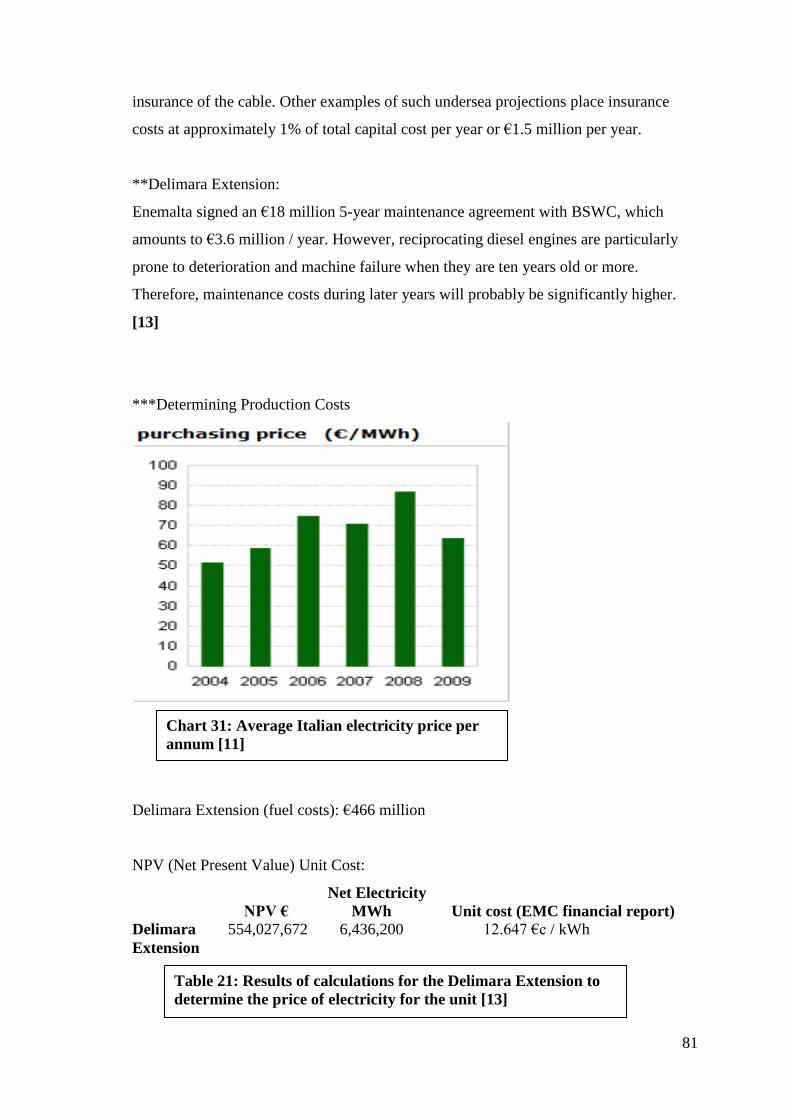
81
insurance of the cable. Other examples of such undersea projections place insurance
costs at approximately 1% of total capital cost per year or €1.5 million per year.
**Delimara Extension:
Enemalta signed an €18 million 5-year maintenance agreement with BSWC, which
amounts to €3.6 million / year. However, reciprocating diesel engines are particularly
prone to deterioration and machine failure when they are ten years old or more.
Therefore, maintenance costs during later years will probably be significantly higher.
[13]
***Determining Production Costs
Delimara Extension (fuel costs): €466 million
NPV (Net Present Value) Unit Cost:
Net Electricity
NPV € MWh Unit cost (EMC financial report) Delimara 554,027,672 6,436,200 12.647 €c / kWh
Extension
Chart 31: Average Italian electricity price per
annum [11]
Table 21: Results of calculations for the Delimara Extension to
determine the price of electricity for the unit [13]
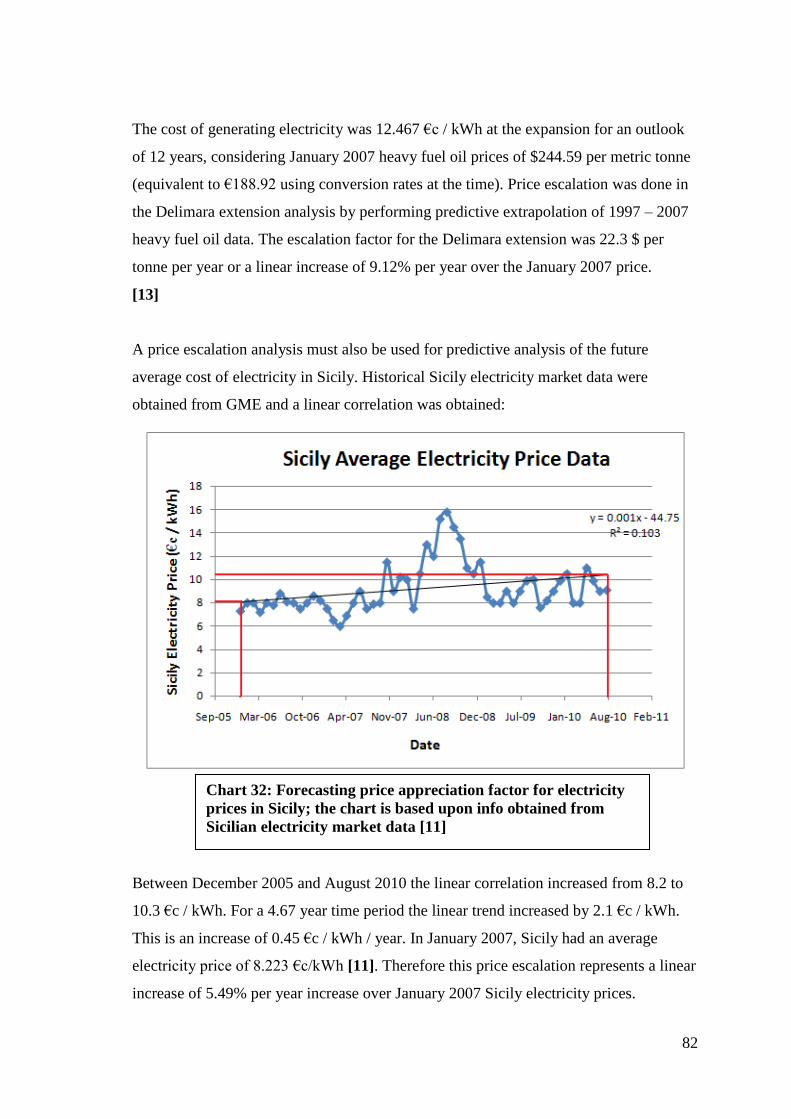
82
The cost of generating electricity was 12.467 €c / kWh at the expansion for an outlook
of 12 years, considering January 2007 heavy fuel oil prices of $244.59 per metric tonne
(equivalent to €188.92 using conversion rates at the time). Price escalation was done in
the Delimara extension analysis by performing predictive extrapolation of 1997 – 2007
heavy fuel oil data. The escalation factor for the Delimara extension was 22.3 $ per
tonne per year or a linear increase of 9.12% per year over the January 2007 price.
[13]
A price escalation analysis must also be used for predictive analysis of the future
average cost of electricity in Sicily. Historical Sicily electricity market data were
obtained from GME and a linear correlation was obtained:
Between December 2005 and August 2010 the linear correlation increased from 8.2 to
10.3 €c / kWh. For a 4.67 year time period the linear trend increased by 2.1 €c / kWh.
This is an increase of 0.45 €c / kWh / year. In January 2007, Sicily had an average
electricity price of 8.223 €c/kWh [11]. Therefore this price escalation represents a linear
increase of 5.49% per year increase over January 2007 Sicily electricity prices.
Chart 32: Forecasting price appreciation factor for electricity
prices in Sicily; the chart is based upon info obtained from
Sicilian electricity market data [11]
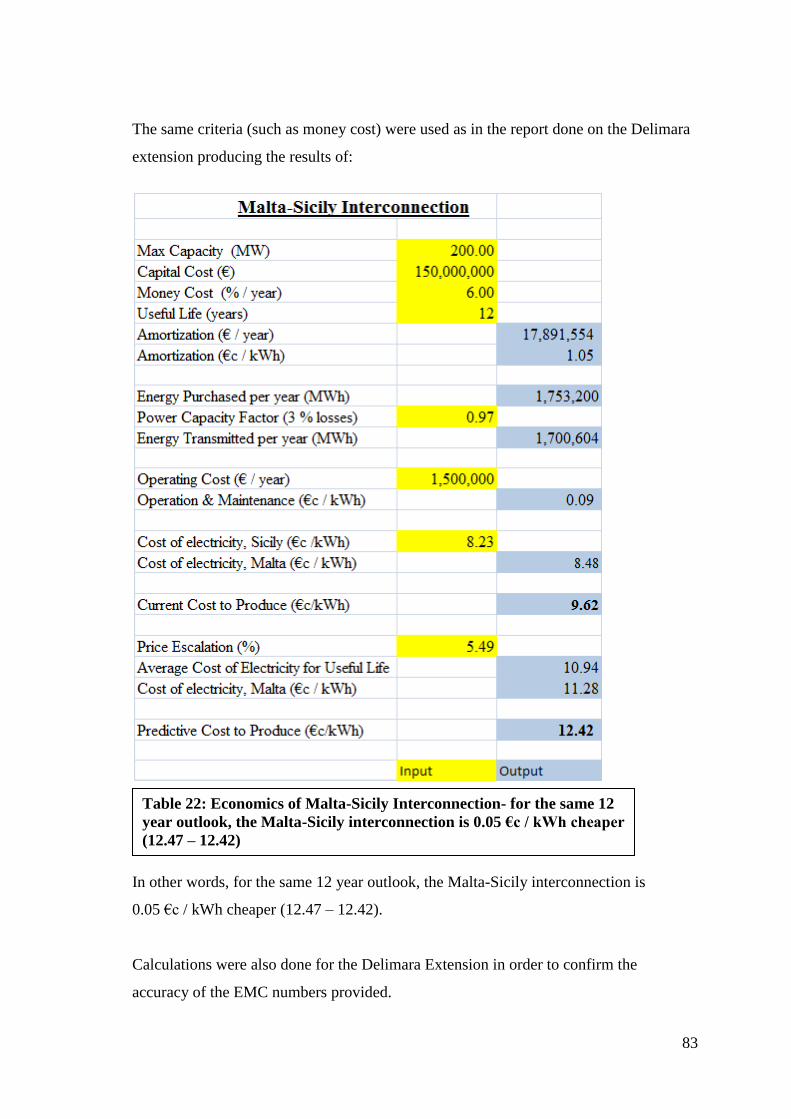
83
The same criteria (such as money cost) were used as in the report done on the Delimara
extension producing the results of:
In other words, for the same 12 year outlook, the Malta-Sicily interconnection is
0.05 €c / kWh cheaper (12.47 – 12.42).
Calculations were also done for the Delimara Extension in order to confirm the
accuracy of the EMC numbers provided.
Table 22: Economics of Malta-Sicily Interconnection- for the same 12
year outlook, the Malta-Sicily interconnection is 0.05 €c / kWh cheaper
(12.47 – 12.42)
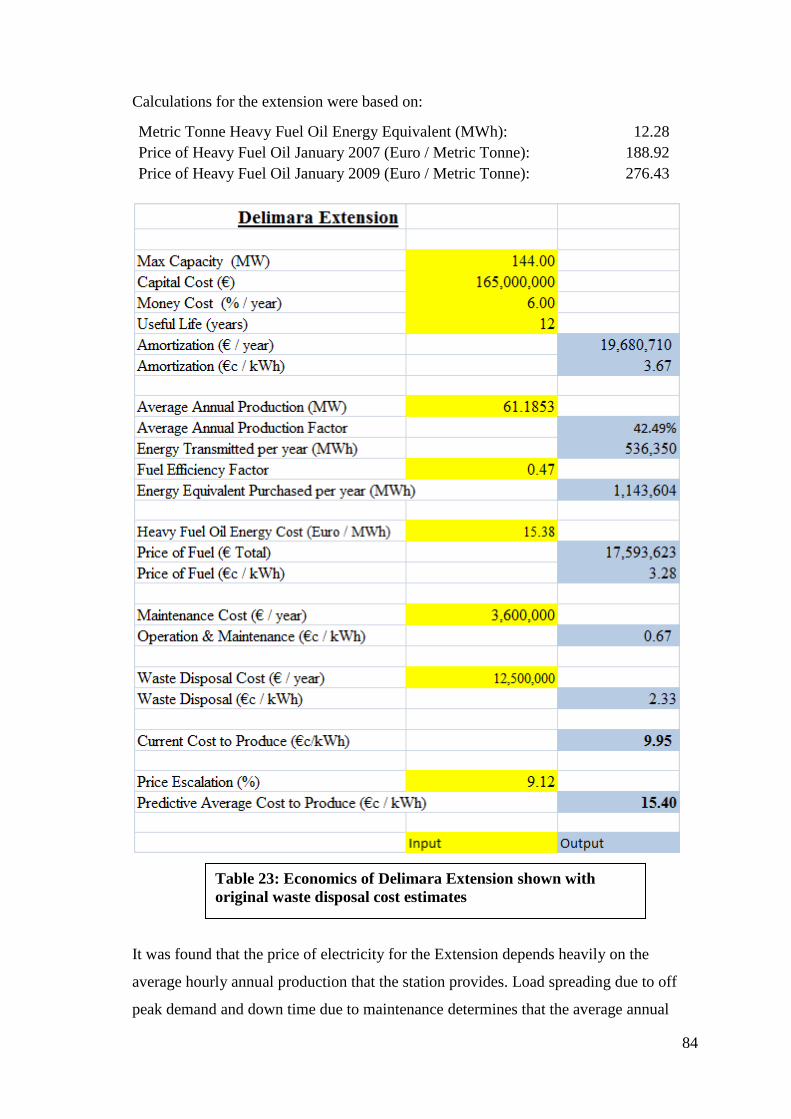
84
Calculations for the extension were based on:
Metric Tonne Heavy Fuel Oil Energy Equivalent (MWh): 12.28
Price of Heavy Fuel Oil January 2007 (Euro / Metric Tonne): 188.92
Price of Heavy Fuel Oil January 2009 (Euro / Metric Tonne): 276.43
It was found that the price of electricity for the Extension depends heavily on the
average hourly annual production that the station provides. Load spreading due to off
peak demand and down time due to maintenance determines that the average annual
Table 23: Economics of Delimara Extension shown with
original waste disposal cost estimates
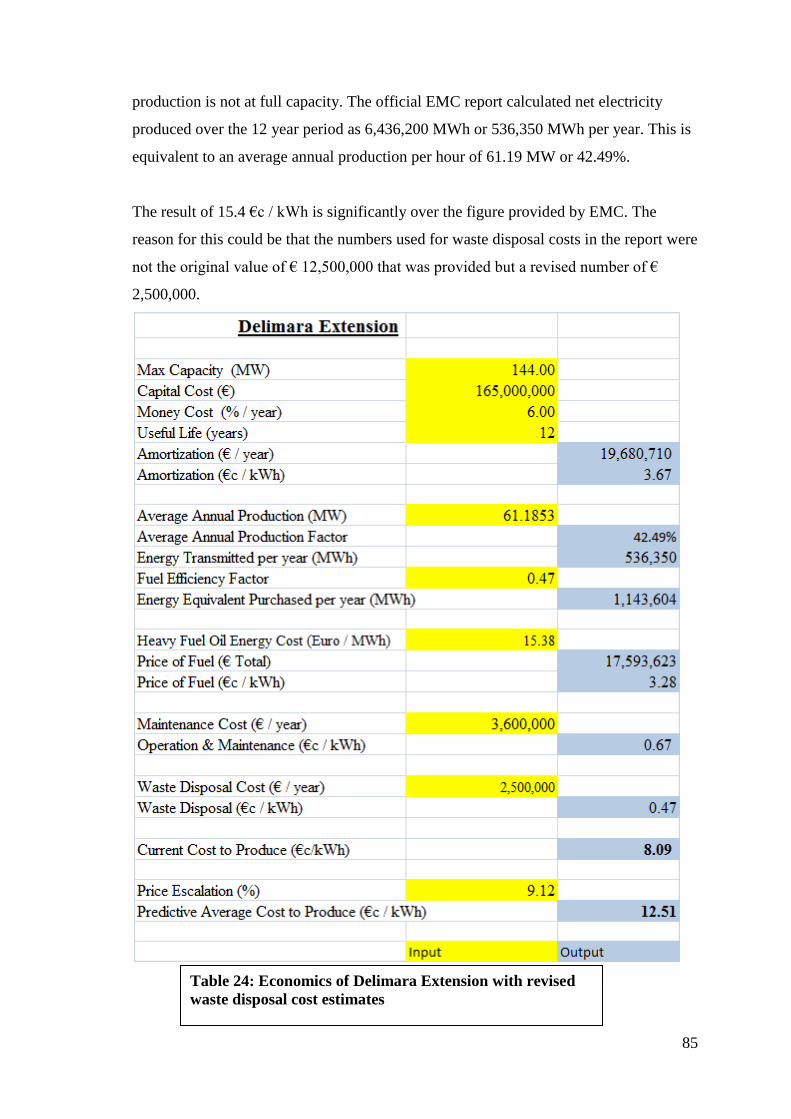
85
production is not at full capacity. The official EMC report calculated net electricity
produced over the 12 year period as 6,436,200 MWh or 536,350 MWh per year. This is
equivalent to an average annual production per hour of 61.19 MW or 42.49%.
The result of 15.4 €c / kWh is significantly over the figure provided by EMC. The
reason for this could be that the numbers used for waste disposal costs in the report were
not the original value of € 12,500,000 that was provided but a revised number of €
2,500,000.
Table 24: Economics of Delimara Extension with revised
waste disposal cost estimates
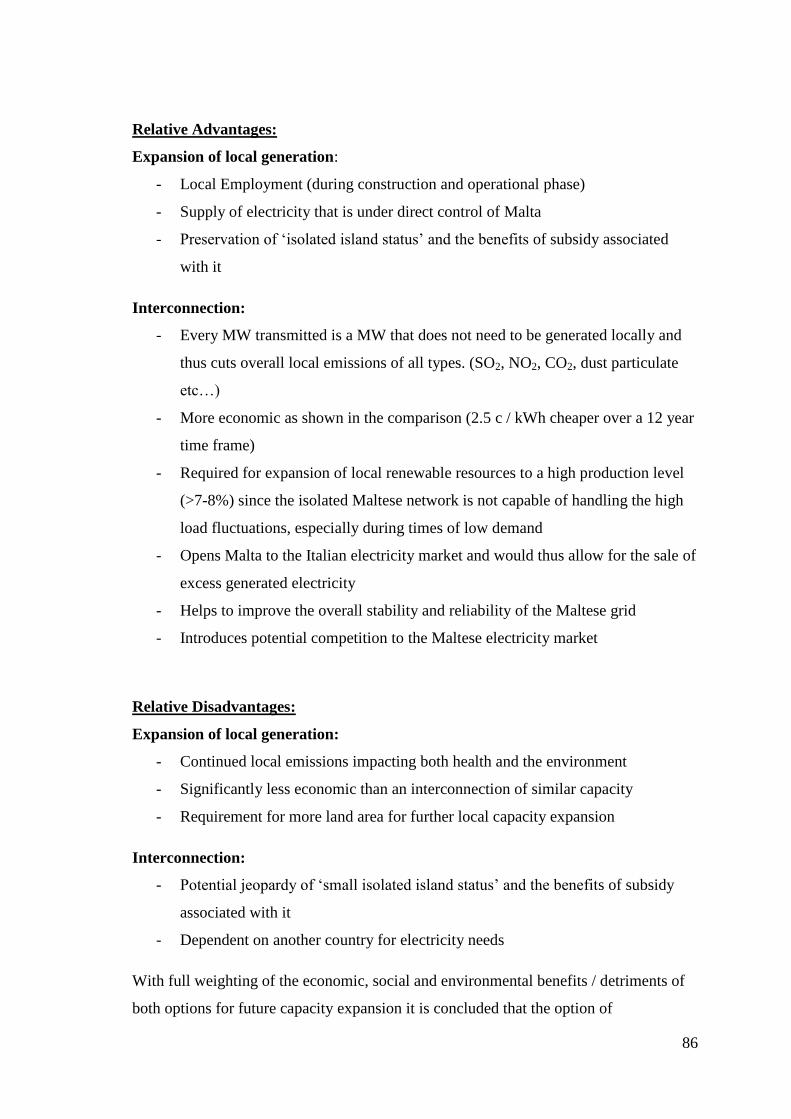
86
Relative Advantages:
Expansion of local generation:
- Local Employment (during construction and operational phase)
- Supply of electricity that is under direct control of Malta
- Preservation of „isolated island status‟ and the benefits of subsidy associated
with it
Interconnection:
- Every MW transmitted is a MW that does not need to be generated locally and
thus cuts overall local emissions of all types. (SO2, NO2, CO2, dust particulate
etc…)
- More economic as shown in the comparison (2.5 c / kWh cheaper over a 12 year
time frame)
- Required for expansion of local renewable resources to a high production level
(>7-8%) since the isolated Maltese network is not capable of handling the high
load fluctuations, especially during times of low demand
- Opens Malta to the Italian electricity market and would thus allow for the sale of
excess generated electricity
- Helps to improve the overall stability and reliability of the Maltese grid
- Introduces potential competition to the Maltese electricity market
Relative Disadvantages:
Expansion of local generation:
- Continued local emissions impacting both health and the environment
- Significantly less economic than an interconnection of similar capacity
- Requirement for more land area for further local capacity expansion
Interconnection:
- Potential jeopardy of „small isolated island status‟ and the benefits of subsidy
associated with it
- Dependent on another country for electricity needs
With full weighting of the economic, social and environmental benefits / detriments of
both options for future capacity expansion it is concluded that the option of
87
interconnection provides significantly more important positives in all three areas over
the option of expansion of local generation.
3. Investment in Renewable Projects in other EU Countries (North Sea) and being
Statistically Transferred with Renewable Energy Generation Versus Investment in
Local Renewable Projects
Directive Cooperation Mechanisms:
The EU Renewable Energy Directive allows flexible measures for Member States to
achieve their individual targets in an economic and sensible way. These measures
include the provision that Member States may statistically transfer credits for renewable
energy, cooperate on joint projects targeted for the production of renewable energy, and
coordinate national support schemes. In other words, energy produced from renewable
sources in one Member State may count towards the national target of the Member State
participating in the project.
The importance of these cooperation mechanisms is that, because of geographical
factors, different Member States have different qualities of renewable energy resources
and ability to exploit these resources. Member States are encouraged to engage in these
cooperative mechanisms in cases where a Member State can derive significant benefits
from “outsourcing” its renewable energy production. Large scale land based wind /
solar projects have been essentially ruled out for the Maltese Islands due to lack of land
availability and high cost of land that is available. Offshore wind has been presented by
government as the most economic and least environmentally harmful resource for Malta
to exploit on a large scale. The purpose of this section is to evaluate the relative
economics and environmental consequences of a local versus a foreign wind farm in
which Malta invests in the project in another Member State and is thus credited with
renewable energy produced from the project.
“The Second National Communication of Malta to the United Nations Convention on
Climate Change” report, May 2010 states:
“…at a 10% contribution from the wind, grid stability starts
to suffer… In the case of Malta, for the 10% contribution from a source
under a single wind regime, it was found that almost as much stand-by
88
capacity is required as that provided by wind, in order to avoid grid
instabilities. That would offset most of the benefits of wind generation.” [1]
Considering the above statement, which appeared in the latest report from a panel of
experts from Malta to the United Nations Convention on Climate Change, it would
seem prudent to rethink any consideration of spending hundreds of millions of Euros on
wind farm projects in Malta.
The Malta Environment and Planning Authority (MEPA) web site currently shows all
three wind farm planning applications as: “…application has been passed to a case
officer to assess the development proposal in terms of Structure Plan and other
established policies”.
AIS Environmental is the company that is conducting the environmental impact studies
for the three proposed wind farm sites as well as the controversial Delimara extension.
When contacted, the AIS Environmental representative stated that Hal Far requires an
Appropriate Assessment (AA) and technical studies but Is-Sikka l-Bajda (the white reef)
and Bahrija require an EIA as well as an EIS, (Environmental Impact Statement ). The
two onshore MEPA applications have a target date of November 2010 and the offshore
site has a target date of January 2011. [2]
Bahrija and Hal-Far are both onshore sites with estimated potential wind capacity of
10.2MW and 4.2 MW respectively. Sikka l-Bajda, located on a reef 1.5-2 km from the
coast, has an estimated wind potential of up to 95MW. If approved the three wind farm
projects would begin around 2012 and would give Malta wind energy potential of
109.4MW with an estimated annual electricity generation of 254GWh. [3]
The Bahrija application is the more problematic onshore application as it is located in a
„rural conservation area‟ (RCA) but has 19 trellis masts which can be used to monitor
wind (formerly belonging to Maltacom) which are not in use. Wind speed
measurements have been ongoing at Bahrija and are adequate to determine wind data.
One favorable argument for Hal Far and Bahrija is that onshore sites have a short time
scale compared to offshore sites, however, many arguments against such development
exist.
89
Is-Sikka l-Bajda
“If the offshore reef off Mellieha is not adequate for a wind
farm, Malta will be „stuck‟ and will probably have to ask the
EU to re-consider its expectations.”
George Pullicino, Resources Minister, speaking at the inauguration of the 80 meter high
wind monitoring mast at l-Ahrax, November 2009
Sikka l-Bajda as a wind farm location had originally been evaluated by the consulting
firm of Mott Macdonald (MML), U.K. in 2005. In that report Mott Macdonald advised
against building a wind farm on Sikka l-Bajda for financial, visual and environmental
reasons. In their 2005 report Mott experts recommended that Malta start with a medium
sized onshore wind project and stated that Sikka L-Bajda was only „marginally suitable‟
for wind power as the capacity factor is low (estimated at only 25%) due to the reef‟s
close proximity to shore and the location which lacks direct exposure to the prevailing
northwesterly winds. [4a]
In 2009 Mott Macdonald was re-commissioned to perform another feasibility study
based upon water depth up to 30m. The 2009 MML study estimates Sikka l-Bajda‟s
wind capacity factor at 25%, while similar wind farms in the North Sea have a capacity
factor of 40%. According to the report the energy produced by this wind farm, located
approximately 2 km from shore, would provide 4% of Malta‟s energy needs, providing
clean energy for approximately 21,000 households. By way of comparison that amount
is similar to the energy demand of Smart City which is estimated to be 3.6% of the
national electricity generation capacity. In order to produce the 50MW needed to reach
the 4% target the wind farm at Sikka l-Bajda would need seventeen 5 MW turbines with
80 meter diameter rotors. [4b] With regard to the feasibility of a wind farm on Sikka l-
Bajda, the 2009 MML report states:
“…it does exhibit a relatively low estimated capacity factor. The project
will not significantly benefit from economies of scale…and may be subject
to significant costs associated with vessel availability.” [5]
However, the Government‟s Committee for Wind Energy (CoWE) July 2008 report
states, “Inside the 20 meter depth contour, Sikka l-Bajda has sufficient space for some
30 MW of generating capacity. This capacity can be increased to 70-90 MW if the
surrounding outcrops in the area up to depths of 25 meters are considered. No other
reef around Malta offers this potential in so compact a form.” [6]
90
“A sizeable tariff would be necessary to make a wind farm in this region
financially viable”, the 2009 Mott Macdonald study concluded that energy produced
from Sikka l-Bajda wind farm would have to be sold at a high price. The same MML
report notes that a more viable option would be to buy „renewable energy credits‟ from
other states who abide by their renewable energy (RE) targets or to invest in a RE
project within the EU and take a share of RE credits from the project. [4b]
It was announced in August 2010 that AIS Environmental located in Fgura, Malta had
been awarded the tender (worth €295,000) to perform the EIA for Sikka l-Bajda. AIS
performed the EIA for the contentious Delimara Power Station heavy fossil fuel burning
extension after the contract with BWSC had already been signed.
The proposed Sikka l-Bajda wind farm awaits the results of the data collected from the
80 meter l-Ahrax monitor (launched November 2009) which has been given a two year
MEPA permit. The wind data used in the 2009 Mott Macdonald (MML) report were
collected from several sources including: Luqa Airport (which is 18 km from Sikka l-
Bajda and is in a very different environment), National Centre for Atmospheric
Research (NCAR) and the European Wind Atlas. [4b]
The 2009 MML report estimates the approximate wind speed to be between 6.5m/s and
7.5m/s while the European Wind Atlas predicts a wind speed range of 5.5m/s to
7.0m/s.[7]
Sikka l-Bajda is Malta‟s only shallow reef which is large enough for an offshore wind
farm; thus, the only other offshore wind farm possibility is to pursue deep water
technology which at this point in time is not adequately advanced.
“Political considerations seem to have prevailed…it is evident they
have rescued Sikka l-Bajda from oblivion after they previously
dismissed it in their 2005 report”
Shadow Minister of Alternative Energy Leo Brincat referring to the contradictory Mott
Macdonald reports 2005 vs. 2009. [8]
The Sikka l-Bajda project would require an enormous capital expenditure (capex),
estimated to be between €280 and 350 million, based upon the capex costs of
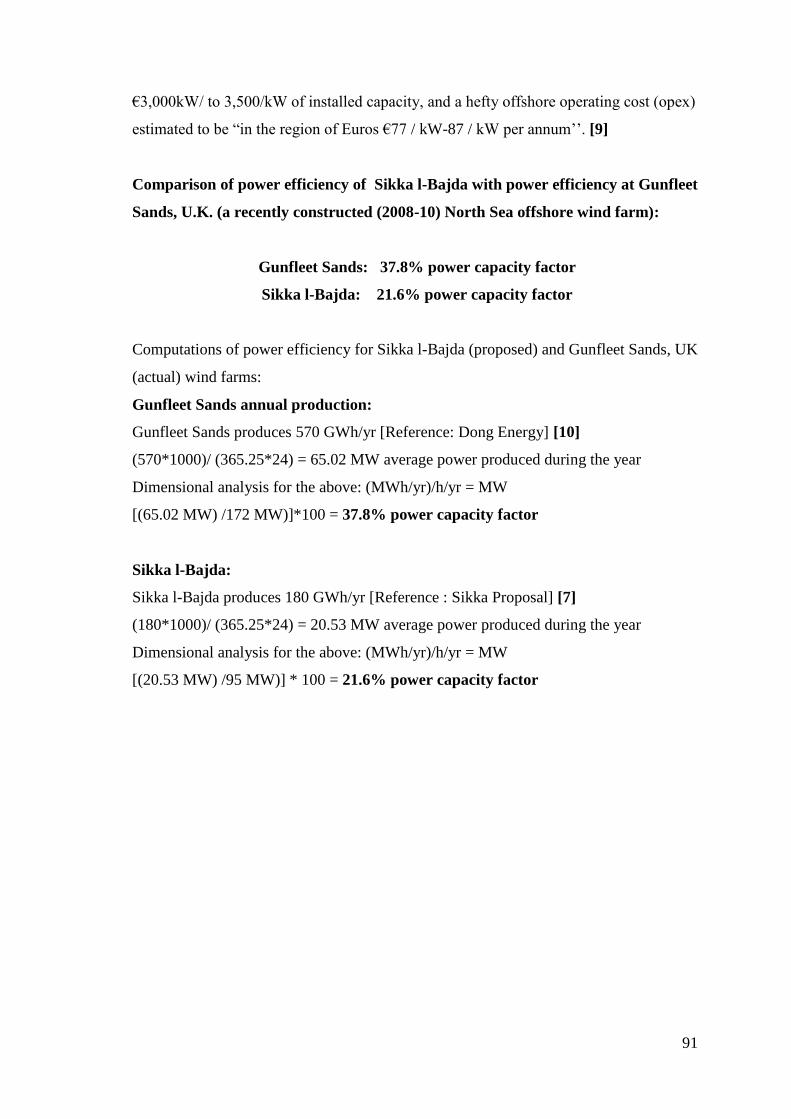
91
€3,000kW/ to 3,500/kW of installed capacity, and a hefty offshore operating cost (opex)
estimated to be “in the region of Euros €77 / kW-87 / kW per annum‟‟. [9]
Comparison of power efficiency of Sikka l-Bajda with power efficiency at Gunfleet
Sands, U.K. (a recently constructed (2008-10) North Sea offshore wind farm):
Gunfleet Sands: 37.8% power capacity factor
Sikka l-Bajda: 21.6% power capacity factor
Computations of power efficiency for Sikka l-Bajda (proposed) and Gunfleet Sands, UK
(actual) wind farms:
Gunfleet Sands annual production:
Gunfleet Sands produces 570 GWh/yr [Reference: Dong Energy] [10]
(570*1000)/ (365.25*24) = 65.02 MW average power produced during the year
Dimensional analysis for the above: (MWh/yr)/h/yr = MW
[(65.02 MW) /172 MW)]*100 = 37.8% power capacity factor
Sikka l-Bajda:
Sikka l-Bajda produces 180 GWh/yr [Reference : Sikka Proposal] [7]
(180*1000)/ (365.25*24) = 20.53 MW average power produced during the year
Dimensional analysis for the above: (MWh/yr)/h/yr = MW
[(20.53 MW) /95 MW)] * 100 = 21.6% power capacity factor
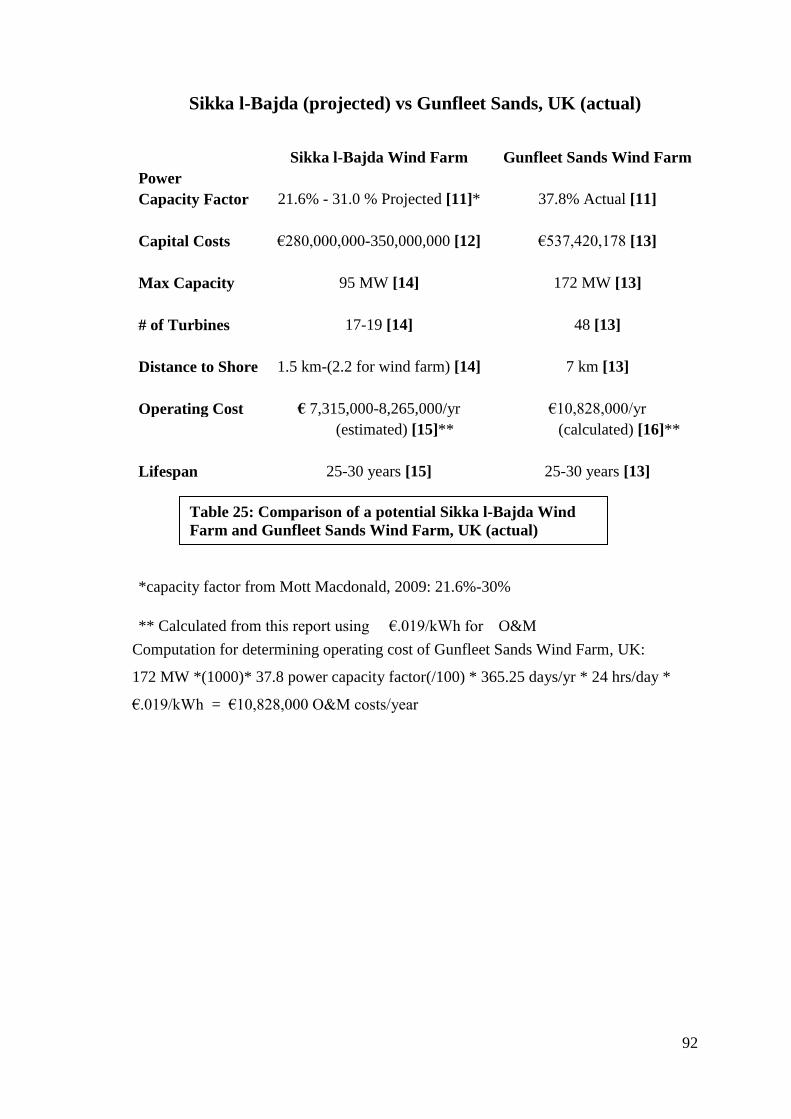
92
Sikka l-Bajda (projected) vs Gunfleet Sands, UK (actual)
Sikka l-Bajda Wind Farm Gunfleet Sands Wind Farm
Power
Capacity Factor 21.6% - 31.0 % Projected [11]* 37.8% Actual [11]
Capital Costs €280,000,000-350,000,000 [12] €537,420,178 [13]
Max Capacity 95 MW [14] 172 MW [13]
# of Turbines 17-19 [14] 48 [13]
Distance to Shore 1.5 km-(2.2 for wind farm) [14] 7 km [13]
Operating Cost € 7,315,000-8,265,000/yr €10,828,000/yr
(estimated) [15]** (calculated) [16]**
Lifespan 25-30 years [15] 25-30 years [13]
*capacity factor from Mott Macdonald, 2009: 21.6%-30%
** Calculated from this report using €.019/kWh for O&M
Computation for determining operating cost of Gunfleet Sands Wind Farm, UK:
172 MW *(1000)* 37.8 power capacity factor(/100) * 365.25 days/yr * 24 hrs/day *
€.019/kWh = €10,828,000 O&M costs/year
Table 25: Comparison of a potential Sikka l-Bajda Wind
Farm and Gunfleet Sands Wind Farm, UK (actual)
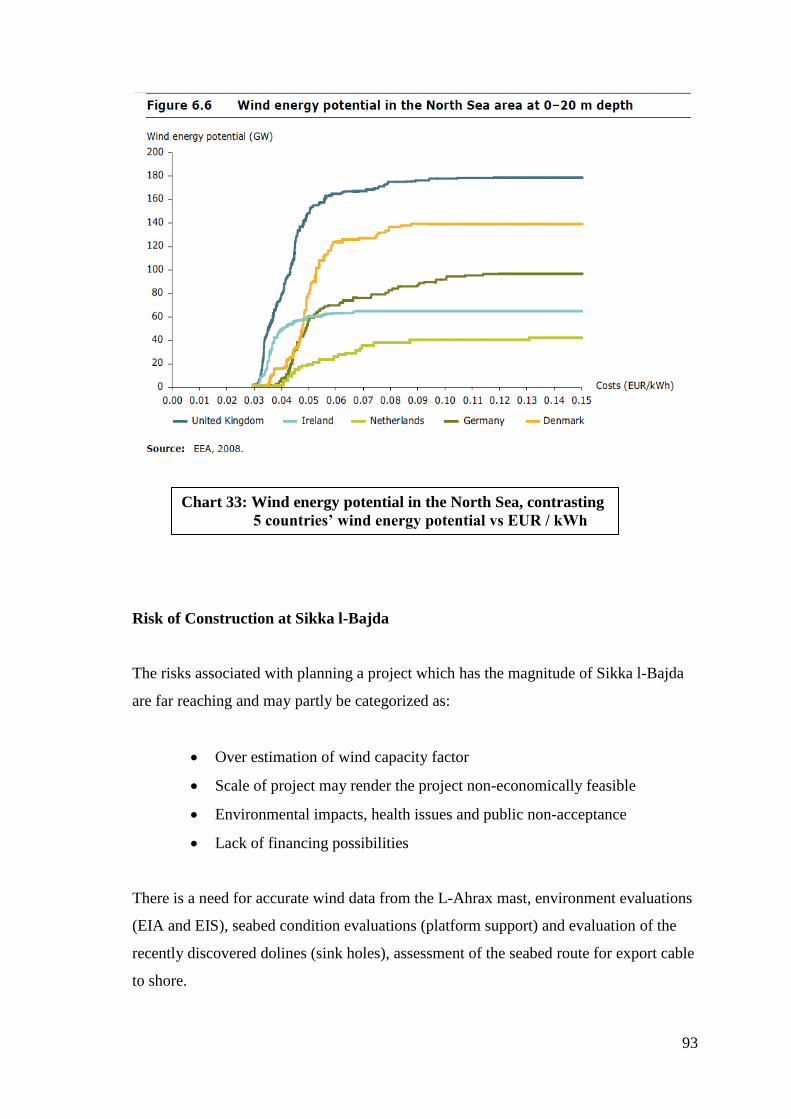
93
Risk of Construction at Sikka l-Bajda
The risks associated with planning a project which has the magnitude of Sikka l-Bajda
are far reaching and may partly be categorized as:
Over estimation of wind capacity factor
Scale of project may render the project non-economically feasible
Environmental impacts, health issues and public non-acceptance
Lack of financing possibilities
There is a need for accurate wind data from the L-Ahrax mast, environment evaluations
(EIA and EIS), seabed condition evaluations (platform support) and evaluation of the
recently discovered dolines (sink holes), assessment of the seabed route for export cable
to shore.
Chart 33: Wind energy potential in the North Sea, contrasting
5 countries‟ wind energy potential vs EUR / kWh
[17]
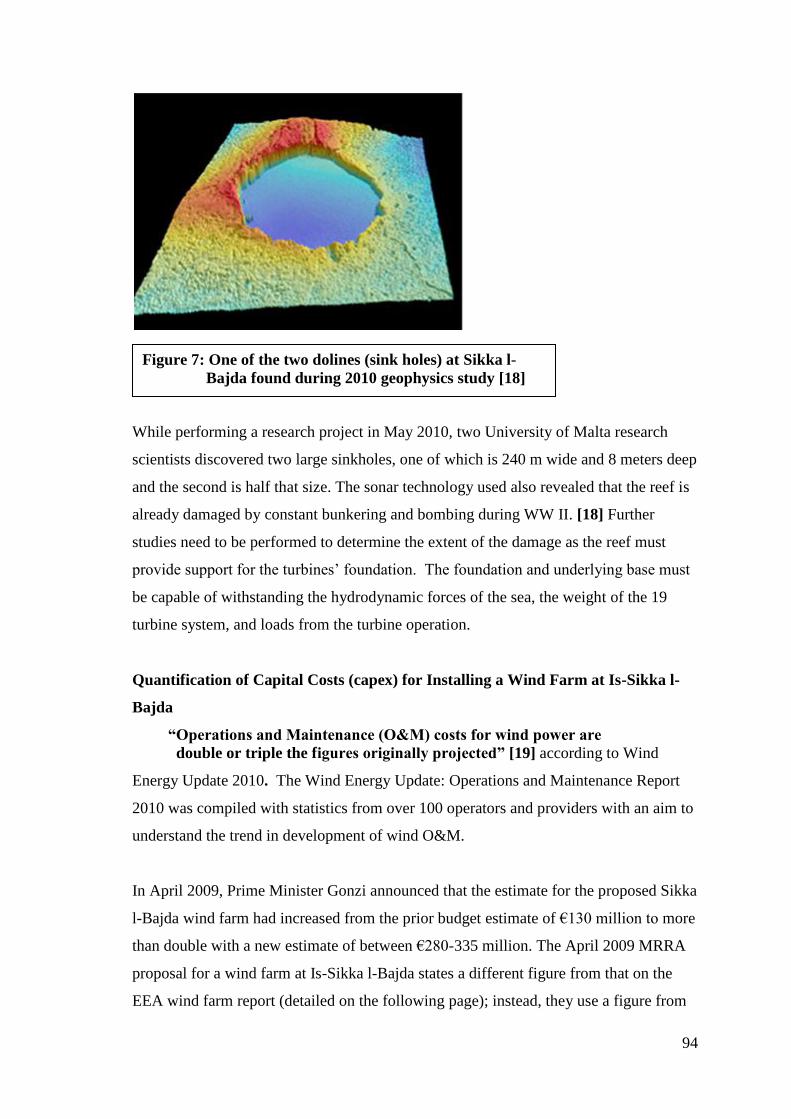
94
While performing a research project in May 2010, two University of Malta research
scientists discovered two large sinkholes, one of which is 240 m wide and 8 meters deep
and the second is half that size. The sonar technology used also revealed that the reef is
already damaged by constant bunkering and bombing during WW II. [18] Further
studies need to be performed to determine the extent of the damage as the reef must
provide support for the turbines‟ foundation. The foundation and underlying base must
be capable of withstanding the hydrodynamic forces of the sea, the weight of the 19
turbine system, and loads from the turbine operation.
Quantification of Capital Costs (capex) for Installing a Wind Farm at Is-Sikka l-
Bajda
“Operations and Maintenance (O&M) costs for wind power are
double or triple the figures originally projected” [19] according to Wind
Energy Update 2010. The Wind Energy Update: Operations and Maintenance Report
2010 was compiled with statistics from over 100 operators and providers with an aim to
understand the trend in development of wind O&M.
In April 2009, Prime Minister Gonzi announced that the estimate for the proposed Sikka
l-Bajda wind farm had increased from the prior budget estimate of €130 million to more
than double with a new estimate of between €280-335 million. The April 2009 MRRA
proposal for a wind farm at Is-Sikka l-Bajda states a different figure from that on the
EEA wind farm report (detailed on the following page); instead, they use a figure from
Figure 7: One of the two dolines (sink holes) at Sikka l-
Bajda found during 2010 geophysics study [18]
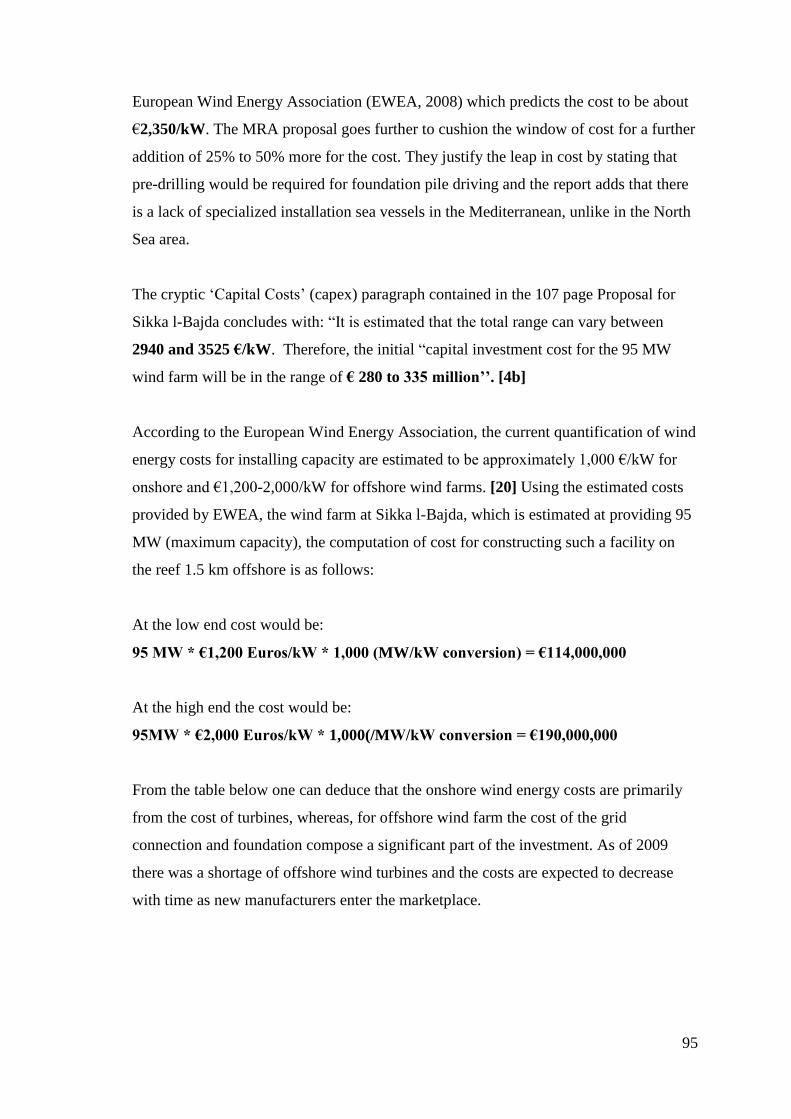
95
European Wind Energy Association (EWEA, 2008) which predicts the cost to be about
€2,350/kW. The MRA proposal goes further to cushion the window of cost for a further
addition of 25% to 50% more for the cost. They justify the leap in cost by stating that
pre-drilling would be required for foundation pile driving and the report adds that there
is a lack of specialized installation sea vessels in the Mediterranean, unlike in the North
Sea area.
The cryptic „Capital Costs‟ (capex) paragraph contained in the 107 page Proposal for
Sikka l-Bajda concludes with: “It is estimated that the total range can vary between
2940 and 3525 €/kW. Therefore, the initial “capital investment cost for the 95 MW
wind farm will be in the range of € 280 to 335 million‟‟. [4b]
According to the European Wind Energy Association, the current quantification of wind
energy costs for installing capacity are estimated to be approximately 1,000 €/kW for
onshore and €1,200-2,000/kW for offshore wind farms. [20] Using the estimated costs
provided by EWEA, the wind farm at Sikka l-Bajda, which is estimated at providing 95
MW (maximum capacity), the computation of cost for constructing such a facility on
the reef 1.5 km offshore is as follows:
At the low end cost would be:
95 MW * €1,200 Euros/kW * 1,000 (MW/kW conversion) = €114,000,000
At the high end the cost would be:
95MW * €2,000 Euros/kW * 1,000(/MW/kW conversion = €190,000,000
From the table below one can deduce that the onshore wind energy costs are primarily
from the cost of turbines, whereas, for offshore wind farm the cost of the grid
connection and foundation compose a significant part of the investment. As of 2009
there was a shortage of offshore wind turbines and the costs are expected to decrease
with time as new manufacturers enter the marketplace.
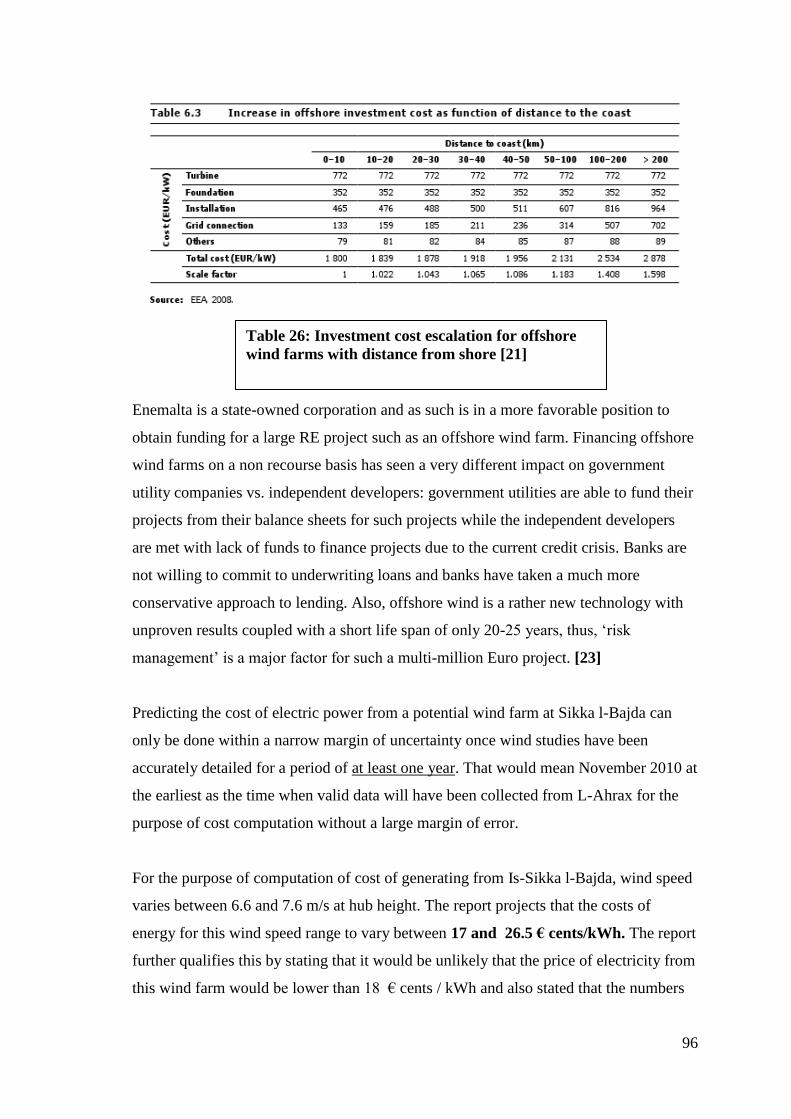
96
Enemalta is a state-owned corporation and as such is in a more favorable position to
obtain funding for a large RE project such as an offshore wind farm. Financing offshore
wind farms on a non recourse basis has seen a very different impact on government
utility companies vs. independent developers: government utilities are able to fund their
projects from their balance sheets for such projects while the independent developers
are met with lack of funds to finance projects due to the current credit crisis. Banks are
not willing to commit to underwriting loans and banks have taken a much more
conservative approach to lending. Also, offshore wind is a rather new technology with
unproven results coupled with a short life span of only 20-25 years, thus, „risk
management‟ is a major factor for such a multi-million Euro project. [23]
Predicting the cost of electric power from a potential wind farm at Sikka l-Bajda can
only be done within a narrow margin of uncertainty once wind studies have been
accurately detailed for a period of at least one year. That would mean November 2010 at
the earliest as the time when valid data will have been collected from L-Ahrax for the
purpose of cost computation without a large margin of error.
For the purpose of computation of cost of generating from Is-Sikka l-Bajda, wind speed
varies between 6.6 and 7.6 m/s at hub height. The report projects that the costs of
energy for this wind speed range to vary between 17 and 26.5 € cents/kWh. The report
further qualifies this by stating that it would be unlikely that the price of electricity from
this wind farm would be lower than 18 € cents / kWh and also stated that the numbers
Table 26: Investment cost escalation for offshore
wind farms with distance from shore [21]
97
are subject to technical/economic evaluation. As there was no wind data available for
the immediate area around Sikka l-Bajda the 2009 MML report utilized wind data from
various sources including: Luqa Airport (which is 18 km from Sikka l-Bajda and is in a
very different environment), National Centre for Atmospheric Research (NCAR) and
the European Wind Atlas.[4b] The report estimates the approximate wind speed to be
between 6.5m/s and 7.5m/s while the European wind atlas predicts a wind speed range
of 5.5m/s-7.0m/s. [5]
We have shown that an offshore wind farm at Sikka l-Bajda is most probably
uneconomic for several powerful reasons. It is therefore highly doubtful that a private
company would undertake the project without some type of substantial subsidy from the
government. There is an EU policy against state aid to private industry except in special
circumstances. [22] Any subsidy from the Government must be paid for by the Maltese
taxpayers; moreover, any private wind power company would be in competition with
Enemalta. As Enemalta is an electric power monopoly, it would then have a
tremendous conflict of interest as to when to use the power generated from the local
wind farm.
Malta has already generated major criticism for the manner in which the BWSC
contract for the Delimara Extension was negotiated. The government of Malta still has
not responded to the corruption enquires of the European Commission. The BWSC
shows the importance of managing public procurement processes in ways that are so
transparent that they do not leave any room not only for the possibility of corruption but
also for the slightest perception of corruption.”
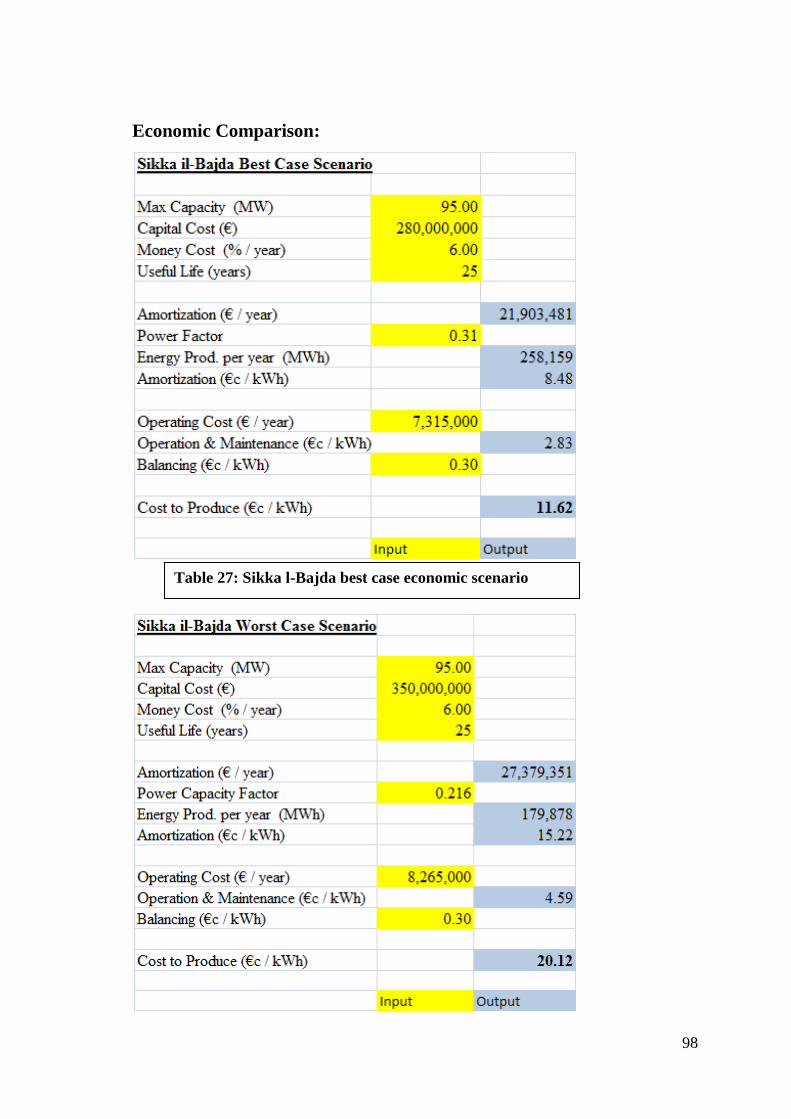
98
Economic Comparison:
Table 27: Sikka l-Bajda best case economic scenario
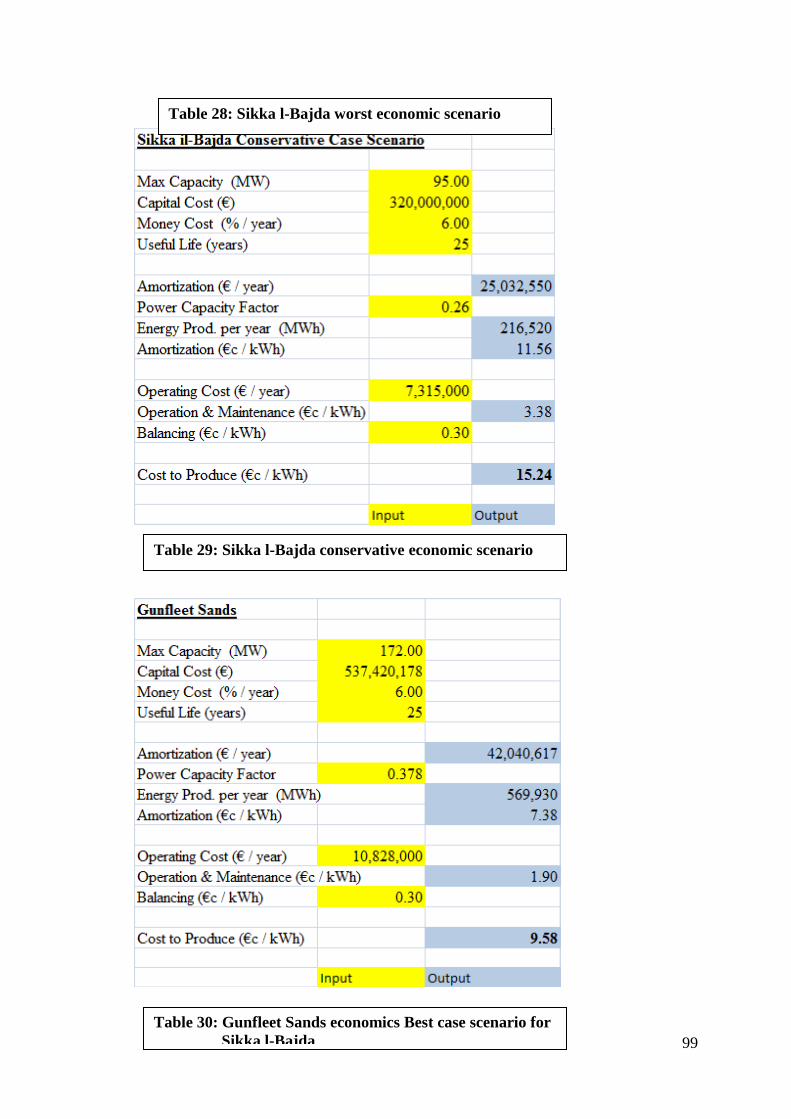
99
Table 28: Sikka l-Bajda worst economic scenario
Table 29: Sikka l-Bajda conservative economic scenario
Table 30: Gunfleet Sands economics Best case scenario for
Sikka l-Bajda
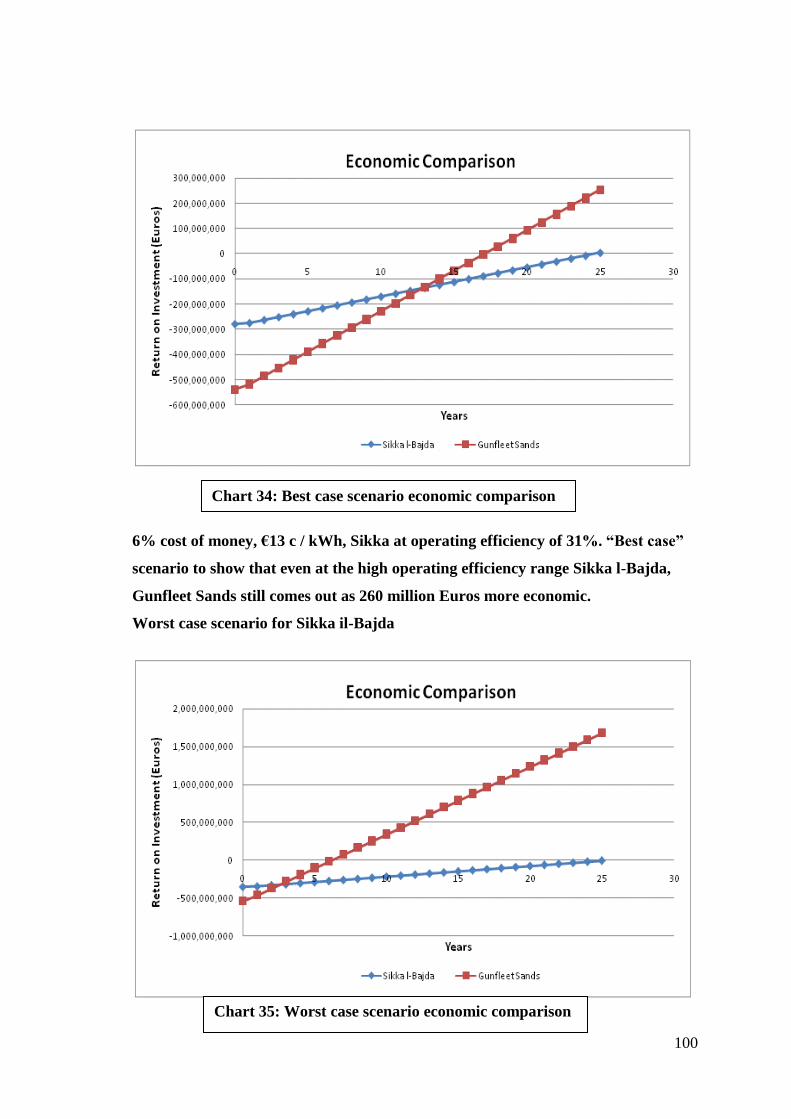
100
6% cost of money, €13 c / kWh, Sikka at operating efficiency of 31%. “Best case”
scenario to show that even at the high operating efficiency range Sikka l-Bajda,
Gunfleet Sands still comes out as 260 million Euros more economic.
Worst case scenario for Sikka il-Bajda
Chart 34: Best case scenario economic comparison
Chart 35: Worst case scenario economic comparison
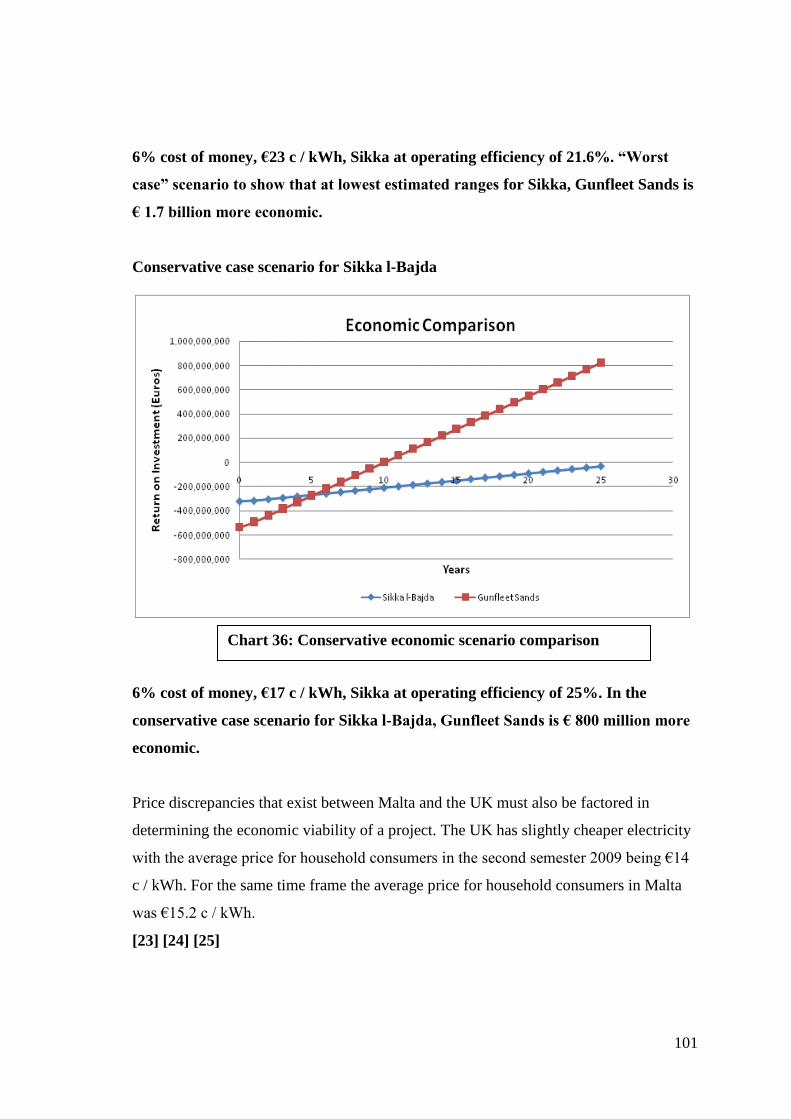
101
6% cost of money, €23 c / kWh, Sikka at operating efficiency of 21.6%. “Worst
case” scenario to show that at lowest estimated ranges for Sikka, Gunfleet Sands is
€ 1.7 billion more economic.
Conservative case scenario for Sikka l-Bajda
6% cost of money, €17 c / kWh, Sikka at operating efficiency of 25%. In the
conservative case scenario for Sikka l-Bajda, Gunfleet Sands is € 800 million more
economic.
Price discrepancies that exist between Malta and the UK must also be factored in
determining the economic viability of a project. The UK has slightly cheaper electricity
with the average price for household consumers in the second semester 2009 being €14
c / kWh. For the same time frame the average price for household consumers in Malta
was €15.2 c / kWh.
[23] [24] [25]
Chart 36: Conservative economic scenario comparison
A Comparative Social, Economic and
Environmental Study of how Malta could best
achieve its 2020
“20-20-20” goals
Charles Gordon Sinn
Master of Science in Sustainable Environmental Resource
Management / Master of Science in Integrated Science &
Technology
University of Malta / James Madison University
September 2010
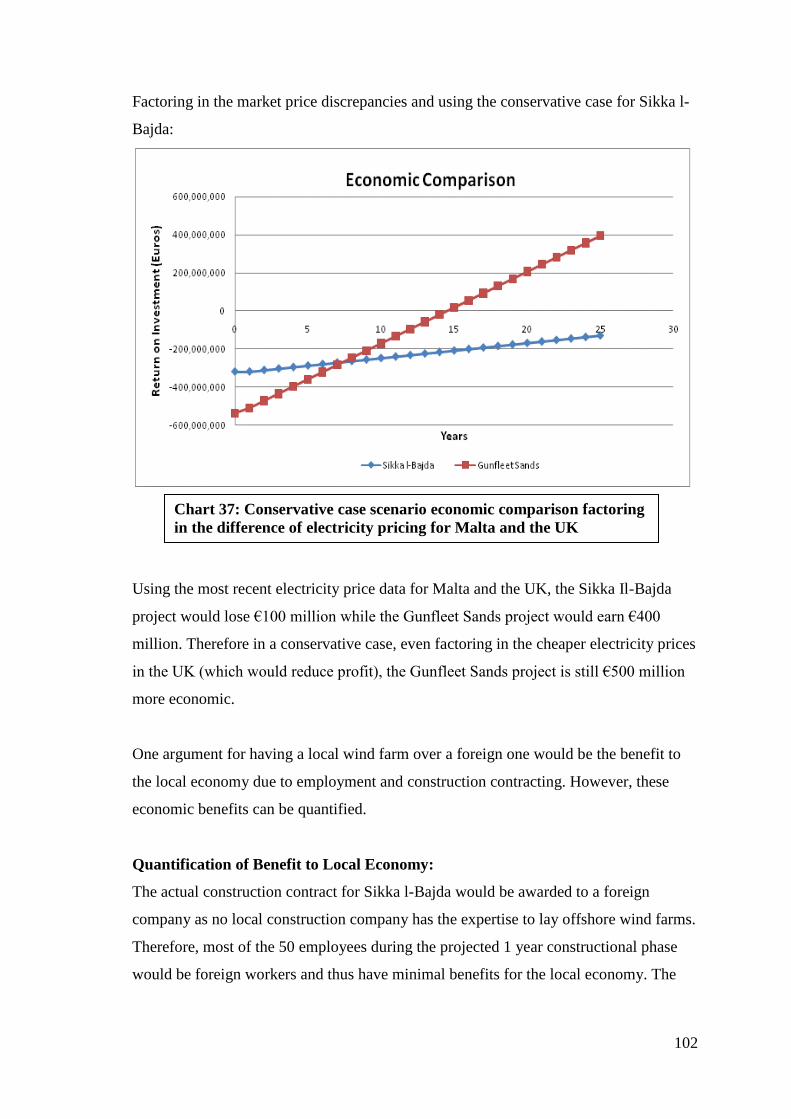
102
Factoring in the market price discrepancies and using the conservative case for Sikka l-
Bajda:
Using the most recent electricity price data for Malta and the UK, the Sikka Il-Bajda
project would lose €100 million while the Gunfleet Sands project would earn €400
million. Therefore in a conservative case, even factoring in the cheaper electricity prices
in the UK (which would reduce profit), the Gunfleet Sands project is still €500 million
more economic.
One argument for having a local wind farm over a foreign one would be the benefit to
the local economy due to employment and construction contracting. However, these
economic benefits can be quantified.
Quantification of Benefit to Local Economy:
The actual construction contract for Sikka l-Bajda would be awarded to a foreign
company as no local construction company has the expertise to lay offshore wind farms.
Therefore, most of the 50 employees during the projected 1 year constructional phase
would be foreign workers and thus have minimal benefits for the local economy. The
Chart 37: Conservative case scenario economic comparison factoring
in the difference of electricity pricing for Malta and the UK
103
wind farm would employ 15 full time employees during the operational phase and if it
is assumed that these are all Maltese and they are paid an average wage
of 30,000 € / year (very high for Malta) then this would amount to 450,000 €/year or
11.25 million Euros over the 25 year operational period. Therefore the benefit to the
local economy is inconsequential when compared to the potential 1 billion Euros that
can be saved by investing in a foreign project rather than building locally. [5]
Imports and joint projects with non-EU countries
The EU renewable energy directive allows for member states to invest in non-EU
countries to achieve their renewable goal. The difference is that the member state must
demonstrate that the same amount of electricity produced from the renewable location
can be physically transported from the investment location to the investing member
state. In cases where projects with long lead times are considered then the EU may
allow for a statistical credit of renewable electricity for what the renewable investment
would have produced if it had been operational, to accommodate for the construction
phase. The most suitable non-EU country that Malta could cooperate with for such a
project would be Tunisia. With low labor costs, low land costs, proximity to Malta, very
good solar and wind potential, it could potentially develop into an ideal location for
such a renewable investment.
This option was not considered for Malta, as the scale required for such a project to
make it economic would be too large. The opportunity is there however in the future for
a possible joint-member project, most probably with Italy who has already undergone
feasibility studies for a proposed Tunisia-Sicily interconnection that has resulted in
favorable economic results. Once this Tunisia-Sicily interconnection has been
constructed, it will allow for the possibility of a renewable investment project in
Tunisia, and the subsequent direct exportation of this energy to Malta via the Malta-
Sicily interconnection. Since the proposed Tunisia-Sicily interconnection is tentative
and not planned to be constructed until at least 2016, the option of joint projects with
non-EU countries was not considered for Malta, as it would result in too short of a
timeframe in which to implement, and a renewable action plan cannot be based on a
project that lacks a definite timeframe.
104
4. Consumer end efficiency improvements
It has been shown in section 1 that it is possible for Malta to achieve its 2016 efficiency
goals of 9% reduction in power generation over values of what they would have been
had the efficiency measures not been introduced solely through the reduction of theft,
technical losses, and power station self consumption. With the forecast of “business as
usual” levels being 3,250,000 MWh, a 10% reduction represents an energy savings of
325,000 MWh. [1]
The current losses of electric energy distribution are already accounted for in the
forecast of Malta‟s 2020 gross final electricity consumption. This means that any
savings of plant self-consumption and distribution losses count as energy savings and
thus are energy efficiency improvements.
Enemalta has projected that self consumption will be reduced from 5.48% in 2010 to
3.83% in 2020 (for a savings of 1.65%) due to the phasing out of old power plants, plant
efficiency improvement measures, and the introduction of the Malta-Sicily
interconnection.
With 13.1% total power losses (including 5% of this being technical losses) in the grid,
Enemalta estimates that technical distribution losses will be reduced from 5% to 4%
with the introduction of smart metering (for a savings of 1%).
Furthermore the loss due to tampered meters (approximately 5%) should be effectively
eliminated with the comprehensive installation of the smart meter system and an
extensive inspection program (for a savings of 5%).
The other 3% of total losses stems from direct line tapping theft and billing mistakes.
Direct line tapping is much harder to combat than meter tampering as it is very difficult
to locate. The losses due to billing mistakes should be reduced with the smart meter
system.
105
Malta currently has total power losses of 13.1% but should be able to bring its total
power losses down at least to the level of Cyprus of 4.55% and ideally down to
Luxembourg‟s levels of 1.42%. Both Cyprus and Luxembourg are significantly larger
than Malta with longer distribution networks; the size of a network is the main limiting
factor to achieving optimal technical efficiency. Malta with its much smaller
transmission distances should theoretically be able to achieve losses that are less than
the losses of those countries.
If Malta were to achieve Cyprus‟ level of total power losses that would represent an
improvement of 8.55%. If the expected self consumption savings of 1.65% is added to
this figure then it is possible for Malta to achieve a 10.2% efficiency improvement.
Therefore it should be possible for Malta to achieve its 2020 efficiency goals through
power generation efficiency improvements and reduction of losses in the transmission
grid. However, just because it is possible for Malta to achieve its goals solely through
generation and transmission improvements does not mean that end-user energy
efficiency improvements should be ruled out since smart and cost effective end-user
efficiency improvements can be extremely economic, save on electricity, and thus
mitigate the emissions footprint.
Measures taken by end-users to increase energy efficiency and thus decrease
energy consumption
Domestic Sector
The pie chart below displays the consumption of electricity by utility in the average
Maltese household. Water heating represents almost a quarter of total domestic
electrical consumption. It is a section of the pie that can potentially be cost effectively
reduced by the large scale installation of renewable solar water heating. Lighting is also
a big destination for domestic consumption and is projected to be reduced by up to 80%
with the comprehensive replacement of incandescent with compact fluorescents (CFL).
[2]
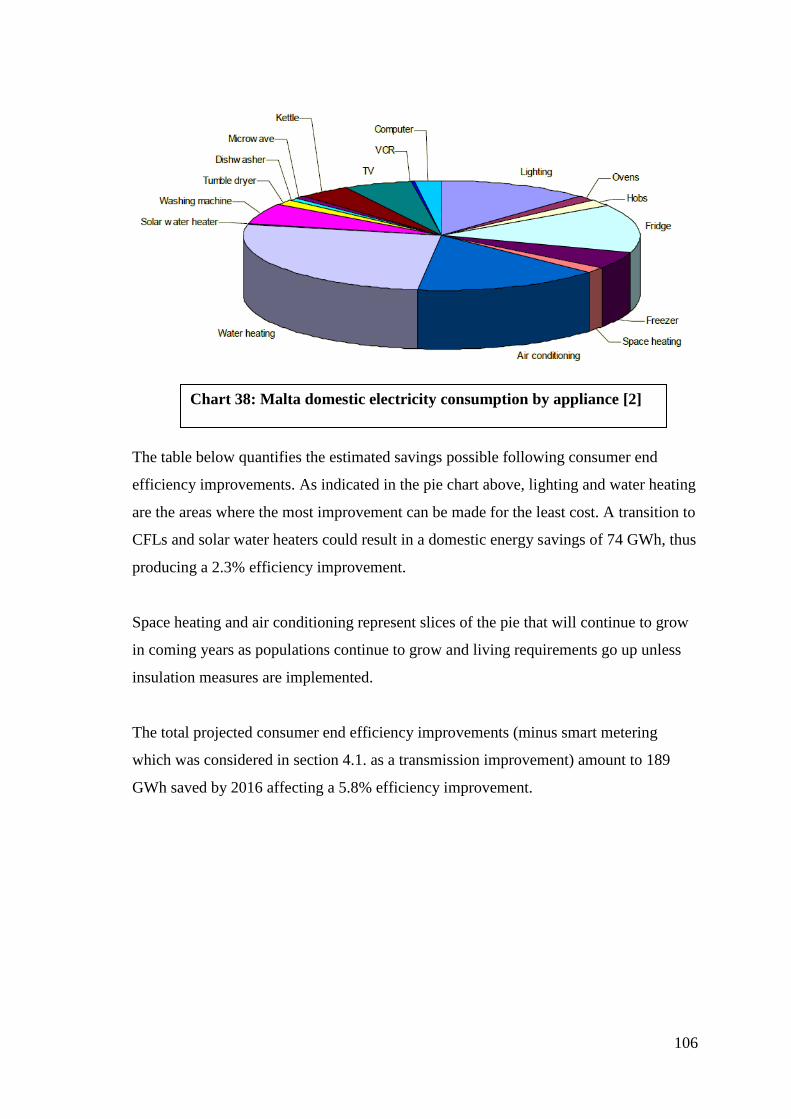
106
The table below quantifies the estimated savings possible following consumer end
efficiency improvements. As indicated in the pie chart above, lighting and water heating
are the areas where the most improvement can be made for the least cost. A transition to
CFLs and solar water heaters could result in a domestic energy savings of 74 GWh, thus
producing a 2.3% efficiency improvement.
Space heating and air conditioning represent slices of the pie that will continue to grow
in coming years as populations continue to grow and living requirements go up unless
insulation measures are implemented.
The total projected consumer end efficiency improvements (minus smart metering
which was considered in section 4.1. as a transmission improvement) amount to 189
GWh saved by 2016 affecting a 5.8% efficiency improvement.
Chart 38: Malta domestic electricity consumption by appliance [2]
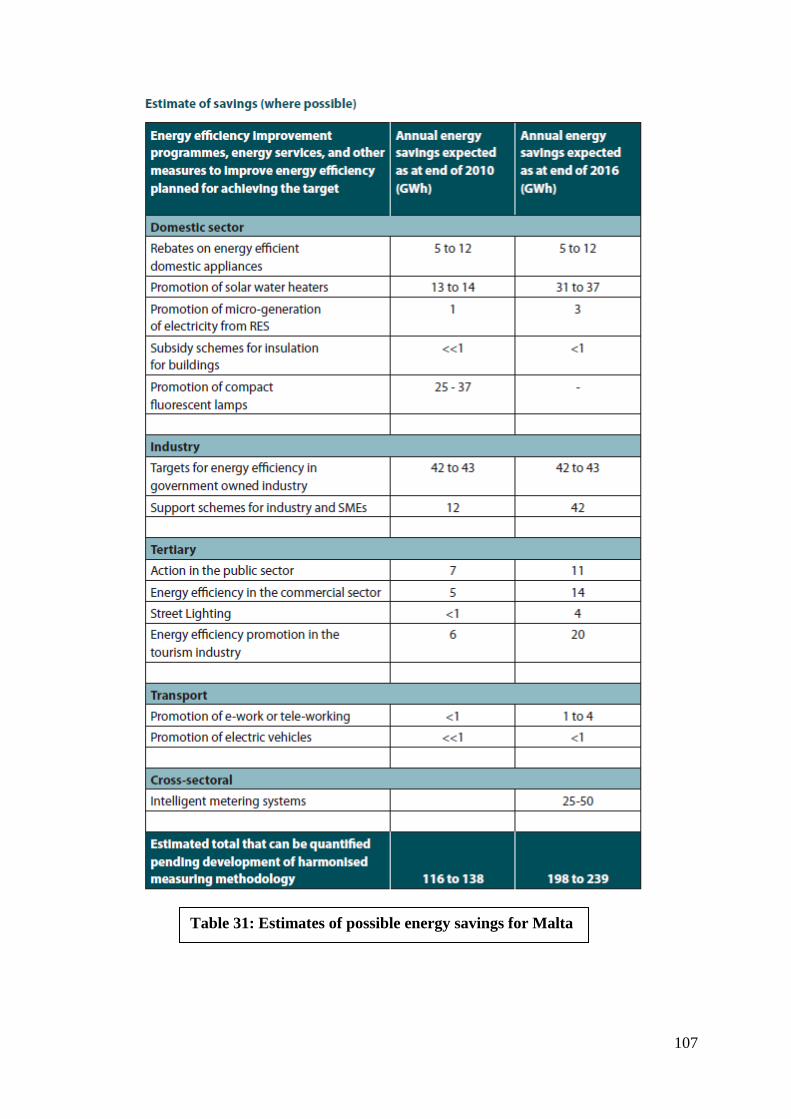
107
Table 31: Estimates of possible energy savings for Malta
[3]
108
Example of Energy Savings from Industry (Reverse Osmosis Plants)
An average Reverse Osmosis (RO) plant needs approximately six kilowatt-hours of
electricity to desalinate one cubic meter of water meaning that the process is not only
energy intensive but costly. Malta‟s RO Plants produced a total of 17 million cubic
meters of water in 2007 (57% of total water usage). This represented a total energy
consumption of about 60,000 GWh [4]. Since energy consumption at RO plants is a
major cost, the Water Services Corporation (WSC) embarked on a multitude of
investments to increase energy efficiency including the installation of Pelton wheels at
Pembroke which increased efficiency from 4.5 kWh / m3 to 3.6 kWh / m3 and pressure
exchangers at Ghar Lapsi, increasing efficiency from 4.8 kWh/m3 to 3.2 kWh/m
3[5].
The combination of these efficiency improvements have resulted in a total energy
saving of over 13 million kWh / year or 13 GWh/year. This will represent a national
energy savings of 0.4% for 2020 and with an average cost of electricity at 10c / kWh
this represents a savings of 1.3 million Euro / year. The investments were capital
intensive but due to the over 30% reduction in energy consumption per m3 of water
produced they were extremely good investments which resulted in a return on
investment of less than four years. [6]
The 2008 Malta Energy Efficiency Action Plan gives a guideline for energy savings for
energy end use in line with Directive 2006/32/EC. The Target adopted for 2016 was:
9% energy efficiency of 378 GWh energy savings per year. [3]
Unfortunately, such success stories of significant energy savings within industry are rare
as there is little incentive for industry to aggressively pursue energy efficiency
measures. The reason for this is that prices of electricity for industry are kept artificially
low.
In Malta industry actually pays less for electric energy than it costs to produce. The
result of being able to acquire a cheap source of electricity is that there is much less
incentive for energy efficiency. There is an EU policy against state aid to private
industry except in special circumstances [7]. The present policy of subsidizing Maltese
industry with below cost electric power is probably a violation of this policy. It is
therefore recommended that electricity prices for industry be raised to at least a level
109
which reflects the cost of production. With a rise in prices, industry would be
incentivized to implement energy efficiency measures that have good return on
investments as that would then become economic due to the increased potential for
money savings. Such a rise in prices may cause economic pain in the short term but
would result in a much more efficient and economically viable economy over the long
term. Any price rise should be well programmed and announced in advance to assuage
the negative impacts stemming from such a rise.
Conservation Voltage Reduction
Conservation Voltage Reduction (CVR) is a reduction of energy consumption as a result
of a reduction in feeder voltage. Pursuant to an article in the October issue of the IEEE
Spectrum, reducing the end user voltage levels to the lower end of the allowable voltage
band in the USA reduces end user power consumption by up to 6% in certain
appliances. For example induction motors used in many appliances such as fans and
refrigerators usually operate at a lower mechanical load than they are rated to handle.
Higher voltages therefore generate stronger magnetic fields than the motors can use,
thus wasting energy. [8] This power conservation technique is explained extensively in
“Evaluation of Conservation Voltage Reduction (CVR) on a National Level”, July 2010
[9] where CVR is shown capable of providing peak load reductions and annual energy
reductions in the USA of approximately 1.5%-4% depending on the specific feeder.
The EU regulations for voltage are now 230 V ±10% (207V-253V). [10] The
implementation of the Smart Meter Grid system could facilitate the introduction of CVR
into Malta.
CVR is therefore ideal, because meaningful energy savings can be accomplished
without the problems inherent in attempting to change user habits and lifestyles.
110
VII. Consequences of Non-Achievement
Matters of renewable non compliance are referred to the ECJ (European Court of
Justice) which would then impose penalties that correspond to the same amount that
Malta would have to invest to reach its obligations. These penalties would have to be
paid until the time that Malta becomes compliant; therefore, these penalty measures
incentivize compliance.
A 2010 report by the National Audit Office (NAO) details the potential financial
liability for Malta should it not achieve its mandatory 2020 renewable goals. The
conclusions of this report were that Malta‟s contingent liability for renewable energy
shortfall could range from “€2.9 to €36.1 million for every one percent shortfall from
the renewable energy targets”. The report goes on to state that further risks of non-
attainment of renewable goals include further non-compliance costs that stem from
other EU directives. [1]
Non attainment of renewable goals could mean that Malta would not reach its CO2
emissions target as stated in Directive 2001/81/EC which could result in an obligation to
purchases CO2 allowances that would cost between €90 and €100 per tonne to make up
the shortfall. [1] However, the CO2 allowance market is highly variable and prices could
be considerably lower than this by 2020.
Solely from an economic perspective it is not worth it for Malta to miss its 2020
renewable goals by any amount as the EU penalty measures are designed to ensure that
Member States are fully incentivized to meet their goals.
In addition to the heavy financial liability that stems from non-attainment of 2020
renewable goals, there are a number of other liabilities that will be incurred from non-
attainment.
These include:
Health Liability: a continued dependence on local non-renewable power production
facilities would mean that emissions would continue to be a hazard especially for an
Island like Malta where any power plant is within a short distance of built up urban
areas. This could likely further impact the already hard hit real estate market in Malta.

111
Bad Publicity: non-attainment of 2020 renewable goals would result in bad publicity
for Malta. Numerous newspaper articles have already been written criticizing Malta for
lagging behind achieving its renewable goals (based upon the assigned trajectory from
the EU). Such publicity may severely impact the tourism industry for Malta.
Political Liability: (loss of national prestige): other member states that have put
considerable effort into achieving their respective goals could look unfavorably towards
other member states that fall behind in reaching their goals, thus causing a lag in
achievement of the Union wide goal. Due to Malta‟s small size, its effects on the EU
targets are minimal, so the issue here is more of principle than substance.
Continued Dependence on Foreign Oil: the less of a renewable share Malta has, the
more dependent it will be on oil imports that predominately come from non European
Union countries (mostly North African and Middle Eastern) to which Malta does not
necessarily have the best diplomatic relations with and which can be politically
tumultuous.
Clearly, Malta should make its utmost to achieve its 2020 goals in the most economic
and least environmentally impacting way possible as the consequent liabilities of non-
achievement far outweigh the effort required to achieve these goals.
112
VIII. Conclusions
Malta‟s energy politics
This paper is not in any way attempting to tackle the political and/or corporate structure
of Malta‟s energy sector; however, it is impossible to disassociate the implementation of
renewable energy projects from the inherent conflicts of interest associated with
Enemalta. Enemalta‟s status as an energy monopoly controlled by the government
which is in turn controlled by an elected political party obviously sublimates all else to
political concerns i.e., votes. Elections in Malta are decided on razor thin margins
between two parties; the 2008 election was decided on just over 1,000 votes. [1] With
so much riding on a few hundred votes, decisions are often made by placing the political
process first. Political cronyism can be a strong influence, especially if there is a lack of
transparency when entering into contracts.
Just two days prior to the March 2008 election the Emission Laws of Malta were
changed:
“The change…occurred at a very late stage, just a few days before
the expiry of deadline for the receipt of the final bids…to benefit
one of the exceptions to the applicability of the Large Combustion
Plant Directive…” [2]
Minister Michael Barnier, EC Commission, June 2010 in his letter to malta’s Foreign
Minister, Tonio Borg
The change of the Emissions Law increased the emission limits for diesel engines, but
retained current emission values for gas plants, thereby giving an unfair advantage to
BWSC, the only company offering a tender for a diesel powered plant. In June 2010,
European Commissioner for Internal Market and Services Michel Barnier sent a letter to
Malta (which has not been published by the Government but is published by the
opposition Labor Party) the contents of which raises serious doubts as to the legality of
Malta‟s changes to the emission rules in the tender document; which the EC says was
carried out to benefit the Danish firm BWSC‟s bid for a diesel-powered engine that had
been previously ruled out because of existing emission laws. [3]
The EU is currently facing a catharsis and EU Members of Parliament are presently
(29th
October, 2010) in Brussels to discuss strengthening sanctions against member
countries that breach deficit rules. With no fiscal discipline, EU countries have no
incentive to comply with EU directives. The EC is considering placing „sanctions‟ on
113
members that exceed a debt threshold of 60% of GDP.[4] In 2009 Malta debt stood at
about 70% of GDP; however, that 70% of GDP debt doesn‟t include the ever rising debt
Enemalta continues to accumulate. [5] [See Appendix A, Table A7]
Malta is a small densely populated island country which magnifies problems relating to
energy production. The scale of production is an essential factor in determining cost-
effectiveness of a project; however larger and more cost-effective projects are not an
option for Malta due to lack of spatial availability and lack of demand. As a permanent
member of the European Union, Malta is now secure in its status; thus, investment and
reliance on other Member States should be considered politically safe due to the myriad
of enforcement measures and political pressures from other Member States that protect
such investments.
The most cost effective investment was found to be a local one, the improvement of the
transmission and distribution grid. Malta being the smallest member of the European
Union should theoretically have the most efficient grid as the major technical limitation
on power losses are the distances involved in transmission. Ironically, Malta has the
second highest losses in the EU mainly as a result of a poor transmission and
distribution grid coupled with a high degree of electrical energy theft. Efficiency goals
can be achieved solely through technical improvements of both production and the grid,
plus the elimination of electrical energy theft. Furthermore a 10% improvement in
efficiency means that renewable share can be 10% less than originally required (or 9%
overall) requirement in renewable share compared to a scenario without such
improvement. It also results in an effective over 10% reduction in overall emissions.
A significant expansion of meter inspection, awareness programs, comprehensive
installation of the smart meter system, and capital investment to reduce technical losses
are means by which these goals can be achieved. It is essential that transmission and
distribution efficiency improvements be pursued aggressively.
Even considering the fact that Sicily has the highest electricity prices in Italy, it still has
considerably lower electrical energy prices than Malta. The Sicily interconnection is far
more economic than local non-renewable electricity generation (over 2 c / kWh or
20%). In addition to being more economic, each unit of energy that is imported rather
114
than produced locally equates to a unit less of emissions and thus less health and
environmental consequences for the Country. Planned improvements to Sicily‟s power
transmission infrastructure as well as new connections to the Italian mainland are
forecast to significantly reduce these prices in the years to come, making an
interconnection an even more cost-effective investment.
With regard to ensuring achievement of renewable goals, a foreign wind farm (such as
one similar to Gunfleet Sands, U.K.) would be up to 1 billion Euros more cost effective
over a local one factoring in a full 25 year time frame. Investing abroad would avoid all
of various spatial conflicts that would arise as a result of the construction of a local wind
farm. Additionally, it is not yet known if it is even possible to build the proposed
traditional monopile offshore structures at selected local sites due to the weak limestone
bedrock that has been proven to have hidden cavities.
Finally, there is significant room for improvement in consumer end efficiency.
Domestic lighting and water heating account for almost half of total electrical
consumption and this share could be reduced by almost 90% with a complete transition
to compact fluorescent light bulbs and solar water heaters. With regard to private
industry, current consumer end saving efficiency plans for Malta only loosely target the
subject with a main focus on savings in the government sector. However, private
industry should also be incentivized to initiate energy savings through the installation of
realistic price mechanisms for electrical energy consumption. Residential consumers
should not have to subsidize Malta‟s private industry.
With full weighting of the Economic, Environmental and Social considerations it is
recommended that Malta:
i. Improve the efficiency of its transmission and distribution grid by implementing
aggressive electrical theft countermeasures and grid technical efficiency
improvements.
ii. Choose electrical interconnection over expansion of local production when
considering capacity expansion.
115
iii. Invest in foreign offshore wind projects which are far more economic and
eliminate the land use issues that plague local offshore wind consideration.
iv. Encourage consumer electrical efficiency improvements, especially from the
industrial sector by implementing a real time electricity pricing system to reflect
the real price of the generation of electricity. Such a pricing system may be
politically controversial in the short term as it would probably result in price
increases from their artificially suppressed levels, but in the long term would result
in a return to financial sustainability for Enemalta, encourage consumer end
efficiency improvements and allow for an efficient market dynamic.
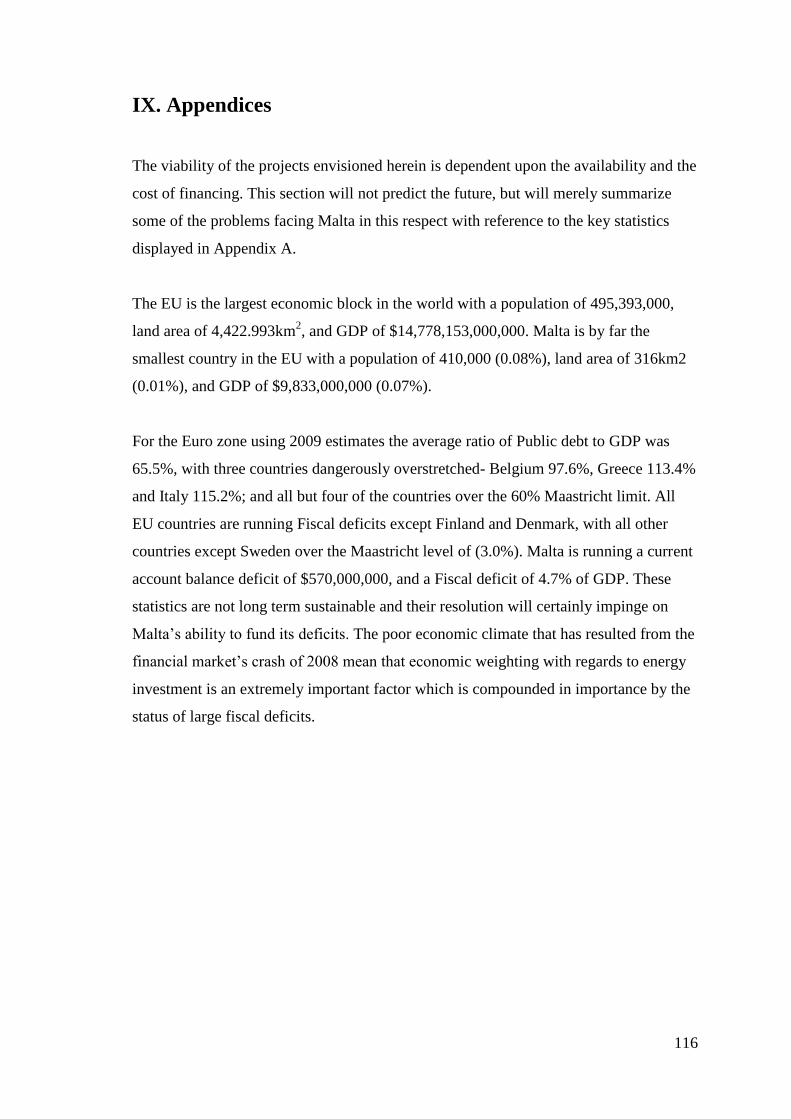
116
IX. Appendices
The viability of the projects envisioned herein is dependent upon the availability and the
cost of financing. This section will not predict the future, but will merely summarize
some of the problems facing Malta in this respect with reference to the key statistics
displayed in Appendix A.
The EU is the largest economic block in the world with a population of 495,393,000,
land area of 4,422.993km2, and GDP of $14,778,153,000,000. Malta is by far the
smallest country in the EU with a population of 410,000 (0.08%), land area of 316km2
(0.01%), and GDP of $9,833,000,000 (0.07%).
For the Euro zone using 2009 estimates the average ratio of Public debt to GDP was
65.5%, with three countries dangerously overstretched- Belgium 97.6%, Greece 113.4%
and Italy 115.2%; and all but four of the countries over the 60% Maastricht limit. All
EU countries are running Fiscal deficits except Finland and Denmark, with all other
countries except Sweden over the Maastricht level of (3.0%). Malta is running a current
account balance deficit of $570,000,000, and a Fiscal deficit of 4.7% of GDP. These
statistics are not long term sustainable and their resolution will certainly impinge on
Malta‟s ability to fund its deficits. The poor economic climate that has resulted from the
financial market‟s crash of 2008 mean that economic weighting with regards to energy
investment is an extremely important factor which is compounded in importance by the
status of large fiscal deficits.
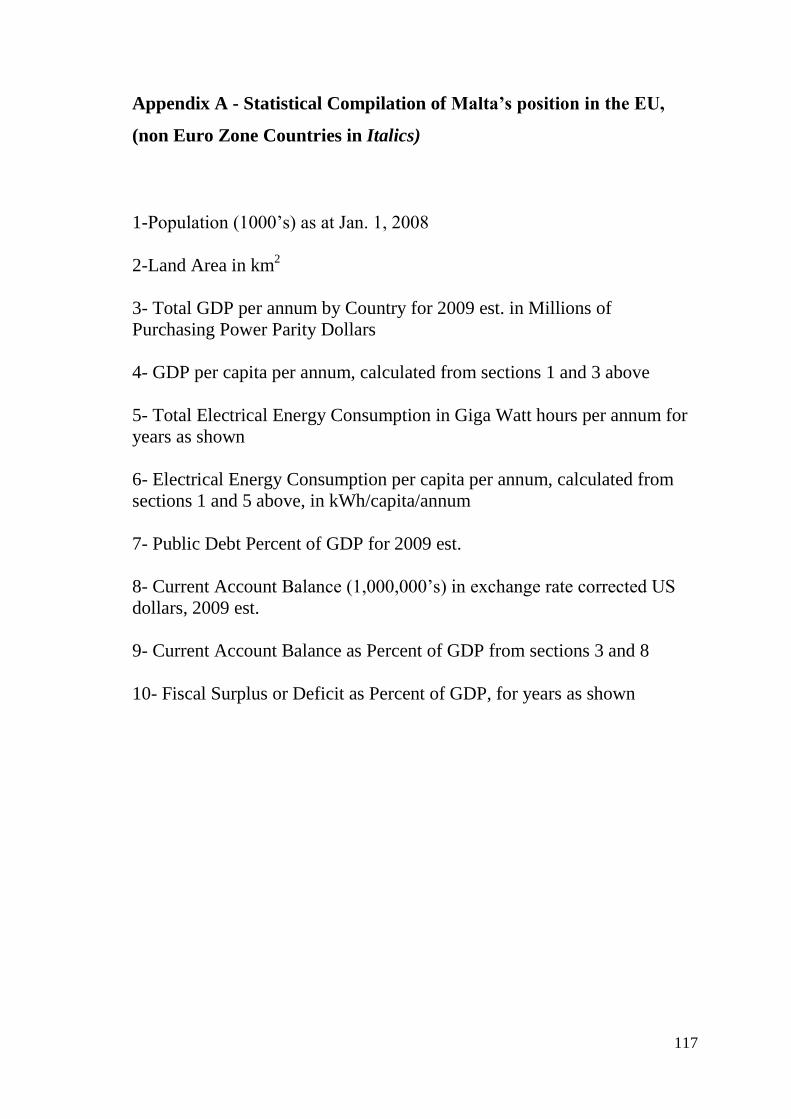
117
Appendix A - Statistical Compilation of Malta‟s position in the EU,
(non Euro Zone Countries in Italics)
1-Population (1000‟s) as at Jan. 1, 2008
2-Land Area in km2
3- Total GDP per annum by Country for 2009 est. in Millions of
Purchasing Power Parity Dollars
4- GDP per capita per annum, calculated from sections 1 and 3 above
5- Total Electrical Energy Consumption in Giga Watt hours per annum for
years as shown
6- Electrical Energy Consumption per capita per annum, calculated from
sections 1 and 5 above, in kWh/capita/annum
7- Public Debt Percent of GDP for 2009 est.
8- Current Account Balance (1,000,000‟s) in exchange rate corrected US
dollars, 2009 est.
9- Current Account Balance as Percent of GDP from sections 3 and 8
10- Fiscal Surplus or Deficit as Percent of GDP, for years as shown
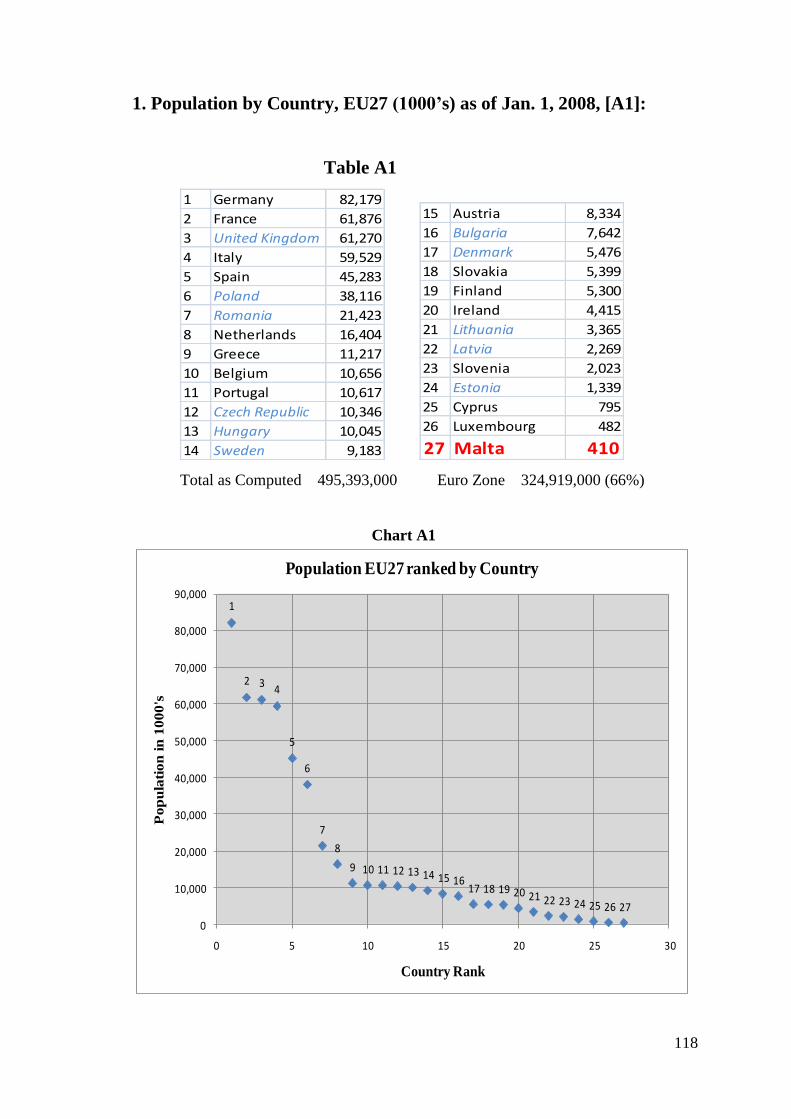
118
1. Population by Country, EU27 (1000‟s) as of Jan. 1, 2008, [A1]:
Table A1
1 Germany 82,179
2 France 61,876
3 United Kingdom 61,270
4 Italy 59,529
5 Spain 45,283
6 Poland 38,116
7 Romania 21,423
8 Netherlands 16,404
9 Greece 11,217
10 Belgium 10,656
11 Portugal 10,617
12 Czech Republic 10,346
13 Hungary 10,045
14 Sweden 9,183
15 Austria 8,334
16 Bulgaria 7,642
17 Denmark 5,476
18 Slovakia 5,399
19 Finland 5,300
20 Ireland 4,415
21 Lithuania 3,365
22 Latvia 2,269
23 Slovenia 2,023
24 Estonia 1,339
25 Cyprus 795
26 Luxembourg 482
27 Malta 410
Total as Computed 495,393,000 Euro Zone 324,919,000 (66%)
Chart A1
1
2 34
5
6
7
8
9 10 11 12 13 14 15 1617 18 19 20 21 22 23 24 25 26 27
0
10,000
20,000
30,000
40,000
50,000
60,000
70,000
80,000
90,000
0 5 10 15 20 25 30
Po
pu
lati
on
in
10
00
's
Country Rank
Population EU27 ranked by Country
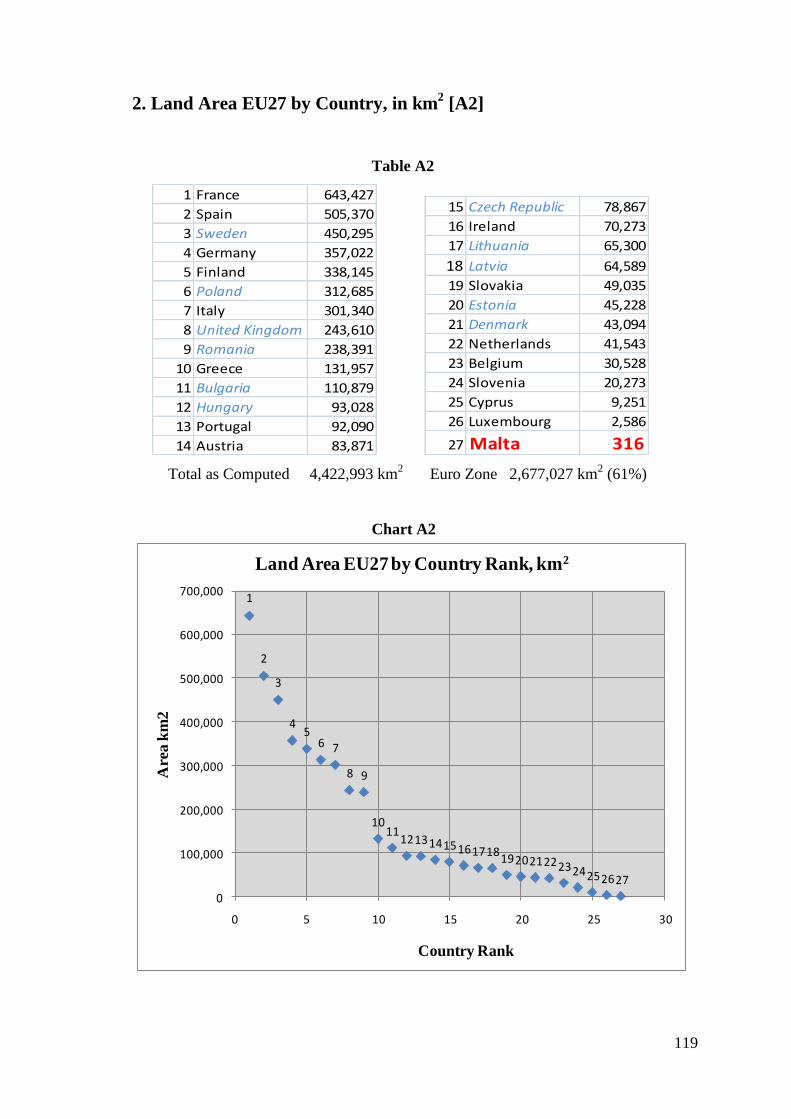
119
2. Land Area EU27 by Country, in km2 [A2]
Table A2
1 France 643,427
2 Spain 505,370
3 Sweden 450,295
4 Germany 357,022
5 Finland 338,145
6 Poland 312,685
7 Italy 301,340
8 United Kingdom 243,610
9 Romania 238,391
10 Greece 131,957
11 Bulgaria 110,879
12 Hungary 93,028
13 Portugal 92,090
14 Austria 83,871
15 Czech Republic 78,867
16 Ireland 70,273
17 Lithuania 65,300
18 Latvia 64,589
19 Slovakia 49,035
20 Estonia 45,228
21 Denmark 43,094
22 Netherlands 41,543
23 Belgium 30,528
24 Slovenia 20,273
25 Cyprus 9,251
26 Luxembourg 2,586
27 Malta 316
Total as Computed 4,422,993 km2
Euro Zone 2,677,027 km
2 (61%)
Chart A2
1
2
3
45
6 7
8 9
1011
12131415161718192021222324252627
0
100,000
200,000
300,000
400,000
500,000
600,000
700,000
0 5 10 15 20 25 30
Area
km
2
Country Rank
Land Area EU27 by Country Rank, km2
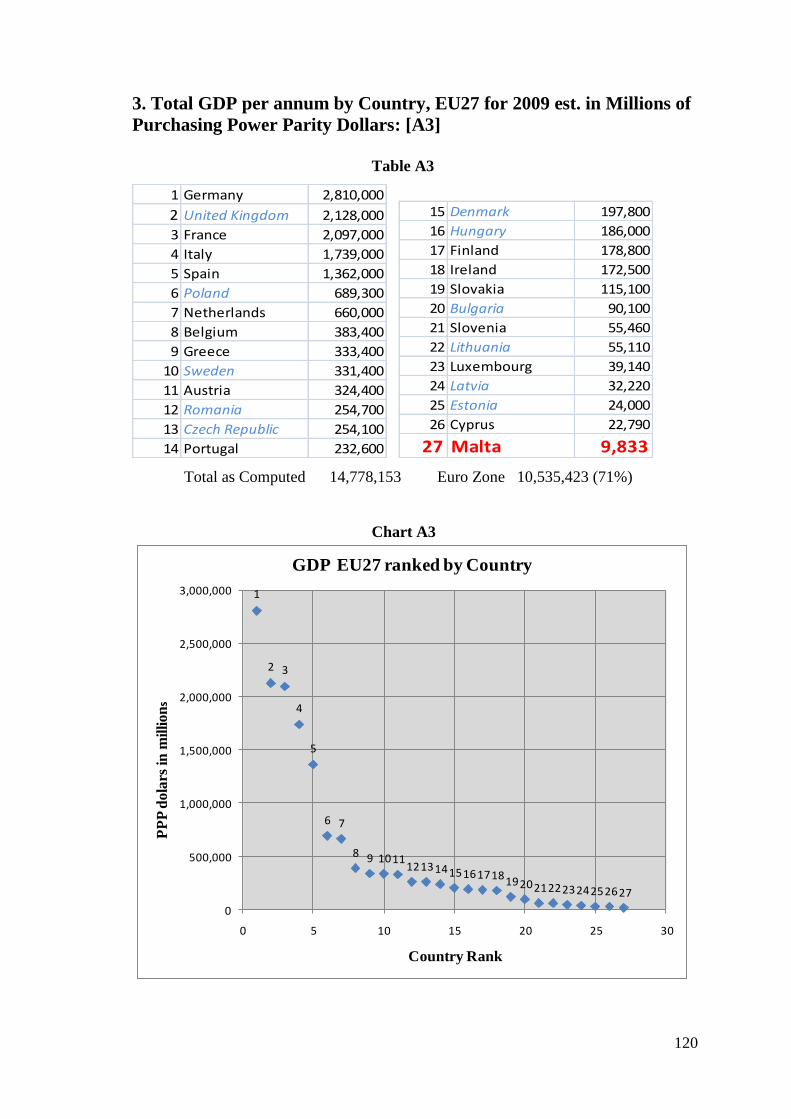
120
3. Total GDP per annum by Country, EU27 for 2009 est. in Millions of
Purchasing Power Parity Dollars: [A3]
Table A3
1 Germany 2,810,000
2 United Kingdom 2,128,000
3 France 2,097,000
4 Italy 1,739,000
5 Spain 1,362,000
6 Poland 689,300
7 Netherlands 660,000
8 Belgium 383,400
9 Greece 333,400
10 Sweden 331,400
11 Austria 324,400
12 Romania 254,700
13 Czech Republic 254,100
14 Portugal 232,600
15 Denmark 197,800
16 Hungary 186,000
17 Finland 178,800
18 Ireland 172,500
19 Slovakia 115,100
20 Bulgaria 90,100
21 Slovenia 55,460
22 Lithuania 55,110
23 Luxembourg 39,140
24 Latvia 32,220
25 Estonia 24,000
26 Cyprus 22,790
27 Malta 9,833
Total as Computed 14,778,153 Euro Zone 10,535,423 (71%)
Chart A3
1
2 3
4
5
6 7
8 9 101112131415161718
192021222324252627
0
500,000
1,000,000
1,500,000
2,000,000
2,500,000
3,000,000
0 5 10 15 20 25 30
PP
P d
ola
rs i
n m
illi
on
s
Country Rank
GDP EU27 ranked by Country
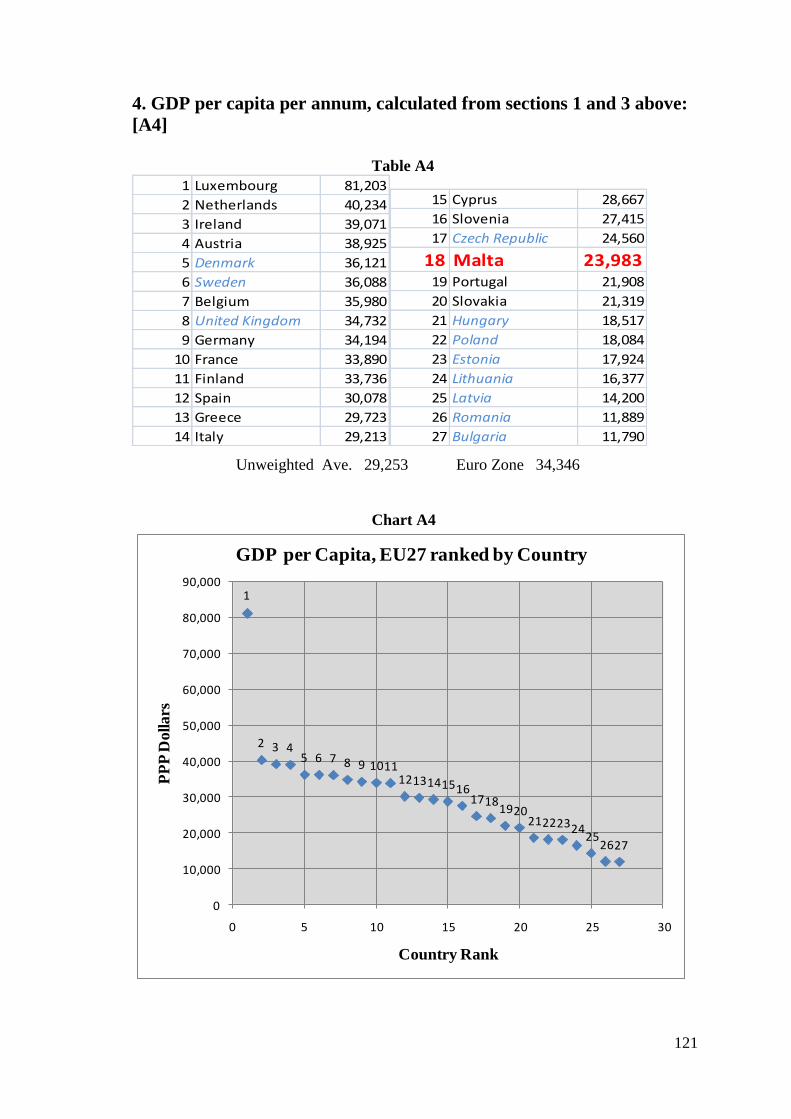
121
4. GDP per capita per annum, calculated from sections 1 and 3 above:
[A4]
Table A4
1 Luxembourg 81,203
2 Netherlands 40,234
3 Ireland 39,071
4 Austria 38,925
5 Denmark 36,121
6 Sweden 36,088
7 Belgium 35,980
8 United Kingdom 34,732
9 Germany 34,194
10 France 33,890
11 Finland 33,736
12 Spain 30,078
13 Greece 29,723
14 Italy 29,213
15 Cyprus 28,667
16 Slovenia 27,415
17 Czech Republic 24,560
18 Malta 23,98319 Portugal 21,908
20 Slovakia 21,319
21 Hungary 18,517
22 Poland 18,084
23 Estonia 17,924
24 Lithuania 16,377
25 Latvia 14,200
26 Romania 11,889
27 Bulgaria 11,790
Unweighted Ave. 29,253 Euro Zone 34,346
Chart A4
1
2 3 45 6 7 8 9 1011
12131415161718
192021222324
252627
0
10,000
20,000
30,000
40,000
50,000
60,000
70,000
80,000
90,000
0 5 10 15 20 25 30
PP
P D
oll
ars
Country Rank
GDP per Capita, EU27 ranked by Country
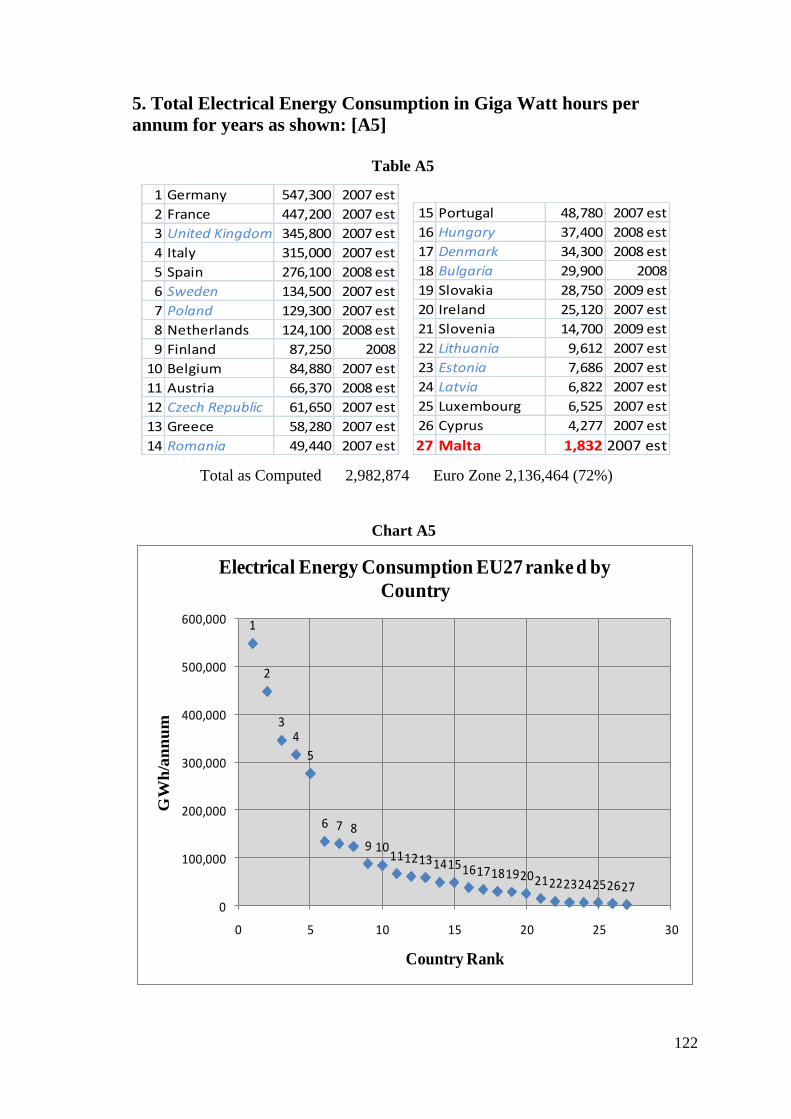
122
5. Total Electrical Energy Consumption in Giga Watt hours per
annum for years as shown: [A5]
Table A5
1 Germany 547,300 2007 est
2 France 447,200 2007 est
3 United Kingdom 345,800 2007 est
4 Italy 315,000 2007 est
5 Spain 276,100 2008 est
6 Sweden 134,500 2007 est
7 Poland 129,300 2007 est
8 Netherlands 124,100 2008 est
9 Finland 87,250 2008
10 Belgium 84,880 2007 est
11 Austria 66,370 2008 est
12 Czech Republic 61,650 2007 est
13 Greece 58,280 2007 est
14 Romania 49,440 2007 est
15 Portugal 48,780 2007 est
16 Hungary 37,400 2008 est
17 Denmark 34,300 2008 est
18 Bulgaria 29,900 2008
19 Slovakia 28,750 2009 est
20 Ireland 25,120 2007 est
21 Slovenia 14,700 2009 est
22 Lithuania 9,612 2007 est
23 Estonia 7,686 2007 est
24 Latvia 6,822 2007 est
25 Luxembourg 6,525 2007 est
26 Cyprus 4,277 2007 est
27 Malta 1,832 2007 est
Total as Computed 2,982,874 Euro Zone 2,136,464 (72%)
Chart A5
1
2
34
5
6 7 8
9 101112131415161718192021222324252627
0
100,000
200,000
300,000
400,000
500,000
600,000
0 5 10 15 20 25 30
GW
h/a
nn
um
Country Rank
Electrical Energy Consumption EU27 ranke d by
Country
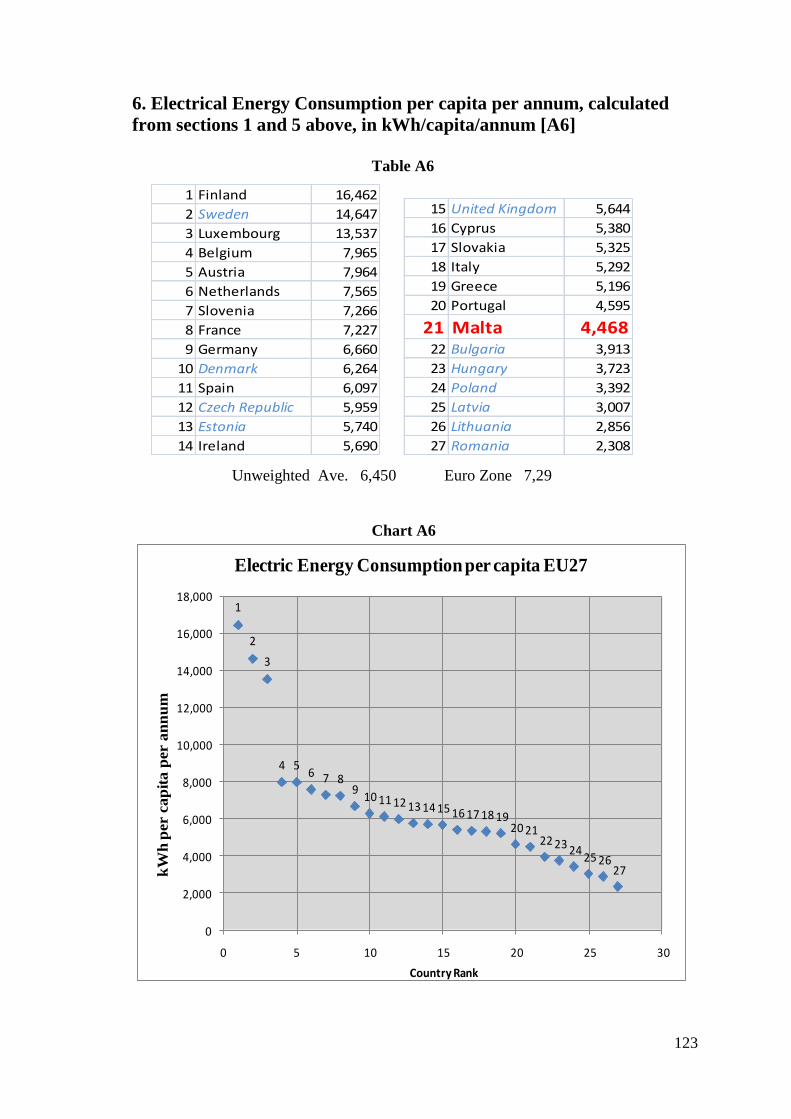
123
6. Electrical Energy Consumption per capita per annum, calculated
from sections 1 and 5 above, in kWh/capita/annum [A6]
Table A6
1 Finland 16,462
2 Sweden 14,647
3 Luxembourg 13,537
4 Belgium 7,965
5 Austria 7,964
6 Netherlands 7,565
7 Slovenia 7,266
8 France 7,227
9 Germany 6,660
10 Denmark 6,264
11 Spain 6,097
12 Czech Republic 5,959
13 Estonia 5,740
14 Ireland 5,690
15 United Kingdom 5,644
16 Cyprus 5,380
17 Slovakia 5,325
18 Italy 5,292
19 Greece 5,196
20 Portugal 4,595
21 Malta 4,46822 Bulgaria 3,913
23 Hungary 3,723
24 Poland 3,392
25 Latvia 3,007
26 Lithuania 2,856
27 Romania 2,308
Unweighted Ave. 6,450 Euro Zone 7,29
Chart A6
1
2
3
4 56 7 8
910 11 12 13 14 15 16 17 18 19
20 2122 23 24
25 2627
0
2,000
4,000
6,000
8,000
10,000
12,000
14,000
16,000
18,000
0 5 10 15 20 25 30
kW
h p
er c
ap
ita p
er a
nn
um
Country Rank
Electric Energy Consumption per capita EU27
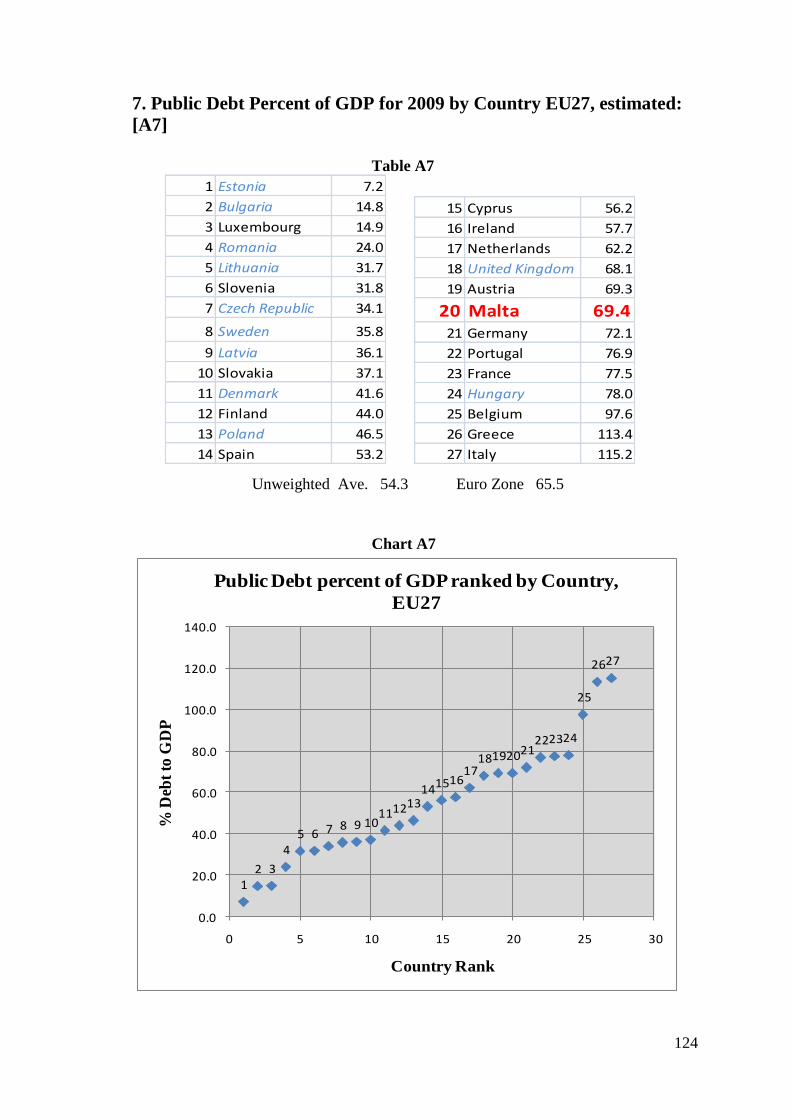
124
7. Public Debt Percent of GDP for 2009 by Country EU27, estimated:
[A7]
Table A7
1 Estonia 7.2
2 Bulgaria 14.8
3 Luxembourg 14.9
4 Romania 24.0
5 Lithuania 31.7
6 Slovenia 31.8
7 Czech Republic 34.1
8 Sweden 35.8
9 Latvia 36.1
10 Slovakia 37.1
11 Denmark 41.6
12 Finland 44.0
13 Poland 46.5
14 Spain 53.2
15 Cyprus 56.2
16 Ireland 57.7
17 Netherlands 62.2
18 United Kingdom 68.1
19 Austria 69.3
20 Malta 69.421 Germany 72.1
22 Portugal 76.9
23 France 77.5
24 Hungary 78.0
25 Belgium 97.6
26 Greece 113.4
27 Italy 115.2
Unweighted Ave. 54.3 Euro Zone 65.5
Chart A7
12 3
45 6 7 8 9 10
111213141516
1718192021
222324
25
2627
0.0
20.0
40.0
60.0
80.0
100.0
120.0
140.0
0 5 10 15 20 25 30
% D
ebt
to G
DP
Country Rank
Public Debt percent of GDP ranked by Country,
EU27
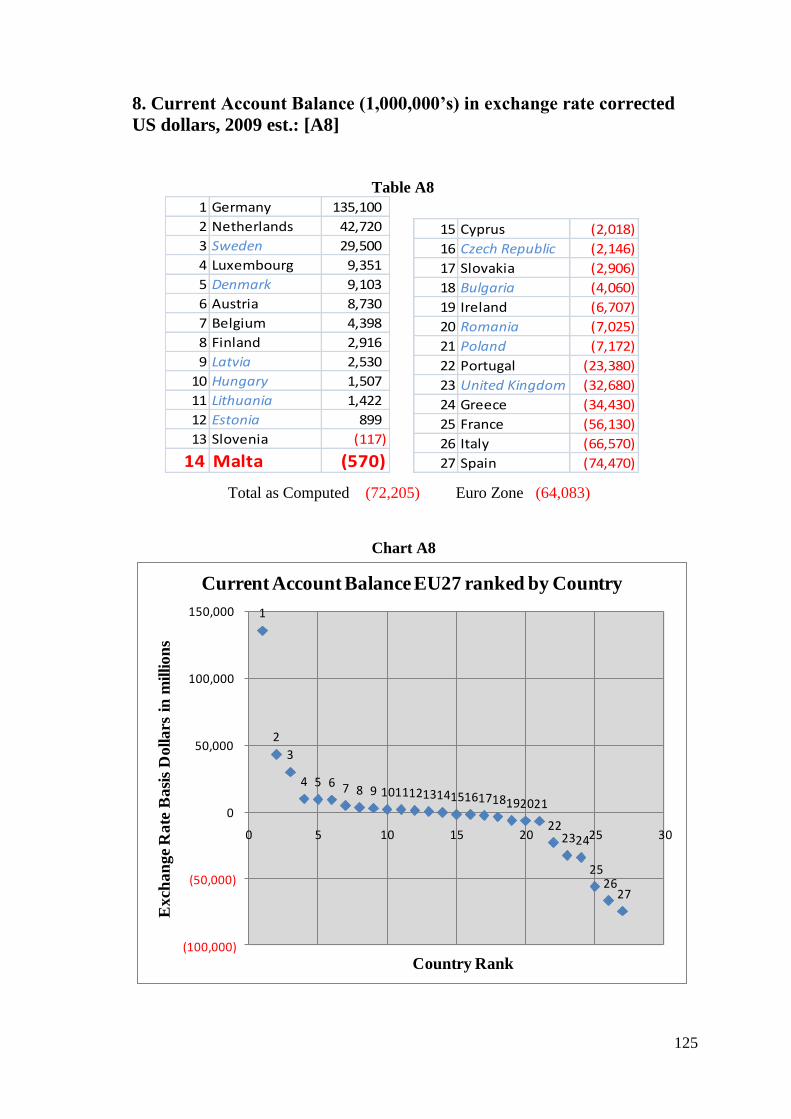
125
8. Current Account Balance (1,000,000‟s) in exchange rate corrected
US dollars, 2009 est.: [A8]
Table A8
1 Germany 135,100
2 Netherlands 42,720
3 Sweden 29,500
4 Luxembourg 9,351
5 Denmark 9,103
6 Austria 8,730
7 Belgium 4,398
8 Finland 2,916
9 Latvia 2,530
10 Hungary 1,507
11 Lithuania 1,422
12 Estonia 899
13 Slovenia (117)
14 Malta (570)
15 Cyprus (2,018)
16 Czech Republic (2,146)
17 Slovakia (2,906)
18 Bulgaria (4,060)
19 Ireland (6,707)
20 Romania (7,025)
21 Poland (7,172)
22 Portugal (23,380)
23 United Kingdom (32,680)
24 Greece (34,430)
25 France (56,130)
26 Italy (66,570)
27 Spain (74,470)
Total as Computed (72,205) Euro Zone (64,083)
Chart A8
1
2
3
4 5 6 7 8 9 101112131415161718192021
222324
2526
27
(100,000)
(50,000)
0
50,000
100,000
150,000
0 5 10 15 20 25 30
Exch
an
ge
Rate
Basi
s D
oll
ars
in
mil
lion
s
Country Rank
Current Account Balance EU27 ranked by Country
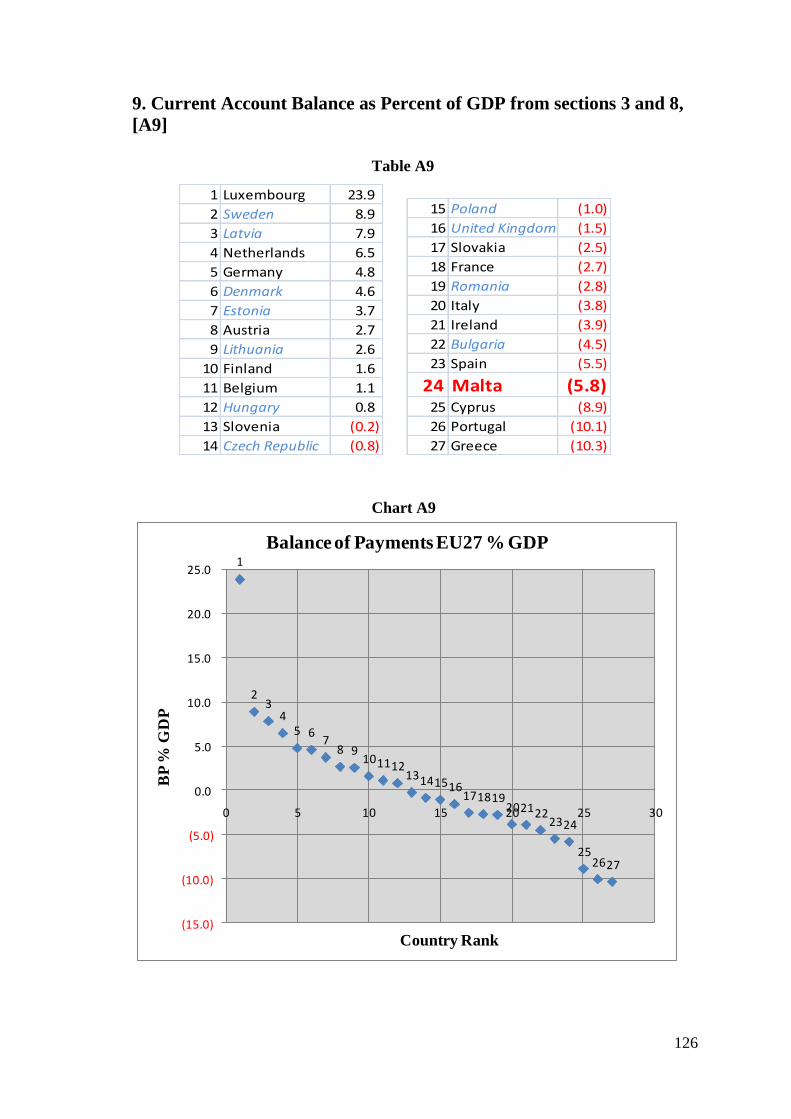
126
9. Current Account Balance as Percent of GDP from sections 3 and 8,
[A9]
Table A9
1 Luxembourg 23.9
2 Sweden 8.9
3 Latvia 7.9
4 Netherlands 6.5
5 Germany 4.8
6 Denmark 4.6
7 Estonia 3.7
8 Austria 2.7
9 Lithuania 2.6
10 Finland 1.6
11 Belgium 1.1
12 Hungary 0.8
13 Slovenia (0.2)
14 Czech Republic (0.8)
15 Poland (1.0)
16 United Kingdom (1.5)
17 Slovakia (2.5)
18 France (2.7)
19 Romania (2.8)
20 Italy (3.8)
21 Ireland (3.9)
22 Bulgaria (4.5)
23 Spain (5.5)
24 Malta (5.8)25 Cyprus (8.9)
26 Portugal (10.1)
27 Greece (10.3)
Chart A9
1
23
45 6
78 9
10111213141516
171819202122
2324
252627
(15.0)
(10.0)
(5.0)
0.0
5.0
10.0
15.0
20.0
25.0
0 5 10 15 20 25 30
BP
% G
DP
Country Rank
Balance of Payments EU27 % GDP
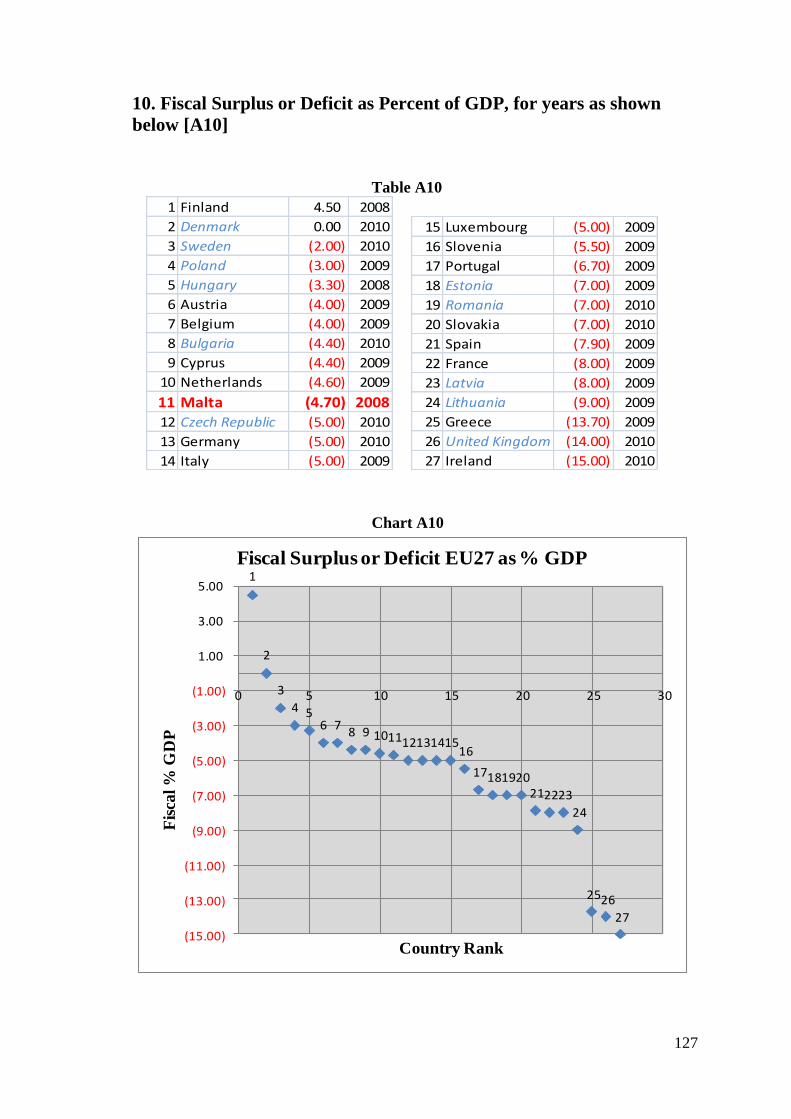
127
10. Fiscal Surplus or Deficit as Percent of GDP, for years as shown
below [A10]
Table A10
1 Finland 4.50 2008
2 Denmark 0.00 2010
3 Sweden (2.00) 2010
4 Poland (3.00) 2009
5 Hungary (3.30) 2008
6 Austria (4.00) 2009
7 Belgium (4.00) 2009
8 Bulgaria (4.40) 2010
9 Cyprus (4.40) 2009
10 Netherlands (4.60) 2009
11 Malta (4.70) 200812 Czech Republic (5.00) 2010
13 Germany (5.00) 2010
14 Italy (5.00) 2009
15 Luxembourg (5.00) 2009
16 Slovenia (5.50) 2009
17 Portugal (6.70) 2009
18 Estonia (7.00) 2009
19 Romania (7.00) 2010
20 Slovakia (7.00) 2010
21 Spain (7.90) 2009
22 France (8.00) 2009
23 Latvia (8.00) 2009
24 Lithuania (9.00) 2009
25 Greece (13.70) 2009
26 United Kingdom (14.00) 2010
27 Ireland (15.00) 2010
Chart A10
1
2
3
4 56 7
8 9 10111213141516
17181920212223
24
2526
27
(15.00)
(13.00)
(11.00)
(9.00)
(7.00)
(5.00)
(3.00)
(1.00)
1.00
3.00
5.00
0 5 10 15 20 25 30
Fis
cal %
GD
P
Country Rank
Fiscal Surplus or Deficit EU27 as % GDP
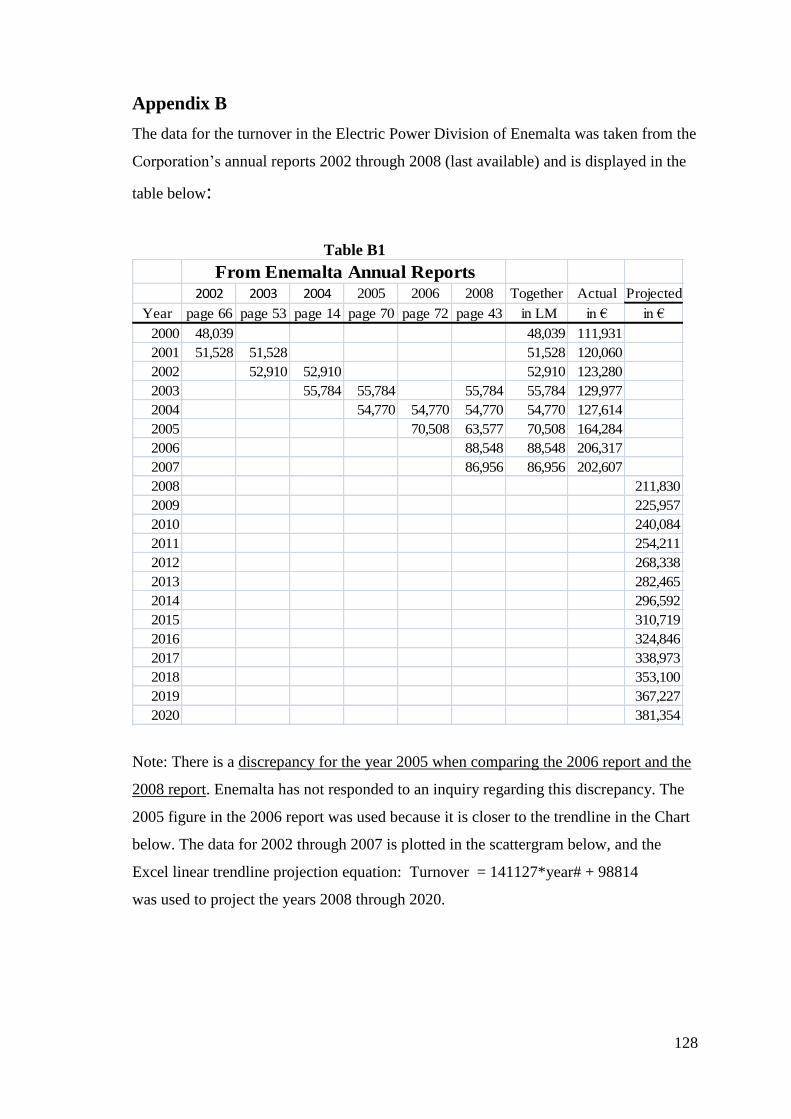
128
Appendix B
The data for the turnover in the Electric Power Division of Enemalta was taken from the
Corporation‟s annual reports 2002 through 2008 (last available) and is displayed in the
table below:
Table B1
From Enemalta Annual Reports2002 2003 2004 2005 2006 2008 Together Actual Projected
Year page 66 page 53 page 14 page 70 page 72 page 43 in LM in € in €
2000 48,039 48,039 111,931
2001 51,528 51,528 51,528 120,060
2002 52,910 52,910 52,910 123,280
2003 55,784 55,784 55,784 55,784 129,977
2004 54,770 54,770 54,770 54,770 127,614
2005 70,508 63,577 70,508 164,284
2006 88,548 88,548 206,317
2007 86,956 86,956 202,607
2008 211,830
2009 225,957
2010 240,084
2011 254,211
2012 268,338
2013 282,465
2014 296,592
2015 310,719
2016 324,846
2017 338,973
2018 353,100
2019 367,227
2020 381,354
Note: There is a discrepancy for the year 2005 when comparing the 2006 report and the
2008 report. Enemalta has not responded to an inquiry regarding this discrepancy. The
2005 figure in the 2006 report was used because it is closer to the trendline in the Chart
below. The data for 2002 through 2007 is plotted in the scattergram below, and the
Excel linear trendline projection equation: Turnover = 141127*year# + 98814
was used to project the years 2008 through 2020.
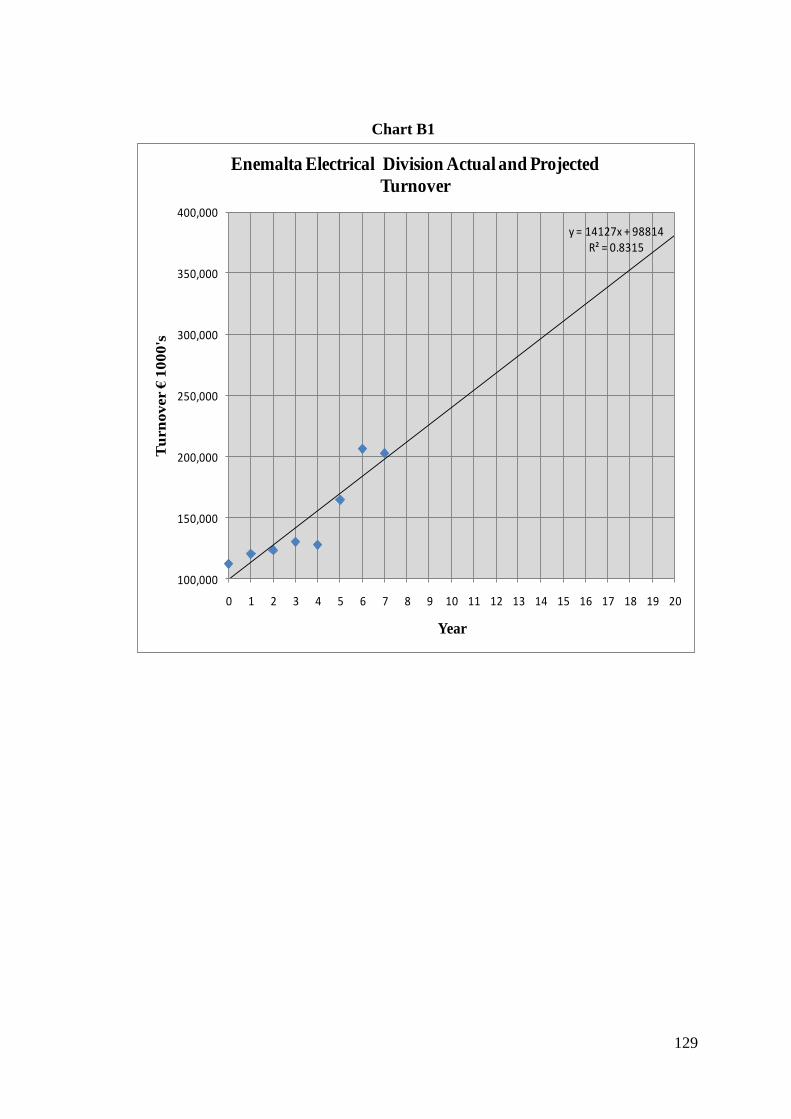
129
Chart B1
y = 14127x + 98814R² = 0.8315
100,000
150,000
200,000
250,000
300,000
350,000
400,000
0 1 2 3 4 5 6 7 8 9 10 11 12 13 14 15 16 17 18 19 20
Tu
rn
over €
1000's
Year
Enemalta Electrical Division Actual and Projected
Turnover
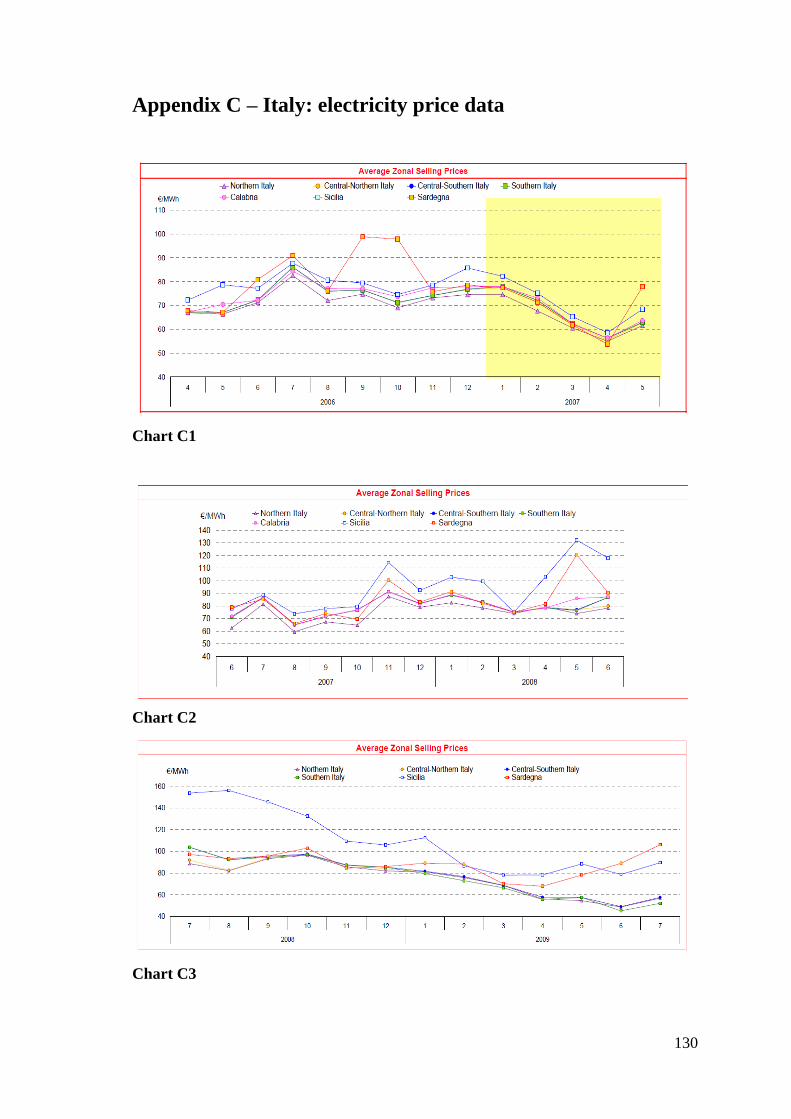
130
Appendix C – Italy: electricity price data
Chart C1
Chart C2
Chart C3
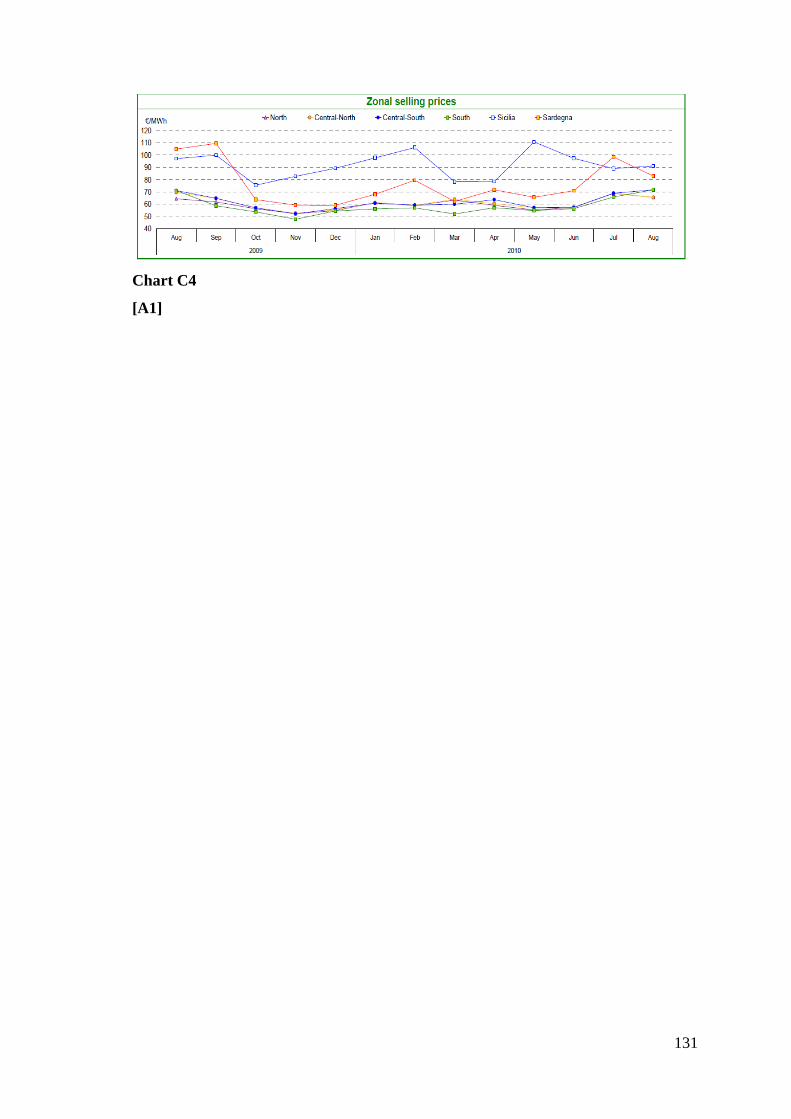
131
Chart C4
[A1]
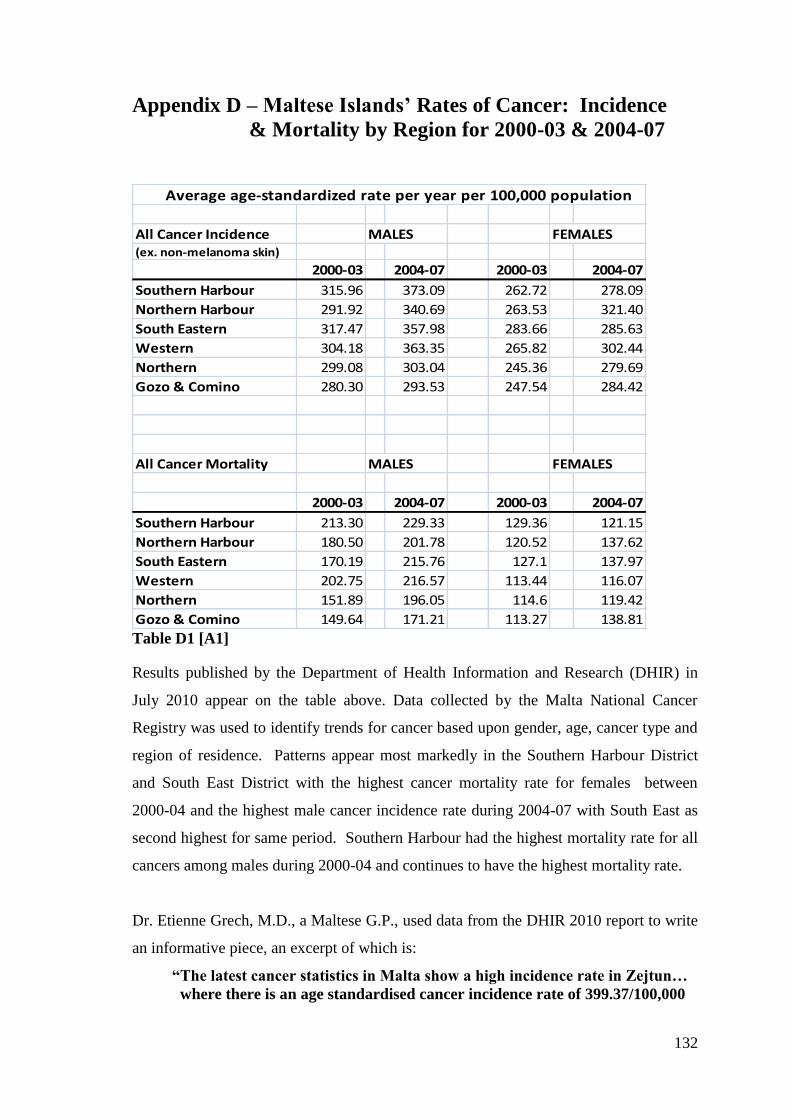
132
Appendix D – Maltese Islands‟ Rates of Cancer: Incidence
& Mortality by Region for 2000-03 & 2004-07
Average age-standardized rate per year per 100,000 population
All Cancer Incidence MALES FEMALES(ex. non-melanoma skin)
2000-03 2004-07 2000-03 2004-07
Southern Harbour 315.96 373.09 262.72 278.09
Northern Harbour 291.92 340.69 263.53 321.40
South Eastern 317.47 357.98 283.66 285.63
Western 304.18 363.35 265.82 302.44
Northern 299.08 303.04 245.36 279.69
Gozo & Comino 280.30 293.53 247.54 284.42
All Cancer Mortality MALES FEMALES
2000-03 2004-07 2000-03 2004-07
Southern Harbour 213.30 229.33 129.36 121.15
Northern Harbour 180.50 201.78 120.52 137.62
South Eastern 170.19 215.76 127.1 137.97
Western 202.75 216.57 113.44 116.07
Northern 151.89 196.05 114.6 119.42
Gozo & Comino 149.64 171.21 113.27 138.81 Table D1 [A1]
Results published by the Department of Health Information and Research (DHIR) in
July 2010 appear on the table above. Data collected by the Malta National Cancer
Registry was used to identify trends for cancer based upon gender, age, cancer type and
region of residence. Patterns appear most markedly in the Southern Harbour District
and South East District with the highest cancer mortality rate for females between
2000-04 and the highest male cancer incidence rate during 2004-07 with South East as
second highest for same period. Southern Harbour had the highest mortality rate for all
cancers among males during 2000-04 and continues to have the highest mortality rate.
Dr. Etienne Grech, M.D., a Maltese G.P., used data from the DHIR 2010 report to write
an informative piece, an excerpt of which is:
“The latest cancer statistics in Malta show a high incidence rate in Zejtun…
where there is an age standardised cancer incidence rate of 399.37/100,000
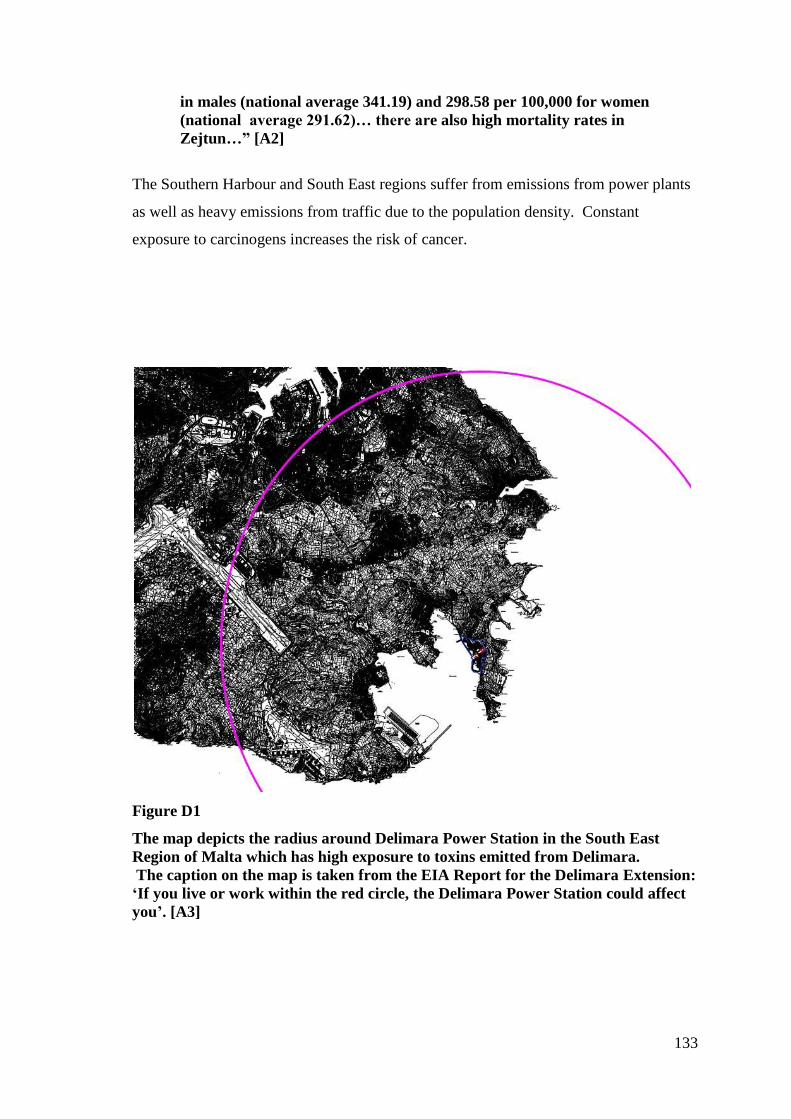
133
in males (national average 341.19) and 298.58 per 100,000 for women
(national average 291.62)… there are also high mortality rates in
Zejtun…” [A2]
The Southern Harbour and South East regions suffer from emissions from power plants
as well as heavy emissions from traffic due to the population density. Constant
exposure to carcinogens increases the risk of cancer.
Figure D1
The map depicts the radius around Delimara Power Station in the South East
Region of Malta which has high exposure to toxins emitted from Delimara.
The caption on the map is taken from the EIA Report for the Delimara Extension:
„If you live or work within the red circle, the Delimara Power Station could affect
you‟. [A3]
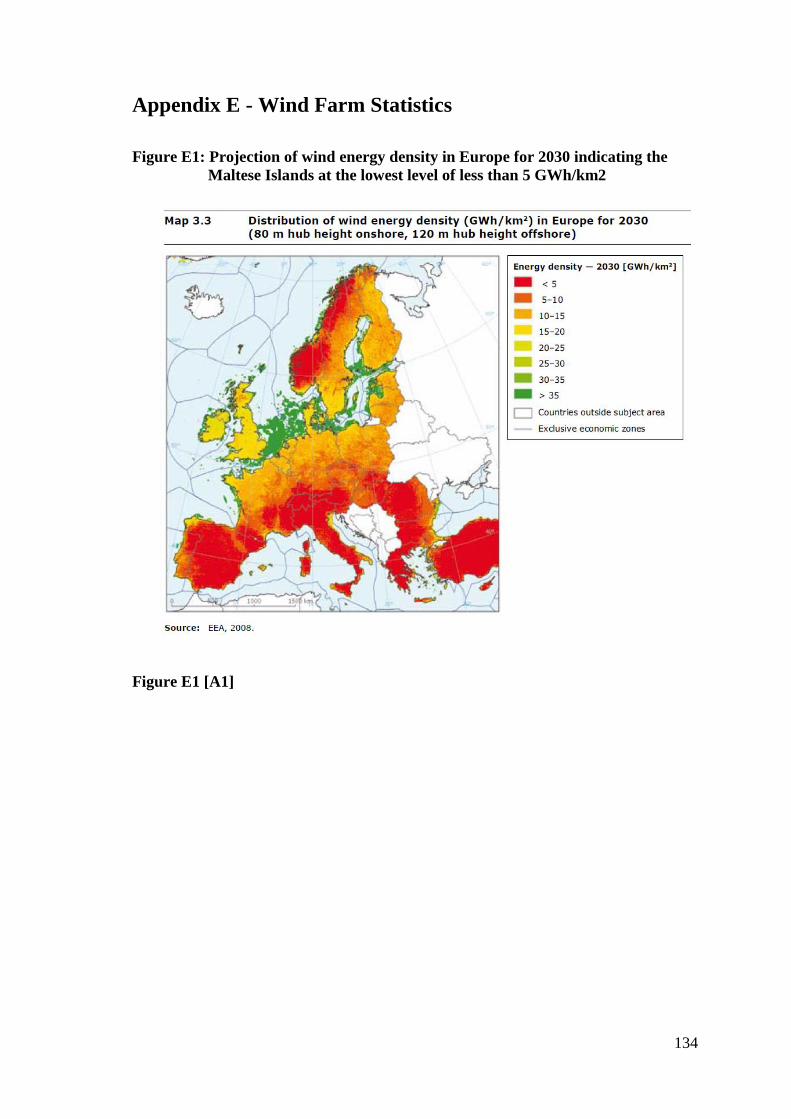
134
Appendix E - Wind Farm Statistics
Figure E1: Projection of wind energy density in Europe for 2030 indicating the
Maltese Islands at the lowest level of less than 5 GWh/km2
Figure E1 [A1]
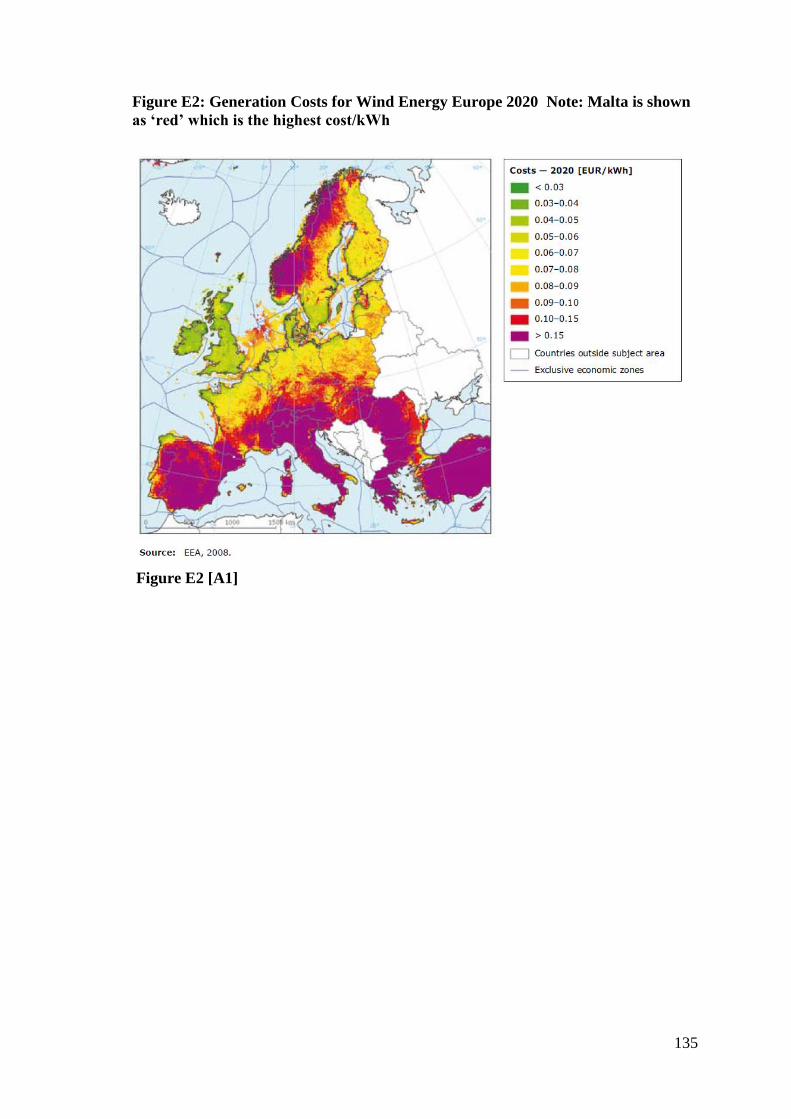
135
Figure E2: Generation Costs for Wind Energy Europe 2020 Note: Malta is shown
as „red‟ which is the highest cost/kWh
Figure E2 [A1]
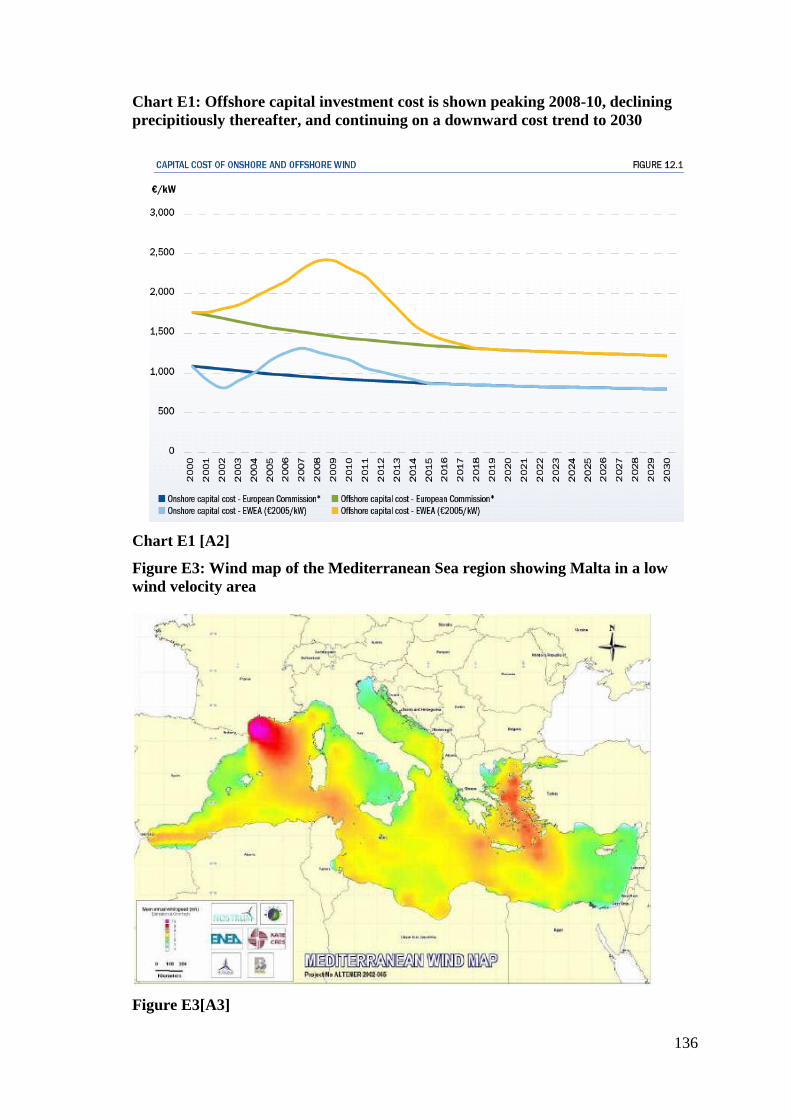
136
Chart E1: Offshore capital investment cost is shown peaking 2008-10, declining
precipitiously thereafter, and continuing on a downward cost trend to 2030
Chart E1 [A2]
Figure E3: Wind map of the Mediterranean Sea region showing Malta in a low
wind velocity area
Figure E3[A3]
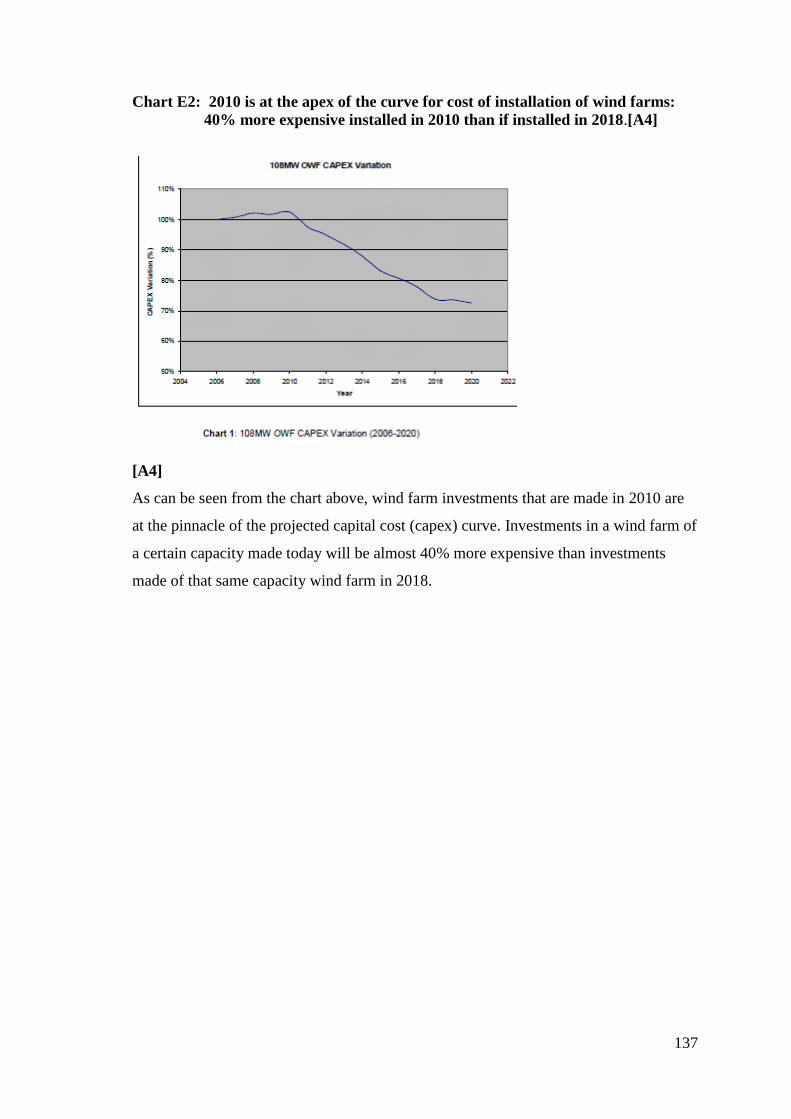
137
Chart E2: 2010 is at the apex of the curve for cost of installation of wind farms:
40% more expensive installed in 2010 than if installed in 2018.[A4]
[A4]
As can be seen from the chart above, wind farm investments that are made in 2010 are
at the pinnacle of the projected capital cost (capex) curve. Investments in a wind farm of
a certain capacity made today will be almost 40% more expensive than investments
made of that same capacity wind farm in 2018.
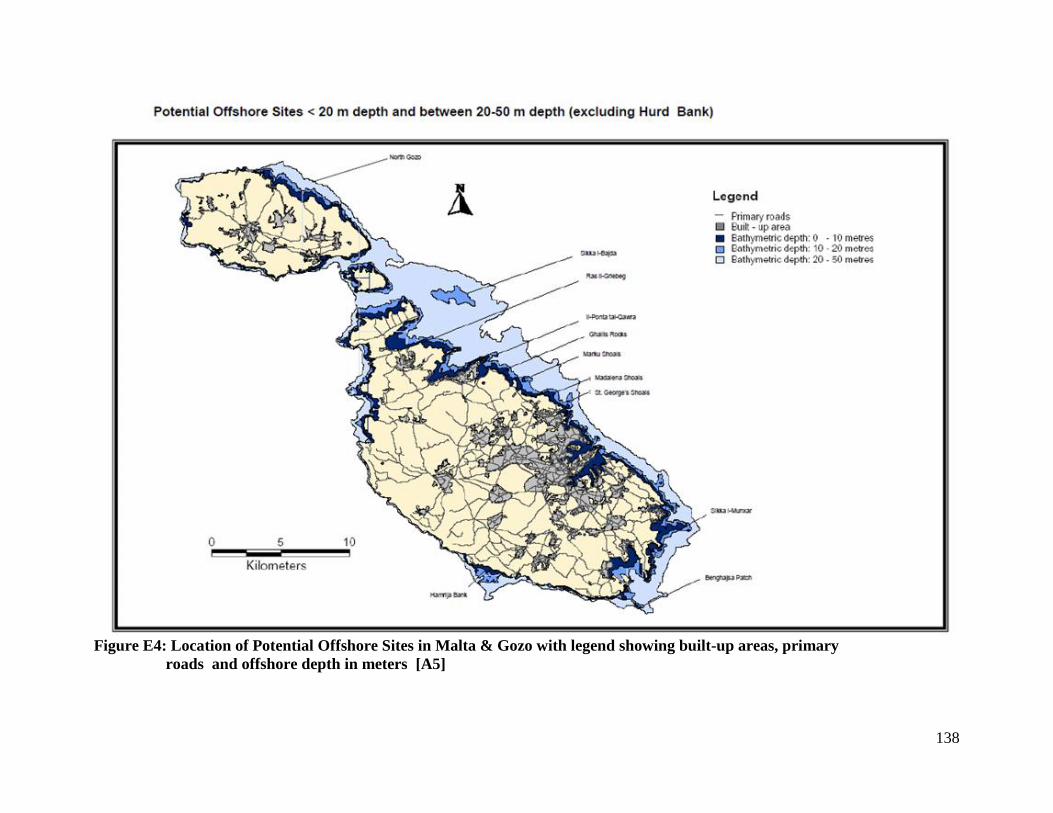
138
Figure E4: Location of Potential Offshore Sites in Malta & Gozo with legend showing built-up areas, primary
roads and offshore depth in meters [A5]
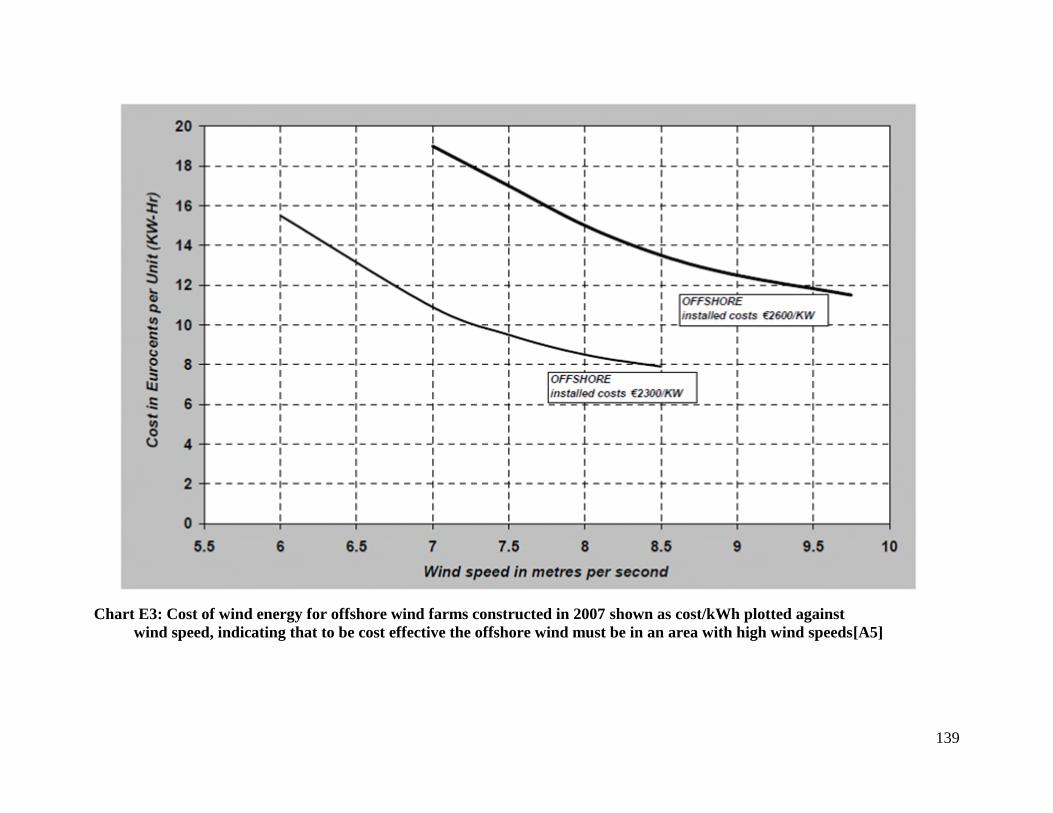
139
Chart E3: Cost of wind energy for offshore wind farms constructed in 2007 shown as cost/kWh plotted against
wind speed, indicating that to be cost effective the offshore wind must be in an area with high wind speeds[A5]
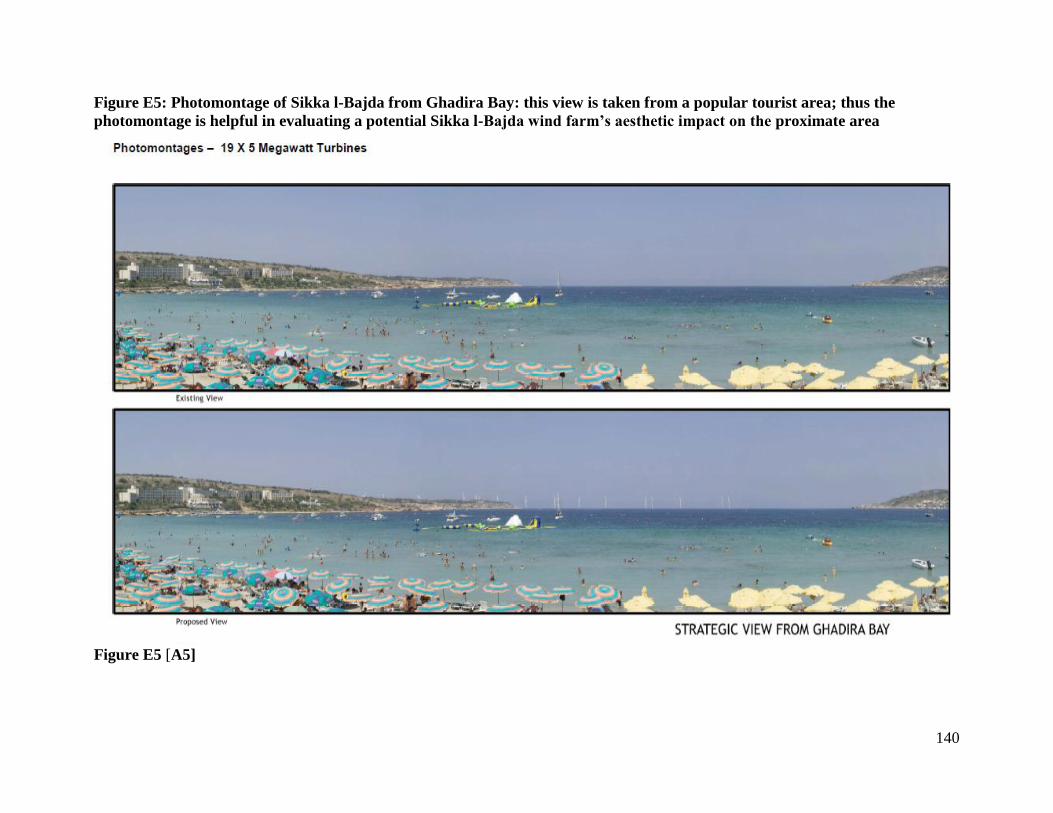
140
Figure E5: Photomontage of Sikka l-Bajda from Ghadira Bay: this view is taken from a popular tourist area; thus the
photomontage is helpful in evaluating a potential Sikka l-Bajda wind farm‟s aesthetic impact on the proximate area
Figure E5 [A5]
141
References: I. Introduction [1] M. Sapiano, 2008, Measures for facing Water Scarcity and Drought in Malta,
European Water, 23/24:79:86, p1-8. Available from:
http://www.ewra.net/ew/pdf/EW_2008_23-24_07.pdf
[2] Enemalta Corporation, 2007, Annual Report and Financial Statement, p9. Available
from:
http://www.enemalta.com.mt/filebank/documents/Enemalta%20Financial%20Statement
s%202007.pdf
[3] Maltatoday, 2009, Who owns Enemalta?
http://archive.maltatoday.com.mt/2009/07/01/t1.html
II. Background [1]. Brief History of the islands of Malta and Gozo, Joseph Borg, Accessed October
2010 from http://www.maltamigration.com/about/malta.shtml
[2] Ezilon, Map of Malta. Available from:
http://www.ezilon.com/maps/images/europe/Malta-political-map.gif
[3] National Statistics Office Malta, 2009, Demographic Review 2008 -, p 3 – 7.
Available from: http://www.nso.gov.mt/statdoc/document_file.aspx?id=2550, NSO –
National Statistics Office: http://www.nso.gov.mt/site/page.aspx
[4] Commission of the European Communities, Demography Report 2008: Meeting
Social Needs in an Ageing Society, Brussels, SEC(2008) 2911, Available from:
http://ec.europa.eu/social/main.jsp?langId=en&catId=89&newsId=419
[5] Kotzebue, J.R., et al., Spatial misfits in a multi-level renewable energy policy
implementation process on the Small Island State of Malta. Energy Policy (2010), doi:
10,1016/j.enpol.2010.05.052
[6] National Statistics Office Malta, 2008, Energy Consumption in Malta 2000-2007.
Available from: http://www.nso.gov.mt/statdoc/document_file.aspx?id=2244
[7] UNESCO‟s Man and the Biosphere Programme (MAB) Official Website:
http://portal.unesco.org/science/en/ev.php-
URL_ID=6393&URL_DO=DO_TOPIC&URL_SECTION=201.html
[8] European Communities, Treaty of Amsterdam Amending the Treaty on European
Union, The Treaties Establishing the European Communities and Certain Related Acts,
1997. Available from:
www.dpt.gov.tr/DocObjects/Download/2513/Treaty%20of%20Amsterdam%20(En).pdf
[9] Directive 96/92/EC, 1997, OJ no. L27/20, Electricity Market Law N122(I)/2003
[10] Michael Grubb and Roberto Vigotti, Renewable Energy Strategies for Europe:
Electricity Systems and Primary Electricity Sources, 1997, Vol 2, p 29-41 Available
online: http://books.google.com/books?id=hDTRPHm-YAoC&pg=SA11-
PA29&lpg=SA11PA29&dq=what+is+the+EU+definition+of+a+small+isolated+island
&source=bl&ots=wqFHZzbLjG&sig=KX0XVSX4XT8KEJJfljAIb0aBgVQ&hl=en&ei
=P1dITJq3HMOqlAfaue2BCw&sa=X&oi=book_result&ct=result&resnum=3&ved=0C
BwQ6AEwAg#v=onepage&q=what%20is%20the%20EU%20definition%20of%20a%2
0small%20isolated%20island&f=false
[11] Council of Europe Parliamentary Assembly, 2005, Development challenges in
Europe‟s islands, Committee on Economic Affairs and Development, Doc 10465.
Available from:
http://assembly.coe.int/Documents/WorkingDocs/Doc05/edoc10465.htm
142
[12]. Compilation by Max Farrugia Dipl. IS, Enemalta Principal Librarian, Accessed
July 15th
2010: http://htl.moedling.at/2782.0.html
[13]. Enemalta official website: www.enemalta.com.mt/
[14] History of the Industrial Revolution, New World Encyclopedia, Available from:
http://www.newworldencyclopedia.org/entry/History_of_the_Industrial_Revolution
III. Establishment of 20-20-20 goals
[1] Directive 2009/28/EC of the European Parliament and of the Council on the
promotion of the use of energy from renewable sources
[2] Ezilon, Map of the European Union. Available from:
http://www.ezilon.com/eu_countries_europe.jpg
[3] EWEA, 2008, The Renewable Energy Directive – a close-up, The European Wind
Energy Association. Available from:
http://www.ewea.org/fileadmin/ewea_documents/documents/00_POLICY_document/R
ES_Directive_special.pdf
[4] Communication from the Commission of 13 November 2008 - Energy efficiency:
delivering the 20% target [COM(2008) 772 - Not published in the Official Journal]:
http://europa.eu/legislation_summaries/energy/energy_efficiency/en0002_en.htm
[5] European Commission data. Table available from:
http://www.spiegel.de/international/europe/0,1518,530504,00.html
[6] Chart based upon numbers from EU Directive 2006/32/EC
[7] MRA, 2001 – 2002 Annual Report, p 05 – 15. Available from:
http://www.mra.org.mt/Downloads/Publications/Annual%20Report%202001-2002.pdf
[8] There‟s enough oil left to last for 40 years, says BP, 2004, Edward Conway.
Available from:
http://www.energybulletin.net/node/659
[9] Earth Impacts Linked to Human-Caused Climate Change, Leslie McCarthy,
NASA‟s Goddard Institute for Space Studies, N.Y. Summary Available:
http://www.nasa.gov/centers/goddard/news/topstory/2008/human_impact.html
IV. Current Electricity Production Infrastructure [1] Enemalta official website: http://www.enemalta.com.mt/page.asp?p=926&l=1
[2] Ministry for Resource and Rural Affairs, 2009, A Proposal for an Energy Policy for
Malta, p60. Available from :
http://www.mrra.gov.mt/htdocs/docs/Energy%20Policy%20for%20Malta.pdf
[3] Enemalta Annual Report 2008, Enemalta official website: www.enemalta.com.mt
[4] Cassar G. Sammut A., Mediterranean and National Strategies for Sustainable
Development Priority Field of Action 2: Energy and Climate Change Energy Efficiency
and Renewable Energy, Malta - National study, 2007, MRA, P6:
http://www.planbleu.org/publications/atelier_energie/MT_National_Study_Final.pdf
(Original Source: Ministry for Resources and Infrastructure, 2005)
[5] Correspondence with Malta Resource Authority (MRA)
[6] Ministry for Resources and Rural Affairs, 2010, Achieving the RES 2020
Targethttp://www.mrra.gov.mt/htdocs/docs/NREAP%20Presentation%20-
%20Achieving%20the%20RES%202020%20target.pdf
[7] Ministry for Resource and Rural Affairs, 2009, A Proposal for an Energy Policy for
Malta. Available from:
http://www.mrra.gov.mt/htdocs/docs/Energy%20Policy%20for%20Malta.pdf
143
[8] Energija Nadifa, 2010, Achieving the RES 2020 target. Available from:
http://www.mrra.gov.mt/htdocs/docs/NREAP%20Presentation%20%20Achieving%20t
he%20RES%202020%20target.pdf
[9] The Times of Malta, 2010, George Pullicino, Malta‟s Renewable Energy Target:
http://www.timesofmalta.com/articles/view/20100706/opinion/maltas-renewable-
energy-targets
[10] Enemalta Corporation Annual Report 2005: Enemalta official website:
www.enemalta.com.mt
[11] Enemalta official website: www.enemalta.com.mt
[12] National Statistics Office Malta, 2008, Energy Consumption in Malta 2000-2007,
Available from: http://www.nso.gov.mt/statdoc/document_file.aspx?id=2244
[13] Enemalta Annual Report, 2008, Enemalta official website: www.enemalta.com.mt
[14] National Statistics Office Malta, 2004, Environment Statistics: Power and
Generation, Available from: http://www.nso.gov.mt/statdoc/document_file.aspx?id=335
[15] Data plotted from information obtained in Enemalta Annual Reports 1992 – 2006
and NSO Energy Consumption Report 2008
[16] Eurostat, European Commission official statistics data:
http://epp.eurostat.ec.europa.eu/portal/page/portal/eurostat/home/
[17] Original Source: Eurostat, 2006. Graph from Malta National Study, p37. Available
from:
http://www.planbleu.org/publications/atelier_energie/MT_National_Study_Final.pdf
V. Problems with Current Electricity Production
[1] Enemalta Financial Reports 2000-2007, Enemalta official website:
www.enemalta.com.mt
[2] Malta Today, Who Owns Enemalta?, 2009
http://archive.maltatoday.com.mt/2009/07/01/t1.html
[3] Energy, Economy, Environment – a Bermuda triangle? Robert Ghirlando, Faculty of
Engineering, University of Malta [4] Directive 2001/80/EC of the European Parliament and of the Council, 2001, on the
limitation of emissions of certain pollutants into the air from large combustion plants:
http://eur-
lex.europa.eu/LexUriServ/site/en/oj/2001/l_309/l_30920011127en00010021.pdf
[5] Times of Malta, 2010, Marsa power station well within operating limits
Viewed 12 August 2010:
http://www.timesofmalta.com/articles/view/20100312/local/marsa-power-station-well-
within-operating-limits
[6] Times of Malta, 2010, Marsa power station may be forced to close before deadline
Viewed 12 August 2010:
http://www.timesofmalta.com/articles/view/20090308/local/marsa-power-station-may-
be-forced-to-close-before-deadline
[7] Malta Environment and Planning Authority (MEPA), State of the Environment
Report, 2009
[8] Enemalta 2008 Annual Report, Enemalta official website: www.enemalta.com.mt
[9] Results published by the Department of Health Information and Research (DHIR) in
July, 2010 detailed in Appendix C
[10] European Association for Battery Electric Vehicles
144
[11] UK Department for Environment, Food and Rural Affairs
[12] Michael Nolle State of the Environment Report for Malta 2005 -Background
Report on Air Quality
[13] MEPA website: http://www.mepa.org.mt/home?l=1
[14] Times of Malta, Malta-Wide blackout as aging plant trips again, 2010:
http://www.timesofmalta.com/articles/view/20100323/local/malta-wide-blackout-as-
aging-plant-trips-again
[15] Enemalta 1994 – 2008 Annual Reports, Enemalta official website:
www.enemalta.com.mt
VI. How Should the 2020 Goals be Achieved?
1. Power Losses in Electrical Transmission and Distribution Systems
[1] U.S. Energy Information Administration, website:
http://tonto.eia.doe.gov/ask/electricity_faqs.asp#electric_rates2, Viewed August 25,
2010
[2] Energy Policy 32 (2004) 2067-2076; Electricity theft: a comparative analysis,
Thomas B. Smith, Table 2, page 2071, website:
http://www.sciencedirect.com/science?_ob=PublicationURL&_tockey=%23TOC%2357
13%232004%23999679981%23512875%23FLA%23&_cdi=5713&_pubType=J&view
=c&_auth=y&_acct=C000050221&_version=1&_urlVersion=0&_userid=9573161&md
5=77c92c4568a92fabbbb69c3180b56dde
[3] BBC News, India struggles with power theft, Mark Gregory, March 15, 2006;
website: http://news.bbc.co.uk/2/hi/business/4802248.stm, Viewed August 25, 2010
[4] CIGRE: 1984 Session, Present Limits of Very Long Distance Transmission
Systems, L. Paris, et al, website: http://www.geni.org/globalenergy/library/technical-
articles/transmission/cigre/present-limits-of-very-long-distance-transmission-
systems/index.shtml, Viewed August 24, 2010
[5] Leonardo Energy, The Global Community for Sustainable Energy Professionals,
Electricity theft - a complex problem, By Roman Targosz, website:
http://www.leonardo-energy.org/electricity-theft-complex-problem
[6] Enemalta annual reports, Enemalta official website: www.enemalta.com.mt
[7] World Development Indicators database, NationMaster .com, Energy Statistics,
Electric power transmission and distribution losses, % of output (most recent) by
country (2004), website:
http://www.nationmaster.com/graph/ene_ele_pow_tra_and_dis_los_of_out-power-
transmission-distribution-losses-output#source, Viewed Sept 6, 2010
[8] Malta Resources Authority, Report on Plans to achieve the set RES target of 10% by
2020, page 17, January 14, 2010
[9] Times of Malta, November 16, 2008, Enemalta admits €16m of losses are avoidable,
Caroline Muscat, Herman Grech, website:
http://www.timesofmalta.com/articles/view/20081116/local/enemalta-admits-euro-16m-
of-losses-are-avoidable, Viewed August 24, 2010
[10] Fast Non-Technical Losses identification Through Optimum–Path Forest, Caio C.
Ramos et al, website: http://www.isap-power.org/PDFs/Paper_45.pdf
[11] IEEE Spectrum, inside technology, Malta‟s Smart Grid Solution Harry, Goldstein,
June 2010, website: http://spectrum.ieee.org/energy/environment/maltas-smart-grid-
solution
145
[12] Transparency International, Corruptions Perceptions Index 2009,
website:http://www.transparency.org/policy_research/surveys_indices/cpi/2009/cpi_200
9_table, Viewed Sept 6, 2010
[13] United Nations Development Programme- Human Development Report 2009,
Human Development Index 2007 and its components; website:
http://hdrstats.undp.org/en/indicators/87.html, Viewed Sept 6, 2010
2. Interconnectors versus the addition of Local Production Capacity
[1] Enemalta as reported by the Independent newspaper, Delimara power station
extension – „the true and simple facts‟. Available from:
http://www.independent.com.mt/news.asp?newsitemid=103012
[2] Enemalta Statements as reported by the Times of Malta, 2010, Article: New
Delimara plant would pay for itself in less than 7 years.
http://www.timesofmalta.com/articles/view/20100416/local/new-delimara-plant-would-
pay-for-itself-in-less-than-7-years-enemalta
[3] BWSC Email Correspondence Report
http://www.timesofmalta.com/articles/view/20100430/local/government-seeks-
clearance-to-release-delimara-contract
[4] Prime Minister‟s Quotes as reported by Maltastar
www.maltastar.com/pages/r1/ms10dart.asp?a=8827
[5] Lino Spireri, Times of Malta, Civil voices damn Delimara extension
http://www.timesofmalta.com/business/view/20100617/comment/civil-voices-damn-
delimara-extension
[6] Charlot Zahra, 2009, Maltatoday, Delimara toxic waste transport will cost 12 million
euro a year
http://archive.maltatoday.com.mt/2009/12/09/t3.html
[7] European Economic Recovery Plan, 2009, Preliminary marine route survey for an
Electrical Interconnection between Malta and Sicily, Tender Document: CT2190/2009
[8] The Malta Independent, 2010, EU ministers approve Malta-Sicily power grid
connection project, Viewed 23rd
September 2010, Available From:
http://www.independent.com.mt/news.asp?newsitemid=90988
[9] Private Communication between Dr. Ing. Joseph Vassallo of Enemalta
[10] Regione Sicilia, B. Claudio, M. Fabio, 2008, Development of Renewable Energy in
Sicily- Available from:
http://www.regione.sicilia.it/industria/use/Documenti%20ufficiali%20energia/Internazi
onali/Developement_renewable_energy_Sicily.pdf
[11] Italian Energy Market: Gestore Mercati Energetici, Annual Reports 2006-2010.
GME Official Website:
http://www.mercatoelettrico.org/En/Default.aspx
[12] Enemalta to NGOs on price of waste disposal as reported by Evarist Bartolo, 2010,
Malta Today: http://archive.maltatoday.com.mt/2010/02/07/evarist.html
[13] National Audit Office Malta: Report by the Auditor General, 2010, Enemalta
Corporation Tender for Generating Capacity, GN/DPS, 8/2006
3. Investment in Renewable Projects in other EU Countries (North Sea) and being
Statistically Transferred with Renewable Energy Generation Versus Investment in
Local Renewable Projects
146
[1] The Second National Communication of Malta to the United Nations Framework
Convention on Climate Change, MRRA, May 2010
http://unfccc.int/files/national_reports/nonannex_i_natcom/submitted_natcom/applicatio
n/pdf/malta_snc.pdf
[2] Malta Environment & Planning Authority (MEPA), 3 wind farm Planning
Applications: PA/1819/0 (Sikka l-Bajda), PA/1820/09 (Hal Far), PA1821/09 (Bahrija)
http://www.mepa.org.mt/SearchPA
[3] Proposed National Renewable Energy Action Plan Report, MRRA, June 2010, p.5
[4a] Potential Exploitable Renewable Electricity Study Malta Mott Macdonald,
Brighton, U.K. for MRA, 2005
[4b] Feasibility Study for Increasing Renewable Energy Credentials, Mott Macdonald,
Glasgow, U.K. for MRA, 2009
[5] A Proposal for an Offshore Wind Farm at Is-Sikka L-Bajda, Project Description
Statement, MRRA, April 2009,
http://www.mrra.gov.mt/htdocs/docs/sikkabajdaprojectdescription.pdf
[6] „Wind Power Shoots Up‟ Times of Malta, May 3, 2009
http://stocks.timesofmalta.com/articles/view/20090503/local/wind-power-investment-
shoots-up
[7] Feasibility Study for Increasing Renewable Energy Credentials, Mott MacDonald,
2009, MRA (2.6.1 MML, 2009)
[8] An Offshore Wind Farm at Is-Sikka L-Bajda, CoWE, MRRA July 2008
http://www.mrra.gov.mt/htdocs/docs/offshorewindfarmsikkabajda.pdf
[9] Feasibility Study for Increasing Renewable Energy Credentials, Mott MacDonald,
2009, MRA 2.6, MRA 6.1
[10] Dong Energy, Gunfleet Sands Report
http://www.dongenergy.com/Gunfleetsands/GunfleetSands/AboutGFS/Pages/default.as
px
[11] See power factor calculations on preceding page of this report
http://www.mrra.gov.mt/htdocs/docs/renewableenergycredentialsjan2009.pdf
[12] 3,000-3,500 Euros/ kWh installed
[13] Gunfleet Sands 1 & 2 Brochure, DONG Energy
[14] Proposal for an Offshore Wind Farm at Sikka l-Bajda, Mott Macdonald for MRA
2009,
http://www.mrra.gov.mt/htdocs/docs/sikkabajdaprojectdescription.pdf
[15] Feasibility Study for increasing renewable Energy Credentials, Mott Macdonald for
MRA, 2009
http://www.mrra.gov.mt/htdocs/docs/renewableenergycredentialsjan2009.pdf
[16] Calculated based upon numbers supplied by DONG Energy (3) and Wind Energy
Operations and Maintenance Report, Wind Energy Update, 2010
http://www.windenergyupdate.com/operations-maintenance-report/Wind-Energy-
Update-Summary.pdf
[17] Europe‟s Onshore and Offshore Wind Energy Potential, Wind Energy
Potential in the North Sea, Figure 6.6 European Environmental Association, EEA 2008
http://www.energy.eu/publications/a07.pdf
[18] National Oceanography Centre, May 24, 2010, Underwater Sinkholes Discovered
on Reef off Coast of Malta, http://noc.ac.uk/news/underwater-sinkholes-discovered-
reef-coast-malta
147
[19] Wind Energy Operations & Maintenance Report, summary pg.5 Wind Energy
Update 2010 http://www.windenergyupdate.com/operations-maintenance-report/Wind-
Energy-Update-Summary.pdf
[20] The Economics of Wind Energy, European Wind Energy Association, EWEA,
2009
http://www.ewea.org/fileadmin/ewea_documents/documents/publications/reports/Econo
mics_of_Wind_Main_Report_FINAL-lr.pdf
[21] Competitiveness of wind energy, (EEA Technical Report, no6/ 2009) Source:
EEA 2008 (EEA Technical Report, no6/ 2009)
http://www.energy.eu/publications/a07.pdf
[22] Government support for industry (state aid):
http://ec.europa.eu/competition/consumers/government_aid_en.html
[23] Eurostat, John Goerten, Daniel Cristian Ganea, Environment and energy, 2010
http://epp.eurostat.ec.europa.eu/cache/ITY_OFFPUB/KS-QA-10-022/EN/KS-QA-10-
022-EN.PDF
[24] Based on data from England Electricity Wholesaler Market, Elexon -
http://www.elexon.co.uk/marketdata/creditdata/pricingdata.aspx
[25] KPMG, Energy and Natural Resources, Utility retail tariffs, 2008
4. Consumer end efficiency improvements
[1] Ministry for Resources and Rural Affairs, Proposed National Renewable Energy
Action Plan Report, 2010
http://www.mrra.gov.mt/htdocs/docs/Proposed%20National%20Renewable%20Action
%20Plan%20Report.pdf
[2] MRA, Antoine Riolo, A Proposal for an Energy Policy, 2006
http://mrra.gov.mt/htdocs/docs/riolo.pdf
[3] Malta National Energy Efficiency Action Plan 2008
http://www.finance.gov.mt/image.aspx?site=MFIN&ref=2009budget_National%20Ener
gy%20Efficiency%20Action%20Plan%202008
[4] Malta Water Services Corporation Official Website
http://www.wsc.com.mt
[5] G. Cassar, 2007, Mediterranean and National Strategies for Sustainable
Development Priority Field of Action 2: Energy and Climate Change Energy Efficiency
and Renewable Energy Malta - National study‟s summary, UNEP Plan Bleu, p3-5
http://www.planbleu.org/publications/atelier_energie/MT_Summary.pdf
[6] KSB Solutions, Pembroke Reverse Osmosis Plant, Malta
http://www.ksb.com/ksb/web/COM/en/segmente/water/6__documentation/3__Referenc
es/malta/KSB__Malta,property=file.pdf
[7] Government support for industry (state aid):
http://ec.europa.eu/competition/consumers/government_aid_en.html
[8] Spectrum, IEEE, October 2010, pages 13/14
http://online.qmags.com/IEEESM1010T?sessionID=C39E6C46BED5700D4443E83DD
&cid=779545&eid=15684
[9] Evaluation of Conservation Voltage Reduction (CVR) on a National Level, July
2010
http://www.pnl.gov/main/publications/external/technical_reports/PNNL-19596.pdf
[10] Mains Electricity
http://en.wikipedia.org/wiki/Mains_electricity
148
VII. Consequences of Non-Achievement
[1]. National Audit Office, Malta‟s Renewable Energy Contingent Liability: Potential
costs relating to the non-attainment of the EU‟s mandatory 2020 targets, 2010
VIII. Conclusions
[1] Malta election results http://www.maltadata.com/results.htm
[2] Michel Barnier, European Commission Minister letter of formal notice to Malta re:
Delimara BWSC contract 3 June, 2010
https://docs.google.com/fileview?id=0B7Swai6S9z6QYTgxNjVjMzktMjU1Zi00NTg0L
Tg5MWItMGIzNmM1YmIwNjI5&hl=en_US
[3]EU accuses Malta of changing emission laws to favor BWSC, Malta Today 18
August, 2010 http://www.maltatoday.com.mt/news/delimara/eu-accuses-malta-of-
favouring-bwsc-diesel-bid-by-changing-emissions-laws
[4] EU leaders discuss reopening Lisbon Treaty, Brussels, 28 October, 2010
http://info-wars.org/2010/10/28/eu-leaders-to-discuss-reopening-lisbon/
[5] Malta‟s debt/GDP ratio, EU report from Brussels, Times of Malta 22 October 2010 http://www.timesofmalta.com/articles/view/20101022/local/brussels-confirms-
improvement-in-deficit-but-debt-is-up
IX. Appendicies:
Appendix A
[A1] Eurostat, news release, 26 August 2008,Total Population as at Jan. 1, 2008,
website: http://epp.eurostat.ec.europa.eu/cache/ITY_PUBLIC/3-26082008-AP/EN/3-
26082008-AP-EN.PDF, Viewed Sept 6, 2010
[A2] CENTRAL INTELLIGENCE AGENCY, THE WORLD FACTBOOK , Country
Comparison, Area, ISSN 1553-8133, website:
https://www.cia.gov/library/publications/the-world-factbook/rankorder/2147rank.html,
Viewed Sept 6, 2010
[A3] CENTRAL INTELLIGENCE AGENCY, THE WORLD FACTBOOK, Country
Comparison, GDP (Purchasing Power Parity), all countries 2009 est., ISSN 1553-8133,
website: https://www.cia.gov/library/publications/the-world-
factbook/rankorder/2001rank.html, Viewed Sept 6, 2010
[A4] Calculated from sections 1 and 3. The population figures are from 2008, whereas
the GDP figures are from 2009 est. This mismatch is insignificant for the purpose of this
thesis.
[A5] CENTRAL INTELLIGENCE AGENCY, THE WORLD FACTBOOK, Country
Comparison, Electricity Consumption, ISSN 1553-8133, website:
https://www.cia.gov/library/publications/the-world-factbook/rankorder/2042rank.html,
Viewed Sept 6, 2010
[A6] Calculated from sections 1 and 5. The population figures are for 2008, whereas the
Electrical Energy Consumption figures are mostly from 2007 with a few from 2009 and
2008. This could cause minor discrepancies which are insignificant for the purposes of
this thesis.
149
[A7] CENTRAL INTELLIGENCE AGENCY, THE WORLD FACTBOOK, Country
Comparison, Public Debt, ISSN 1553-8133, website:
https://www.cia.gov/library/publications/the-world-factbook/rankorder/2186rank.html,
Viewed Sept 9, 2010
[A8] CENTRAL INTELLIGENCE AGENCY, THE WORLD FACTBOOK, Country
Comparison, Current Account Balance, ISSN 1553-8133, website:
https://www.cia.gov/library/publications/the-world-factbook/rankorder/2187rank.html,
Viewed Sept 9, 2010
[A9] Calculated from sections 3 and 8. Current Account Balance Percent of GDP
[A10] CENTRAL INTELLIGENCE AGENCY, THE WORLD FACTBOOK, Field
Listing, Economy, Overview, ISSN 1553-8133, website:
https://www.cia.gov/library/publications/the-world-factbook/fields/2116.html, Viewed
Sept 10, 2010
Appendix C - Italy electricity price data
[A1] Italian Energy Market: Gestore Mercati Energetici, Annual Reports 2006-2010.
GME Official Website:
http://www.mercatoelettrico.org/En/Default.aspx
Appendix D - Rates of Cancer: Incidence and Mortality by Region for
2000-03 & 2004-07
[A1] Department of Health Information and Research (DHIR), Cancer Report, July
2010 based on Data collected by the Malta National Cancer Registry
[A2] “Are we really aware of cancer problem?” Talking Point, Etienne Grech, M.D.,
Times of Malta 22 September, 2010
[A3] This image was taken from the Delimara Power Station Extension EIA Report
http//www.ecomarsaxlokk.com/circle
Appendix E - Wind Farm Statistics
[A1] Europe‟s Onshore and Offshore Wind Energy Potential, EEA Technical Report,
2009, website: http://www.energy.eu/publications/a07.pdf
[A2] The European Offshore Wind Industry-Key trends and statistics 1st Half 2010,
EWEA , website:
http://www.ewea.org/fileadmin/ewea_documents/documents/publications/statistics/EW
EA_OffshoreStatistics_2010.pdf
[A3] OWEMES, Offshore Wind and other Marine & renewable Energies in the
Mediterranean Sea, , website: www.owemes.org
[A4] Study of the Costs of Offshore Wind Generation, Offshore Design Engineering,
Ltd., ODE, , website:
http://www.ode-
ltd.co.uk/renewables/dti%20Costs%20of%20Offshore%20Wind%20Generation%20by
%20ode.pdf
[A5] A Proposal for an Offshore Wind Farm at Is-Sikka L-Bajda, Project Description
Statement, MRRA, April 2009, , website:
http://www.mrra.gov.mt/htdocs/docs/sikkabajdaprojectdescription.pdf
Related Documents