PRAMANA c Indian Academy of Sciences Vol. 67, No. 2 — journal of August 2006 physics pp. 277–289 A comparative performance evaluation of micro-Raman spectrograph using holographic notch filter and dielectric filter R P SHUKLA, SANJIVA KUMAR, A K SINHA 1 , MANIKA MALLICK, S THAKUR and N K SAHOO Spectroscopy Division, 1 Centre for Design and Manufacture, Bhabha Atomic Research Centre, Trombay, Mumbai 400 085, India E-mail: [email protected] MS received 13 June 2005; revised 18 April 2006; accepted 16 May 2006 Abstract. An indigenously designed and developed micro-Raman spectrograph, con- sisting of a diode-pumped solid-state green laser for the excitation of Raman scattering, a Raman imaging microscope, CCD as a detector and a notch filter, has been extensively studied to evaluate its performance. A dielectric edge filter (having 27 alternate layers of SiO 2 and TiO 2 ) and a holographic notch filter (Oriel make) have been used to block the Rayleigh scattered light from the sample to the entrance slit of the spectrograph. Holographic notch filter is found to be able to record the Raman shifts below 700 cm -1 conveniently whereas dielectric edge filter (27 layers) has enabled the spectrograph to record the Raman spectra very efficiently after a wave-number shift of 700 cm -1 . It has also been observed that the instrument using the edge filter provides a peculiar spectrum consisting of three spectral lines having Raman shifts as 569, 1328 and 1393 cm -1 in the Raman spectrum of a weakly scattering sample with large reflectivity. Similarly, a spec- trum consisting of multiple lines has been observed when the instrument is being operated using a holographic notch filter. These spectral lines are not observed in the case of liquid samples such as benzene, carbon tetrachloride, ethanol, diethyl ether etc. The origin of these peculiar spectral lines has been briefly discussed in the paper. Additionally, a major motivation for this work is to utilize the results for the selection of an appropriate filter depending on the type of the sample, i.e. weakly scattered and highly reflecting sample or highly scattered and low reflecting sample. Keywords. Raman spectroscopy; holographic notch filter; dielectric filter; diode-pumped solid-state laser. PACS Nos 33.20.Fb; 42.79.Ci; 29.30.-h; 42.55.Xi 1. Introduction The development of small high-power visible lasers, holographic plane gratings, highly efficient laser-line blocking filters and highly sensitive CCD (charge coupled device) detection technology has enabled us to realize a highly compact and efficient 277

Welcome message from author
This document is posted to help you gain knowledge. Please leave a comment to let me know what you think about it! Share it to your friends and learn new things together.
Transcript
PRAMANA c© Indian Academy of Sciences Vol. 67, No. 2— journal of August 2006
physics pp. 277–289
A comparative performance evaluation ofmicro-Raman spectrograph using holographicnotch filter and dielectric filter
R P SHUKLA, SANJIVA KUMAR, A K SINHA1, MANIKA MALLICK,S THAKUR and N K SAHOOSpectroscopy Division, 1Centre for Design and Manufacture, Bhabha Atomic ResearchCentre, Trombay, Mumbai 400 085, IndiaE-mail: [email protected]
MS received 13 June 2005; revised 18 April 2006; accepted 16 May 2006
Abstract. An indigenously designed and developed micro-Raman spectrograph, con-sisting of a diode-pumped solid-state green laser for the excitation of Raman scattering,a Raman imaging microscope, CCD as a detector and a notch filter, has been extensivelystudied to evaluate its performance. A dielectric edge filter (having 27 alternate layersof SiO2 and TiO2) and a holographic notch filter (Oriel make) have been used to blockthe Rayleigh scattered light from the sample to the entrance slit of the spectrograph.Holographic notch filter is found to be able to record the Raman shifts below 700 cm−1
conveniently whereas dielectric edge filter (27 layers) has enabled the spectrograph torecord the Raman spectra very efficiently after a wave-number shift of 700 cm−1. It hasalso been observed that the instrument using the edge filter provides a peculiar spectrumconsisting of three spectral lines having Raman shifts as 569, 1328 and 1393 cm−1 in theRaman spectrum of a weakly scattering sample with large reflectivity. Similarly, a spec-trum consisting of multiple lines has been observed when the instrument is being operatedusing a holographic notch filter. These spectral lines are not observed in the case of liquidsamples such as benzene, carbon tetrachloride, ethanol, diethyl ether etc. The origin ofthese peculiar spectral lines has been briefly discussed in the paper. Additionally, a majormotivation for this work is to utilize the results for the selection of an appropriate filterdepending on the type of the sample, i.e. weakly scattered and highly reflecting sampleor highly scattered and low reflecting sample.
Keywords. Raman spectroscopy; holographic notch filter; dielectric filter; diode-pumpedsolid-state laser.
PACS Nos 33.20.Fb; 42.79.Ci; 29.30.-h; 42.55.Xi
1. Introduction
The development of small high-power visible lasers, holographic plane gratings,highly efficient laser-line blocking filters and highly sensitive CCD (charge coupleddevice) detection technology has enabled us to realize a highly compact and efficient
277
R P Shukla et al
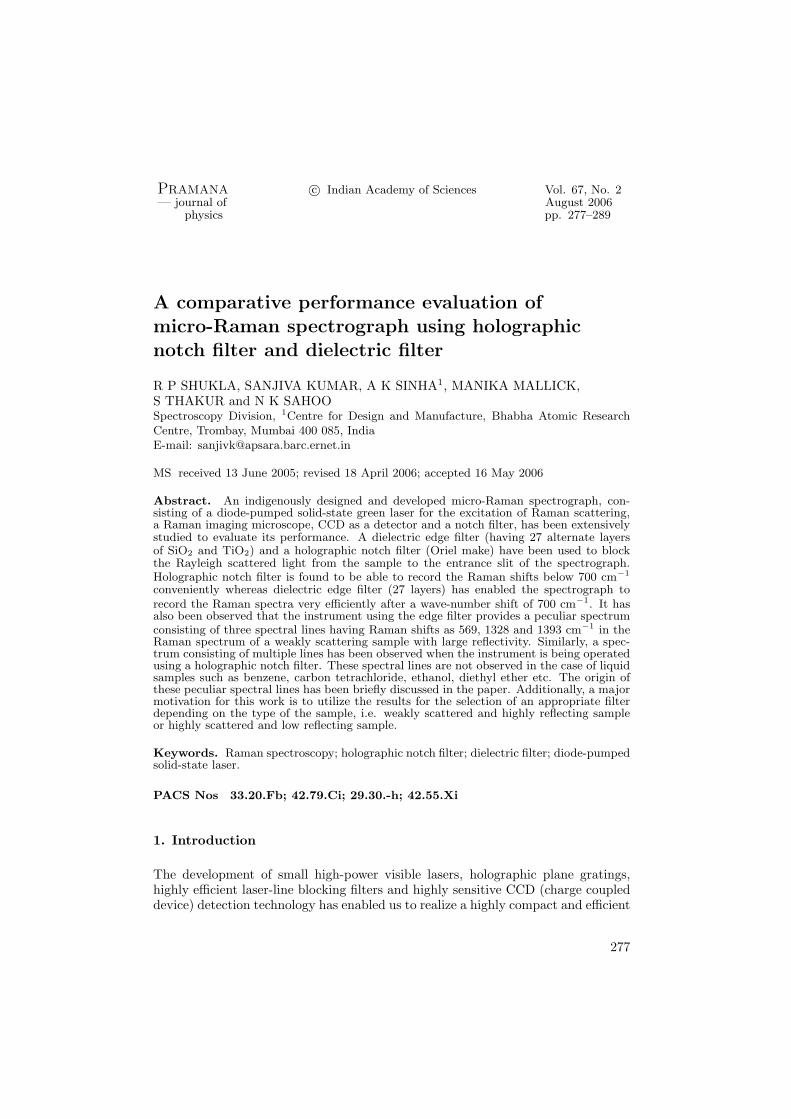
Figure 1. Schematic diagram of the complete assembly of the multichannelspectrograph coupled with the Raman imaging microscope. The practicalvalue of resolution of the spectrograph is 1.0 A. The wavelength range is400–700 nm.
micro-Raman spectrograph using only a single grating as the dispersion element. Asa result of these technological breakthroughs, the Raman spectrographs are findingtheir role for routine [1] qualitative and quantitative measurements. The design anddevelopment of such a spectrograph using CCD as a detector was taken up to studythe Raman spectra of micro samples of materials, which may be inorganic or organicin nature. The present system can help us to measure the Raman shift of frequenciesof various materials such as SiO2 powder, which are in the form of particles of sizeof the order of 1.0 µm. In this study, microparticles of the sample are irradiatedby an intense monochromatic beam of laser light. The factors responsible for thegeneration of unwanted spectral lines have been briefly discussed in the presentpaper.
2. Experimental set-up
The construction details and calibration method for the Raman spectrograph havebeen earlier reported in other publications [2,3]. Basically the instrument consists ofa single mode diode-pumped solid-state laser emitting a light of wavelength of 532nm for the excitation of Raman scattering, a Raman imaging microscope coupledto the spectrograph using CCD as a multi-channel detector for efficient collectionof scattered light and a notch filter before the entrance slit for blocking the entryof Rayleigh scattered light into spectrograph and admitting only Raman scatteredlight into the spectrograph. Schematic optical arrangement of the complete systemof the multichannel spectrograph coupled with the Raman imaging microscope isshown in figure 1.
278 Pramana – J. Phys., Vol. 67, No. 2, August 2006
Micro-Raman spectrograph
The Raman microscope is used for focusing the laser light onto the sample andthen collecting the back-scattered radiation onto the entrance slit of the multi-channel spectrograph for measuring the Raman shifts. The expanded laser beamis deflected vertically downwards by means of a beam splitter with a reflection-to-transmission ratio of 10 : 90 and then focused onto the sample by means of amicroscope objective (5X, 10X, 20X, 65X). The laser light is scattered from themicroparticles of the sample. Both the Raman scattered light and Rayleigh scat-tered light are collected by the same microscope objective and then deviated by anangle of 90◦ by means of a beam splitter with a reflection-to-transmission ratio of80 : 20. A filter is kept before the entrance slit of the spectrograph for blocking theRayleigh scattered light. Thus the Raman scattered light alone is focused onto theentrance slit by means of a suitable focusing lens. The image of the microparticlesof the samples can be viewed on the CCD camera attached to the microscope. Thesample is placed on the X-Y translation stage of the microscope objective and dif-ferent regions of the sample can be irradiated by suitably translating the sampleand obtaining the corresponding Raman scattered light.
The spectrograph utilizes a plane grating of frequency 1200 grooves/mm as adispersing element, concave spherical mirror of focal length 0.523 m as a collimatingelement and a concave spherical mirror of focal length 0.5 m as a focusing element.The design is based on Czerny–Turner type of optical configuration where thefocal lengths of collimating mirror and focusing mirror are chosen to be unequalfor reducing the comatic aberration of the spectrograph. The reciprocal lineardispersion of the spectrograph varies in the range of 14.32–15.27 A/mm over thespectral range of 454 nm (22,026 cm−1) to 657 nm (15,221 cm−1) on the imageplane. The image plane consists of a CCD array of 1024 × 256 pixels. The pixelsize is 26 micron × 26 micron. A spectrum of band 400 A in one span can berecorded by the CCD detector coupled with a PC-based data acquisition and imageprocessing system.
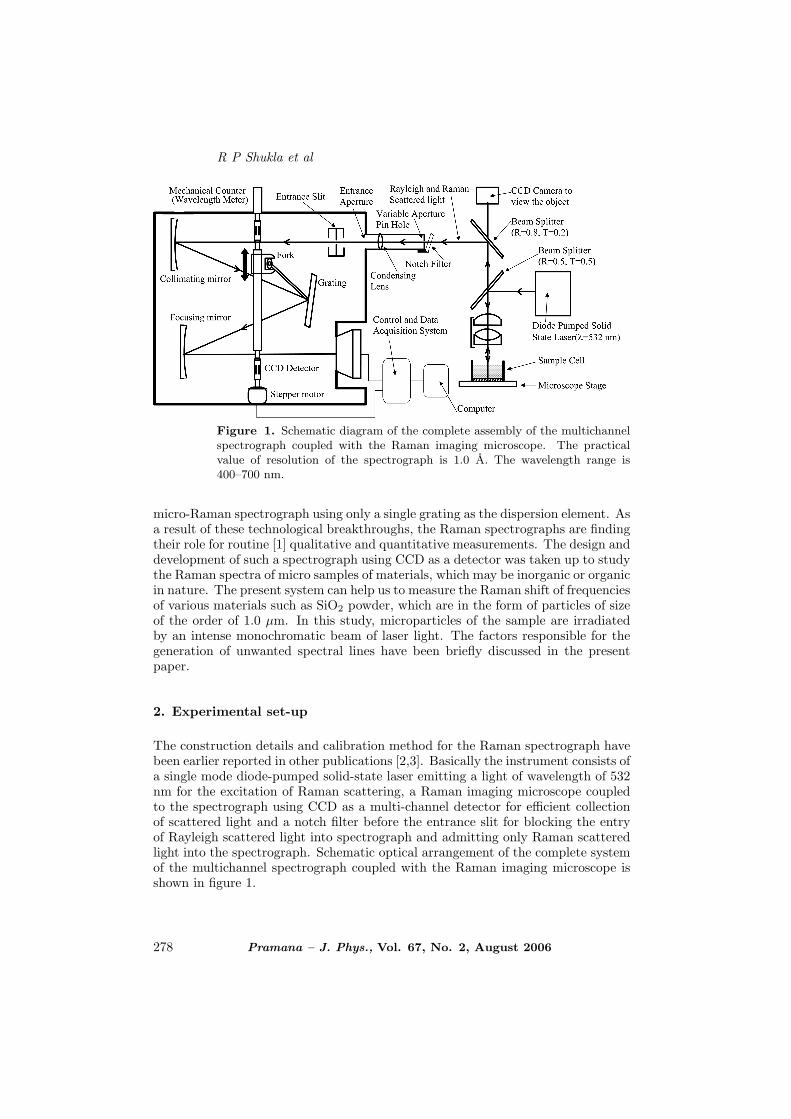
A sine drive assembly has been incorporated for linearizing the wavelength scale.The wavelength is non-linear with the angle of rotation of the grating in the mono-chromators. A lever of length L when rotated through an angle θ about one end,the other end moves through a distance L sin θ perpendicular to the initial positionof the lever. The distance X is written as
X = L sin θ. (1)
The grating equation is given by
(2d cos φ) sin θ = λ, (2)
where 2φ = angle between the incident beam and the diffracted beam and d is thegrating frequency. Combining eqs (1) and (2) we get
λ = (2d cos φ)X/L. (3)
Thus the wavelength λ is proportional to the linear displacement of the centre ofthe ball (fork) measured in a direction perpendicular to the initial position of thelever. The ball can be pushed by a nut actuated by a screw and drum attachedto the screw and it may be linearly calibrated in terms of the wavelength. The
Pramana – J. Phys., Vol. 67, No. 2, August 2006 279
R P Shukla et al
Figure 2. Schematic diagram of the sine drive mechanism driven by a steppermotor. The wavelength is read by a mechanical counter.
screw is also coupled to a mechanical counter to read the wavelength. A lead screw(type MBF 1402+245LC7 THK Co. Ltd, Tokyo, Japan) of 2 mm pitch and 200mm effective length was chosen for the sine drive assembly. The movement of thelead screw is imparted by a 7 kg-cm torque stepper motor. The lever length is fixedto 164.91 mm to give a wavelength shift of 200 A by a nut movement of 2 mm ascalculated from eq. (3). The total length of the screw is 70 mm for scanning thetotal spectral range from 0.0 A to 7000 A. Figure 2 shows the schematic diagramof the sine drive assembly driven by a stepper motor and the wavelength is read bya mechanical counter.
Any wavelength region can be set by the rotation of the grating. The instrumentcovers a wavelength range of 4000 A (25,000 cm−1) to 7000 A (14,286 cm−1). Thepractical value of the resolution is 1.0 A (4 cm−1). The accuracy of the spectrographis found to be ±7 cm−1 for the measurement of Raman wave-number shifts of thesamples. Raman spectrum is recorded on the CCD camera by illuminating thematerial with an intense beam of a single mode diode-pumped solid state laser(DPSS) of power variable from 1 mW to 200 mW emitting a light of wavelengthof 532 nm. DPSS laser (Model # DPGL-2200, make Casix) itself consists of anNd : YVO4 (yttrium orthovandate) crystal as the medium and a frequency doublingcrystal KTP (potassium titanyl orthophosphate).
Two types of filters have been used to block the Rayleigh scattered light. Rayleighscattering, which always occurs along with Raman scattering, is of the order of 102
to 104 times more intense than Raman scattering. Optical shortcomings of thesample, such as, for example, dust particles in a liquid or imperfections in a crys-tal, can still further increase the intensity of the scattered light at the incidentwavenumber (v0) relative to Raman scattering. Through defects in the dispers-ing system, mainly scattering at optical surfaces, particularly the grating, a small
280 Pramana – J. Phys., Vol. 67, No. 2, August 2006
Micro-Raman spectrograph
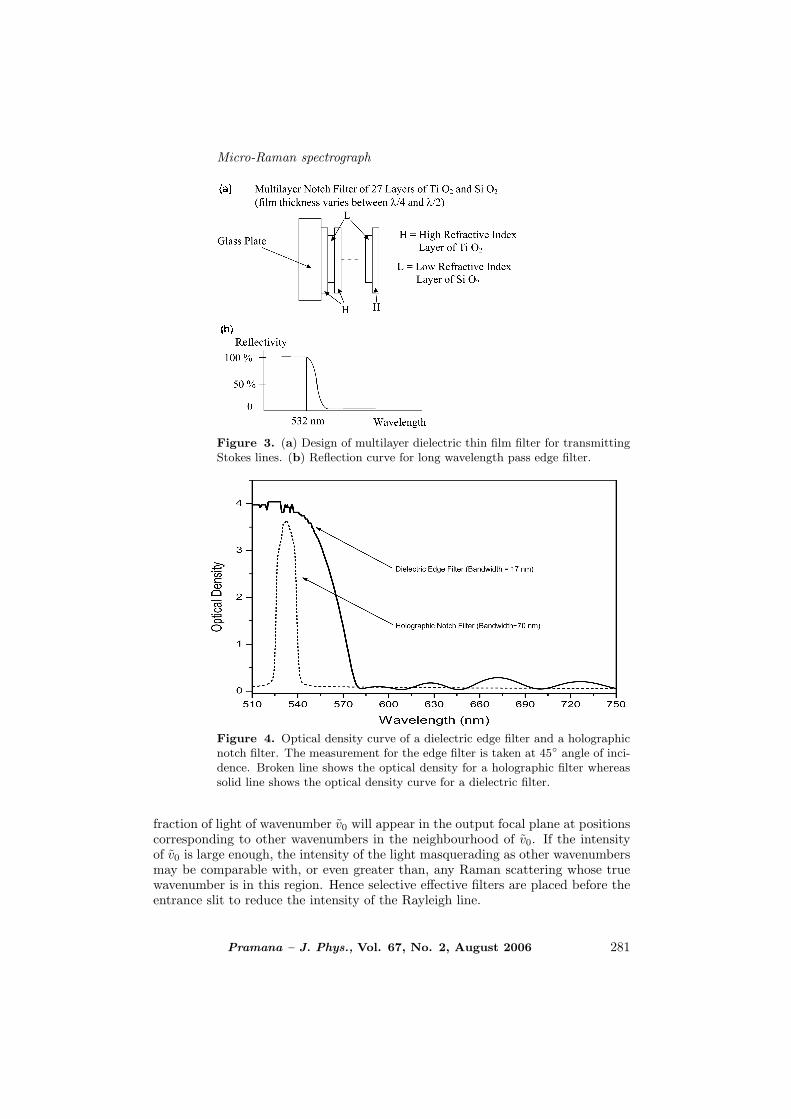
Figure 3. (a) Design of multilayer dielectric thin film filter for transmittingStokes lines. (b) Reflection curve for long wavelength pass edge filter.
Figure 4. Optical density curve of a dielectric edge filter and a holographicnotch filter. The measurement for the edge filter is taken at 45◦ angle of inci-dence. Broken line shows the optical density for a holographic filter whereassolid line shows the optical density curve for a dielectric filter.
fraction of light of wavenumber v0 will appear in the output focal plane at positionscorresponding to other wavenumbers in the neighbourhood of v0. If the intensityof v0 is large enough, the intensity of the light masquerading as other wavenumbersmay be comparable with, or even greater than, any Raman scattering whose truewavenumber is in this region. Hence selective effective filters are placed before theentrance slit to reduce the intensity of the Rayleigh line.
Pramana – J. Phys., Vol. 67, No. 2, August 2006 281
R P Shukla et al
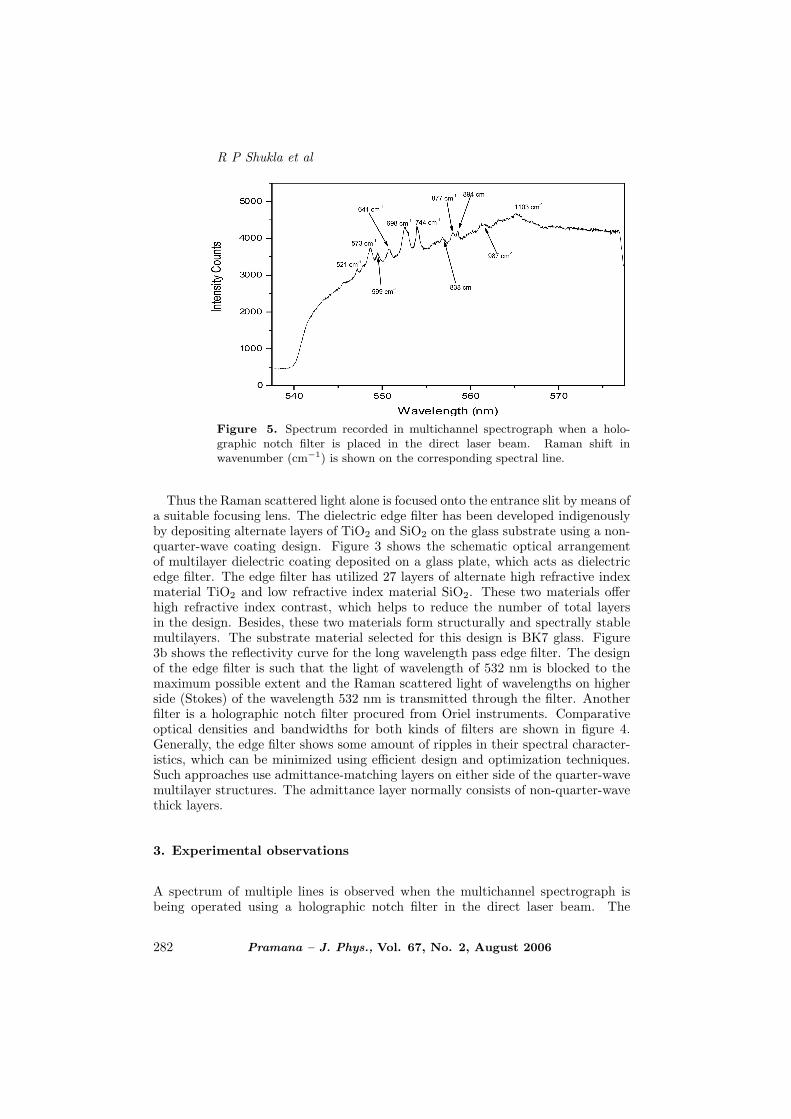
Figure 5. Spectrum recorded in multichannel spectrograph when a holo-graphic notch filter is placed in the direct laser beam. Raman shift inwavenumber (cm−1) is shown on the corresponding spectral line.
Thus the Raman scattered light alone is focused onto the entrance slit by means ofa suitable focusing lens. The dielectric edge filter has been developed indigenouslyby depositing alternate layers of TiO2 and SiO2 on the glass substrate using a non-quarter-wave coating design. Figure 3 shows the schematic optical arrangementof multilayer dielectric coating deposited on a glass plate, which acts as dielectricedge filter. The edge filter has utilized 27 layers of alternate high refractive indexmaterial TiO2 and low refractive index material SiO2. These two materials offerhigh refractive index contrast, which helps to reduce the number of total layersin the design. Besides, these two materials form structurally and spectrally stablemultilayers. The substrate material selected for this design is BK7 glass. Figure3b shows the reflectivity curve for the long wavelength pass edge filter. The designof the edge filter is such that the light of wavelength of 532 nm is blocked to themaximum possible extent and the Raman scattered light of wavelengths on higherside (Stokes) of the wavelength 532 nm is transmitted through the filter. Anotherfilter is a holographic notch filter procured from Oriel instruments. Comparativeoptical densities and bandwidths for both kinds of filters are shown in figure 4.Generally, the edge filter shows some amount of ripples in their spectral character-istics, which can be minimized using efficient design and optimization techniques.Such approaches use admittance-matching layers on either side of the quarter-wavemultilayer structures. The admittance layer normally consists of non-quarter-wavethick layers.
3. Experimental observations
A spectrum of multiple lines is observed when the multichannel spectrograph isbeing operated using a holographic notch filter in the direct laser beam. The
282 Pramana – J. Phys., Vol. 67, No. 2, August 2006
Micro-Raman spectrograph
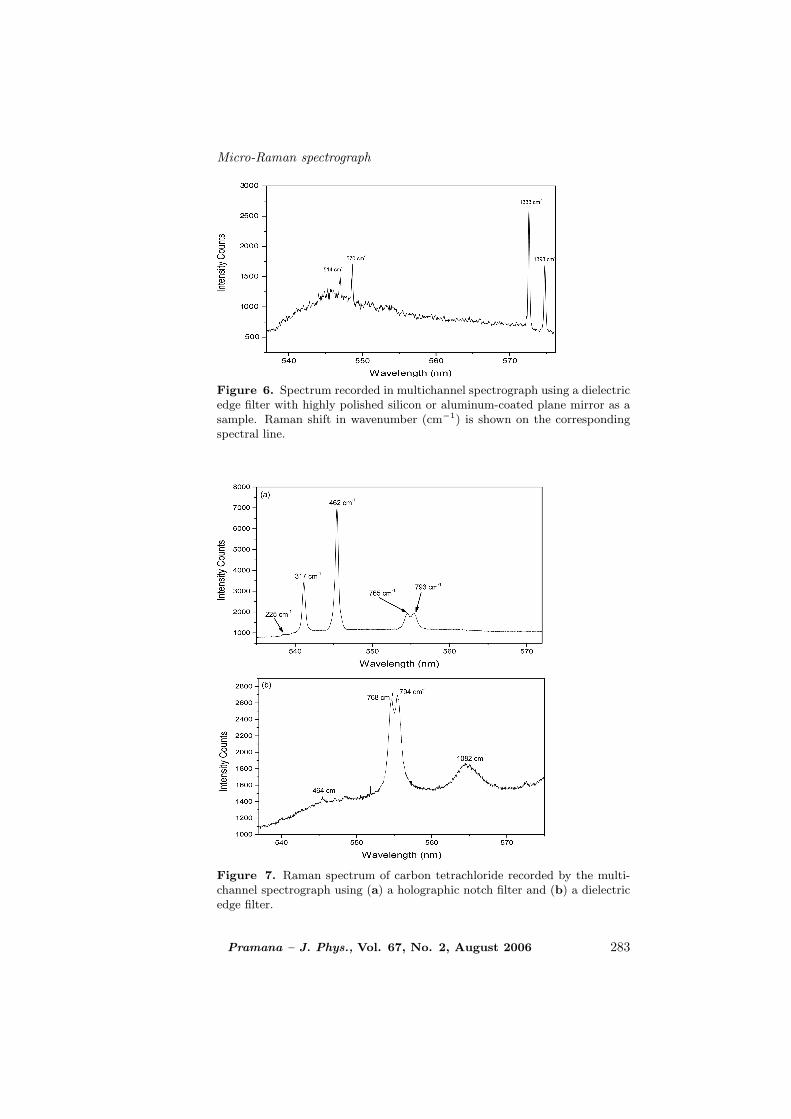
Figure 6. Spectrum recorded in multichannel spectrograph using a dielectricedge filter with highly polished silicon or aluminum-coated plane mirror as asample. Raman shift in wavenumber (cm−1) is shown on the correspondingspectral line.
Figure 7. Raman spectrum of carbon tetrachloride recorded by the multi-channel spectrograph using (a) a holographic notch filter and (b) a dielectricedge filter.
Pramana – J. Phys., Vol. 67, No. 2, August 2006 283
R P Shukla et al
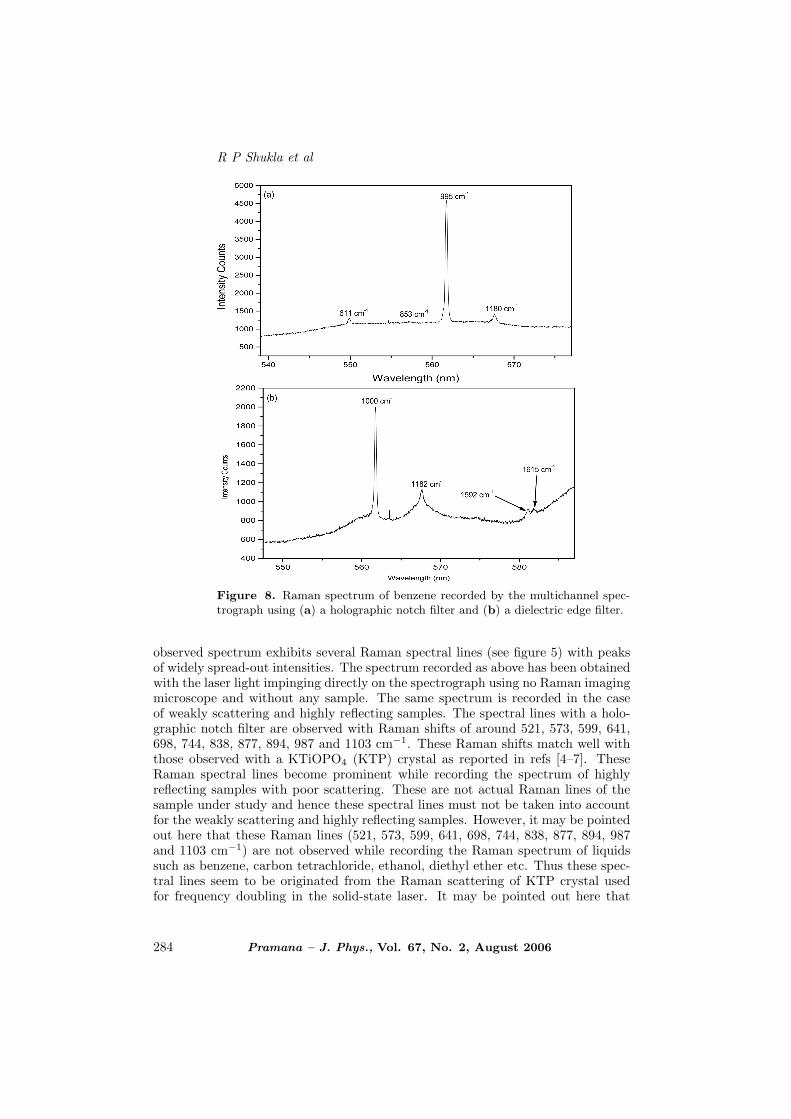
Figure 8. Raman spectrum of benzene recorded by the multichannel spec-trograph using (a) a holographic notch filter and (b) a dielectric edge filter.
observed spectrum exhibits several Raman spectral lines (see figure 5) with peaksof widely spread-out intensities. The spectrum recorded as above has been obtainedwith the laser light impinging directly on the spectrograph using no Raman imagingmicroscope and without any sample. The same spectrum is recorded in the caseof weakly scattering and highly reflecting samples. The spectral lines with a holo-graphic notch filter are observed with Raman shifts of around 521, 573, 599, 641,698, 744, 838, 877, 894, 987 and 1103 cm−1. These Raman shifts match well withthose observed with a KTiOPO4 (KTP) crystal as reported in refs [4–7]. TheseRaman spectral lines become prominent while recording the spectrum of highlyreflecting samples with poor scattering. These are not actual Raman lines of thesample under study and hence these spectral lines must not be taken into accountfor the weakly scattering and highly reflecting samples. However, it may be pointedout here that these Raman lines (521, 573, 599, 641, 698, 744, 838, 877, 894, 987and 1103 cm−1) are not observed while recording the Raman spectrum of liquidssuch as benzene, carbon tetrachloride, ethanol, diethyl ether etc. Thus these spec-tral lines seem to be originated from the Raman scattering of KTP crystal usedfor frequency doubling in the solid-state laser. It may be pointed out here that
284 Pramana – J. Phys., Vol. 67, No. 2, August 2006
Micro-Raman spectrograph
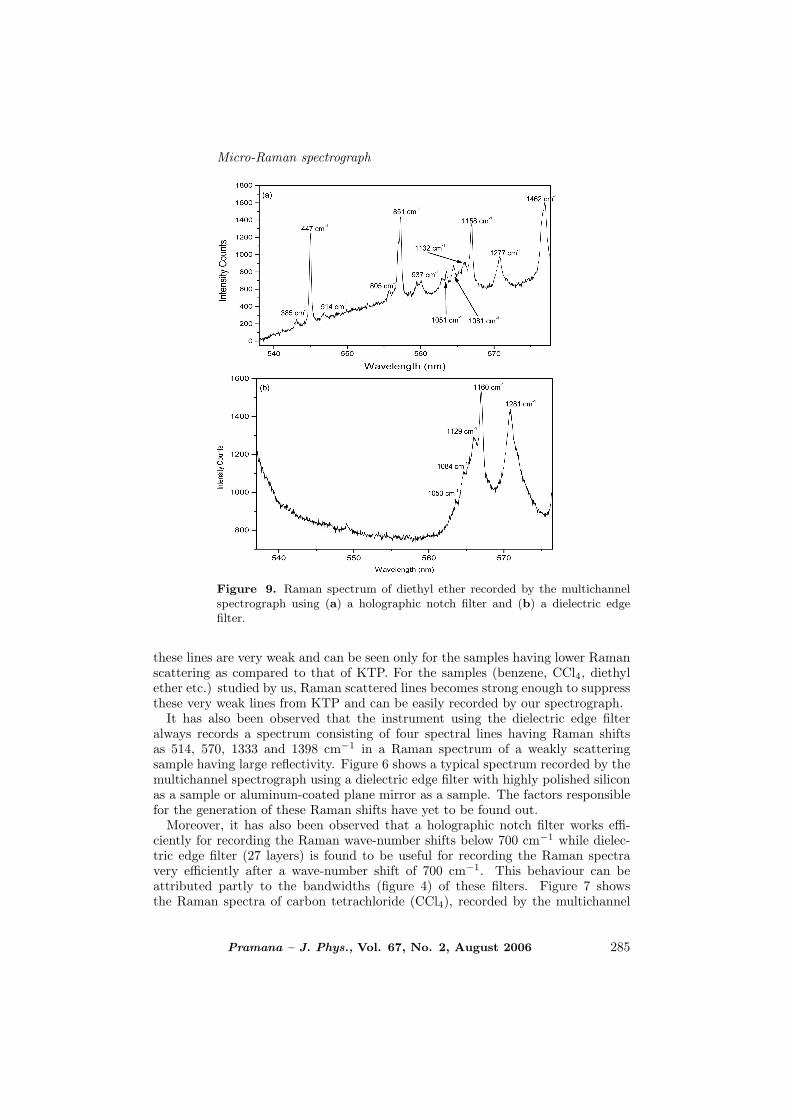
Figure 9. Raman spectrum of diethyl ether recorded by the multichannelspectrograph using (a) a holographic notch filter and (b) a dielectric edgefilter.
these lines are very weak and can be seen only for the samples having lower Ramanscattering as compared to that of KTP. For the samples (benzene, CCl4, diethylether etc.) studied by us, Raman scattered lines becomes strong enough to suppressthese very weak lines from KTP and can be easily recorded by our spectrograph.
It has also been observed that the instrument using the dielectric edge filteralways records a spectrum consisting of four spectral lines having Raman shiftsas 514, 570, 1333 and 1398 cm−1 in a Raman spectrum of a weakly scatteringsample having large reflectivity. Figure 6 shows a typical spectrum recorded by themultichannel spectrograph using a dielectric edge filter with highly polished siliconas a sample or aluminum-coated plane mirror as a sample. The factors responsiblefor the generation of these Raman shifts have yet to be found out.
Moreover, it has also been observed that a holographic notch filter works effi-ciently for recording the Raman wave-number shifts below 700 cm−1 while dielec-tric edge filter (27 layers) is found to be useful for recording the Raman spectravery efficiently after a wave-number shift of 700 cm−1. This behaviour can beattributed partly to the bandwidths (figure 4) of these filters. Figure 7 showsthe Raman spectra of carbon tetrachloride (CCl4), recorded by the multichannel
Pramana – J. Phys., Vol. 67, No. 2, August 2006 285
R P Shukla et al
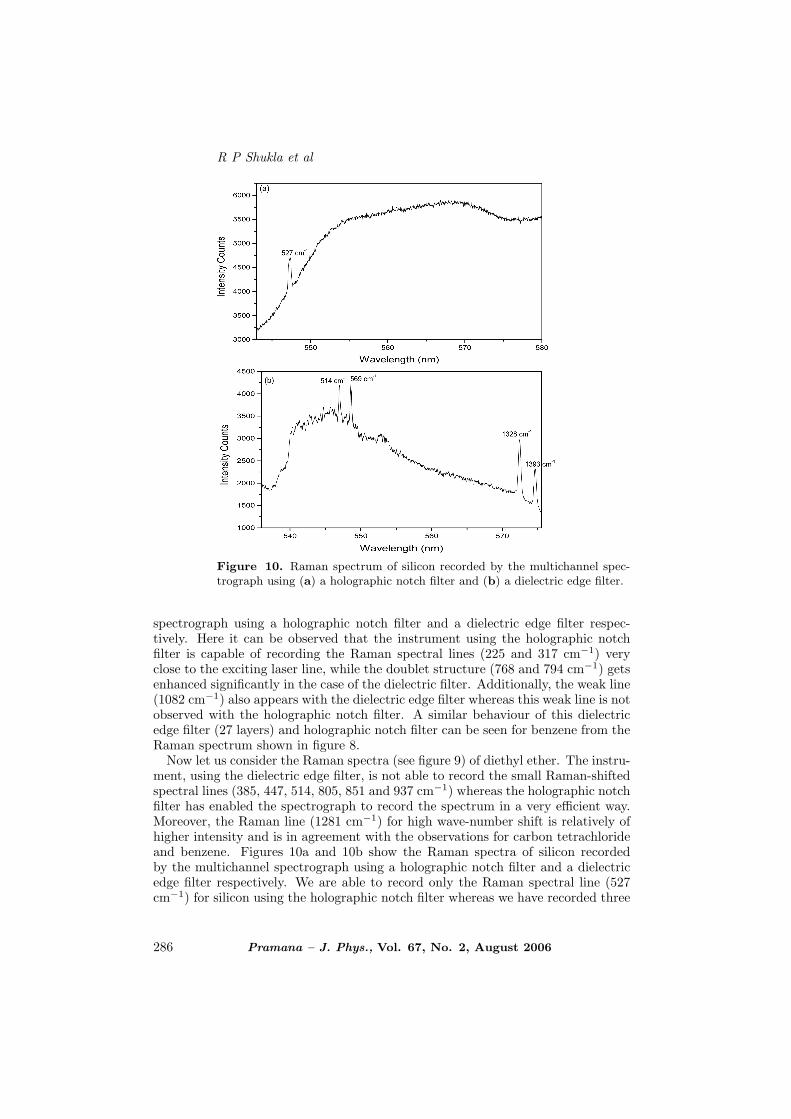
Figure 10. Raman spectrum of silicon recorded by the multichannel spec-trograph using (a) a holographic notch filter and (b) a dielectric edge filter.
spectrograph using a holographic notch filter and a dielectric edge filter respec-tively. Here it can be observed that the instrument using the holographic notchfilter is capable of recording the Raman spectral lines (225 and 317 cm−1) veryclose to the exciting laser line, while the doublet structure (768 and 794 cm−1) getsenhanced significantly in the case of the dielectric filter. Additionally, the weak line(1082 cm−1) also appears with the dielectric edge filter whereas this weak line is notobserved with the holographic notch filter. A similar behaviour of this dielectricedge filter (27 layers) and holographic notch filter can be seen for benzene from theRaman spectrum shown in figure 8.
Now let us consider the Raman spectra (see figure 9) of diethyl ether. The instru-ment, using the dielectric edge filter, is not able to record the small Raman-shiftedspectral lines (385, 447, 514, 805, 851 and 937 cm−1) whereas the holographic notchfilter has enabled the spectrograph to record the spectrum in a very efficient way.Moreover, the Raman line (1281 cm−1) for high wave-number shift is relatively ofhigher intensity and is in agreement with the observations for carbon tetrachlorideand benzene. Figures 10a and 10b show the Raman spectra of silicon recordedby the multichannel spectrograph using a holographic notch filter and a dielectricedge filter respectively. We are able to record only the Raman spectral line (527cm−1) for silicon using the holographic notch filter whereas we have recorded three
286 Pramana – J. Phys., Vol. 67, No. 2, August 2006
Micro-Raman spectrograph
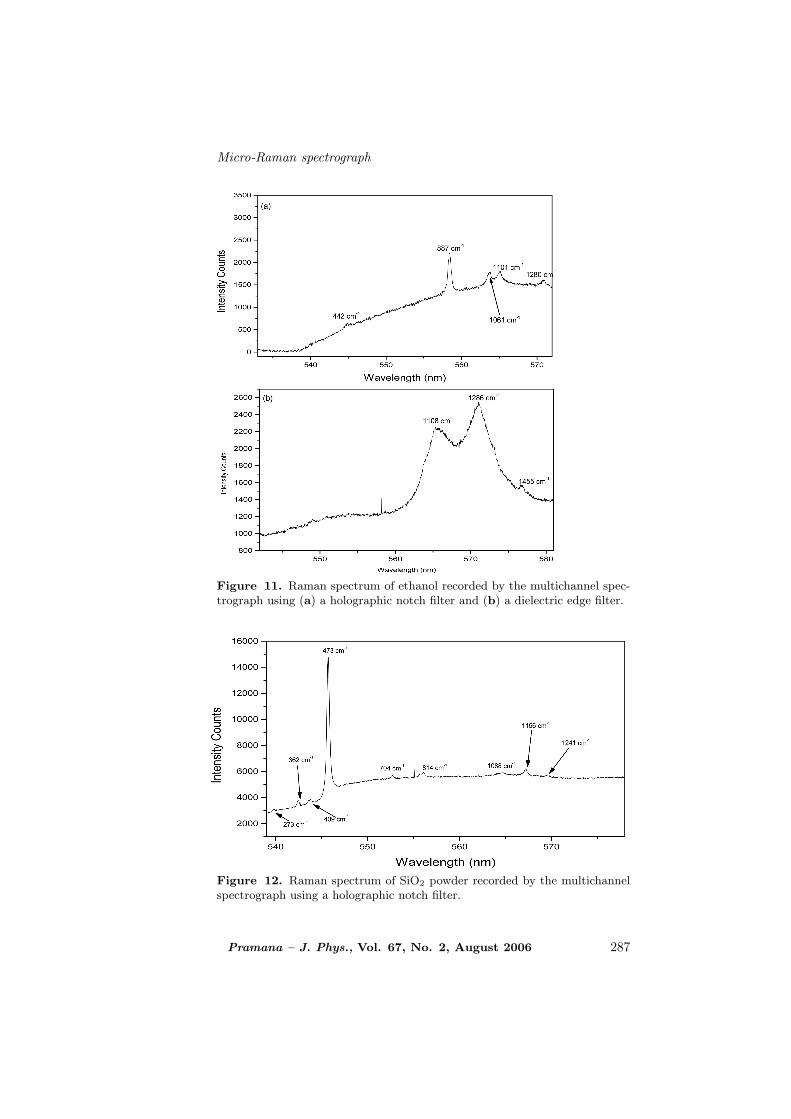
Figure 11. Raman spectrum of ethanol recorded by the multichannel spec-trograph using (a) a holographic notch filter and (b) a dielectric edge filter.
Figure 12. Raman spectrum of SiO2 powder recorded by the multichannelspectrograph using a holographic notch filter.
Pramana – J. Phys., Vol. 67, No. 2, August 2006 287
R P Shukla et al
additional lines (569, 1328 and 1393 cm−1) for silicon sample using the 27-layersdielectric filter. These additional spectral lines are to be ignored while interpret-ing the Raman spectrum of silicon or other highly reflecting samples. The Ramanspectrum of ethanol is shown in figure 11, which again confirms the better efficiencyof the spectrograph using the dielectric filter for Raman-shifted spectral lines (1108and 1286 cm−1) which are above 700 cm−1. The Raman shifts measured by themicro-Raman spectrograph for several standard samples [8] such as benzene, CCl4,diethyl ether, ethanol etc. shows an error limit of ±7 cm−1. The instrument hasalso shown its capability for recording the Raman spectrum of microparticles suchSiO2 powder (see figure 12).
4. Conclusion
The performance analysis of an indigenously developed micro-Raman spectrographhas been done for two types of filters for blocking the Rayleigh scattered light. Apeculiar set of spectral lines (521, 573, 599, 641, 698, 744, 838, 877, 894, 987 and1103 cm−1) with holographic notch filter has been recorded for weakly scatteredsamples. After studying all the factors responsible for these unwanted spectrallines with the holographic notch filter, it may be concluded that these lines are dueto the Raman scattering of frequency doubling crystal KTP in the diode-pumpedsolid state laser emitting a light of wavelength of 532 nm. It may be suggestedhere that the Raman spectrum of a sample may be recorded conveniently usingthe instrument with holographic filter, provided the scattering cross-section of thesample is more than that of KTP crystal in the diode-pumped solid-state laseremitting a light of wavelength of 532 nm. However, the factors responsible for thespectral lines having Raman shifts of 569, 1328 and 1393 cm−1 for highly reflectingsamples recorded by the spectrograph using a dielectric edge filter (27 layers) areunknown. It is also concluded that holographic notch filter is suitable for recordingthe Raman-shifted spectra of a sample below a wave-number shift of 700 cm−1,while the dielectric edge filter enables the instrument to record the Raman spectraafter a wave-number shift of 700 cm−1. The behaviour in the case of dielectric edgefilter may be due to the absence of the stronger low-frequency peaks. We are in theprocess of developing a better dielectric edge filter having narrow bandwidth andhigh optical density using 60 alternate layers of SiO2 and TiO2.
References
[1] K P J Williams, G D Pitt, B J E Smith, A Whitley, D N Batchelder and I P Hayward,J. Raman Spectroscopy 25, 131 (1994)
[2] R P Shukla, Sanjiva Kumar, A K Sinha, Manika Mallick, S V G Ravindranath, SThakur, N K Sahoo and N C Das, Proc. of National Conference on Optics and Pho-tonics in Engineering (Netaji Subhas Institute of Technology, Dwarka, New Delhi,January 6–8, 2003)
[3] R P Shukla, Sanjiva Kumar, A K Sinha, Manika Mallick, S Thakur, N K Sahoo andN C Das, J. Optics (India) 33, 87 (2004)
288 Pramana – J. Phys., Vol. 67, No. 2, August 2006
Micro-Raman spectrograph
[4] G E Kugel, F Brehat, B Wyncke, M D Fontana, G Marnier, C Carabatos-Nedelec andJ Mangin, J. Phys. C21, 5565 (1988)
[5] A M Pugachev, N V Surovtsev, V I Voronkova, V N Semenenko, V K Yaanovskii andV V Atuchin, J. Ceramic Processing Research 4(2), 101 (2003)
[6] M J Bushiri, V P Mahadevan Pillai, R Ratheesh and V U Nayar, J. Phys. Chem.Solids 60, 1983 (1999)
[7] G A Massey, T M Loehr, L J Willis and J C Johnson, Appl. Opt. 19, 4136 (1980)[8] J Loader, Basic laser Raman spectroscopy (Heyden, London, 1970) pp. 63–93
Pramana – J. Phys., Vol. 67, No. 2, August 2006 289
Related Documents


