APSTRACT Vol. 8. Number 2–3. 2014 pages 33–42 ISSN 1789-7874 Introduction 1.1 Background Codex Alimentarius defines juice as “unfermented but fer- mentable juice intended for direct consumption, obtained by the mechanical process from sound, ripe fruits, preserved ex- clusively by physical means (FAO, 1992). Pineapple and pas- sion fruits are the most popular juices to date but others may increase in popularity. The global market for juice products was estimated to be about 50 billion liters in the 1990s (FAO, 1999). Banana juice is made using traditional methods for beer/spirit production but it is not widely sold as juice, most at times it is blended with other fruits juices. In general, juice can also be made from a mixture of fruits although this is not widely done at present due to high costs involved. Fruits can be consumed fresh or processed into various forms. Pineapple and mango juice are the most popular product due to its fruity aroma, fragrance and flavor and is purportedly the most widely consumed fresh fruit in the world with pro- duction exceeding 17 million metric tons a year (FAOSTAT, 2007).Mangoes are produced in over 90 countries worldwide, Asia accounts for approximately 77% of global mango pro- duction and the Americas and Africa approximately 13% and 9% respectively (FAOSTAT 2007). In 2005 world production of mango was estimated at 28.51 million metric tons. Between 1996 and 2005, production grew at annual rate of 2.6% (FAOSTAT 2007). Over the last decade prices of fruits are declining about 50% because the fruits are available in most countries but prices could increase with proper promotional effort. There is evidence that processed fruit market is increasing (Sauco, 2004). Juice manufactures face competition from producers who buy imported flavor concentrates and dilute them to make fruit drinks that are much cheaper. Consequently, the production and marketing of fruit juice should focus on the fact that they are made from fresh fruits with no additives. Further, the cost of equipment to form and seal cartons is too high for small scale producers and they are only sold under license. Cheaper alternatives including plastic pots with seeded foil lids are available as alternatives to bottles. Some processors also mar- ket juice in polythene sachets. Preservation is by pasteuriza- A COMPARATIVE ANALYSIS OF THE PROFITABILITY OF PINEAPPLE-MANGO BLEND AND PINEAPPLE FRUIT JUICE PROCESSING IN GHANA Michael K. Asante and John K. M. Kuwornu University of Ghana, Department of Agricultural Economics and Agribusiness, Ghana Abstract: This study analyzes the profitability of fruit juice processing using data from Kudors Fruit Juice Limited at Kasoa in Ghana. The cost involved in fruit juice processing (which includes the capital cost and the operating cost) was obtained from the Company. This study compares the profitability of blend (i.e. fruit juice made up of pineapple and mango blend) with that of pineapple juice alone. The viability of the project was determined using the discounted measures of project worth: Benefit-Cost Ratio (BCR), Net Present Value (NPV) and Internal Rate of Return (IRR). The empirical results reveal that pineapple juice processing had a BCR of 1.03 which means that going into the pineapple juice processing is profitable. The value of the NPV (GHS11,728.00) and IRR (23%) further confirms that pineapple juice processing is profitable because the NPV is positive and the IRR is greater than the discounted factor (21%). The results also showed that it is more profitable to invest in the blend (pineapple and mango blend) than the pineapple juice alone as it yields a BCR of 1.36 which was greater than the BCR of 1.03 for the pineapple juice only. Furthermore, the value of the NPV (GHS176,831.00) which is greater than the pineapple juice only, suggests that the blend is more profitable even though the IRR for both are the same. Moreover, it is also more likely to recover capital investment earlier in the processing of the blend than when one goes into pineapple juice processing only, because the net cash flow in year 2 (GHS 58,146.00) for the blend is more than triple that of the pineapple juice only (GHS17,826.00).These results have policy implications for the development of Agribusinesses in Ghana. Keywords: profitability, fruit juice processing, Kudors fruit juice limited, NPV, BCR, IRR, Ghana Applied Studies in Agribusiness and Commerce – APSTRACT Agroinform Publishing House, Budapest SCIENTIFIC PAPERS

Welcome message from author
This document is posted to help you gain knowledge. Please leave a comment to let me know what you think about it! Share it to your friends and learn new things together.
Transcript
APSTRACT Vol. 8. Number 2–3. 2014 pages 33–42 ISSN 1789-7874
Introduction
1.1 Background
Codex Alimentarius defines juice as “unfermented but fer-mentable juice intended for direct consumption, obtained by the mechanical process from sound, ripe fruits, preserved ex-clusively by physical means (FAO, 1992). Pineapple and pas-sion fruits are the most popular juices to date but others may increase in popularity. The global market for juice products was estimated to be about 50 billion liters in the 1990s (FAO, 1999). Banana juice is made using traditional methods for beer/spirit production but it is not widely sold as juice, most at times it is blended with other fruits juices. In general, juice can also be made from a mixture of fruits although this is not widely done at present due to high costs involved.
Fruits can be consumed fresh or processed into various forms. Pineapple and mango juice are the most popular product due to its fruity aroma, fragrance and flavor and is purportedly the most widely consumed fresh fruit in the world with pro-duction exceeding 17 million metric tons a year (FAOSTAT,
2007).Mangoes are produced in over 90 countries worldwide, Asia accounts for approximately 77% of global mango pro-duction and the Americas and Africa approximately 13% and 9% respectively (FAOSTAT 2007).
In 2005 world production of mango was estimated at 28.51 million metric tons. Between 1996 and 2005, production grew at annual rate of 2.6% (FAOSTAT 2007). Over the last decade prices of fruits are declining about 50% because the fruits are available in most countries but prices could increase with proper promotional effort. There is evidence that processed fruit market is increasing (Sauco, 2004).
Juice manufactures face competition from producers who buy imported flavor concentrates and dilute them to make fruit drinks that are much cheaper. Consequently, the production and marketing of fruit juice should focus on the fact that they are made from fresh fruits with no additives. Further, the cost of equipment to form and seal cartons is too high for small scale producers and they are only sold under license. Cheaper alternatives including plastic pots with seeded foil lids are available as alternatives to bottles. Some processors also mar-ket juice in polythene sachets. Preservation is by pasteuriza-
A compArAtive AnAlysis of the profitAbility of pineApple-mAngo
blend And pineApple fruit juice processing in ghAnA
Michael K. Asante and John K. M. Kuwornu
University of Ghana, Department of Agricultural Economics and Agribusiness, Ghana
Abstract: This study analyzes the profitability of fruit juice processing using data from Kudors Fruit Juice Limited at Kasoa in Ghana. The cost involved in fruit juice processing (which includes the capital cost and the operating cost) was obtained from the Company. This study compares the profitability of blend (i.e. fruit juice made up of pineapple and mango blend) with that of pineapple juice alone. The viability of the project was determined using the discounted measures of project worth: Benefit-Cost Ratio (BCR), Net Present Value (NPV) and Internal Rate of Return (IRR). The empirical results reveal that pineapple juice processing had a BCR of 1.03 which means that going into the pineapple juice processing is profitable. The value of the NPV (GHS11,728.00) and IRR (23%) further confirms that pineapple juice processing is profitable because the NPV is positive and the IRR is greater than the discounted factor (21%). The results also showed that it is more profitable to invest in the blend (pineapple and mango blend) than the pineapple juice alone as it yields a BCR of 1.36 which was greater than the BCR of 1.03 for the pineapple juice only. Furthermore, the value of the NPV (GHS176,831.00) which is greater than the pineapple juice only, suggests that the blend is more profitable even though the IRR for both are the same. Moreover, it is also more likely to recover capital investment earlier in the processing of the blend than when one goes into pineapple juice processing only, because the net cash flow in year 2 (GHS 58,146.00) for the blend is more than triple that of the pineapple juice only (GHS17,826.00).These results have policy implications for the development of Agribusinesses in Ghana.
Keywords: profitability, fruit juice processing, Kudors fruit juice limited, NPV, BCR, IRR, Ghana
Applied Studies in Agribusiness and Commerce – APSTRACTAgroinform Publishing House, Budapest scientific pApers

34 Michael K. Asante and John K. M. Kuwornu
APSTRACT Vol. 8. Number 2–3. 2014 pages 33–42 ISSN 1789-7874
tion and natural activity of the juice. Some types of juice (e.g. melon juice) have low levels of acid and this can be increased by adding citric acid to give a pH below 3.5–4.0. Although some producers add a preservative such as sodium benzoate to ensure a long shelf life, this is not necessary if the juice is properly processed. Juice can be extracted from fruits in a number of ways, depending on the hardness of the raw materi-al. Harder fruits such as pineapple are peeled and pulped using a liquidizer and pressed to extract juice. Fresh and processed pineapple is found all over the world. For every five pine-apples produced two are sold on the international market and processed pineapple product such as juice, largely dominates this markets, accounting for 80% of the total trade (Morgan et. al. 2005). Producers usually prefer to sell their produce to ex-porters because of the high price offered and traders who sell on the local markets offer the lowest (African Study Mono-graph, 2004). Citrus fruits and juices are excellent sources of vitamin C containing more than the minimum daily require-ment of 60mg of vitamin C in 240ml of juice (USDA, 2000).
Fruit juice provides a notable amount of iron which pro-duces healthy red blood cells to transport oxygen throughout the body. Citrus fruits and juices are also a good source of folic acid, vitamin B, thiamine and potassium (Nagy et al. 1993; Brown, 2000). A daily glass of fruit juice supplies 20% of daily iron needs of a person (www.livestrong.com). Fruit juice is very important in improving the memory and concen-tration, reducing mental weakness and in curing the problem of heavy bleeding during menstruation (www.drgranny.com).
Tema, Accra and Nsawam are the locations of major fruits processing companies in Ghana. Nkulenu industries a pioneer fruit processing company, for example dominated the local market during the 1970’s through to the 1980’s with its’ mixed products. Astek Fruit Processing also extended the market and began to control a significant market share with its fresh man-go and pineapple juice brands.
The problem of price fluctuations of Ghana’s traditional ex-port such as minerals, cocoa and timber has called for diversi-fication in agricultural productionto expand her export prod-uct base. Fruits are ubiquitous in most temperate and tropical zones. There may be ample raw materials available for short seasons, which mostly go waste due to lack of processing fa-cilities (Brown, 2000).
In Ghana heavy post-harvest losses are annually recorded in fruit and vegetable production resulting in lower prices of ag-ricultural products in the peak season and higher prices in the lean season. It has becomes necessary that post-harvest losses of fruits be addressed so as to increase their shelf lives as the processing industry lacks the capacity to increase production at a particular time to meet excessive demand by consumers.
Ghana is yet to tap into the rich potentials of the fruit pro-cessing which has great benefit for the consumer, producer and country as a whole. The processing industry’s declining state in the country is due to the excessive import of processed fruits coupled with the inability of farmers and other business-men to acquire processing plants for fruits despite its high de-mand locally and on the international market. Therefore, there is the need for Ghana to increase her processing base to enable
the country tap into some of these opportunities both interna-tionally and locally. Consumption of fruit juice in Ghana has become popular and increasing daily. For instance, the do-mestic market for fruit juice has become strong because Gha-naian consumers increasingly appreciate the natural taste and health benefits of Ghana’s own agricultural products. Further, it is believed that fruit juice are the most consumed beverage next to water, however, approximately 70% of these products are imported, and estimates reveal that 10.4 million liters of fruits juice is consumed yearly (Fruit Processors and Market-ers Association of Ghana (FPMAG), 2011).
The objectives of the study are three fold. First, to esti-mate the cost and benefits involved in fruit juice processing at Kudors Fruit Juice Limited. Second, to determine the profit-ability of fruit juice processing at Kudors Fruit Juice Limited, while comparing the profitability of pineapple and mango blend with pineapple fruit juice processing. Third, to assess and rank the constraints affecting fruit juice processing of Ku-dors Fruit Juice Limited.
The justification of this study is to serve as a source of in-formation for fresh fruit producers (farmers), policy makers and entrepreneurs who would like to go into fruit juice pro-cessing. This study will also add to the body of knowledge about the profitability of fruit processing.
1.2 Literature review
Indigenous fruits are those which are native to Africa, where they have originated and evolved over centuries (Center for Tropical Agriculture (CTA), 2007).These are different from exotic fruits, such as citrus and even mango, which have been imported from other continents, although they may now be quite commonly grown in many areas. Across sub-Saharan Africa, a wide variety of indigenous fruit trees are valuable to the diets and incomes of local communities, particularly dur-ing times of potential household food insecurity, for example, during the rainy season when crops are not yet ready for har-vest and stored supplies have run low. Also, many indigenous fruit trees are able to withstand hot, dry conditions as the fruits provide an essential food source. The baobab for example is found throughout Africa at low altitudes and during drought periods, the fruits provide a valued source of vitamins and minerals, but often underutilized (Center for Tropical Agri-culture (CTA), 2007).
Most indigenous fruit trees generally grow wild. The fruits are harvested and eaten at home, sold at the market or pro-cessed into jams and juices to add additional value. However, many fruit trees are used for more than just their fruits. Trees grown on the homestead provide important shade for crops. Leaves may be used for fodder or as compost. Leaves, fruits and other tree parts may also be used for medicinal purposes. The bark is often used for fibre and the timber for furniture, construction of fences etc (Center for Tropical Agriculture (CTA), 2007).
All the processes for fruit juice products require that the juice or pulp is first extracted from the fruit. The juice is ex-

A comparative analysis of the profitability of pineapple-mango blend and pineapple fruit juice processing in Ghana 35
APSTRACT Vol. 8. Number 2–3. 2014 pages 33–42 ISSN 1789-7874
tracted either by pressing the fruit or by mashing it and then pressing the juice out. Juice extracted is used in the prepara-tion of jams and jellies, fruit juices, fruits in syrup and pickles (Appiagyei, 2010). Processing is the transformation of raw produce into a product which is different physically, chemi-cally and nutritionally.
Pande (2009) stated that processing of fruit and vegetables is getting higher attention for enabling farmers to get higher price for the produce. Potentially each large number of fruits grown in Ghana could be used to make large range of prod-ucts, including dried fruit (pineapple and banana for export), fruit wines (especially pineapple), fried snacks (banana or potato chips), juices (pineapple), squashes and cordials. The high demand for these products has led to strong competition as more and more small-scale processors start to produce these products. Companies for example, Blue Skies and individuals also produce cuts fruits for sale, fruits such as pawpaw, pine-apple and at times dried mango are commonly found on the Ghanaian market.
Internationally, countries like the U.S, India are into large scale processing of fruits into various forms. Altman and Eite-man (2009) stated that about 1.8 million tonnes of watermelon were produced in the U.S. in 2007 and 362,874 tonneswere abandoned as culled crop which represent about 20% of pro-duction. In recent studies in the U.S, it was revealed that the culled watermelon has significant potential for use as a sugar source to produce ethanol. Thus, the 362,874 tonnes of culled watermelon from 2007 could be used to produce about 14 mil-lion litres of ethanol.
Global efforts to establish and improve consumer health protection have led to increased governmental and regulatory oversight in the field of food safety (UNIDO, 2004). While most people presume the foods they eat are safe, several re-cent food safety events have eroded this confidence and led to demands from the public for additional protective measures to be enacted to establish the rights of consumers to safe food. Dauthy (1995) stated that the scope of this protection has ex-panded beyond the practices of the food manufacturers and now extends all the way back to the farm gate. Thus, it is es-sential that safety be embodied in food products from produc-tion through consumption, from the farm to the table (food chain approach). All stakeholders in the food chain, including the supply side (producers, transporters, processors, and mer-chants), the government inspection and regulatory authorities and consumers will now have responsibilities and obligations to ensure the safety of food products and protect consumer health (UNIDO,2004).
For enforcement purposes, the Codex Commission has developed several guidelines and food standards. There are today approximately 250 standards and specific requirements for individual foods, groups of foods, and other provisions, e.g., hygiene, contaminants, labeling and food additives. En-forcement of food control has evolved from the traditional focus on inspection of final products and removal of unsafe food from the market to the current holistic and preventive approach, which relies more on system control. This system-atic approach to the identification, assessment, and control of
hazards is known as the Hazard Analysis and Critical Control Point (HACCP) system. The introduction of a HACCP-based food safety system may be difficult for small-scale fruit pro-cessing enterprises and will be best achieved by coordination between the food industry, educational and training organiza-tions, and governing authorities (Leid and Salvosa, 2008).
In Ghana, Standards are set by Ghana Standard Board for fruit juice enterprises. These standards are set in terms of quality, flavor, package and appearance. According to a draft of Ghana Standard Board Specification of juices (DGS 571 WDI), fruit juice is an unfermented but fermentable non-alco-holic drink intended for direct consumption. It is obtained by mechanical process from sound ripe fruit and the juice is either preserved exclusively by physical means or by preservatives.
Juice quality may be referred to as the characteristics which are evaluated by organoleptic and other physical appearance such as colour, flavour, texture, size and appearance. Also in packaging, the water capacity of the package should be the volume of distilled water at 20 degrees celcius and the seal package should not be able to hold this when completely filled. Moreover, the appearance of the fruit juice should be of uniform colour and hence there should be no ring formation present at the neck of the container.
Machiraju (2001) stated that benefit–cost analysis is con-cerned with the examination of a project from the view point of maximization of net benefit. Profitability can be measured on yearly basis or over or the lifespan of an investment whiles the lifespan profitability measure is employed to enable in re-source allocation decision (Ross et al. 2001). Return on as-serts, profit margin and return on equity are also well known profitability measures (Ross et al. 2001).
Once cost and benefits has been identified, if they are to be compared, they must be valued. Underlying all financial analysis is the assumption that prices reflect value, or can be adjusted to do so (Gittinger, 1996).
Cost can be categorized into fixed cost and variable cost. In financial analysis, cost is classified into initial cost of invest-ment and operational cost (Gittinger, 1996). Capital cost is the cost of items needed for the establishment of a project. In general, capital costs usually cover such items as land, build-ings, site preparation and other civil costs, plant and equip-ment installation and testing, vehicles and working capital. Contingency allowance is provided, which is simply added to the cost of the item to which it relates. Operational costs are those incurred in operating and maintaining the project. They are usually the raw materials, labor, water and fuel, transport and maintenance (Gittinger, 1996).
Estimating benefits and cost in a timely manner is very dif-ficult. Benefits are often defined as follows: Tangible benefits which may be reasonably quantified and measured in mone-tary terms; and Intangible benefits that may be quantified oth-erwise or identified and described subjectively. The minimum costs that must be determined are those that specifically are used for comparison to the benefits. These include the follow-ing: The current operating costs or the cost of operating in to-day’s circumstances; and Future period costs that are expected and can be planned for; Intangible cost may be difficult to
36 Michael K. Asante and John K. M. Kuwornu
APSTRACT Vol. 8. Number 2–3. 2014 pages 33–42 ISSN 1789-7874
quantify. These costs are often omitted if quantification would contribute little to the decision making process.
Dasguptaet al. (1974) stated that investment criteria in the systematic evaluation of a project are numerous, some of which include the benefit–cost ratio approach, payback period approach, net present value approach, internal rate of return approach, and domestic resource cost approach, minimum capital–output ratio approach and so on.
The rest of the study is organized as follows. Section 2 pres-ents the methodology; section 3 presents the empirical results, and section 4 presents the conclusions and recommendations.
2. Methodology
2.1 Methods of Analysis
This study employed the Net Present Value (the discounting approach) in its decision as to whether the project is viable. Net Present Value (NPV) basically refers to present value of future cash flows discounted at the opportunity cost of capital minus(net of) the initial investment.
Net Present Value was used because the idea of NPV is to try to express all future values in terms of the present. Thus, to make the values occurring at different times comparable at least with respect to time. Some of its merits are; easy to cal-culate, easy to understand and interpret, it saves time among others. However, despite its advantages, there are some flaws as far as NPV is concerned, some of which include the choice of interest rate. The choice of interest rate is a problem that cuts across all the other investment criteria. However, its ad-vantages are more overwhelming as compared to the internal rate of return which is somewhat cumbersome to follow. The decision rule is that, if the NPV is greater than zero we accept the project but if NPV is less than zero then we reject.
Also the benefit cost (BCR) ratio was used in this study. The decision rule is that we accept the project if the BCR ≥ 1 and when the cost and benefit streams are discounted at the opportunity cost of capital. Thus if BCR > 1 it implies that Fruit juice processing is profitable, if BCR < 1 it implies not profitable and if BCR = 1, the investment break even (Git-tinger, 1996).
Lastly the internal rate of return (IRR) was also employed in the study. The internal rate of return is the discount rate that makes the NPV of the project or investment equals zero (Boardman, 2006). The decision rule is to accept independent projects with IRR ≥ the opportunity cost of capital or the dis-count rate (Gittinger, 1996).
2.2 Theoretical framework
2.2.1 Budgetary approach
Simple budgetary approach was used to calculate the total cost, total revenue and net return.
TC = TFC + TVC (1)
Where TC denotes total Cost; TFC denotes total fixed Cost; TVC denotes total Variable Cost; TR denotes total revenue; TR denotes selling price per liter of fruit juice × total output.
Net Profit = TR – TC (2)
2.2.2 Computation of Actual Total Revenue
Total revenue was calculated by multiplying the quantity of fruit juice produced by the price of juice.
TR = QM × PM (3)Where TR denotes total Revenue; QM denotes quantity of crates sold; PM denotes per unit price of crate.
2.2.3 Computation of Total Cost
The computation of the total cost included all types of variable and fixed cost items involved in the fruit juice processing.
The total cost is estimated as:TC = ∑PxiXi + TFC (4)Where TC denotes total Cost; Xi denotes quantity of vari-
able input; Pxi denotes per unit price of variable input; TFC denotes total fixed Cost.
The net revenue or profit (NR) in monetary terms is the difference between estimated cost and total revenue for the period.
NR = TR – TC (5)Where TC denotes total Cost; and TR denotes total revenue.
2.2.4 Depreciation
Depreciation is the reduction in the value of an asset over a period of time. The value of an asset at the end of its expect-ed useful life is known as its salvage value. The straight line method of depreciation was employed because of its simplic-ity and the ability to reflect the historical cost of assets un-der consideration. The straight line method of depreciation is specified as follows: OC – SVD = –––––––
N (6)Where D denotes depreciation on capital item; OC denotes
original Cost of item; SV denotes savage value; and N denotes expected useful life of capital.
2.2.5 Estimating the Project worth
The following Discounted measures of project worth were used to estimate the worth.
2.2.5.1 Benefit Cost Ratio
Benefit Cost Ratio (BCR) == +
+n
tt
t
tt
rCrB
0 )1/()1/(
(7)Where Bt denotes benefits in year t; Ct denotes cost in year
t; r denotes cost of capital; t denotes number of years. The decision rule is that we accept the project if BCR ≥ 1
when the cost and benefit streams are discounted at the op-portunity cost of capital. Thus, if BCR > 1 it implies that Fruit

A comparative analysis of the profitability of pineapple-mango blend and pineapple fruit juice processing in Ghana 37
APSTRACT Vol. 8. Number 2–3. 2014 pages 33–42 ISSN 1789-7874
juice processing is profitable, if BCR < 1it implies not prof-itable and if BCR = 1, the investment break even (Gittinger, 1996).
2.2.5.2 Net Present Value
Net present value (NPV) is the present worth of the incre-mental net benefit or incremental cash flow stream (Gittinger, 1996). =
= +=
nt
tttt
rCBNPV
1 )1( (8)Where Bt denotes benefits in year t; Ct denotes cost in year
t; n denotes investment lifespan; t denotes time measured in years, r denotes cost of capital.
The decision rule is to accept the project if NPV is positive. This means that the project is viable and in cases where two or more investment show positive NPV’s the one with the high-est NPV is preferable, when NPV = 0 means the investment breaks even (Gittinger, 1996).
2.2.5.3 Internal rate of return (IRR)
This is the discount rate that makes the NPV of project or investment equals zero (Boardman, 2006). Thus,
0)1(1
=+
==
=
nt
tttt
rCBNPV
(9)
However, there is a problem with this method which makes it difficult to use. It involves a lot of try and error with differ-ent discount rates until you get the one that makes the NPV = 0. Nevertheless an alternative and easier method exist which is by interpolation. The actual rate is found by interpolation be-tween two discount rates that gives small positive and nega-tive NPVs. The rule of interpolation is given as:
�I�R�R = �L�D�R+�D �N�P�V�L�D�R
�N�P�V�H�D�R + �N�P�V�L�D�R (10)
Where LDR denotes lower discount rate; HDR denotes higher discount rate; NPVLDR denotes Net Present value at low-er discount rate; NPVHDR denotes Net Present value at higher discount rate; D denotes the difference between discount rates.
The decision rule is to accept independent projects with IRR ≥ the opportunity cost of capital or the discount rate (Git-tinger, 1996). This implies that when IRR is > the cost of capi-tal, it implies that the project is viable, when IRR = cost of capital, it implies the project will break even. However when the IRR < cost of capital, it implies the project is not viable.
2.3 Underlying Assumptions and Project Operation rate
Profitability estimation was based on some assumptions in order to provide the framework for consistent analysis. The following assumptions were made: I. The project life is 11 years starting from year zero to year
ten; year zero being the year of acquiring the machinery
and installing the plant necessary for production. There-fore, there was no production in year zero.
II. The plant capacity is 20 metric tonnes per day. Processing is done six days a week, excluding public holidays result-ing in a total of 300 working days in a year.
III. Actual processing of fruit takes 3days whiles the remain-ing 3 days are used for other activities that are not di-rectly involved in the juice processing. Therefore, the firm has 300 working days. Thus, in a year 150 days are used for actual processing whiles the other 150 days are used for other activities that take place before and after processing.
IV. The conversion rate for pineapple is 0.6 tonne of juice per tonne of fresh fruit whiles that of mango is 0.4 tonne of juice per tonne of fresh mango. A tonne of pineapple fruit cost GHS 500.00 and a tonne of mango cost GHS1000.00.
V. The prices of the cost items are kept constant over the project life. Additionally total cost is commensurate with the increase in the use of plant capacity.
VI. Operation rate of the project is at 70% of plant capacity in year 1 and increases to 90% in the third and fourth years and to 100% in the fifth year. It means that by the fifth year the firm was operating at full capacity up to the end of the project life.
Contingency is at 5% of cost and the residual value of the capital elements is estimated at 10% of the original cost of the items, the cost of disposal of capital assets is at 10% of residual value. The straight line method of depreciation was used to depreciate the items.
2.4 Data collection through Interview with the Manager of Kudors Fruit Juice Limited
In this study, primary data was obtained through a structured questionnaire and personal interview with the manager. The interviews took place at the premises of the firm as this pro-vided a chance to observe practically how fruit processing was done. The questionnaire was designed to cover the location of the firm and kinds of fruits being processed. It also included the cost of production, variable cost, labor cost and output level of the firm.
2.5 Study Area
Kudors fruit juice limited is located at Kasoa in the Awutu-Senya- East in the central region of Ghana.Awutu-Senya-East District with its capital Kasoa was carved from Ewutu Senya and forms part of the new districts and municipalities created in the year 2012 and were inaugurated at their various loca-tions simultaneously on the 28th June, 2012(www.ghanadis-tricts.com).
Awutu-Senya-East District is a new district; hence the as-sembly is in the process of collecting relevant data concerning its location and size; topography and drainage; climate and

38 Michael K. Asante and John K. M. Kuwornu
APSTRACT Vol. 8. Number 2–3. 2014 pages 33–42 ISSN 1789-7874
vegetation; geology and soil; social infrastructure; economy and all that one needs to know about it (www.ghanadistricts.com).
3. Results and Discussion
3.1 Capital items and cost
The initial capital investment, useful life and depreciation needed to begin the project as well as the costs are shown in the table 1 below.
A land size of 1 acre with a building of 70 by 20 feet dimen-sion houses the processing plant and other equipment. The total cost of these was GHS40,000.00. The following items were purchased at the beginning of the project, these includes; juice extractor, corking machine, pasteurizer, vehicles, laptop/computers, office furniture, storage tank and a gas cylinder. For the following items one of each was used; corking ma-chine, laptop, and storage tank and gas cylinder which cost GHS 3,000.00, GHS 1,200.00, GHS600.00, and GHS500.00 respectively. The firm uses two juice extractors which cost GHS11, 000.00, and three pasteurizers and three vehicles which cost GHS900.00 and GHS39, 000.00 respectively.
3.2 Operating items and cost
The operating cost is mainly made up of variable cost of pro-duction such as the raw materials used, labor cost and utilities. The items used by the firm in its daily activities includes; fresh pineapples, fresh mangoes, electricity, bottles, fuel, boxes, water, labor, corks and labels. In year zero it was assumed that there was no production and it was estimated that the produc-tion will be at 70% operating capacity for years 1 and 2 then 90% for years 3 and 4. Peak production is in year 5 where production is maintained throughout the project life.
The administration staff includes the following: secretary, marketing manager, production manager, electrician, mechan-ic and general manager. The secretary, marketing manager and electrician earns GHS200.00 per month whiles the production manager, mechanic and general manager earn GHS300.00, GHS600.00 and GHS 800.00 respectively.
The firm currently employs six laborers and their total cost per month is estimated to be GHS1, 200.00. Contingency cost was estimated at 5% of the baseline cost for each year. The fresh pineapple cost GHS500.00 per tonne and a tonne of fresh mango cost GHS1,000.00.
Table 2 shows the operating items and cost.
3.3 Estimated Revenue and Residual value
The firm produces two forms of the fruit juice; pineapple juice only and pineapple and mango blend. Therefore, the revenue received from the sale of the produce comes from these two forms. The project cash inflow was from the sale of the juice at GHS 20.00 per crate of juice. For the pineapple juice only, the estimated revenue for the first and second years (year 1 and year 2) of production was GHS120, 960.00 each, the third and fourth year had GHS155, 520.00 and the 5th year which is the peak year had GHS172, 800.00 and was maintained to the year 9. The highest cash inflow occurred at year 10 which had a value of GHS221, 976. 00.
However, for the blend, the revenue received for year 1 and year 2 was GHS161, 280.00, year 2 and year 3 recorded GHS207,360.00, the fifth to ninth year had GHS230,400.00. The highest cash inflow recorded occurred at year 10 which had GHS283, 176.00. The residual value was calculated by the following formula:
Residual value at the end of the project = Total Invest-ment- (Total annual depreciation*10) + value of land – cost of disposal of capital assets (11)
Table 1. Capital investment
Items Size/capacity/ Quantity
Total costGHS Useful life Total depreciation
(90%)
Annual depreciation
(GHS)
Land 1 acre 18 000 –
Building(70x20feet) 1 22 000 30 2200 660
Juice extractor 2 11 000 10 1100 990
Corking machine 1 1 300 10 130 117
Pasteurizer 3 900 10 90 54
Vehicles 3 39 000 10 3900 3510
Laptops/computers 1 1 200 5 120 216
Office furniture and fitting 5 1 500 5 150 225
Storage tank 1 600 5 60 108
Cylinder 1 500 5 50 56
Total Investment 96 000 5600 5936
Source: Authors’ Computation from Field Survey, 2013
A comparative analysis of the profitability of pineapple-mango blend and pineapple fruit juice processing in Ghana 39
APSTRACT Vol. 8. Number 2–3. 2014 pages 33–42 ISSN 1789-7874
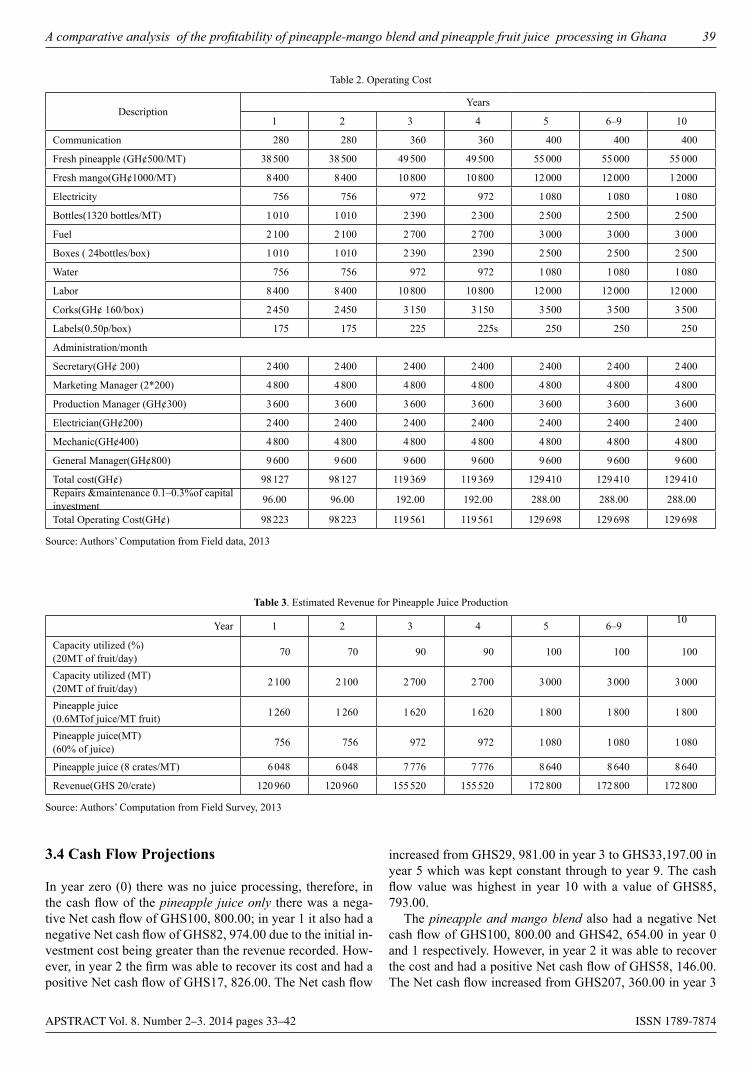
3.4 Cash Flow Projections
In year zero (0) there was no juice processing, therefore, in the cash flow of the pineapple juice only there was a nega-tive Net cash flow of GHS100, 800.00; in year 1 it also had a negative Net cash flow of GHS82, 974.00 due to the initial in-vestment cost being greater than the revenue recorded. How-ever, in year 2 the firm was able to recover its cost and had a positive Net cash flow of GHS17, 826.00. The Net cash flow
increased from GHS29, 981.00 in year 3 to GHS33,197.00 in year 5 which was kept constant through to year 9. The cash flow value was highest in year 10 with a value of GHS85, 793.00.
The pineapple and mango blend also had a negative Net cash flow of GHS100, 800.00 and GHS42, 654.00 in year 0 and 1 respectively. However, in year 2 it was able to recover the cost and had a positive Net cash flow of GHS58, 146.00. The Net cash flow increased from GHS207, 360.00 in year 3
Table 2. Operating Cost
Description Years
1 2 3 4 5 6–9 10
Communication 280 280 360 360 400 400 400
Fresh pineapple (GH¢500/MT) 38 500 38 500 49 500 49 500 55 000 55 000 55 000
Fresh mango(GH¢1000/MT) 8 400 8 400 10 800 10 800 12 000 12 000 1 2000
Electricity 756 756 972 972 1 080 1 080 1 080
Bottles(1320 bottles/MT) 1 010 1 010 2 390 2 300 2 500 2 500 2 500
Fuel 2 100 2 100 2 700 2 700 3 000 3 000 3 000
Boxes ( 24bottles/box) 1 010 1 010 2 390 2390 2 500 2 500 2 500
Water 756 756 972 972 1 080 1 080 1 080
Labor 8 400 8 400 10 800 10 800 12 000 12 000 12 000
Corks(GH¢ 160/box) 2 450 2 450 3 150 3 150 3 500 3 500 3 500
Labels(0.50p/box) 175 175 225 225s 250 250 250
Administration/month
Secretary(GH¢ 200) 2 400 2 400 2 400 2 400 2 400 2 400 2 400
Marketing Manager (2*200) 4 800 4 800 4 800 4 800 4 800 4 800 4 800
Production Manager (GH¢300) 3 600 3 600 3 600 3 600 3 600 3 600 3 600
Electrician(GH¢200) 2 400 2 400 2 400 2 400 2 400 2 400 2 400
Mechanic(GH¢400) 4 800 4 800 4 800 4 800 4 800 4 800 4 800
General Manager(GH¢800) 9 600 9 600 9 600 9 600 9 600 9 600 9 600
Total cost(GH¢) 98 127 98 127 119 369 119 369 129 410 129 410 129 410Repairs &maintenance 0.1–0.3%of capital investment 96.00 96.00 192.00 192.00 288.00 288.00 288.00
Total Operating Cost(GH¢) 98 223 98 223 119 561 119 561 129 698 129 698 129 698
Source: Authors’ Computation from Field data, 2013
Table 3. Estimated Revenue for Pineapple Juice Production
Year 1 2 3 4 5 6–9 10
Capacity utilized (%) (20MT of fruit/day) 70 70 90 90 100 100 100
Capacity utilized (MT) (20MT of fruit/day) 2 100 2 100 2 700 2 700 3 000 3 000 3 000
Pineapple juice (0.6MTof juice/MT fruit) 1 260 1 260 1 620 1 620 1 800 1 800 1 800
Pineapple juice(MT) (60% of juice) 756 756 972 972 1 080 1 080 1 080
Pineapple juice (8 crates/MT) 6 048 6 048 7 776 7 776 8 640 8 640 8 640
Revenue(GHS 20/crate) 120 960 120 960 155 520 155 520 172 800 172 800 172 800
Source: Authors’ Computation from Field Survey, 2013

40 Michael K. Asante and John K. M. Kuwornu
APSTRACT Vol. 8. Number 2–3. 2014 pages 33–42 ISSN 1789-7874
to GHS230, 780.00 in year 5 which was kept constant to year 9. Net cash flow of GHS283, 176.00 which was the highest was recorded in year 10. The tables 5 and 6below summarize the cash flow projections for the two forms of juices.
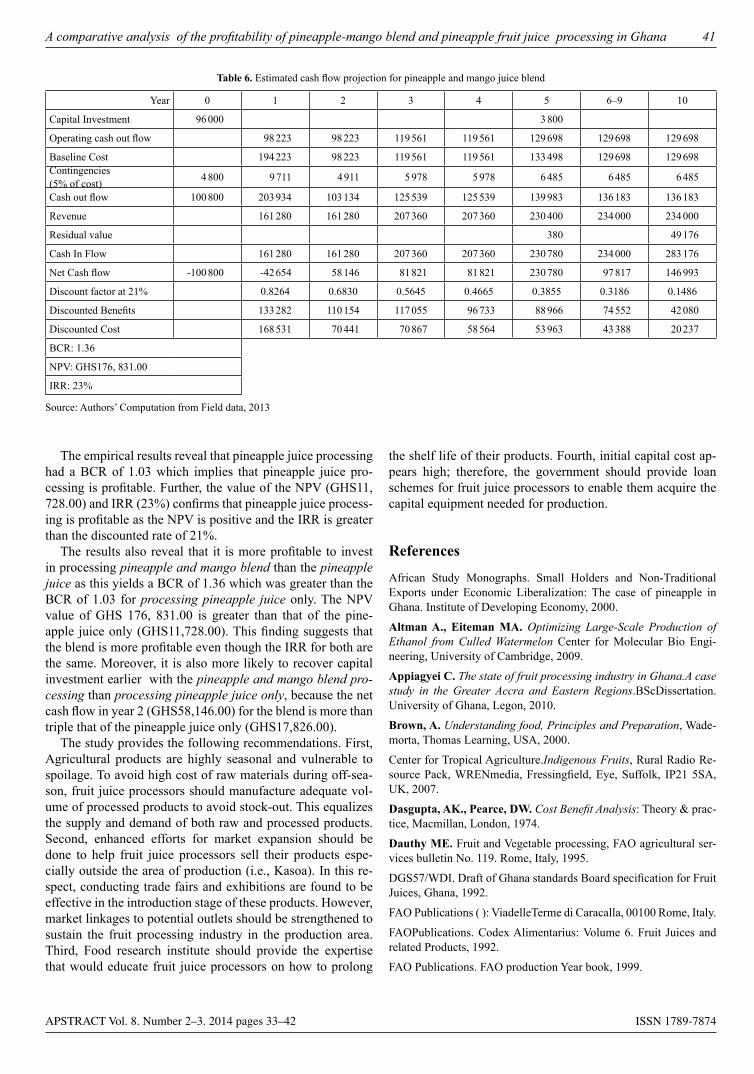
3.5 Estimated project worth
At a discount rate of 21%, the benefits and cost for both forms of the juice were discounted. For The pineapple juice process-ing has a BCR of1.03 and it had an NPV of GHS11, 728.00 and an internal rate of return of 23% which was greater than the discount rate (21%) indicating that the project is viable (i.e., profitable).
The pineapple and mango blend processing had a BCR of 1.36, an NPV of GHS176, 831.00, and an internal rate of return recorded was 23% which was greater than the discount rate of 21% indicating that the project is viable (i.e., profitable).
However, a comparison the profitability of the two types of fruit juice processing suggests that it is more profitable to
go into the pineapple and mango blend processing as its BCR and NPV are all greater than that of pineapple juice only. Nev-ertheless, the internal rates of return for both types of process-ing are equal and greater than the cost of capital. The tables below summarize the cash flow projections for the two forms of the juice processing.
4. Conclusions and Recommendations
In this study, the profitability of fruit juice processing was car-ried out using data from Kudors fruit juice limited at Kasoa. The cost involved in fruit juice processing was obtained from the company. These include the capital cost and the operating cost. The profitability of the project was determined using the following discounted measures of project worth: Benefit-Cost Ratio (BCR), Net Present Value (NPV) and Internal Rate of Return (IRR).
Table 4. Estimated Revenue for Pineapple and Mango Juice Blend
Year 1 2 3 4 5 6–9 10
Capacity utilized (%) 70 70 90 90 100 100 100
Capacity utilized (MT) 2 100 2 100 2 700 2 700 3 000 3 000 3 000
Mango juice(0.4MT of juice/MT of fruits) 840 840 1 080 1 080 1 200 1 200 1 200
40% pineapple juice + mango juice blend (MT) 1 344 1 344 1 728 1 728 1 920 1 920 1 920
Pineapple and mango juice blend (6 crates/MT) 8 064 8 064 10 368 10 368 11 520 11 520 11 520
Revenue(GH¢20/crate) 161 280 161 280 207 360 207 360 230 400 234 000 234 000
Source: Authors’ Computation from Field data, 2013
Table 5. Estimated cash flow projection for pineapple juice processing
Year 0 1 2 3 4 5 6–9 10
Capital Investment 96 000 3 800
Operating cash out flow 98 223 98 223 119 561 119 561 129 698 129 698 129 698
Baseline Cost 194 223 98 223 119 561 119 561 133 498 129 698 129 698
Contingencies (5% of cost) 4 800 9 711 4 911 5 978 5 978 6 485 6 485 6 485
Cash out flow 100 800 203 934 103 134 125 539 125 539 139 983 136 183 136 183
Revenue 120 960 120 960 155 520 155 520 172 800 172 800 172 800
Residual value 380 4 9176
Cash In Flow 120 960 120 960 155 520 155 520 173 180 172 800 221 976
Net Cash flow -100 800 -82 974 17 826 29 981 29 981 33 197 36 617 85 793
Discount factor at 21% 0.8264 0.6830 0.5645 0.4665 0.3855 0.3186 0.1486
Discounted Benefits 99 961 82 616 87 791 72 550 66 761 55 054 32 986
Discounted Cost 168 531 70 441 70 867 58 564 53 963 43 388 20 237
BCR: 1. 03
NPV: GHS11,728.00
IRR: 23%
Source: Authors’ Computation from Field data, 2013
A comparative analysis of the profitability of pineapple-mango blend and pineapple fruit juice processing in Ghana 41
APSTRACT Vol. 8. Number 2–3. 2014 pages 33–42 ISSN 1789-7874
The empirical results reveal that pineapple juice processing had a BCR of 1.03 which implies that pineapple juice pro-cessing is profitable. Further, the value of the NPV (GHS11, 728.00) and IRR (23%) confirms that pineapple juice process-ing is profitable as the NPV is positive and the IRR is greater than the discounted rate of 21%.
The results also reveal that it is more profitable to invest in processing pineapple and mango blend than the pineapple juice as this yields a BCR of 1.36 which was greater than the BCR of 1.03 for processing pineapple juice only. The NPV value of GHS 176, 831.00 is greater than that of the pine-apple juice only (GHS11,728.00). This finding suggests that the blend is more profitable even though the IRR for both are the same. Moreover, it is also more likely to recover capital investment earlier with the pineapple and mango blend pro-cessing than processing pineapple juice only, because the net cash flow in year 2 (GHS58,146.00) for the blend is more than triple that of the pineapple juice only (GHS17,826.00).
The study provides the following recommendations. First, Agricultural products are highly seasonal and vulnerable to spoilage. To avoid high cost of raw materials during off-sea-son, fruit juice processors should manufacture adequate vol-ume of processed products to avoid stock-out. This equalizes the supply and demand of both raw and processed products.Second, enhanced efforts for market expansion should be done to help fruit juice processors sell their products espe-cially outside the area of production (i.e., Kasoa). In this re-spect, conducting trade fairs and exhibitions are found to be effective in the introduction stage of these products. However, market linkages to potential outlets should be strengthened to sustain the fruit processing industry in the production area. Third, Food research institute should provide the expertise that would educate fruit juice processors on how to prolong
the shelf life of their products. Fourth, initial capital cost ap-pears high; therefore, the government should provide loan schemes for fruit juice processors to enable them acquire the capital equipment needed for production.
References
African Study Monographs. Small Holders and Non-Traditional Exports under Economic Liberalization: The case of pineapple in Ghana. Institute of Developing Economy, 2000.
Altman A., Eiteman MA. Optimizing Large-Scale Production of Ethanol from Culled Watermelon Center for Molecular Bio Engi-neering, University of Cambridge, 2009.
Appiagyei C. The state of fruit processing industry in Ghana.A case study in the Greater Accra and Eastern Regions.BScDissertation.University of Ghana, Legon, 2010.
Brown, A. Understanding food, Principles and Preparation, Wade-morta, Thomas Learning, USA, 2000.
Center for Tropical Agriculture.Indigenous Fruits, Rural Radio Re-source Pack, WRENmedia, Fressingfield, Eye, Suffolk, IP21 5SA, UK, 2007.
Dasgupta, AK., Pearce, DW. Cost Benefit Analysis: Theory & prac-tice, Macmillan, London, 1974.
Dauthy ME. Fruit and Vegetable processing, FAO agricultural ser-vices bulletin No. 119. Rome, Italy, 1995.
DGS57/WDI. Draft of Ghana standards Board specification for Fruit Juices, Ghana, 1992.
FAO Publications ( ): ViadelleTerme di Caracalla, 00100 Rome, Italy.
FAOPublications. Codex Alimentarius: Volume 6. Fruit Juices and related Products, 1992.
FAO Publications. FAO production Year book, 1999.
Table 6. Estimated cash flow projection for pineapple and mango juice blend
Year 0 1 2 3 4 5 6–9 10
Capital Investment 96 000 3 800
Operating cash out flow 98 223 98 223 119 561 119 561 129 698 129 698 129 698
Baseline Cost 194 223 98 223 119 561 119 561 133 498 129 698 129 698Contingencies (5% of cost) 4 800 9 711 4 911 5 978 5 978 6 485 6 485 6 485
Cash out flow 100 800 203 934 103 134 125 539 125 539 139 983 136 183 136 183
Revenue 161 280 161 280 207 360 207 360 230 400 234 000 234 000
Residual value 380 49 176
Cash In Flow 161 280 161 280 207 360 207 360 230 780 234 000 283 176
Net Cash flow -100 800 -42 654 58 146 81 821 81 821 230 780 97 817 146 993
Discount factor at 21% 0.8264 0.6830 0.5645 0.4665 0.3855 0.3186 0.1486
Discounted Benefits 133 282 110 154 117 055 96 733 88 966 74 552 42 080
Discounted Cost 168 531 70 441 70 867 58 564 53 963 43 388 20 237
BCR: 1.36
NPV: GHS176, 831.00
IRR: 23%
Source: Authors’ Computation from Field data, 2013

42 Michael K. Asante and John K. M. Kuwornu
APSTRACT Vol. 8. Number 2–3. 2014 pages 33–42 ISSN 1789-7874
FAOSTAT. FAO statistics, Food and Agriculture Organization of UN Rome, Italy, 2007.Fruit Processors and Marketers Association of Ghana. Press Release, 2011.Gittinger, JP. Economic Analysis of Agricultural Project, John Hop-kins University Press, Baltimore, 2nd edition, completely revised and expanded, 1996.Leid, JB., Salvosa, CR. Assessment of Government-Assisted Fruit Processing Enterprises in Nueva Vizcaya, Research Journal, XV (1&2) * January–December, 39–44, 2008.Machiraju, HR. Fiscal Policy for Equitable Growth, Macmillan, Project Finance, Vikas Publishing House Pvt. Ltd, 2001.Morgan, NA., Anderson, EW., Mittal, V. Understanding firms Cus-tomer Satisfaction information usage. Journal of Marketing, 69 (3), 131–151, 2005.
Nagy, S., Chen CS., Shaw, PE. Fruit Juice Processing Technology, Ag Science, Inc., Auburndale, Florida, 1993.Pande, JC. Watermelon Processing Triple Solar Integrated Device. Central Arid Zone Research Institute, 2009.Ross, SA., Westerfield, RW., Jordan, BD. Essentials of Cooperate Finance, 3rdedition. NY, America: McGraw-Hill, 2001.Sauco V. Mango Production and world market; current situation and future prospect, 2004.UNIDO. Small Scale Fruit and Vegetable Processing and Products, Vienna, 2004.USDA. USDA Nutrient Database for standard Reference, Release 13, Nutrient Data Laboratory Home Page, 2000.www.drgranny.com (date assessed 15/10/2012)www.ghanadistricts.com (date assessed 08/02/2013)www.livestrong.com(date assessed 15/10/2012)
Related Documents


