Procedia - Social and Behavioral Sciences 53 (2012) 891 – 900 1877-0428 © 2012 The Authors. Published by Elsevier Ltd. Selection and/or peer-review under responsibility of SIIV2012 Scientific Committee doi:10.1016/j.sbspro.2012.09.938 SIIV - 5th International Congress - Sustainability of Road Infrastructures A Comparative Analysis of Powered Two Wheelers Crash Severity among Different Urban Areas Salvatore Cafiso a *, Grazia La Cava a , Giuseppina Pappalardo a a Department of Civil and Environmental Engineering, School of Engineering, University of Catania, Viale Andrea Doria 6, I-95125 Catania, Italy Abstract Powered Two-Wheelers are greatly represented in fatal crashes, above all in urban areas accounting for 21 % of all road fatalities by mode of transport in EU. In an international comparison of PTWs crashes, Italy assumes a leadership accounting 30% of deaths on the total losses in crashes in urban area. In this paper a Bayesian approach is used to analyze proportion of PTWs fatal crashes with respect to total number involving a PTW in different urban areas in Italy. Proportion of fatalities is used as measure of severity risk which can be ranked in order to identify anomalous situations. Keywords: Powered Two Wheelers; Crash Severity; Urban Area; Bayes Theorem; Proportion Method. 1. Introduction and Background Nowadays not all road users groups benefit equally from progress achieved in road safety. Worldwide, in most countries overall road deaths have fallen more quickly than motorcycle fatalities. Vulnerable Road Users (pedestrians cycle- users’ and Powered Two Wheelers-) have a greater risk of mortality than other ones and Powered Two Wheelers (PTWs), which are only a subset of all circulating motor vehicles (about 14% of the entire European private vehicle fleet - cars and PTWs only) – , are greatly represented in fatal crashes, above all in urban areas accounting for 21 % of all road fatalities by mode of transport in 24 EU Member States. While the number of road deaths has declined considerably in the past decade in Europe, the number of PTW riders killed rose in 13 out of 27 countries. EU 15 average number of fatalities per 10.000 motorcycles decreased from 4.7 in 2000 to 3.8 in 2004, Italy which represents 31% of the EU15 circulating motorcycle park, shows an increase from 2.2 in 2000 to 2.5 in 2004.In Figure 1, worldwide comparison of the percentages of PTWs fatalities, among high- * Corresponding author. Tel.: + 39 095 738 2213; fax: + 39 095 738 7913. E-mail address: [email protected] Available online at www.sciencedirect.com © 2012 The Authors. Published by Elsevier Ltd. Selection and/or peer-review under responsibility of SIIV2012 Scientific Committee

Welcome message from author
This document is posted to help you gain knowledge. Please leave a comment to let me know what you think about it! Share it to your friends and learn new things together.
Transcript

Procedia - Social and Behavioral Sciences 53 ( 2012 ) 891 – 900
1877-0428 © 2012 The Authors. Published by Elsevier Ltd. Selection and/or peer-review under responsibility of SIIV2012 Scientifi c Committeedoi: 10.1016/j.sbspro.2012.09.938
SIIV - 5th International Congress - Sustainability of Road Infrastructures
A Comparative Analysis of Powered Two Wheelers Crash Severity among Different Urban Areas
Salvatore Cafisoa*, Grazia La Cavaa, Giuseppina Pappalardoa aDepartment of Civil and Environmental Engineering, School of Engineering, University of Catania, Viale Andrea Doria 6, I-95125 Catania,
Italy
Abstract
Powered Two-Wheelers are greatly represented in fatal crashes, above all in urban areas accounting for 21 % of all road fatalities by mode of transport in EU. In an international comparison of PTWs crashes, Italy assumes a leadership accounting 30% of deaths on the total losses in crashes in urban area. In this paper a Bayesian approach is used to analyze proportion of PTWs fatal crashes with respect to total number involving a PTW in different urban areas in Italy. Proportion of fatalities is used as measure of severity risk which can be ranked in order to identify anomalous situations. © 2012 The Authors. Published by Elsevier Ltd. Selection and/or peer-review under responsibility of SIIV2012 Scientific Committee Keywords: Powered Two Wheelers; Crash Severity; Urban Area; Bayes Theorem; Proportion Method.
1. Introduction and Background
Nowadays not all road users groups benefit equally from progress achieved in road safety. Worldwide, in most countries overall road deaths have fallen more quickly than motorcycle fatalities. Vulnerable Road Users (pedestrians cycle- users’ and Powered Two Wheelers-) have a greater risk of mortality than other ones and Powered Two Wheelers (PTWs), which are only a subset of all circulating motor vehicles (about 14% of the entire European private vehicle fleet - cars and PTWs only) – , are greatly represented in fatal crashes, above all in urban areas accounting for 21 % of all road fatalities by mode of transport in 24 EU Member States. While the number of road deaths has declined considerably in the past decade in Europe, the number of PTW riders killed rose in 13 out of 27 countries. EU 15 average number of fatalities per 10.000 motorcycles decreased from 4.7 in 2000 to 3.8 in 2004, Italy which represents 31% of the EU15 circulating motorcycle park, shows an increase from 2.2 in 2000 to 2.5 in 2004.In Figure 1, worldwide comparison of the percentages of PTWs fatalities, among high-
* Corresponding author. Tel.: + 39 095 738 2213; fax: + 39 095 738 7913. E-mail address: [email protected]
Available online at www.sciencedirect.com
© 2012 The Authors. Published by Elsevier Ltd. Selection and/or peer-review under responsibility of SIIV2012 Scientific Committee
892 Salvatore Cafi so et al. / Procedia - Social and Behavioral Sciences 53 ( 2012 ) 891 – 900
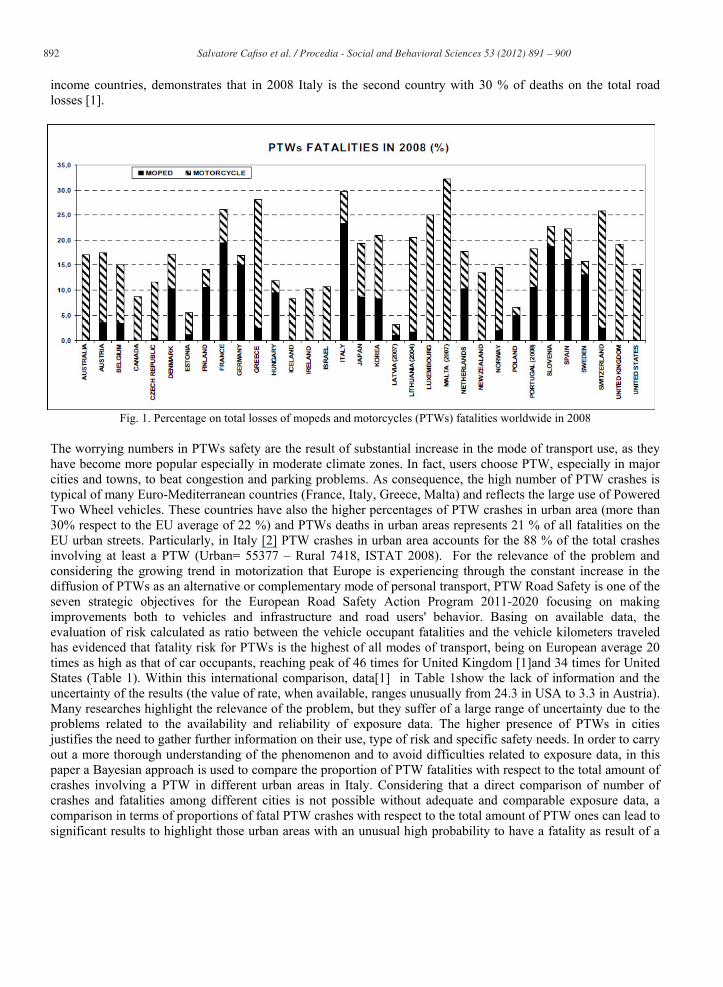
income countries, demonstrates that in 2008 Italy is the second country with 30 % of deaths on the total road losses [1].
Fig. 1. Percentage on total losses of mopeds and motorcycles (PTWs) fatalities worldwide in 2008
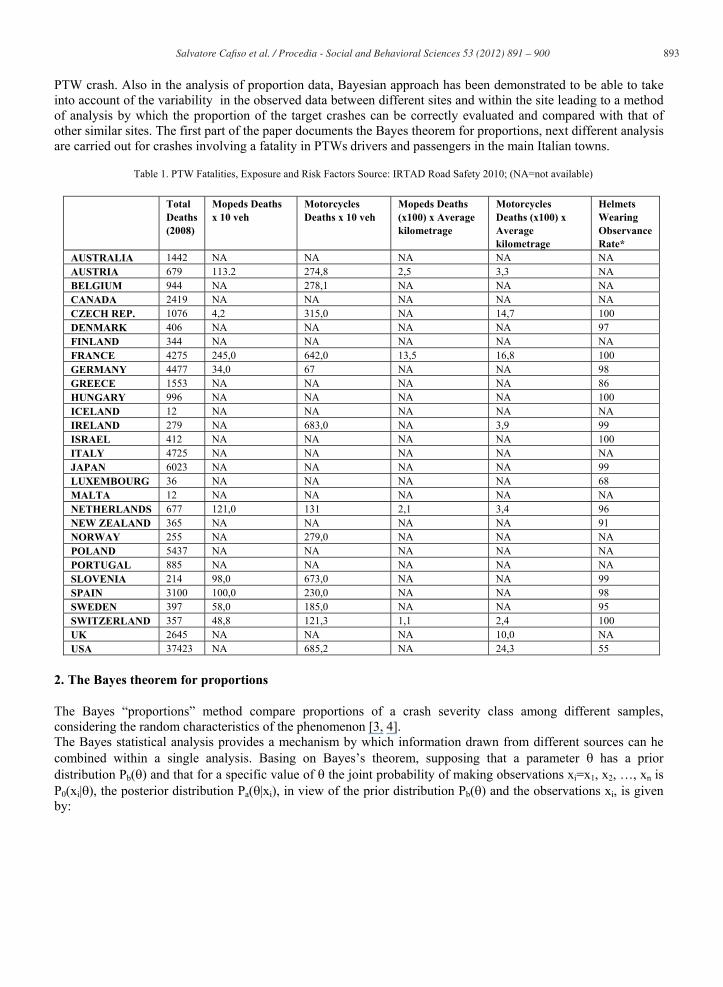
The worrying numbers in PTWs safety are the result of substantial increase in the mode of transport use, as they have become more popular especially in moderate climate zones. In fact, users choose PTW, especially in major cities and towns, to beat congestion and parking problems. As consequence, the high number of PTW crashes is typical of many Euro-Mediterranean countries (France, Italy, Greece, Malta) and reflects the large use of Powered Two Wheel vehicles. These countries have also the higher percentages of PTW crashes in urban area (more than 30% respect to the EU average of 22 %) and PTWs deaths in urban areas represents 21 % of all fatalities on the EU urban streets. Particularly, in Italy [2] PTW crashes in urban area accounts for the 88 % of the total crashes involving at least a PTW (Urban= 55377 – Rural 7418, ISTAT 2008). For the relevance of the problem and considering the growing trend in motorization that Europe is experiencing through the constant increase in the diffusion of PTWs as an alternative or complementary mode of personal transport, PTW Road Safety is one of the seven strategic objectives for the European Road Safety Action Program 2011-2020 focusing on making improvements both to vehicles and infrastructure and road users' behavior. Basing on available data, the evaluation of risk calculated as ratio between the vehicle occupant fatalities and the vehicle kilometers traveled has evidenced that fatality risk for PTWs is the highest of all modes of transport, being on European average 20 times as high as that of car occupants, reaching peak of 46 times for United Kingdom [1]and 34 times for United States (Table 1). Within this international comparison, data[1] in Table 1show the lack of information and the uncertainty of the results (the value of rate, when available, ranges unusually from 24.3 in USA to 3.3 in Austria). Many researches highlight the relevance of the problem, but they suffer of a large range of uncertainty due to the problems related to the availability and reliability of exposure data. The higher presence of PTWs in cities justifies the need to gather further information on their use, type of risk and specific safety needs. In order to carry out a more thorough understanding of the phenomenon and to avoid difficulties related to exposure data, in this paper a Bayesian approach is used to compare the proportion of PTW fatalities with respect to the total amount of crashes involving a PTW in different urban areas in Italy. Considering that a direct comparison of number of crashes and fatalities among different cities is not possible without adequate and comparable exposure data, a comparison in terms of proportions of fatal PTW crashes with respect to the total amount of PTW ones can lead to significant results to highlight those urban areas with an unusual high probability to have a fatality as result of a
893 Salvatore Cafi so et al. / Procedia - Social and Behavioral Sciences 53 ( 2012 ) 891 – 900
PTW crash. Also in the analysis of proportion data, Bayesian approach has been demonstrated to be able to take into account of the variability in the observed data between different sites and within the site leading to a method of analysis by which the proportion of the target crashes can be correctly evaluated and compared with that of other similar sites. The first part of the paper documents the Bayes theorem for proportions, next different analysis are carried out for crashes involving a fatality in PTWs drivers and passengers in the main Italian towns.
Table 1. PTW Fatalities, Exposure and Risk Factors Source: IRTAD Road Safety 2010; (NA=not available)
Total Deaths (2008)
Mopeds Deaths x 10 veh
Motorcycles Deaths x 10 veh
Mopeds Deaths (x100) x Average kilometrage
Motorcycles Deaths (x100) x Average kilometrage
Helmets Wearing Observance Rate*
AUSTRALIA 1442 NA NA NA NA NA AUSTRIA 679 113.2 274,8 2,5 3,3 NA BELGIUM 944 NA 278,1 NA NA NA CANADA 2419 NA NA NA NA NA CZECH REP. 1076 4,2 315,0 NA 14,7 100 DENMARK 406 NA NA NA NA 97 FINLAND 344 NA NA NA NA NA FRANCE 4275 245,0 642,0 13,5 16,8 100 GERMANY 4477 34,0 67 NA NA 98 GREECE 1553 NA NA NA NA 86 HUNGARY 996 NA NA NA NA 100 ICELAND 12 NA NA NA NA NA IRELAND 279 NA 683,0 NA 3,9 99 ISRAEL 412 NA NA NA NA 100 ITALY 4725 NA NA NA NA NA JAPAN 6023 NA NA NA NA 99 LUXEMBOURG 36 NA NA NA NA 68 MALTA 12 NA NA NA NA NA NETHERLANDS 677 121,0 131 2,1 3,4 96 NEW ZEALAND 365 NA NA NA NA 91 NORWAY 255 NA 279,0 NA NA NA POLAND 5437 NA NA NA NA NA PORTUGAL 885 NA NA NA NA NA SLOVENIA 214 98,0 673,0 NA NA 99 SPAIN 3100 100,0 230,0 NA NA 98 SWEDEN 397 58,0 185,0 NA NA 95 SWITZERLAND 357 48,8 121,3 1,1 2,4 100 UK 2645 NA NA NA 10,0 NA USA 37423 NA 685,2 NA 24,3 55
2. The Bayes theorem for proportions
The Bayes “proportions” method compare proportions of a crash severity class among different samples, considering the random characteristics of the phenomenon [3, 4]. The Bayes statistical analysis provides a mechanism by which information drawn from different sources can he combined within a single analysis. Basing on Bayes’s theorem, supposing that a parameter has a prior distribution Pb( ) and that for a specific value of the joint probability of making observations xi=x1, x2, …, xn is P0(xi| ), the posterior distribution Pa( |xi), in view of the prior distribution Pb( ) and the observations xi, is given by:

894 Salvatore Cafi so et al. / Procedia - Social and Behavioral Sciences 53 ( 2012 ) 891 – 900
'0
0
')'()'()()(
)(dPxP
PxPxP
bi
biia
(1) Thus, for any value of , the value of the posterior distribution is proportional to that of the prior and to the
probability that the observations would occur if that value of is obtained. The posterior distribution Pa represents the resolution of the prior with the evidence of the observations. The parameter is a random variable whose true mean is unknown but defined for each site. The prior represents the distribution of the at sites with characteristics similar to those under investigation. This kind of analysis is usually applied to analyze the mean rate of occurrence of accidents at a site. Hauer [5] showed how the estimate of the mean occurrence of accidents at a site based on the number of accident occurring there, can be modified using the distribution of accident numbers occurring at sites of the same kind in order to remove any bias. In the application of the Bayes’s theorem two issues always arise:
the form of the probability model P0 for observations; the form and parameters of the prior distribution Pb.
In this paper, the parameter represents the probability that a PTW crash has as consequence a fatality for the driver or the passenger of PTW, being:
nx
(2) where x = number of fatal PTW crashes n = total number of PTW crashes Referring to the probability model P0 for observations, we can suppose:
a) that the long term proportion of all accidents occurring at the site which involves a fatal consequence is , b) that the involvement of this feature is independent between different crashes occurring at the site, and c) that the probability of a crash involving this feature is constant in time.
Under these hypotheses it can be assumed the binomial probability distribution for the number of crashes (x) involving a specific feature out of a total of “n” occurring at the site. Thus with 0 < x < n
xnx )1(x)!-(nx!
n! )x(P0 (3)
The value of is constant in each site, but it is not the same at every site. The distribution of among similar
sites is given by the prior distribution Pb( ). An appropriate form for the prior distribution to use in conjunction with the binomial distribution of P0(x| ) is the Beta distribution:
)()()(
)1()(11
bP (0 < < 1) (4)
where is the gamma function and and are constant parameters called shape and scale respectively.
The mean E( ) and the variance Var( ) of the Beta distribution are given by: E( )= /( + ) (5) Var( )=
Method of moment is probably one of the relatively simple approach for fitting the unconditional distribution
to the observed data. The method assumes that the mean and variance of the distribution are identical with the
895 Salvatore Cafi so et al. / Procedia - Social and Behavioral Sciences 53 ( 2012 ) 891 – 900
sample mean and variance based upon the observed data. Therefore, the parameters and of the Beta prior distribution can be estimated from the sample mean “ ” and the variance “s” of a reference population, using the following equations:
2
232
s
s (7)
(8)
where:
mnxm
i
i
11 (9)
m
i
m
i i
i
ii
ii
n
x
mnn
xx
ms
1
2
12
22 1
11 n > 2 (10)
with m = number of sites in the reference population xi = number of PTW fatal crashes at site i ni = total number of PTW crashes at site i
Applying the Bayes’s theorem (1) to the binomial observation distribution with the Beta prior distribution, the posterior distribution is again a Beta distribution with the following form:
)()()(
)1(),(11
nxnx
nxPxnx
a (11)
with parameters updated according to the observations xi and ni at site i: i’ = +xi (12)
i’ = +ni – xi (13)
For this reason the Beta distribution is an expedient choice of prior for use with the binomial processes, and it
is the natural conjugate prior for the binomial distribution. In the posterior distribution the value of is incremented by the number of crashes that were observed which involved the target feature (xi), whilst is incremented by the number of accidents which did not involve this feature (ni-xi). Thus, it is clear that the effect of updating the prior distribution with given numbers of observed crashes as occurring with and without the feature is less for higher values of and in the prior. Large values of and in the prior corresponds to large amount of information in the prior, whilst smaller ones correspond to less. The relative weights afforded to the prior information and to the observations by Bayes’s theorem can them be identified as ( + ) and n respectively.
The posterior distribution Pa( |xi,ni) represents the state of knowledge concerning the parameter after the observations in the site “i” have been combined with the prior distribution. The posterior distribution thus provides the possibility to analyze that has associated with it a density distribution that is specific to the site. It can be possible to calculate the posterior probability of any proposition concerning being true at a single site, or alternatively the degree of belief in this. If we are interested to identify dominant proportions of crashes characterized by specific features which have occurred at a site, two propositions can be investigated (Heydecker and Wu, 1991):
P1: “The probability that the proportion of crash which occurs at this site involving a certain feature is greater than normal at similar sites”

896 Salvatore Cafi so et al. / Procedia - Social and Behavioral Sciences 53 ( 2012 ) 891 – 900
P2: “The probability that the proportion of crash which occurs at this site involving a certain feature is greater than at other similar sites”. Each of these propositions can be evaluated in probabilistic terms using the posterior distribution Pa( |xi, ni) for
site “i”. Referring to proposition P1, the normal reference value of for all the sites can be identified with the median m of the prior distribution, defined by:
5.0)(1
m
dPb (14)
Thus, the proposition P1 can be evaluated as: 1
),(1m
dnxPP iia (15)
The value of P1=0 indicates that the proposition is almost certainly false, whilst the value P1=1 indicates almost certain true. If no observation are available Pa( |xi, ni) Pb( ) and therefore P1=0.5 indicating that P1 is true for as many sites as not defining a neutral result. This justify the use of the median as the lower limit in (15).
Proposition P2 can be evaluated as
'),()'(21
'
1
0'
ddnxPPP iiab (16)
The value of P2 can be interpreted in a similar way as for P1.
3. Analysis of PTWs fatalities in urban areas
The analysis of the PTW fatalities occurrence in different countries, reported in Chapter 1, showed the highrelevance of this kind of crash events in Italy. Considering that percentage of fatal crashes in total crash occurrence is an indicator of crash severity which can be used to compare different sites, a comparative analysis of PTW crashes severity among different urban areas can lead to significant results to highlight those urban municipalities with lower performance in PTW road safety. To reach comparable urban environments and target crash consequences, the 85 chief towns of province in Italy with more than 50,000 inhabitants and PTW crashes with fatal consequences for the PTW driver and/or PTW passenger were chosen. To treat a significant data set, severe (fatal and injured) crashes involving PTW in three years (2006, 2007, 2008) were collected and treated from the national ISTAT database [6] The parameters and of the Beta prior distributions for the proportion of fatal PTWs crashes in urban area were estimated from the sample mean and the variance, using the equations 7, 8, 9, 10 (Table 2). Table 2 reports a summary statistics of the analyzed data and the parameters of the prior distribution, Pb( ).
Table 2. Summary Statistics of Data and Parameters of the Beta Prior Distribution
Variable max min Mean St.dev
Inhabitants 2,722,907 51,155 196,937 343,895
PTW Total crashes 3,0967 81 1,717.8 4,179.3
PTW Fatal crashes 193 0 11.7 24.4
E( )b Mean mb Median
Prior Distribution 11.243 1,271.75 0.88% 0.85%
The parameters of the prior distribution were updated to define, for each town under investigation, the Beta
posterior distributions using equations 12 and 13. From the posterior distribution Mean E( ), Median ( m),
897 Salvatore Cafi so et al. / Procedia - Social and Behavioral Sciences 53 ( 2012 ) 891 – 900
Probability P1 and P2 can be defined for each site. To rank different towns respect to the probability that a crash involving a PTW results in a fatal consequence
(driver/ passenger), both P1 and P2 values can be used. Specifically, in this study: - P1 represents the probability that in the correspondent town the proportion of PTW crash involving the
driver/ passenger fatality is greater than the median value of the reference population composed by all the towns. - P2 represents the probability that in the correspondent town the proportion of PTW crash involving the
driver/passenger fatality is greater than in any other town. The rank can be carried out by sorting towns according to their associated values of P1 and P2.
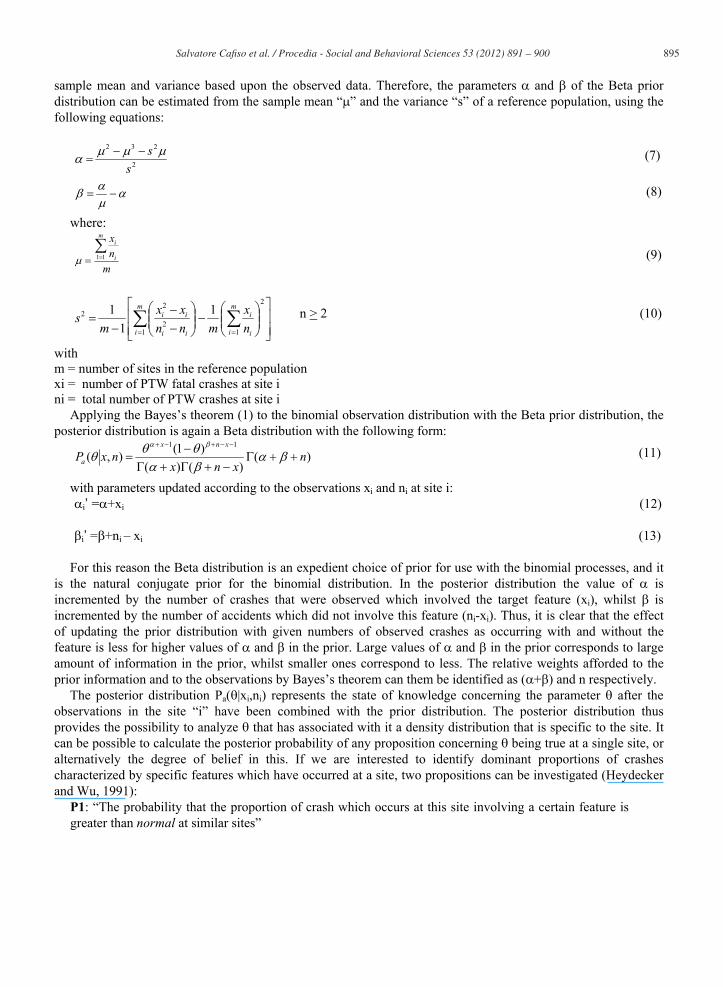
Figure 2 and Figure 3 report towns ranked respect to values of P1 and P2 greater than 0.50 for PTW’s fatality proportions.
Fig. 2. P1 values (greater than 0.50) ranking for PTW’s fatality proportions
The outcomes show towns with the P1 probability of a proportion of fatal PTW crashes higher than the median Italian value and a P2 probability of a proportion higher than any other Italian town. It is interesting to highlight that even if there is not a perfect correspondence between results provided by the criteria of P1 and P2, at the top of the list cities of Catania, Palermo, Alessandria, Napoli, Salerno, Cagliari, Torino show both values of P1 higher than 0.8 and P2 higher than 0.7. Although, the use of the Bayes proportion method is theoretically justified its application is not immediate for practical applications. Therefore, the choice to adopt the proposed method rather than a simple calculation based only on observed proportions has to be verified especially when a large database is available as in the present study. To test the effectiveness of the procedure respect to a naïve approach based only on observed proportions, a comparison among the rankings of the top 20 towns obtained by the performance measures carried out using the Bayes method (P1 e P2, m and E ( )) and by the naïve sample mean ( ) was performed. Since, different performance measures (P1, P2, E( ), m) have been presented, it is useful to make some considerations about what measure can be selected for ranking. The reference to the median ( m) has to be preferred to the mean value (E ( )) considering the skewness of the Gamma distribution. As showed in the following paragraph, potential benefits for a site are evaluated as the difference between the true proportion, m, and the threshold proportion, m from the prior distribution. From this point of view, the probability P1 can be considered a more coherent performance measure than P2. P1 and P2 have to be preferred to E( ) and m, because both take into account not only the expected value but also the uncertainty in the estimation measured by the variance s. In the following P1 will be assumed as reference ranking parameter to compare results obtained using two different approaches. Since the main target of the procedure is to define a reliable method to sort towns by PTW crashes severity, Spearman’s rank correlation can be used to determine the level of agreement between the rankings obtained using two different techniques.
898 Salvatore Cafi so et al. / Procedia - Social and Behavioral Sciences 53 ( 2012 ) 891 – 900
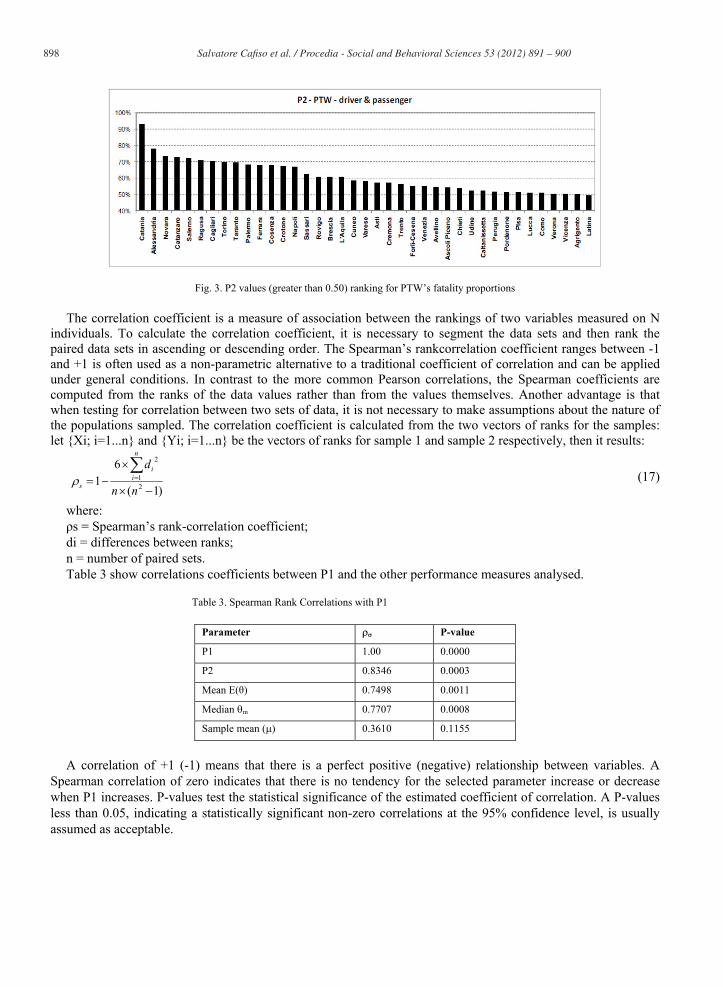
Fig. 3. P2 values (greater than 0.50) ranking for PTW’s fatality proportions
The correlation coefficient is a measure of association between the rankings of two variables measured on N individuals. To calculate the correlation coefficient, it is necessary to segment the data sets and then rank the paired data sets in ascending or descending order. The Spearman’s rankcorrelation coefficient ranges between -1 and +1 is often used as a non-parametric alternative to a traditional coefficient of correlation and can be applied under general conditions. In contrast to the more common Pearson correlations, the Spearman coefficients are computed from the ranks of the data values rather than from the values themselves. Another advantage is that when testing for correlation between two sets of data, it is not necessary to make assumptions about the nature of the populations sampled. The correlation coefficient is calculated from the two vectors of ranks for the samples: let {Xi; i=1...n} and {Yi; i=1...n} be the vectors of ranks for sample 1 and sample 2 respectively, then it results:
)1(
61 2
1
2
nn
dn
ii
s (17)
where: s = Spearman’s rank-correlation coefficient;
di = differences between ranks; n = number of paired sets. Table 3 show correlations coefficients between P1 and the other performance measures analysed.
Table 3. Spearman Rank Correlations with P1
Parameter P-value
P1 1.00 0.0000
P2 0.8346 0.0003
Mean E( ) 0.7498 0.0011
Median m 0.7707 0.0008
Sample mean ( 0.3610 0.1155
A correlation of +1 (-1) means that there is a perfect positive (negative) relationship between variables. A
Spearman correlation of zero indicates that there is no tendency for the selected parameter increase or decrease when P1 increases. P-values test the statistical significance of the estimated coefficient of correlation. A P-values less than 0.05, indicating a statistically significant non-zero correlations at the 95% confidence level, is usually assumed as acceptable.
899 Salvatore Cafi so et al. / Procedia - Social and Behavioral Sciences 53 ( 2012 ) 891 – 900
3.1. Correlation between Crash Severity and Helmet Use
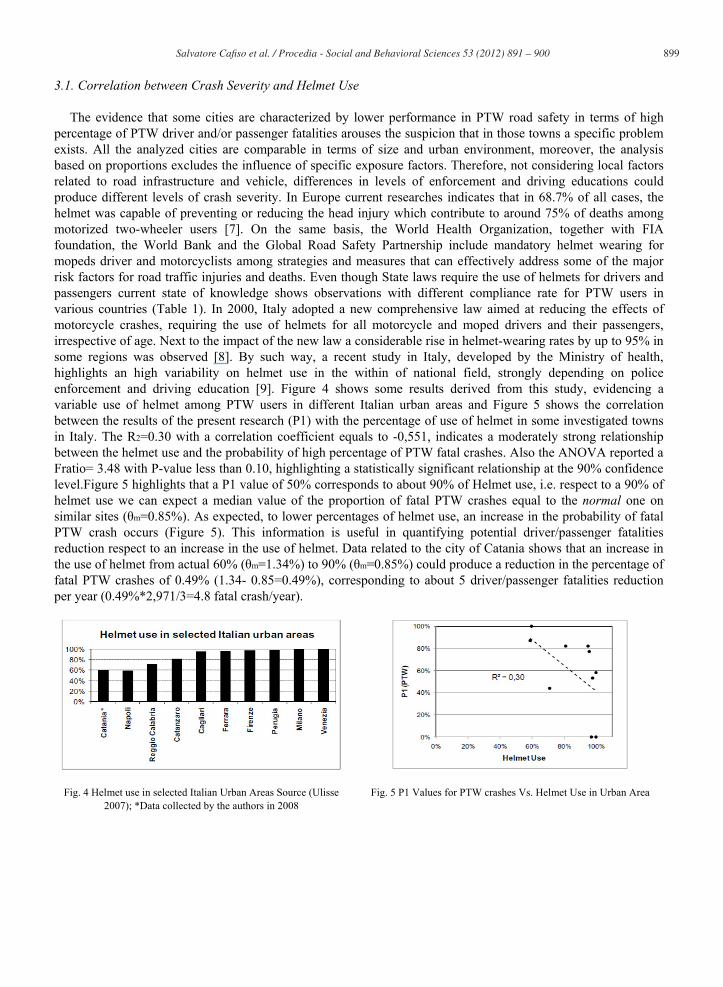
The evidence that some cities are characterized by lower performance in PTW road safety in terms of high percentage of PTW driver and/or passenger fatalities arouses the suspicion that in those towns a specific problem exists. All the analyzed cities are comparable in terms of size and urban environment, moreover, the analysis based on proportions excludes the influence of specific exposure factors. Therefore, not considering local factors related to road infrastructure and vehicle, differences in levels of enforcement and driving educations could produce different levels of crash severity. In Europe current researches indicates that in 68.7% of all cases, the helmet was capable of preventing or reducing the head injury which contribute to around 75% of deaths among motorized two-wheeler users [7]. On the same basis, the World Health Organization, together with FIA foundation, the World Bank and the Global Road Safety Partnership include mandatory helmet wearing for mopeds driver and motorcyclists among strategies and measures that can effectively address some of the major risk factors for road traffic injuries and deaths. Even though State laws require the use of helmets for drivers and passengers current state of knowledge shows observations with different compliance rate for PTW users in various countries (Table 1). In 2000, Italy adopted a new comprehensive law aimed at reducing the effects of motorcycle crashes, requiring the use of helmets for all motorcycle and moped drivers and their passengers, irrespective of age. Next to the impact of the new law a considerable rise in helmet-wearing rates by up to 95% in some regions was observed [8]. By such way, a recent study in Italy, developed by the Ministry of health, highlights an high variability on helmet use in the within of national field, strongly depending on police enforcement and driving education [9]. Figure 4 shows some results derived from this study, evidencing a variable use of helmet among PTW users in different Italian urban areas and Figure 5 shows the correlation between the results of the present research (P1) with the percentage of use of helmet in some investigated towns in Italy. The R2=0.30 with a correlation coefficient equals to -0,551, indicates a moderately strong relationship between the helmet use and the probability of high percentage of PTW fatal crashes. Also the ANOVA reported a Fratio= 3.48 with P-value less than 0.10, highlighting a statistically significant relationship at the 90% confidence level.Figure 5 highlights that a P1 value of 50% corresponds to about 90% of Helmet use, i.e. respect to a 90% of helmet use we can expect a median value of the proportion of fatal PTW crashes equal to the normal one on similar sites ( m=0.85%). As expected, to lower percentages of helmet use, an increase in the probability of fatal PTW crash occurs (Figure 5). This information is useful in quantifying potential driver/passenger fatalities reduction respect to an increase in the use of helmet. Data related to the city of Catania shows that an increase in the use of helmet from actual 60% ( m=1.34%) to 90% ( m=0.85%) could produce a reduction in the percentage of fatal PTW crashes of 0.49% (1.34- 0.85=0.49%), corresponding to about 5 driver/passenger fatalities reduction per year (0.49%*2,971/3=4.8 fatal crash/year).
Fig. 4 Helmet use in selected Italian Urban Areas Source (Ulisse 2007); *Data collected by the authors in 2008
Fig. 5 P1 Values for PTW crashes Vs. Helmet Use in Urban Area

900 Salvatore Cafi so et al. / Procedia - Social and Behavioral Sciences 53 ( 2012 ) 891 – 900
4. CONCLUSIONS
Nowadays, the worrying numbers in PTWs safety are the result of substantial increase in the mean of transport use, as they have become more popular especially in major cities and towns to beat congestion and parking problems. Worldwide comparison among high-income countries of the percentages of PTWs fatalities demonstrates that Italy with about 1,500 fatalities/year is a leader country accounting for 30% of deaths on the total road losses. in this paper a Bayesian approach is used to analyze the proportion of PTW fatalities with respect to the total of crashes involving a PTW in different urban areas in Italy. Among different performance measures, the computation of the strength of belief in a continuous scale 0 – 1 that a site is unusual with respect to the others (P1), was used to rank the relevance of the site with respect to the condition of occurrence of a fatality in a PTW crash. Results carried out from Spearman Rank correlations show that the comparative analysis using proportions method is effective in ranking cities, identifying those with unusual proportion of fatal PTW crashes. The use of different performance measures carried out from the proportions method doesn’t produce significant differences in the ranking order. Instead, low correlation agreement was highlighted with the naive computation of the sample mean proportion. This confirms the opportunity to use a more refined and complex Bayes proportion method especially when low percentage values have to be compared as in the present study. Moreover, the comparison between the rank produced by the proportion analysis for PTW fatalities and the helmet use in Italy, underlines a valuable relationship between these two factors, helpful in quantifying driver/passenger fatalities potential reduction respect to an increase in the use of helmet. The low level of attention of local authorities and citizen to the use of helmet as protective measure for PTW users in urban areas can be roused reporting quantitative results as those shown in this study. In these cities, specific plans on enforcement strategies related to helmet wearing for PTW users combined with adequate public education/information campaigns, could be helpful in preventing road deaths for PTW drivers and passengers whose benefits can be previously estimated.
References
[1] International Traffic Safety Data and Analysis Group. IRTAD (2010) “Road Safety 2010” Annual Report. OECD ITF http://www.internationaltransportforum.org/irtad/pdf/10IrtadReport.pdf (Accessed March 23, 2012) [2] Cafiso, S., La Cava, G., Pappalardo, G. (2012). “A logistic model for Powered Two-Wheelers crash in Italy”, accepted at 5th SIIV International Congress, Rome, Italy, 29-31 October 2012. [3] Heydecker, B.J., Wu, J. (1991). ”Using the Information in Road Accident Record”. Proceedings of the 19th PTRC Summer Annual Meeting, London, United Kingdom. [4] Lyon, C., Gotts, B., Wong, W., and Persaud, B.(2007). “Comparison of alternate methods for identifying sites with a high propensity for specific accident type”. Transportation Research Record: Journal of the Transportation Research Board. No. 2019, pp. 212 – 218. [5] Hauer E.(1986). “On the estimation of the expected number of accidents”. Accident Analysis & Prevention 18(1), pp. 1-12 [6] ISTAT “Statistics of Road Accidents”. Rome. Italy. [7]MAIDS (2010) “In-depth investigations of accidents involving Powered Two Wheelers 2010”. Final Reoprt 2.0. European Commission, Brussels. Belgium. [8] Lyon, C., Servadei F., Begliomini C., Gardini E., Giustini M., Taggi F., Kraus J. (2003). “Effect of Italy’s motorcycle helmet law on traumatic brain injuries.” Injury Prevention, 9, pp.257–260. www.etsc.eu/documents/ETSC_Vulnerable_riders.pdf (Accessed March 23, 2012) [9] Italian Ministry of Transport.(2009) “Ulisse System. National Monitoring on safety tools use”. (Italian Language) Institute of Health - Rome. Italy. http://www.iss.it/pres/prim/cont.php?id=1241&tipo=6&lang=1(Aaccessed April 4 2012)
Related Documents


![Case Information · Affects a location with a high crash history [Severity Index ≥ 8.4 or a fatal crash within the past three years] Takes place at a highly congested](https://static.cupdf.com/doc/110x72/5f0a05d37e708231d429a3a1/case-information-affects-a-location-with-a-high-crash-history-severity-index-a.jpg)


