
Welcome message from author
This document is posted to help you gain knowledge. Please leave a comment to let me know what you think about it! Share it to your friends and learn new things together.
Transcript


A Comparative Analysis ofEcological Risks from Pesticides
and Their Uses: Background,Methodology & Case Study
Environmental Fate & Effects Division
Office of Pesticide Programs
U. S. Environmental Protection Agency
Washington, D.C.
November, 1998
PROJECT TEAM
Environmental Fate and Effects Division
Douglas Urban, primary authorTom Steeger Ed Odenkirchen
CONTENTS
Page
I. INTRODUCTION
A. Purpose
B. Background
C. Scope & Method
D. Approach - Case Study Using Selected Insecticides & Use Sites
II. AVIAN EFFECTS AND EXPOSURE ASSESSMENT
A. Effects
1. Acute Toxicity to Birds
2. Chronic Toxicity to Birds
B. Exposure
1. Acute Exposure via Dose (mg a.i./ ft2 available)
2. Acute Exposure via Diet (ppm available in diet)
3. Chronic Exposure via Diet (ppm available in diet)
III. AVIAN RISK QUOTIENTS AND LEVELS OF CONCERN
A. Calculation of the Acute Avian Risk Quotients
1. Avian Acute Dose Risk via Ingestion - Granular Formulations
2. Avian Dietary Risk - Spray Formulations
3. Avian Acute Bird per Day Risk - Spray Formulations
B. Calculation of the Chronic Avian Risk Quotients
1. Avian Chronic risk - Spray Formulations
2. Number of Days to reach Avian Chronic LOC (RQ=1) - SprayFormulations
C. The Avian Risk Column - % Pesticide Contribution to RQ Sum for Each Endpoint on Each Site (Crop)
D. Frequency of LOC Exceedance
IV. AQUATIC EFFECTS AND EXPOSURE CHARACTERIZATION
A. Effects
1. Acute Toxicity to Freshwater Fish
2. Acute Toxicity to Marine/Estuarine Fish
3. Acute Toxicity to Freshwater Invertebrates
4. Acute Toxicity to Marine/Estuarine Crustaceans
5. Acute Toxicity to Marine/Estuarine Molluscs
6. Chronic Toxicity to Freshwater Fish
7. Chronic Toxicity to Freshwater Invertebrates
B. Exposure
1. Acute and Chronic Exposure Using GENEEC Model
V. AQUATIC RISK QUOTIENTS AND LEVELS OF CONCERN
A. Calculation of the Acute Fish & Aquatic Invertebrate Risk Quotients
1. Acute Freshwater Fish Risk
2. Acute Marine/Estuarine Fish Risk
3. Acute Freshwater Invertebrate Risk
4. Acute Marine/Estuarine Crustacean Risk
5. Acute Marine/Estuarine Mollusc Risk
B. Calculation of the Chronic Fish & Aquatic Invertebrate Risk Quotients
1. Chronic Freshwater Fish Risk
2. Chronic Freshwater Invertebrate Risk
C. The Aquatic Risk Column - % Pesticide Contribution to RQ Sum for Each Endpoint on Each Site (Crop)
D. Frequency of LOC Exceedance
VI. COMPARATIVE ECOLOGICAL RISK ANALYSIS
A. Calculation of Potential Risk (% of Risk)
B. Percentage (%) Acres Treated
C. Incident Reports - Bird and Fish Kills
D. Comparison of Potential Risk by Crop Site
1. Alfalfa - Spray Formulations Only
2. Corn - Granular and Spray Formulations
3. Cotton - Granular and Spray Formulations
4. Peanuts - Granular and Spray Formulations
5. Overall Summary
VII. DECISION SUPPORT ANALYSIS TO AID DECISION-MAKING

A. Decision Support Software
B. Baseline Scenario - Alfalfa
C. Ecological Risk Characterization Information
D. Scenario #1 - Baseline Plus Ecological Risk Characterization Information
E. Additional Scenarios - Changes in Criteria Importance
VIII. LIMITATIONS OF THIS ANALYSIS
IX. REFERENCES
TABLES
Table 1 - Chemicals & Uses for Comparative Ecological Risk Analysis (17Chemicals & Uses)
Table 2 - Linear Regression Parameter EstimatesTable 3 - Environmental Fate ParametersTable 4 - GENEEC Model Report FormatTable 5 - Data for Figure 3Table 6 - Data for Figure 4Table 7 - Data for Figure 5Table 8 - Data for Figure 6Table 9 - Data fro Figure 7Table 10 - Data for Figure 8Table 11 - Data for Figure 9Table 12 - Data for Scenario #1
FIGURES
Figure 1 - Avian Risk, Acute Bird per Day Risk on AlfalfaFigure 2 - Aquatic Risk, Acute Freshwater Fish Risk on AlfalfaFigure 3 - Combined Charts - Comparative Risk for Pesticides Used on Alfalfa as
PostEmergent SpraysFigure 3a - Comparative Avian Risk for Pesticides Used on Alfalfa as PostEmergent
SpraysFigure 3b - Comparative Aquatic Risk for Pesticides Used on Alfalfa as PostEmergent
SpraysFigure 3c - Incident Reports for Pesticides Used on Alfalfa Figure 4 - Combined Charts - Comparative Risk for Pesticides Used on Corn as
Granular At-PlantFigure 4a - Comparative Avian Risk for Pesticides Used on Corn as Granular At-PlantFigure 4b - Comparative Aquatic Risk for Pesticides Used on Corn as Granular At-
PlantFigure 4c - Incident Reports for Pesticides Used on CornFigure 5 - Combined Charts - Comparative Risk for Pesticides Used on Corn as
PostEmergent SpraysFigure 5a - Comparative Avian Risk for Pesticides Used on Corn as PostEmergent
SpraysFigure 5b - Comparative Aquatic Risk for Pesticides Used on Corn as PostEmergent
SpraysFigure 6 - Combined Charts - Comparative Risk for Pesticides Used on Cotton as
Granular At-PlantFigure 6a - Comparative Avian Risk for Pesticides Used on Cotton as Granular At-
PlantFigure 6b - Comparative Aquatic Risk for Pesticides Used on Cotton as Granular At-
Plant
Figure 7 - Combined Charts - Comparative Risk for Pesticides Used on Cotton as PostEmergent Sprays
Figure 7a - Comparative Risk for Pesticides Used on Cotton as PostEmergentSprays
Figure 7b - Comparative Risk for Pesticides Used on Cotton as PostEmergentSprays
Figure 7c - Incident Reports for Pesticides Used on CottonFigure 8 - Combined Charts - Comparative Risk for Pesticides Used on Peanuts as
Granular At-PlantFigure 8a - Comparative Avian Risk for Pesticides Used on Peanuts as Granular At-
PlantFigure 8b - Comparative Aquatic Risk for Pesticides Used on Peanuts as Granular At-
PlantFigure 9 - Combined Charts - Comparative Risk for Pesticides Used on Peanuts as
PostEmergent SpraysFigure 9a - Comparative Avian Risk for Pesticides Used on Peanuts as
PostEmergent SpraysFigure 9b - Comparative Aquatic Risk for Pesticides Used on Peanuts as
PostEmergent SpraysFigure 10 - Baseline: Decision Table for Which of the Insecticides Used on Alfalfa are
Less RiskyFigure 11 - The Relative Strengths fo the 10 Choices Considering the 11 Risk
EndpointsFigure 12 - Baseline: Decision Table for Which of the Insecticides Used on Alfalfa are
Less Risky Figure 13 - Summary of Scenarios
APPENDICES
Appendix 1 - Pesticide Usage InformationAppendix 2 - Pesticide Label InformationAppendix 3 - Acute Oral Toxicity of Insecticides to BirdsAppendix 4 - Dietary Toxicity of Insecticides to BirdsAppendix 5 - Chronic Toxicity of Insecticides to BirdsAppendix 6 - Estimated Environmental Concentrations (mg a.i./sq ft available to birds)Appendix 7 - Estimated Environmental Concentrations (ppm in avian diets))Appendix 8 - Input for Avian Chronic Time to RQ=1Appendix 9 - Avian Acute Risk (LD50s/ft
2)Appendix 9a -% Pesticide Contribution to RQ Sum for Avian Acute Risk Appendix 9b -Frequency of Exceeding the LOC for Avian Acute Dose RiskAppendix 10 -Avian Dietary Risk (EEC/LC50)Appendix 10a -% Pesticide Contribution to RQ Sum for Avian Dietary RiskAppendix 10b -Frequency of Exceeding the LOC for Avian Dietary RiskAppendix 11 - Avian Acute Bird per Day Risk ((EEC x %Food Ingestion/day)/LD50)
Appendix 11a -% Pesticide Contribution to RQ Sum for Avian Acute Bird per Day Risk
Appendix 11b -Frequency of Exceeding the LOC for Avian Acute Bird per Day RiskAppendix 12 - Avian Chronic Risk (EEC/NOAEC)Appendix 12a -% Pesticide Contribution to RQ Sum for Avian Chronic RiskAppendix 12b -Frequency of Exceeding the LOC for Avian Chronic RiskAppendix 13 - Avian Chronic Risk (Time to RQ=1)Appendix 13a -% Pesticide Contribution to Sum of Days to Time to RQ=1Appendix 14 - Acute Toxicity of Insecticides to Freshwater FishAppendix 15 - Acute Toxicity of Insecticides to Marine/Estuarine FishAppendix 16 - Acute Toxicity of Insecticides to Freshwater InvertebratesAppendix 17 - Acute Toxicity of Insecticides to Marine/Estuarine CrustaceansAppendix 18 - Acute Toxicity of Insecticides to Marine/Estuarine MolluscsAppendix 19 - Chronic Toxicity of Insecticides to Freshwater FishAppendix 20 - Chronic Toxicity of Insecticides to Freshwater InvertebratesAppendix 21 - GENEEC Model Run ResultsAppendix 22 - Freshwater Fish Acute RiskAppendix 22a -% Pesticide Contribution to RQ Sum for Freshwater Fish Acute RiskAppendix 22b -Frequency of Exceeding the LOC for Freshwater Fish Acute RiskAppendix 23 - Marine/Estuarine Fish Acute RiskAppendix 23a - % Pesticide Contribution to RQ Sum for Marine/Estuarine Fish AcuteRiskAppendix 23b - Frequency of Exceeding the LOC for Marine/Estuarine Fish Acute RiskAppendix 24 - Freshwater Invertebrate Acute RiskAppendix 24a - % Pesticide Contribution to RQ Sum for Freshwater Invertebrate AcuteRiskAppendix 24b - Frequency of Exceeding the LOC for Freshwater Invertebrate AcuteRiskAppendix 25 - Marine/Estuarine Crustacean Acute RiskAppendix 25a - % Pesticide Contribution to RQ Sum for Marine/Estuarine CrustaceanAcute RiskAppendix 25b - Frequency of Exceeding the LOC for Marine/Estuarine CrustaceanAcute RiskAppendix 26 - Marine/Estuarine Mollusc Acute RiskAppendix 26a - % Pesticide Contribution to RQ Sum for Marine/Estuarine MolluscAcute RiskAppendix 26b - Frequency of Exceeding the LOC for Marine/Estuarine Mollusc AcuteRiskAppendix 27 - Freshwater Fish Chronic RiskAppendix 27a - % Pesticide Contribution to RQ Sum for Freshwater Fish Chronic RiskAppendix 27b - Frequency of Exceeding the LOC for Freshwater Fish Chronic RiskAppendix 28 - Freshwater Invertebrate Chronic RiskAppendix 28a - % Pesticide Contribution to RQ Sum for Freshwater Invertebrate Chronic RiskAppendix 28b - Frequency of Exceeding the LOC for Freshwater Invertebrate ChronicRiskAppendix 29 - Total Number of Bird and Fish Incidents Reported for 17 Insecticides on
All SitesAppendix 30 - Bird and Fish Incidents Reported for 17 Insecticides on Four CropsAppendix 31 - EFED FATE Program
1
1A risk quotient is the ratio of the estimated environmental concentration of a chemical to a toxicitytest effect level for a given species. It is calculated by dividing an appropriate exposure estimate (e.g. EEC)by an appropriate toxicity test effect level (e.g. LC50).
2Levels of Concern (LOC's) are criteria used to indicate potential risk to non-target organisms andthe need to consider regulatory action. The criteria indicate that a pesticide, when used as directed, has thepotential to cause adverse effects on non-target organisms. Since the issuance of a 1992 policy by OPPTS[1 and 2], OPP has generally pursued ecological risk mitigation whenever these levels of concern areexceeded.
I. INTRODUCTION
A. Purpose
This document describes a proposed approach and methodology, which is underdevelopment, for comparing the ecological risk of pesticides and their uses in theEnvironmental Protection Agency's (EPA or the Agency) Office of Pesticide Programs(OPP). Risk assessors are often asked to compare the ecological risks posed bydifferent pesticides registered (or being considered for registration) for use on aspecific crop. Comparative analyses can help to ensure consistency in riskmanagement decisions and to focus more significant ecologically-based riskmanagement decisions on those pesticides that pose the greatest risk to fish andwildlife. Therefore, OPP seeks to define standard methods for comparative ecologicalrisk assessment that are scientifically sound and capable of being implemented usingcurrently available data and resources. We would expect to update or replace thesemethods as additional data and probabilistic assessment tools become available.
Methods will be presented for comparing the potential ecological risk ofpesticides used on similar crop sites. Risk indices or risk quotients (RQs)1 arecalculated and the results are compared to established levels of concern (LOCs)2. Inaddition, since numerous RQ calculations are made using a range of use rates andecotoxicity values, pesticides and their use sites are compared based on frequency (%)of LOC exceedances. The resultant exceedances and frequencies are used to rankpesticides used on the similar use sites according to risk. The comparisons includeacute and chronic endpoints for terrestrial and aquatic organisms, as well as incidentreports and information on extent of use. Pesticide specific ecotoxicology data andenvironmental fate and transport data are used in the analysis. Screening models such
2
3GENEEC is a PC - based computer program which is designed to allow the user to quickly calculatea set of generic (non-site specific) estimated environmental concentrations (EEC's) given limitedenvironmental fate data and pesticide label information [21].
4FATE model is PC - based computer program designed to allow the user to quickly calculateconservative, non-site specific, exposure values for avian and mammalian risk assessments [Appendix 31].
5PRZM/EXAMS is a combination of a runoff model (PRZM2, Pesticide Root Zone Model) [26 and27] and a surface water receiving model (EXAMS, EXposure Analysis Modeling System) [28] designed toprovide a distribution of EEC values, in time and space, for the crop area in which the pesticide has beenapplied.
as GENEEC3 and FATE4 are used here to estimate pesticide exposure, but results frommore sophisticated models such as PRZM/EXAMS5 also could be used.
B. Background
Risk managers in EPA’s Office of Pesticide Programs have had a longstandingdesire to better understand the relative ecological risk posed by pesticides so that thisinformation can be factored into decisions regarding priorities for risk management anddecisions regarding degrees of needed risk mitigation. With the passage of FQPA andits mandate for EPA to conduct cumulative human health risk assessments forpesticides with common mechanisms of toxicity, risk managers are even moreinterested in understanding which pesticides pose the greater or lesser ecological risk. Simply stated, risk managers understand that the purposeful release of biologicalpoisons into the environment will result in impacts to exposed non-target aquatic andterrestrial species; what risk managers most desire is to focus the more significantecological risk mitigation actions on those pesticides and pesticide use patterns whichresult in the greatest threat to non-target species. Although EFED is undertaking amajor multi-year effort to improve its risk assessment methods (an effort which will likelylead to the use of probabilistic risk assessment methods and the collection of somedifferent data than has been historically required for registration and reregistration), amajor challenge for scientists in EFED today is to effectively use the data which arecurrently and typically provided to support registration and reregistration and currentrisk assessment methods in order to provide risk managers with an accurate sense ofrelative risk.
For a typical food-use pesticide, EPA requires and generally has available thefollowing ecotoxicological data:
1. Mammalian Acute Toxicity (Rat LD50)2. Avian Acute Toxicity (one species - Oral LD50; two species -
Dietary LC50's)3. Avian Chronic Toxicity (two species, avian reproduction - NOAEC)
3
4. Honey Bee Contact or Residue Toxicity5. Terrestrial Plant Toxicity (vegetative vigor & seedling emergence -
10 species - EC50's )6. Fish Acute Toxicity (two species, coldwater & warmwater - LC50's)7. Fish Chronic Toxicity (one species - NOAEC)8. Aquatic Invertebrate Acute Toxicity (one species - EC50) 9. Aquatic Invertebrate Chronic Toxicity (one species - NOAEC)10. Estuarine/Marine Acute Toxicity (three species, fish, shrimp,
crustacean, mollusc - EC50's)11. Aquatic Plant Toxicity ( 5 species - EC50's)
For a typical food-use pesticide, EPA requires and generally has available thefollowing exposure/fate and transport data:
1. Solubility in water2. Volatility (vapor pressure)3. Octanol/Water Partition Coefficient (as Log Kow)4. Hydrolysis at pH 5 , 7, and 9; (when applicable, dissociation
constant) 5. Photolysis in water (half-life)6. Photolysis on soil (half-life)7. Aerobic/Anaerobic soil metabolism (half-life) (includes information
on soil type)8. Aerobic/Anaerobic aquatic metabolism (half-life)9. Mobility in soil data for parent & major degradates (includes
information on soil type)10. Field dissipation studies, according to use pattern (includes brief
description of study sites)11. Soil Adsorption/desorption with Kd and Koc sorption coefficients,
values (range & median) for parent and environmental degradates12. Bioaccumulation in fish
Field studies for investigating terrestrial and/or aquatic effects are not requiredfor all pesticides, but only those whose labeled use raised concern for high risk. Suchpesticides usually have high risk quotients for acute or chronic effects to birds, fish oraquatic invertebrates. In addition, some other information characterizing the risk isoften available such as kill incident reports, data on environmental persistence, multipleapplications, or a pattern of widespread use.
This is not the first attempt by EPA’s Office of Pesticide Programs (OPP) todevelop an approach for comparing the ecological risks posed by different pesticides ina regulatory context. In March, 1992, EPA’s Office of Pesticide Programs published a
4
6EFED technical staff of 78 scientists has responsibility for conducting ecological risk assessmentsand water resource assessments for over 400 registered pesticide active ingredients and 10 to 20 new activeingredients (per year).
document titled "Comparative Analysis of Acute Avian Risk from GranularPesticides"[3]. It described OPP’s approach for screening granular formulationpesticides to identify those that may pose acute lethal risk to birds. That documentfocused on granular pesticides because of the particular acute risk they pose to birds. The analysis was based on the calculation of an acute risk quotient and a weight-of-evidence approach to characterize the ecological risk, considering confirmatory fieldstudies and bird kill incident reports. The analysis found that 14 granular pesticidespose potentially high risk to birds due to their high acute toxicity and availability in theenvironment. The report was released to the public and the regulated community.
Based on written technical comments provided by the registrants, the Agencydeveloped a series of generic risk assessment issues that could benefit from furtherresearch [4]. Such issues as the effect of granular substrate, avian preference, theefficiency of various incorporation methods, the effect of watering in granules, andinsecticide/fertilizer mixes on risk of granular pesticides to birds were identified. Theregistrants have already submitted data that have been useful in refining Agency riskassessment for granular pesticides.
Given the limitations of the data generally available to EPA and the limitations ofavailable EPA resources, EFED recognizes it is necessarily limited in its ability to userelative risk methods to make “fine” distinctions between the ecological risk posed byparticular pesticides. That is, given the nature of the available data and the amount oftime and effort that can be routinely dedicated to completing ecological riskassessments6, OPP cannot expect to rank all active ingredients with precision. However, EFED does believe that it is possible to use available data and current riskassessment methods to identify those pesticides and pesticide uses which posesignificantly less ecological risk than others, so that EFED can answer the very realquestions that risk managers ask every day. EFED believes that the proposed risk-based methodology for comparing pesticides may provide us with an appropriate tool todistinguish between pesticides that are greatly different from one another.
The document provides two basic approaches to aid decision-making: the first isa graphical presentation consisting of a series of bar charts comparing pesticidesbased on risk functions; the second is a tabular presentation with a summarizedranking of the same pesticides based on decision analysis of the risk functions. Ideally,both would be used concurrently and would complement one another.
A series of questions are being posed to the SAP based on the two approaches.Where the panel may conclude that an approach or method is inappropriate, the
5
Agency is very interested in suggestions for alternative approaches and/or methodsthat can be adopted within the constraints of available data and available resources. .
First, the fundamental question:
Based on the typical sets of studies, data, and information provided for pesticiderisk assessment purposes in the regulatory context and the use of OPP’s currentrisk assessment methods, is this approach useful/meaningful for evaluating therelative potential risk of pesticides and pesticide uses, especially forascertaining large distinctions between the risk posed by pesticides?
Second, concerning the graphical presentation:
Is this approach useful/meaningful for comparing the relative potential risk ofpesticides and pesticide uses?
In the previous comparative analysis of granular insecticides the Agencycompared the pesticides based on calculated risk quotients. In this analysis, theAgency sought to incorporate more of the available information into thecomparison. Thus, there are a number of new calculations for expressingpotential risk, such as the % contribution to the RQ sum, the frequency of RQexceedance, the % contribution to the Time to RQ=1 sum, and % risk. Are theseuseful parameters for comparing the potential risk of pesticides?
The graphs are presented in order of decreasing percent of acres treated.Otherwise, the extent of use is not factored into the risk calculations. Is thisappropriate?
The use of granular formulations is likely to present chronic risk to birds;however, OPP currently has no method to calculate this risk. Therefore theproposed approach addresses chronic risk to birds only for sprayableformulations. Does the Panel agree that the avian chronic risk should beincluded for sprayable formulations despite the Agencies inability to include thisrisk element for granular formulations? Should the Agency explore ways to usethe avian chronic risk quotient for sprayable formulations as a surrogate toaddress this risk factor when comparing granular formulations?
Third, concerning the tabular presentation based on decision analysis:
Is this approach useful/meaningful for comparing the relative potential risk ofpesticides and pesticide uses?
One of the simplifications of the methodology used in the decision analysis
6
software is that there are no uncertainties. This is certainly not the case incomparative ecological risk analysis. However, one of the ways the softwarepermits the user to deal with some uncertainty is by running multi-scenarios.This was done for the case study. These runs show how sensitive thedifferences between pesticides are to change in the importance of the criteria.The results can add confidence to overall conclusions. Does the panel agreethat his approach is useful and can increase the confidence of conclusionsderived from the results?
Incidents were treated as important when they exist; however, when there wereno incident reports this element was given zero weight in the analysis. Is this anappropriate use of incident data for this comparative analysis?
C. Scope and Methods
This comparative analysis builds upon the earlier comparative risk document.The Comparative Analysis of Acute Avian Risk from Granular Pesticides was focusedsolely on one kind of formulation (granular) and one endpoint (acute risk to birds). Inorder to present the approach and methods for this more expansive and complexanalysis, we chose to present a case study of 17 insecticide chemicals and four usesites, alfalfa, corn, cotton, and peanuts. In order to maintain the focus of this analysison the methodology and not on individual pesticides, the 17 insecticides weredesignated as Chemical A through Q.
In this new analysis eleven endpoints were selected for comparing both at-plant granular formulations and post-emergent sprays. They include both acute and chronicrisk for birds, fish and aquatic invertebrates. The aquatic endpoints covered exposurein both the freshwater and marine/estuarine environments. In addition, the analysisincorporates the standards of ecological risk assessment and management, the LevelsOf Concern (LOCs), provided in the 1992 Agency policy document [2]. Consequently,risk comparisons can be made in a more equitable fashion for all pesticides included inthis analysis.
EPA calculated risk quotients for acute and chronic risk to birds, fish and aquaticinvertebrates. These risk indices are based upon estimates of pesticide exposure andecotoxicity. In turn, these estimates are based on available pesticide label information,ecotoxicity and environmental fate data, as well as widely accepted models.
The risk quotient methodology described in this analysis has previously beenavailable for both public and scientific review. It has become common in ecological riskassessment to present potential risk in terms of a ratio of the estimated environmentalexposure or EEC, divided by the hazard of toxicity such as the LC50, EC50 or No
7
Observed Adverse Effects Concentration (NOAEC). EPA first presented this risk indexmethod in the Standard Evaluation Procedure for Ecological Risk Assessment in 1986[4]. These ratios are used to express potential acute and chronic risk to birds, fish andaquatic invertebrates.
Ecological risk assessment is an evolving field. EPA sponsors research andworks with industry and other agencies in a continuing effort to refine the Agency'secological risk assessment methodologies. Of particular note is the EcologicalCommittee on FIFRA Risk Assessment Methods (ECOFRAM) which was formed inJune 1997. Its purpose is to develop tools and processes within the FIFRA frameworkfor predicting the magnitude and probabilities of adverse effects to non-target aquaticand terrestrial species resulting from the introduction of pesticides into theirenvironment. ECOFRAM was convened in response to a review of OPP’s ecologicalrisk assessments and guidelines in May of 1996 by the FIFRA Scientific Advisory Panel(SAP). While recognizing and generally affirming the utility of the current assessmentprocess and methods for screening risk assessment purposes, the SAP noted that OPPhas relied on deterministic methods of assessing the ecological effects of pesticidesand strongly encouraged OPP to develop and validate tools and methodologies toconduct probabilistic assessments of ecological risk. This resulted in the formation ofECOFRAM. As tools for probabilistic ecological risk assessments become availableand are implemented in OPP/EFED, this comparative analysis of ecological riskassessments will need to be revised and updated.
As noted previously, the risk quotients in this screening analysis are used toindicate potential ecological risk. They find their greatest utility when used as the basisfor comparing the potential acute and chronic risk to birds, fish and aquaticinvertebrates posed by different pesticides used on the same sites, under similarexposure scenarios. When used with additional information such as reports of bird andfish kill incidents, refined estimates of exposure, common practice mitigatory measures,unique site characteristics, etc. this analyses is useful for identifying those pesticideswhich pose comparatively higher or lower risk. However, it is important to clarify thelimitations of this approach.
This analysis is similar to a predictive model. It is based on data inputs such aslaboratory eco-toxicity data, fate data from laboratory and/or field studies, computergenerated model exposure estimates, and use data from the pesticide labels. Thequality of the results from any model reflect the quality of the input data and theadequacy of the models used to accurately represent the most significant processesaffecting a pesticide’s fate and biological effects in the environment, and thedependence of those behaviors on the selected input parameters. The limitations of theapproaches used here are discussed more fully in Section VIII of this paper.Nevertheless, the Agency believes that the choices of input data and risk calculationsare useful for comparing potential and relative risks among pesticides used as
8
alternatives on the same site.
The current analysis is intended only to compare the potential acute and chronicrisk to birds, fish and aquatic invertebrates posed by these insecticides used on thesefour crop sites. A complete ecological risk assessment of any of these pesticides wouldinclude an evaluation of other information including acute and chronic risk to other non-target organisms such as wild mammals and non-target plants, consideration ofexposure refinements based on site-specific use data, an account of the extent,location and ecological sensitivity of the areas treated and a comprehensiveassessment of available field effects data (terrestrial field studies and mesocosms),including detailed incident reports. These factors were not included as part of thecurrent analysis.
EPA recognizes the potential risk to wild mammals and non-target plants fromthese and other highly toxic pesticides and will address those risks in futurecomparative assessments. Additionally, the results of this analysis could change if theinput data changes. New eco-toxicity or environmental fate data, or updated useinformation will result in changes in the quotients, their LOC exceedance, and therelative comparisons. As such, the results of the analysis and the conclusions drawnare dynamic. The Agency recognizes that as additional information is made available,both the results and conclusions are subject to change.
This analysis is valuable in that it identifies and compares pesticides and usespresenting the relative acute and chronic potential risk to birds, fish and aquaticinvertebrates. The scope of this analysis is considerably expanded over the previousanalysis for granular pesticides. However, it is still incomplete. Despite this, theanalysis presents an interesting approach for comparing ecological risk based onsound data and a well documented methodology.
D. Approach - Case Study Using Selected Insecticides & Use Sites
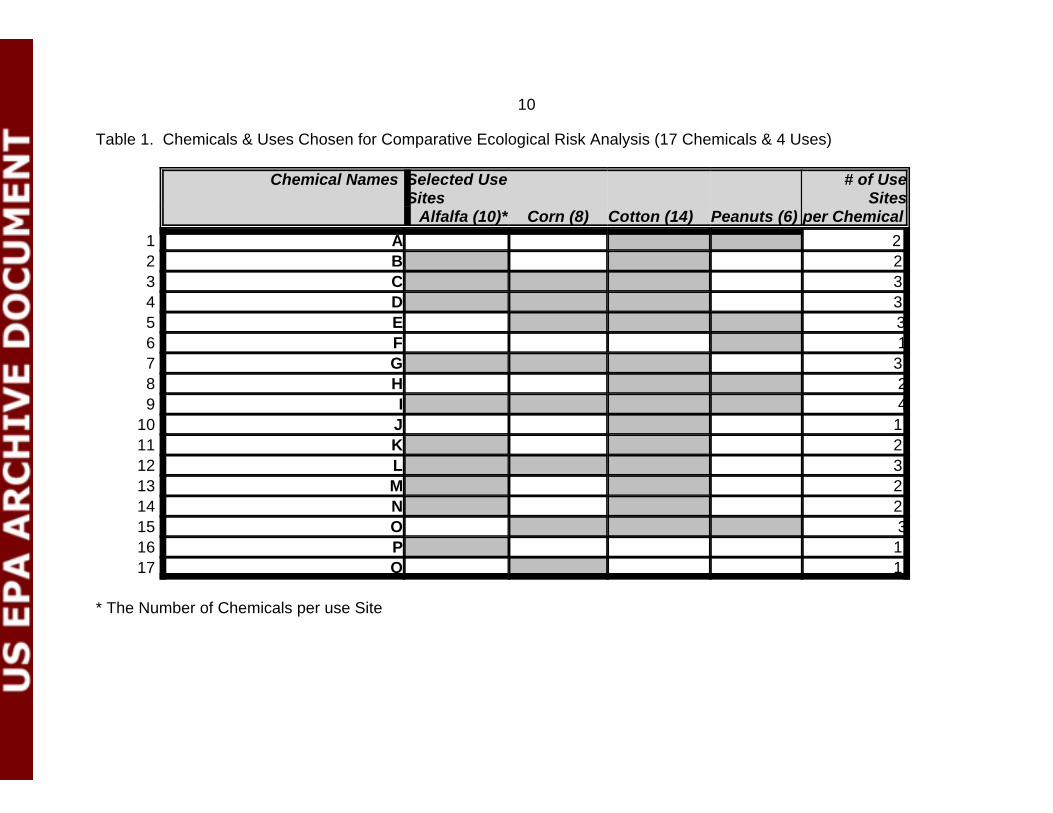
Four major crop sites were selected for analysis - alfalfa, corn, cotton andpeanuts. Current pesticide labels for insecticides commonly used on these sites werereviewed . Based on this review, 17 pesticides were selected and designated asChemical A through Q. For this case study, we will assume that these 17 pesticideswere all of the same chemical class, with similar modes of action. This resulted in atotal of 38 pesticide-use site combinations (See Table 1). Hypothetical usage data wasgenerated and is found in Appendix 1. Appendix 2 lists the information collected fromselected pesticide labels. This included various formulations, timing, types, andmethods for application for each pesticide-use combination.
This case study analysis is not intended to characterize all the risks of the
9
chemicals in the analysis or serve as the sole basis for decision-making. Rather, it isprovided as an illustrative example demonstrating how pesticides used as alternativeson the same site can be compared based on ecological risk and the results used to aiddecision-making.
10
Table 1. Chemicals & Uses Chosen for Comparative Ecological Risk Analysis (17 Chemicals & 4 Uses)
Chemical Names Selected UseSites
# of UseSites
Alfalfa (10)* Corn (8) Cotton (14) Peanuts (6) per Chemical
1 A 2 2 B 2 3 C 3 4 D 3 5 E 36 F 17 G 3 8 H 29 I 4
10 J 1 11 K 2 12 L 3 13 M 2 14 N 2 15 O 316 P 1 17 Q 1
* The Number of Chemicals per use Site
11
7 Median lethal dose necessary to affect (kill) 50% of the test population.
8 Median lethal concentration in the diet necessary to affect (kill) 50% of the test population.
9 The highest concentration tested in the study where no adverse effects were observed.
10 Scientifically sound study which also meets EPA published guideline requirements.
11 Scientifically sound study with some deviations from published EPA guideline requirements.
12 Study has flaws that make it’s results unreliable to use in risk assessment.
13 Additional data (e.g., sample storage stability data) could make a study useable for riskassessment.
II. AVIAN EFFECTS AND EXPOSURE ASSESSMENT
A. Effects
EPA typically receives the following required laboratory studies to use inperforming avian risk assessments: acute bird LD50
7 (mg/kg) and LC508 (ppm) studies,
and chronic bird reproduction studies, providing a NOAEC9 (ppm). The Agencyevaluates the studies and classifies them as either core10, supplemental11 or invalid12,as well as indicating whether the supplemental and invalid studies are upgradable13. The toxicity values from the core and supplemental studies are used in riskassessment.
This analysis used core and supplemental eco-toxicity data in the Eco Tox database [5] to characterize the effects of the selected pesticides on birds. All the data usedin this analysis has been updated and verified. However, some errors in this analysiscould result from entry errors. In addition, the data used in this analysis reflects thestatus of the data base as of July, 1998. It does not include data available after thatdate. More recent data could change the results of this analysis.
Avian LD50 (mg/kg) and LC50 (ppm) values and chronic NOAEC (ppm) values forthe most sensitive species tested (the lowest values) were selected from the data base.In addition, the median LD50 (mg/kg) and LC50 (ppm) values were calculated. Thesemedian values provided a less conservative estimate of the toxicity values (comparedto the lowest) and provided additional values for determining a range of toxicity valuesfor a particular endpoint.
Since relatively few species are used in standard toxicity testing, it is likely thatthe species most sensitive to each pesticide has not been tested. The few species thatare tested often provide a range of toxicity values, reflecting the combined effects ofmeasurement error, variability in sensitivity among individuals within a species, and

12
species-to-species variation in sensitivity to the pesticide being tested. Because of thisvariation in sensitivity, it is unlikely that this analysis will show the worst case risk foreach pesticide considered. Rather, based on the calculated toxicity values, the analysiswill provide a range of risk values for purposes of comparison and identification ofthose pesticides that are more likely to cause adverse effects in actual use.
1. Acute Toxicity to Birds
Based on years of experience in preparing risk assessments, EPA/OPP hasfound that the LD50 value, compared to the LC50 value, is often a better indicator ofacute toxicity to birds [5]. This seems to be true especially for pesticides with LD50
values less than or equal to 50 mg/kg. Alternately, the LC50 value may be a betterindicator of acute toxicity to birds if their LD50 values are greater than 50 mg/kg andthey persist in the environment with a half-life greater than one day. For this analysis,however, both the avian acute oral LD50 value and the avian subacute dietary LC50
value were included and used in the risk calculations.
The avian LD50 value is usually expressed in mg/kg of body weight. However, itis well established that the body weight of a bird is a very important consideration whendetermining how sensitive any individual bird will be to acute pesticidal effects,Therefore, the LD50 value was adjusted by multiplying it by the weight of a bird to arriveat an LD50 per bird value. For this analysis, EPA chose 20 gm to represent small birds(e.g., songbirds); 100 gm to represent medium size birds such as small upland gamebirds (e.g., quail) ; and 1000 gm to represent large upland game birds and waterfowl(e.g., pheasants and geese).
EPA ranked the 17 pesticides in order of their lowest acute oral LD50 toxicityvalues (Appendix 3) and their lowest acute dietary LC50 toxicity values (Appendix 4). The median of the data including data on all bird species tested for each pesticide wasincluded.
2. Chronic Toxicity to Birds
The NOAEC are typical values resulting from the avian reproduction test. Typically, two species, bobwhite quail and mallard ducks, are tested. Commonreproductive effects found in these tests are egg thinning, cracked eggs, reducedhatchability, decreased survival rate, reduced growth of F1 generation and reduced eggproduction.
EPA ranked the 17 pesticides in order of their lowest chronic toxicity, that isNOAECs (Appendix 5). For chemicals lacking data on chronic effects to birds, a value

13
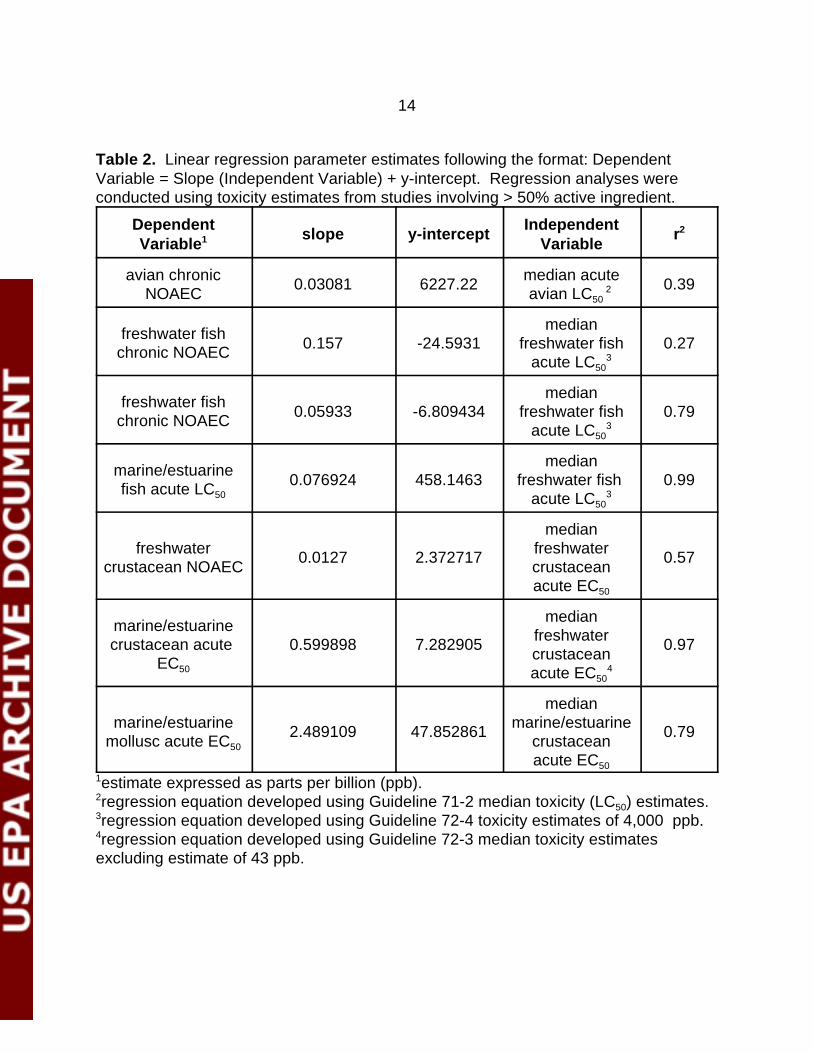
was estimated by applying an acute to chronic ratio value. This was calculated basedon a regression analysis (Table 2) of acute toxicity values over long-term exposureeffect values for the all the pesticides in this class. This regression equation was usedto predict missing values. Although r2-values for the regression suggested that theywere not predictive over the entire range of the regression, the regression coefficientwas significant (P<0.05) and residuals were minimal for acute toxicity values requiringthe regression analysis.
14
Table 2. Linear regression parameter estimates following the format: DependentVariable = Slope (Independent Variable) + y-intercept. Regression analyses wereconducted using toxicity estimates from studies involving > 50% active ingredient.
DependentVariable1 slope y-intercept
IndependentVariable
r2
avian chronicNOAEC
0.03081 6227.22median acuteavian LC50
2 0.39
freshwater fishchronic NOAEC
0.157 -24.5931median
freshwater fishacute LC50
30.27
freshwater fishchronic NOAEC
0.05933 -6.809434median
freshwater fishacute LC50
30.79
marine/estuarinefish acute LC50
0.076924 458.1463median
freshwater fish acute LC50
30.99
freshwatercrustacean NOAEC
0.0127 2.372717
medianfreshwatercrustaceanacute EC50
0.57
marine/estuarinecrustacean acute
EC50
0.599898 7.282905
medianfreshwatercrustaceanacute EC50
4
0.97
marine/estuarinemollusc acute EC50
2.489109 47.852861
medianmarine/estuarine
crustaceanacute EC50
0.79
1estimate expressed as parts per billion (ppb).2regression equation developed using Guideline 71-2 median toxicity (LC50) estimates.3regression equation developed using Guideline 72-4 toxicity estimates of 4,000 ppb.4regression equation developed using Guideline 72-3 median toxicity estimatesexcluding estimate of 43 ppb.
15
B. Exposure
Both granular and non-granular formulations are being considered in thisanalysis. The amount of toxicant a bird is likely to consume in the diet or by preening,ingest as a single dose, inhale, or absorb via the eye or through the skin, is currentlynot quantified as it is for human exposure. Research has begun, but is limited at thistime [6]. Among bird species, there are tremendous differences in feeding, mating,migration, and other behaviors. These and other factors explain why a definitive avianexposure model is not currently available.
Environmental exposure has two components: the frequency and duration ofcontact with the pesticide; and, the amount or concentration of a pesticide in theenvironment and available to non-target organisms. The Comparative Analysis ofAcute Avian Risk from Granular Pesticides provided an in-depth discussion showingthat birds are present in fields treated with pesticides; that the pesticide is available tobirds in the fields; and, birds can and do ingest pesticide granules, contaminated plantmaterial, insects, and soil.
Only limited data are currently available to determine to what extent ingestion ofpesticide granules or food items with pesticide residues is incidental, accidental,selected for, avoided or some combination of these possibilities. Birds mayinadvertently ingest granules along with other material, may mistake the granules forseeds, grit, or other food items, or may actively select or avoid contaminated insects,plant material or pesticide granules. With accidental or incidental exposure, bothdietary consumption and oral ingestion are assumed to be proportional to availability.
Since the amount of pesticide actually consumed or ingested by birds is difficultto quantify, the Agency used two simple exposure models to estimate exposure interms of availability of the pesticide active ingredient: one to estimate avian acute oraldose exposure, and one to estimate avian dietary exposure, both acute and chronic.
1. Acute Exposure to Granular Pesticides via Oral Dose (mg a.i./ ft2
available)
For granular pesticides, a simple exposure model for avian oral dose exposureassumes that the amount of toxicant available to birds per unit area of the treated fieldprovides an indication of the actual amount of pesticide available that birds couldingest. It is important to note that the Agency is not attempting to estimate the actualnumber of birds that would receive a lethal dose, nor the probability of a given birdconsuming a lethal dose. Estimates of that sort would depend on the number of acrestreated, the species and numbers of birds present in a given area and many factors ofbird behavior, that have not yet been adequately documented.
16
Methods and timing of applications vary with the specific product, the crop, andreason for treatment. Further, preferred application methods also vary with crop andlocation. Though some application-incorporation regimes are more effective than othersat reducing exposure, wildlife exposure to pesticides can result from all pesticideapplication methods including ground spray, aerial spray, band, in-furrow, drill,shanked-in, broadcast, side-dress and aerial broadcast.
For the purposes of this analysis, the Agency assumed that applicationsrequiring soil incorporation of the pesticide would result in only 15% of the pesticidebeing available to birds. For in-furrow applications the Agency assumed that only 1% ofthe pesticide would be available to birds. If labels did not specify any incorporation, noreduction in exposure was calculated. Further, the Agency calculated the exposureusing the maximum application rate and one-half that rate. The latter was included toprovide a range of exposure estimates. An exposure at one-half the maximum is notintended to represent any particular label rate. Since this is a screening analysis, it isassumed that information on typical rates would not be readily available for all thepesticides included in the comparison.
The Agency is using 15% and 1% as a representative values, recognizing thatspecific application methods provide more or less efficient incorporation. In previousproduct-specific assessments, the Agency has used a range of incorporation efficiencyvalues, reflecting the range of application methods. Erbach and Tollefson [7] and otherpublished data document the efficiency of various incorporation methods.
Field study and incident data confirm that birds can and do consume sufficientamounts of the pesticide formulations examined in this analysis to cause mortality.Furthermore, multiple lethal doses are readily available to birds in the relatively smallarea of one square foot.
Birds may ingest pesticide granules or food items contaminated by pesticidesremaining on or just below the soil surface after a pesticide application. Thesegranules or contaminated food items may be consumed while a bird is foraging forseed, grit or insects on the surface or probing below the surface of the soil. Furthermore, subsurface granules and contaminated food items may also haveexposure potential via routes other than direct ingestion (e.g., dermal exposure viacontaminated water after irrigation or rainfall). Data are not available to estimate theamount of pesticide ingested by birds probing below the soil surface. Therefore, for thisanalysis, the Agency has considered only the amount of pesticide on the surface of thesoil after a pesticide application. See equation (1).
(1) #Pounds Active Ingredient/Acre x 453,600 mg/lbs = #mg Active Ingredient43,560 ft2/Acre ft2
17
14The aerobic soil metabolism (ASM) half-life value is almost always a conservative estimate offoliar dissipation. For many pesticides, a more refined estimate may be found in Willis and McDowell [14].ASM values greater than 30 days are very rare. Where the ASM value is greater than 30-days, the data in
which equals
#Pounds Active Ingredient/Acre x 10.4132 mg/lbs = #mg Active Ingredientft2/Acre ft2
This analysis, like the Comparative Analysis of Acute Avian Risk from GranularPesticides, uses one square foot as the unit for calculating toxicant availability,although any constant unit area could be used. DeWitt [8] suggested this unit forcalculating environmental exposure when he related quantities of toxic pesticidesingested by birds to quantities of toxic pesticide deposited per square foot usingseveral laboratory and field studies. Felthousen [9] proposed Agency risk criteria forgranular pesticides related to the amount of toxic pesticide per square foot available toan animal. Current EPA ecological risk assessment procedures for pesticides use asimilar approach for determining the amount of toxicant available [10 and 11].
Appendix 6 gives the results of the calculations of amount of toxicant availableon the major use sites in terms of milligrams per square foot.
2. Acute Exposure to Sprayed Pesticides via Diet (ppm available indiet)
In the Standard Evaluation Procedures for Ecological Risk Assessment [10,Table 5], EPA presented a generalized table for estimating pesticide residues on avianfood items based on the data compiled by Hoerger and Kenaga [12]. The pesticideresidues in the table (all 0-day residues for 1 lb a.i./acre application) have been used toestimate maximum residues likely to be found in avian diets such as 240 ppm for smallgrasses, estimate ranges from maximum to typical such as 240 to 125 for smallgrasses or 58 to 33 ppm for forage crops, and to estimate residues in diets of specificspecies. These estimates have been recently updated based on Fletcher et al [13].These estimates, ranging from maximum to average, are 240 to 85 ppm for smallgrasses, 110 to 36 ppm for long grasses, 135 to 45 ppm for broadleaf plants, and 15 to7 ppm for fruits.
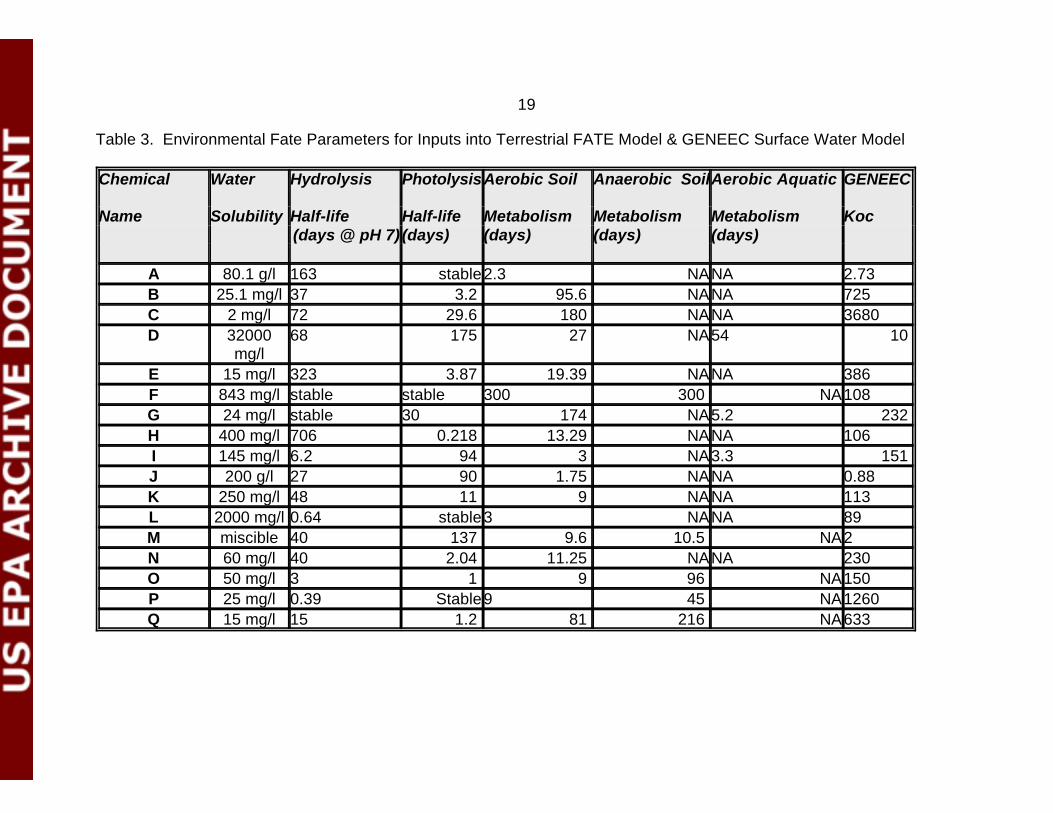
Since this is a screening analysis, the Agency chose to keep the acute exposuresimple and use the maximum residue value for small grasses adjusted by the maximumsingle application rate on the label and one-half this value for comparison purposes.This residue value was input to the FATE Model as well as the aerobic soil metabolismhalf-life value (see Table 3). The aerobic soil metabolism half-life value is used here asan estimate of foliar dissipation14. Run for 30-days, the model out-put provided the
18
this reference may provide a better estimate of foliar dissipation. Since this is a screening analysis, only theASM value was used to estimate the foliar dissipation.
maximum and average estimated residues on avian food items in ppm. Appendix 7shows the results for spray formulations.
19
Table 3. Environmental Fate Parameters for Inputs into Terrestrial FATE Model & GENEEC Surface Water Model
Chemical Water Hydrolysis Photolysis
Aerobic Soil Anaerobic SoilAerobic Aquatic GENEEC
Name Solubility Half-life Half-life Metabolism Metabolism Metabolism Koc(days @ pH 7) (days) (days) (days) (days)
A 80.1 g/l 163 stable2.3 NANA 2.73 B 25.1 mg/l 37 3.2 95.6 NANA 725 C 2 mg/l 72 29.6 180 NANA 3680 D 32000
mg/l68 175 27 NA54 10
E 15 mg/l 323 3.87 19.39 NANA 386 F 843 mg/l stable stable 300 300 NA108 G 24 mg/l stable 30 174 NA5.2 232 H 400 mg/l 706 0.218 13.29 NANA 106 I 145 mg/l 6.2 94 3 NA3.3 151 J 200 g/l 27 90 1.75 NANA 0.88 K 250 mg/l 48 11 9 NANA 113 L 2000 mg/l 0.64 stable3 NANA 89 M miscible 40 137 9.6 10.5 NA2 N 60 mg/l 40 2.04 11.25 NANA 230 O 50 mg/l 3 1 9 96 NA150 P 25 mg/l 0.39 Stable9 45 NA1260 Q 15 mg/l 15 1.2 81 216 NA633
20
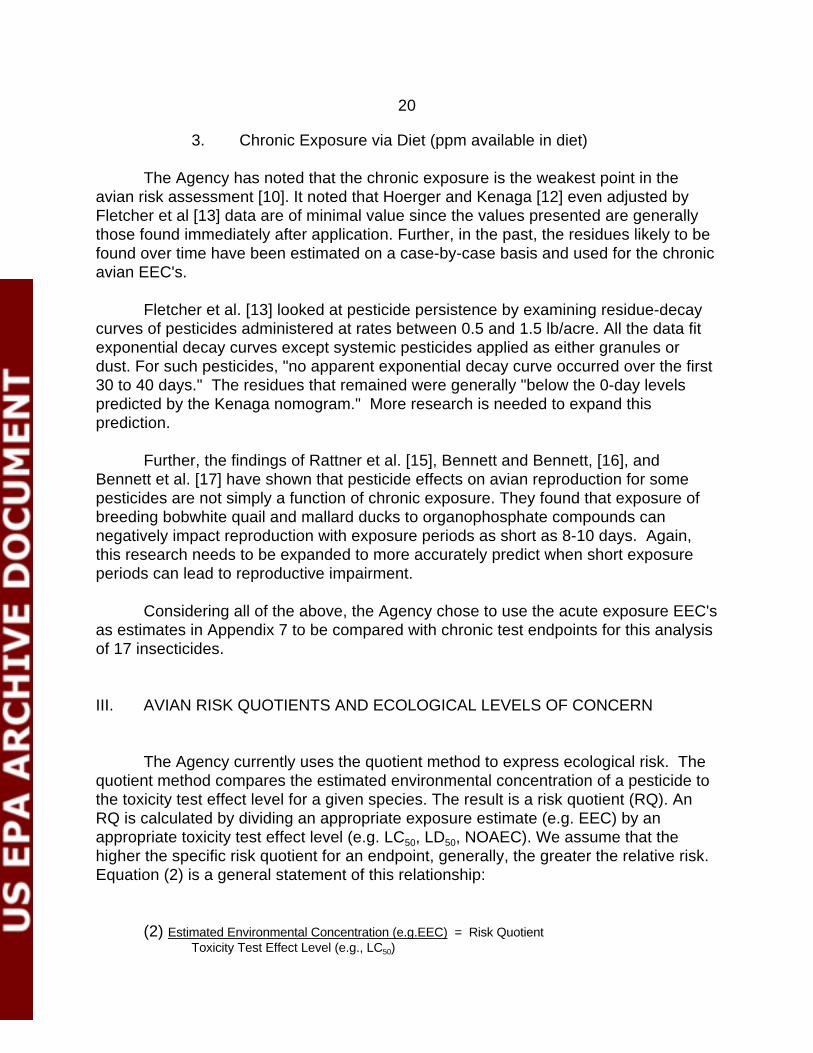
3. Chronic Exposure via Diet (ppm available in diet)
The Agency has noted that the chronic exposure is the weakest point in theavian risk assessment [10]. It noted that Hoerger and Kenaga [12] even adjusted byFletcher et al [13] data are of minimal value since the values presented are generallythose found immediately after application. Further, in the past, the residues likely to befound over time have been estimated on a case-by-case basis and used for the chronicavian EEC's.
Fletcher et al. [13] looked at pesticide persistence by examining residue-decaycurves of pesticides administered at rates between 0.5 and 1.5 lb/acre. All the data fitexponential decay curves except systemic pesticides applied as either granules ordust. For such pesticides, "no apparent exponential decay curve occurred over the first30 to 40 days." The residues that remained were generally "below the 0-day levelspredicted by the Kenaga nomogram." More research is needed to expand thisprediction.
Further, the findings of Rattner et al. [15], Bennett and Bennett, [16], andBennett et al. [17] have shown that pesticide effects on avian reproduction for somepesticides are not simply a function of chronic exposure. They found that exposure ofbreeding bobwhite quail and mallard ducks to organophosphate compounds cannegatively impact reproduction with exposure periods as short as 8-10 days. Again,this research needs to be expanded to more accurately predict when short exposureperiods can lead to reproductive impairment.
Considering all of the above, the Agency chose to use the acute exposure EEC'sas estimates in Appendix 7 to be compared with chronic test endpoints for this analysisof 17 insecticides.
III. AVIAN RISK QUOTIENTS AND ECOLOGICAL LEVELS OF CONCERN
The Agency currently uses the quotient method to express ecological risk. Thequotient method compares the estimated environmental concentration of a pesticide tothe toxicity test effect level for a given species. The result is a risk quotient (RQ). AnRQ is calculated by dividing an appropriate exposure estimate (e.g. EEC) by anappropriate toxicity test effect level (e.g. LC50, LD50, NOAEC). We assume that thehigher the specific risk quotient for an endpoint, generally, the greater the relative risk.Equation (2) is a general statement of this relationship:
(2) Estimated Environmental Concentration (e.g.EEC) = Risk QuotientToxicity Test Effect Level (e.g., LC50)
21
13 In 1992, the Agency announced the selection of 1 LD50/ft2 as the cutoff level of concern based upon
field study data submitted to the Agency at that time which indicated that pesticide applications resulting inenvironmental concentrations of at least 1 LD50/ft
2 have resulted in avian mortality. Since that time, theAgency proposed changing the level of concern (LOC) to 0.5 LD50/ft
2 primarily to add a level of safety to therisk estimate [2]. This proposal has generated considerable discussion both within and outside the Agency.
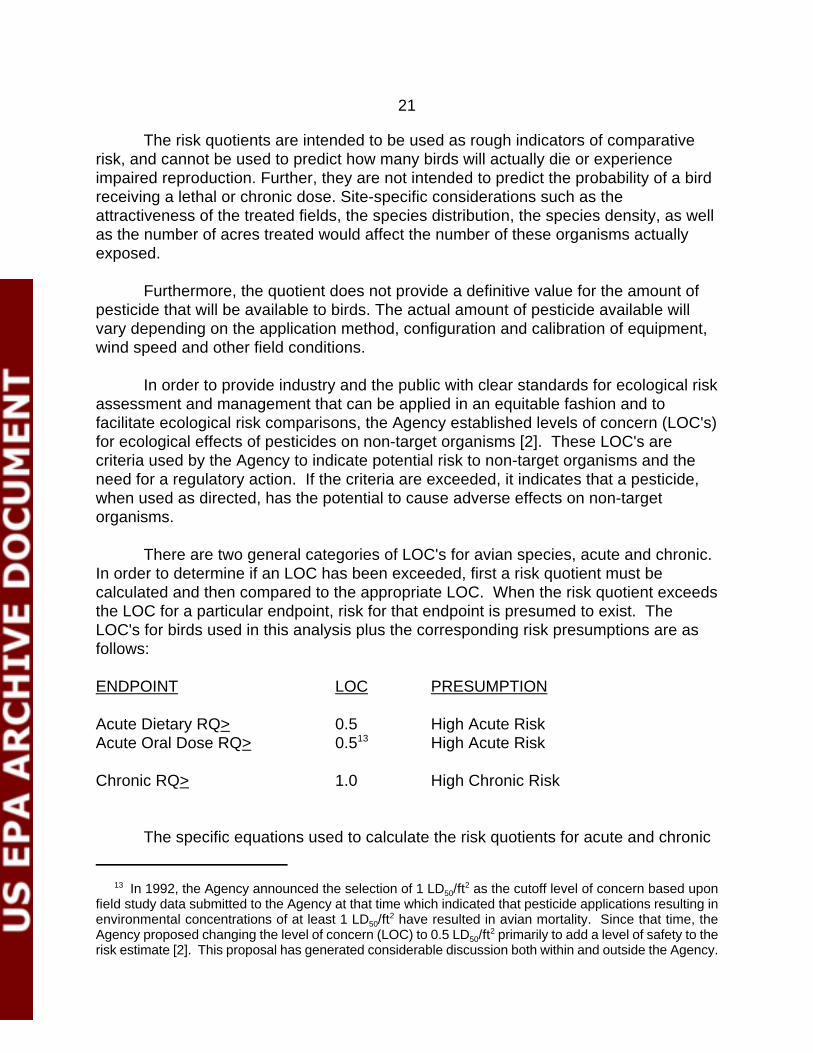
The risk quotients are intended to be used as rough indicators of comparativerisk, and cannot be used to predict how many birds will actually die or experienceimpaired reproduction. Further, they are not intended to predict the probability of a birdreceiving a lethal or chronic dose. Site-specific considerations such as theattractiveness of the treated fields, the species distribution, the species density, as wellas the number of acres treated would affect the number of these organisms actuallyexposed.
Furthermore, the quotient does not provide a definitive value for the amount ofpesticide that will be available to birds. The actual amount of pesticide available willvary depending on the application method, configuration and calibration of equipment,wind speed and other field conditions.
In order to provide industry and the public with clear standards for ecological riskassessment and management that can be applied in an equitable fashion and tofacilitate ecological risk comparisons, the Agency established levels of concern (LOC's)for ecological effects of pesticides on non-target organisms [2]. These LOC's arecriteria used by the Agency to indicate potential risk to non-target organisms and theneed for a regulatory action. If the criteria are exceeded, it indicates that a pesticide,when used as directed, has the potential to cause adverse effects on non-targetorganisms.
There are two general categories of LOC's for avian species, acute and chronic.In order to determine if an LOC has been exceeded, first a risk quotient must becalculated and then compared to the appropriate LOC. When the risk quotient exceedsthe LOC for a particular endpoint, risk for that endpoint is presumed to exist. TheLOC's for birds used in this analysis plus the corresponding risk presumptions are asfollows:
ENDPOINT LOC PRESUMPTION
Acute Dietary RQ> 0.5 High Acute RiskAcute Oral Dose RQ> 0.513 High Acute Risk
Chronic RQ> 1.0 High Chronic Risk
The specific equations used to calculate the risk quotients for acute and chronic
22
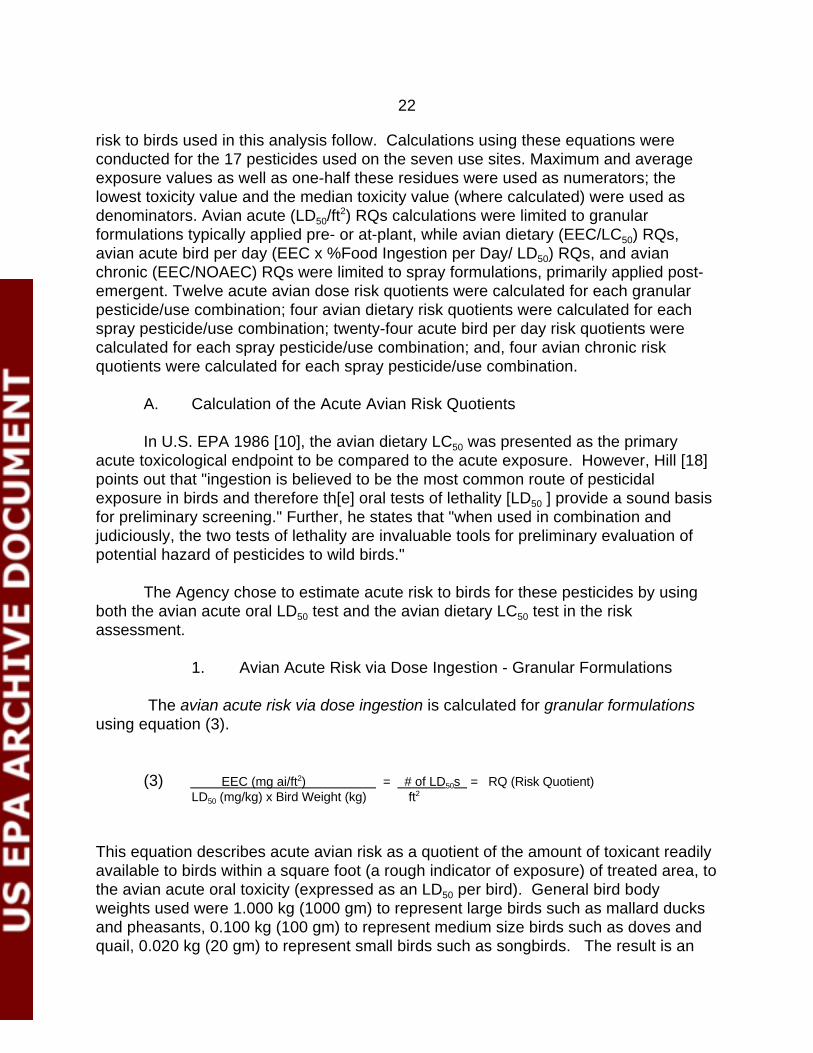
risk to birds used in this analysis follow. Calculations using these equations wereconducted for the 17 pesticides used on the seven use sites. Maximum and averageexposure values as well as one-half these residues were used as numerators; thelowest toxicity value and the median toxicity value (where calculated) were used asdenominators. Avian acute (LD50/ft
2) RQs calculations were limited to granularformulations typically applied pre- or at-plant, while avian dietary (EEC/LC50) RQs,avian acute bird per day (EEC x %Food Ingestion per Day/ LD50) RQs, and avianchronic (EEC/NOAEC) RQs were limited to spray formulations, primarily applied post-emergent. Twelve acute avian dose risk quotients were calculated for each granularpesticide/use combination; four avian dietary risk quotients were calculated for eachspray pesticide/use combination; twenty-four acute bird per day risk quotients werecalculated for each spray pesticide/use combination; and, four avian chronic riskquotients were calculated for each spray pesticide/use combination.
A. Calculation of the Acute Avian Risk Quotients
In U.S. EPA 1986 [10], the avian dietary LC50 was presented as the primaryacute toxicological endpoint to be compared to the acute exposure. However, Hill [18]points out that "ingestion is believed to be the most common route of pesticidalexposure in birds and therefore th[e] oral tests of lethality [LD50 ] provide a sound basisfor preliminary screening." Further, he states that "when used in combination andjudiciously, the two tests of lethality are invaluable tools for preliminary evaluation ofpotential hazard of pesticides to wild birds."
The Agency chose to estimate acute risk to birds for these pesticides by usingboth the avian acute oral LD50 test and the avian dietary LC50 test in the riskassessment.
1. Avian Acute Risk via Dose Ingestion - Granular Formulations
The avian acute risk via dose ingestion is calculated for granular formulationsusing equation (3).
(3) EEC (mg ai/ft2) = # of LD50s = RQ (Risk Quotient)LD50 (mg/kg) x Bird Weight (kg) ft2
This equation describes acute avian risk as a quotient of the amount of toxicant readilyavailable to birds within a square foot (a rough indicator of exposure) of treated area, tothe avian acute oral toxicity (expressed as an LD50 per bird). General bird bodyweights used were 1.000 kg (1000 gm) to represent large birds such as mallard ducksand pheasants, 0.100 kg (100 gm) to represent medium size birds such as doves andquail, 0.020 kg (20 gm) to represent small birds such as songbirds. The result is an
23
14 Bird food ingestion rates (in grams dry matter per day) were calculated using an equationdeveloped by Nagy [19] and referenced by EPA [20],
Food Ingestion (g/day) = 0.648 x bird weight 0.651 (g)
The Agency selected the general equation for all birds over other more specific equations for passerines,non-passerines, and seabirds. We assumed that the lowest and median toxicity values used in the riskquotients represented all birds. Thus, we chose the generalized food ingestion rate for all birds.
expression of acute risk to birds in terms of the number of LD50s per square foot.
Appendix 9 lists all acute avian risk quotient calculations for the granularformulation pesticide use site combinations. The results are presented in order ofdescending risk quotients for the pesticides on each use site. The greater the number,the greater the potential acute dose risk to birds.
2. Avian Dietary Risk - Spray Formulations
The avian acute risk via the diet is calculated for spray formulations usingequation (4).
(4) EEC (ppm in the diet) = Risk QuotientLC50 (ppm)
This equation describes acute avian dietary risk as a quotient of the concentration oftoxicant likely to be available in bird diets, to the subacute avian dietary toxicity(expressed as an LC50). The result is an expression of acute risk to birds in terms ofconcentration exposed to concentration tested.
Appendix 10 lists all avian dietary risk quotient calculations for the sprayformulation pesticide use site combinations. The results are presented in order ofdescending risk quotients for the pesticides used on each use site. The greater thenumber, the greater the potential acute dietary risk to birds.
3. Avian Acute Bird per Day Risk - Spray Formulations
The avian acute bird per day ingestion risk is also calculated for sprayformulations using equations (5) and (6).
(5 ) EEC x (Food Ingestion14/bird weight) = Risk QuotientLD50
This equation describes acute avian bird per day ingestion risk as a quotient of the
24
quantity of toxicant likely to be ingested daily [20] by a bird, to the acute oral aviandose toxicity (expressed as an LD50 expressed as mg/kg). The result is an expressionof acute risk to birds in terms of daily acute dose from ingestion of contaminated fooditems.
As previously noted, EPA/OPP has found that the LD50 value is often a betterindicator of acute toxicity to birds especially for pesticides with acute LD50 values lessthan or equal to 50 mg/kg. Appendix 3 shows that 14 out of the 17 Chemicalsconsidered here have LD50 values less than 50 mg/kg. Also, comparing the toxicityrankings in Appendix 3 and 4, a number of the most toxic insecticides via the oral doseare less toxic via the diet, e.g., Chemical O, Chemical G, Chemical E. Thus, the Agencydecided that a risk quotient using the LD50 toxicity values should be included for sprayformulations.
Appendix 11 lists all avian acute bird per day ingestion risk quotient calculationsfor the spray formulation pesticide use site combinations. The results are presented inorder of descending risk quotients for the pesticides used on each use site. Thegreater the number, the greater the potential acute bird per day risk to birds.
B. Calculation of the Chronic Avian Risk Quotients
1. Avian Chronic Risk - Spray Formulations
The avian chronic quotient is calculated for spray formulations using equation(6).
(6) EEC (ppm in the diet) = Risk QuotientNOAEC (ppm)
This equation describes chronic risk to birds as a quotient of the concentration oftoxicant likely to be available in bird diets, to the no observed adverse effectconcentration (NOAEC) in the avian reproduction test. The result is an expression ofchronic risk to birds in terms of concentration exposed to concentration tested.
Appendix 12 contains a list of avian chronic risk quotient calculations for allspray formulation pesticide use site combinations. The results are presented in order ofdescending risk quotients for the pesticides used on each use site. The greater thenumber, the greater the potential avian chronic risk to birds.
Granular formulations may also present a chronic risk to birds. However, theAgency dose not presently have a method to evaluate this risk.

25
15 Note that the Agency is not suggesting that avian exposures occurring after this time areinconsequential; only that new exposures starting after that point are not expected to present significant riskto birds.
2. Number of Days to Reach the Avian Chronic Level of Concern(RQ=1) - Spray Formulations
In addition to using an RQ approach for estimating potential avian chronic risk, the Agency elected to use a risk index that better reflected pesticide persistence. Thiswas accomplished by calculating the total number of days post-application required forestimated pesticide concentrations in avian food items to be degraded/dispersed to apoint of equivalence with the avian long-term exposure toxicity endpoint (reproductionNOAEC)15.
The Avian Chronic Time to RQ=1 calculation was performed for sprayformulations using the equation (7):
(7) Ln ((NOAEC (ppm)/EEC (ppm in the diet)) = Time (days)-K
where, the EEC (starting food item concentration) is the Agency standard short-grassestimated concentration based on 1 lb a.i./A (240 ppm) [13] adjusted by the applicationrate on the label. K is the foliar degradation rate constant as estimated by aerobic soilmetabolism half-life and an assumption of first-order degradation kinetics (SeeAppendix 8).
Appendix 13 contains a list of avian chronic Time to RQ=1 calculations for allspray formulation pesticide use site combinations. The results are presented in order ofdescending number of days for the pesticides used on each use site. The greater thenumber of days, the greater the potential avian chronic risk to birds.
C. The Avian Risk Column - % Pesticide Contribution to RQ Sum for EachEndpoint on Each Site (Crop)
When comparing pesticides using RQs, the RQ scales for each endpoint are animportant consideration. As shown below, the scales for the four avian endpoints varywidely (pesticide and use site for the highest values are presented parenthetically):
Acute Dose (LD50/ft2) 0 to 2519 [Chemical O on Peanuts]
Acute Dietary (EEC/LC50) 0 to 131 [Chemical L on Cotton] Acute Bird per Day (EECx%FI/LD50) 0 to 2940 [Chemical G on Cotton]Chronic Bird (EEC/NOAEC) 0 to 206 [Chemical B on Cotton]
26
These differences raise many questions. For example: Should we be more concernedwith acute bird per day risk and avian acute dose risk than acute dietary risk andchronic bird risk? Is the magnitude of the avian acute dose risk approximately 24 timesgreater than the dietary risk for pesticides used on potatoes? Do these differencesreflect inherently different ranges of toxicities for the different endpoints? Additionalanalyses and perhaps research is needed to answer these questions. Not havingadequate answers at present, the Agency decided that it would be easier to compareavian risk between pesticides without having to deal with these scale differences.
With the above information in mind, the Agency focused on each crop site. Itassumed that all the potential risk for a particular endpoint on a particular crop sitecould be represented by the sum of the RQ values that exceeded the LOC for all thepesticides used on that crop site. If the RQ values for that endpoint for each pesticideused on that crop site were summed, then the quotient of the sum of the individualpesticide RQs over the sum of all the RQs for all the pesticides, would represent thepercent (%) contribution of each pesticide to the total risk for that endpoint on that site.See equation (8).
(8) 3endpoint RQ values/pesticide/crop site x 100 = % Pesticide Contribution to RQ 3 endpoint RQ values for all pesticides/crop site Sum on Each Crop Site
This calculation provides a relative estimate of potential avian risk per pesticideper avian endpoint by which the pesticides can be compared on a crop site basis. Thecomparison is relative to the total risk for each endpoint and on each crop, representedby the sum of the RQ values which exceed the LOCs. It eliminates the problem ofwidely varying scales. Appendices 9a, 10a, 11a and 12a show these calculations foravian acute dose risk, avian dietary risk, acute bird per day risk and avian chronic risk,respectively.
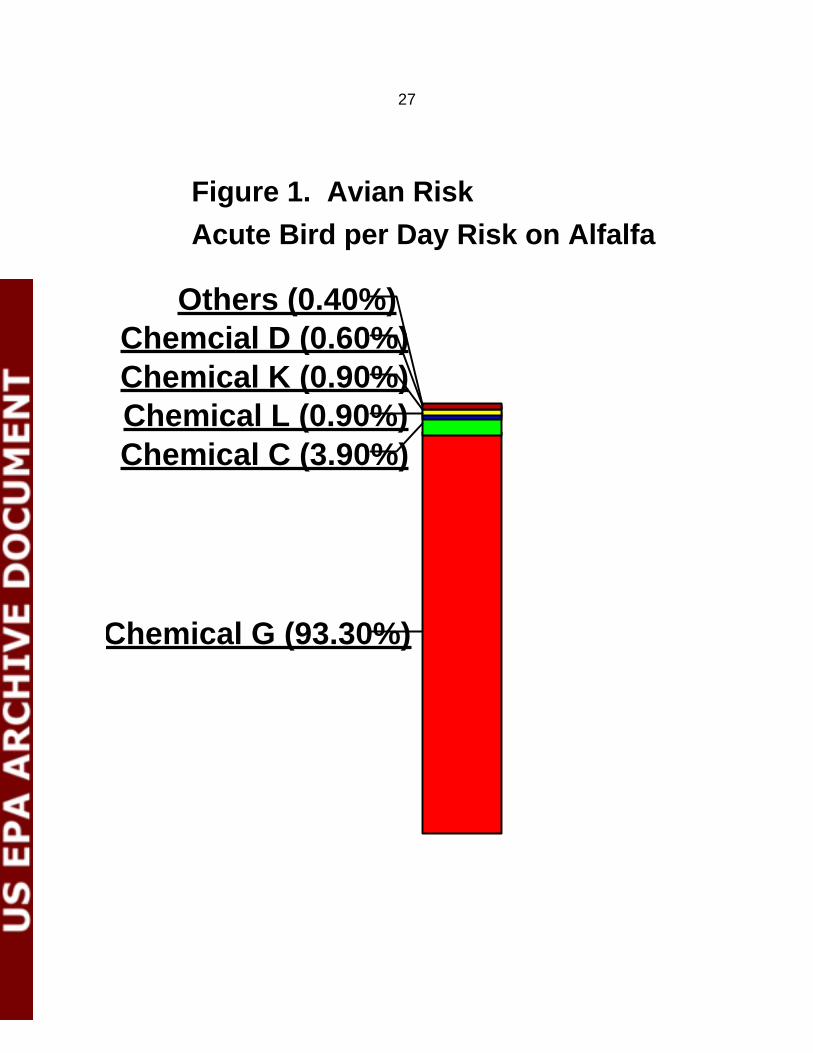
If all the avian risk per endpoint can be represented by the sum of all the RQvalues exceeding the LOC for that endpoint, the total risk can be viewed as column. Each pesticide used on that site contributes a certain percentage toward filling thecolumn. The major contributors to the total risk can be determined by showing theindividual percentages (See example in Figure 1).
27
Chemical G (93.30%)
Chemical C (3.90%)Chemical L (0.90%)Chemical K (0.90%)Chemcial D (0.60%)
Others (0.40%)
Figure 1. Avian Risk
Acute Bird per Day Risk on Alfalfa
28
In this example, Chemical G contributes the greatest and a majority of thepotential acute bird per day risk on alfalfa. Chemical C is a distant second, while theother pesticides used on alfalfa contribute less than 1%.
D. Frequency of LOC Exceedance (%)
Where the risk quotients can provide an estimate of the magnitude of potentialavian risk, considering how often a risk quotient exceeds an LOC can provide anestimate of the frequency of the potential risk. Twelve avian acute dose risk quotientswere calculated for each granular pesticide/use combination (See Appendix 9); fouravian dietary risk quotients were calculated for each spray pesticide/use combination(See Appendix 10); twenty-four acute bird per day risk quotients were calculated for each spray pesticide/use combination (See Appendix 11); and, four avian chronic riskquotients were calculated for each spray pesticide/use combination (See Appendix 12).The lowest and median toxicity values were included in all calculations except theavian chronic, where the lowest value was the only value available. The maximumresidue values and one-half these values were included in all calculations. In the birdper day RQ calculations and the avian chronic calculations, the average residuevalues, as determined using the FATE model were also included. Both the avian acutedose and the acute bird per day RQ calculations included LD50 values adjusted for 20,100, and 1000 gram birds.
Appendices 9b, 10b, and 11b show how often (%) the calculated acute riskquotients exceeded the LOC's for pesticide/use combination and each endpointanalyzed. The pesticides in each appendix were ordered by crop site and bydecreasing summed RQ values exceeding the LOC. The higher the frequency (%), themore times the RQ's exceeded the LOC's. This shows the relative frequency with whicha pesticide/use combination is likely to exceed an LOC. The frequency of exceedancewas not calculated for avian chronic risk because (1) greater than 93% [9/124; seeAppendix 12] of the chronic RQ calculations exceeded the LOC for chronic avian risk,and (2) the Time to RQ=1 (# of days) calculation along with the RQ calculation werethought to be risk indices that together better reflected pesticide persistence.
29
IV. EFFECTS AND EXPOSURE CHARACTERIZATION FOR AQUATICORGANISMS
A. Effects
EPA typically reviews the following laboratory studies in performing aquatic riskassessments: acute freshwater LC50 (ppb) studies, acute marine/estuarine fish LC50
(ppb) studies, acute freshwater invertebrate EC50 (ppb) studies, marine/estuarinecrustacean EC50 (ppb) studies, marine/estuarine mollusc EC50 (ppb) freshwater fishchronic (partial fish life-cycle) study providing a NOAEC (ppm), and freshwaterinvertebrate life-cycle providing a NOAEC. The Agency evaluates the studies andclassifies them as either core, supplemental or invalid, as well as indicating whether thesupplemental and invalid studies are up gradable. The results of the core andsupplemental studies, the toxicity values, are used in risk assessment.
Core and supplemental eco-toxicity data in the EcoTox Data Base [9] were usedto characterize the effects on fish and aquatic invertebrates. EPA updated and verifiedall the data used in this analysis. However, some errors in this analysis could resultfrom entry errors. In addition, the data used in this analysis reflects the status of thedata base as of July, 1998. It does not include data entered after that date. Morerecent data could change the results of this analysis.
Freshwater fish LC50 (ppb), marine/estuarine fish LC50 (ppb), freshwaterinvertebrate EC50 (ppb), marine/estuarine crustacean EC50 (ppb), marine/estuarinemollusc EC50 (ppb) acute values as well as freshwater fish and aquatic invertebrate life-cycle NOAEC (ppb) values for the most sensitive species tested (the lowest values)were selected from the data base. In addition, the median fish and aquatic invertebrateLC50 (ppb) and EC50 (ppb) values were calculated. These median values provided aless conservative estimate of the acute toxicity (compared to the lowest) and providedadditional values for determining a range of toxicity values for a particular endpoint.
Since relatively few species are used in standard toxicity testing, it is likely thatthe species most sensitive to each pesticide has not been tested. Because of thisvariation in sensitivity, it is unlikely that this analysis will show the worst case risk foreach pesticide, but rather will provide a range of risk values for purposes of comparisonand identification of those pesticides that are more likely to cause adverse effects inactual use.
1. Acute Toxicity to Freshwater Fish
EPA typically requires 96-hour acute LC50 toxicity studies on two fish species,one cold water fish such as a rainbow trout, and one warm water fish such as a bluegillsunfish. These toxicity data are used to assess the pesticide’s potential to cause acute
30
lethality in freshwater fish.
EPA ranked the 17 pesticides in order of their lowest acute freshwater fish LC50
toxicity values (Appendix 14). The median values were also calculated.
2. Acute Toxicity to Marine/Estuarine Fish
EPA typically requires 96-hour acute LC50 toxicity studies on onemarine/estuarine fish species such as the sheepshead minnow when the use of thepesticide is likely to contaminate marine/estuarine environments. These toxicity dataare used to assess acute effects on marine/estuarine fish. For pesticides lacking dataon this endpoint, a value was estimated based on a regression analysis (Table 2) ofmedian freshwater fish acute values over median marine/estuarine fish for all thepesticides in the class. Median values are not presented for this endpoint because EPAtypically receives data on only one marine/estuarine fish species.
EPA ranked the 17 pesticides in order of their lowest acute marine/estuarine fishLC50 toxicity values (Appendix 15).
3. Acute Toxicity to Freshwater Invertebrates
EPA typically requires one 48-hour EC50 study on daphnia spp. These data areused by OPP to assess acute effects on freshwater invertebrates.
EPA ranked the 17 pesticides in order of their lowest acute EC50 toxicity values(Appendix 16). The median value is also included since there were sufficient data foreach pesticide in the analysis to calculate this value.
4. Acute Toxicity to Marine/Estuarine Crustaceans
EPA typically requires 96-hour acute EC50 toxicity studies on onemarine/estuarine crustacan species such as the mysid when the use of the pesticide islikely to contaminate marine/estuarine environments. These toxicity data are used toassess acute effects on marine/estuarine crustaceans. For pesticides lacking data onthis endpoint, a value was estimated based on a regression analysis (Table 2) ofmedian freshwater crustacean acute values over median marine/estuarine crustaceanvalues for all the pesticides in this class. Median values are not presented for thisendpoint because EPA typically receives data on only one marine/estuarine crustaceanspecies.
EPA ranked the 17 pesticides in order of their lowest acute marine/estuarinecrustacean EC50 toxicity values (Appendix 17).
5. Acute Toxicity to Marine/Estuarine Molluscs
31
EPA typically requires 96-hour acute EC50 toxicity studies on onemarine/estuarine mollusc species such as the eastern oyster when the use of thepesticide is likely to contaminate marine/estuarine environments. These toxicity dataare used to assess acute effects on marine/estuarine molluscs. For pesticides lackingdata on this endpoint, a value was estimated based on a regression analysis (Table 2)of median marine/estuarine crustacean acute values over median marine/estuarinemollusc values for all the pesticides in this class. Median values are not presented forthis endpoint because EPA typically receives data on only one marine/estuarinecrustacean species.
EPA ranked the 17 pesticides in order of their lowest acute marine/estuarinemollusc EC50 toxicity values (Appendix 18).
6. Chronic Toxicity to Freshwater Fish
The NOAEC is the typical value resulting from the partial or full life-cycle fishtest. Typically, one species is tested, often the fathead minnow. Common life-cycleeffects found in these tests are reduced hatchability, reduced juvenile survival, reducedgrowth of F1 generation, etc. For pesticides lacking data on this endpoint, a value wasestimated based on a regression analysis (Table 2) of median freshwater acute fishvalues over freshwater fish chronic values for all the pesticides in this class.
EPA ranked the 17 pesticides in order of their lowest chronic toxicity NOAECs(Appendix 19).
7. Chronic Toxicity to Freshwater Invertebrates (crustaceans)
The NOAEC is the typical value resulting from the aquatic invertebrate life-cycle test requirement in the regulations. Typically one species such as Daphnia, spp.is tested. Common life-cycle effects found in these tests are reduced number of youngper female, reduced juvenile survival, reduced growth of F1 generation, etc. Forpesticides lacking data on this endpoint, a value was estimated based on a regressionanalysis (Table 2) of median freshwater crustacean acute values over freshwaterinvertebrate chronic values for all the pesticides in this class.
EPA ranked the 17 pesticides in order of their lowest chronic toxicity NOAECs(Appendix 20).
32
B. Exposure
1. Acute and Chronic Exposure Modeling
To provide a basis for comparison, EPA used the GENEEC [21] to estimate theconcentration of the 17 pesticides in ponds adjacent to pesticide applications on thefour use sites using both the maximum use rates and one-half the maximum use rates. The GENEEC is a screening model that mimics the PRZM-EXAMS model behavior. Inthe model, the number of days between treatment and rain-induced runoff is set at 2. Itassumes runoff from a 10-hectare field to a standard 1 hectare pond two meters deep. Further, it assumes 10% runoff of a total annual pesticide application. A GenericEstimated Environmental Concentration (GEEC) is produced and this value may beincreased by adding spray drift. Spray drift for an aerial application is added at 5%application rate with 95% application efficiency. Spray drift for a ground application isadded at 1% application rate with 99% application efficiency. The GEEC may bereduced by factoring in adsorption to soil using the KOC value and by consideringincorporation. The model calculates chronic GEEC's using aerobic aquatic, hydrolysisand/or aquatic photolysis half-life values (days). The model produces a reportconsisting of the peak GEEC as well as the average GEEC at 4-days, 21-days and 56-days. Following the standard procedures used in EFED Science Chapters forRegistration Eligibility Documents (REDs), EPA chose to use the peak GEEC for theacute exposure, i.e., the Estimated Environmental Concentration (EEC), to fish andaquatic invertebrates; the 21-day GEEC for the chronic EEC to aquatic invertebrates;and, the 56-day GEEC for the chronic EEC to fish. Table 3 in Section II provides alisting of the environmental fate parameters for each of the 17 pesticides used to loadthe GENEEC model. Table 4 below provides the report format for the model.
Appendix 21 gives the results of the GENEEC model runs for the 38pesticide/use combinations for the maximum label rates and one-half the maximumlabel rates.

33
Table 4. GENEEC Model Report Format
RUN No. 1 FOR [name of pesticide] INPUT VALUES ---------------------------------------------------------------------------------------------------------- RATE (#/AC) APPLICATIONS SOIL SOLUBILITY % SPRAY INCORP ONE(MULT) NO.-INTERVAL KOC (PPM) DRIFT DEPTH(IN) ----------------------------------------------------------------------------------------------------------- 0.0( 0.000) 0 0 0.0 000.0 0 .0 0.0
FIELD AND STANDARD POND HALFLIFE VALUES (DAYS) -----------------------------------------------------------------------------------------------------------------METABOLIC DAYS UNTIL HYDROLYSIS PHOTOLYSIS METABOLIC COMBINED (FIELD) RAIN/RUNOFF (POND) (POND-EFF) (POND) (POND) ------------------------------------------------------------------------------------------------------------------ 0.00 0 000.00 .00- .00 .00 000.00
GENERIC EECs (IN PPB) ---------------------------------------------------------------------------------- PEAK AVERAGE 4 AVERAGE 21 AVERAGE 56 GEEC DAY GEEC DAY GEEC DAY GEEC ---------------------------------------------------------------------------------- 00.00 00.00 00.00 00.00
34
V. AQUATIC RISK QUOTIENTS AND LEVELS OF CONCERN
As noted previously, the Agency currently uses the quotient method to expressecological risk. The quotient method compares the estimated environmentalconcentration of a chemical to the toxicity test effect level for a given species. Theresult is a risk quotient. A risk quotient is calculated by dividing an appropriateexposure estimate (e.g. EEC) by an appropriate toxicity test effect level (e.g. LC50). Weassume that the higher the specific risk quotient, the greater the relative risk. Onceagain equation (2) is presented as a general statement of this relationship:
Estimated Environmental Concentration (e.g.EEC) = Risk Quotient Toxicity Test Effect Level (e.g., LC50)
The acute aquatic effect levels typically are: LC50 for fish, and the EC50 foraquatic invertebrates. The aquatic chronic effect level for both fish and aquaticinvertebrates is the NOAEC.
The risk quotients are intended to be used as rough indicators of comparativerisk, and cannot be used to predict how many fish or aquatic invertebrates will actuallydie or experience adverse effects on their life-cycle or reproduction. Further, the riskquotients are not intended to predict the probability of a fish or aquatic invertebratereceiving a lethal dose. Site-specific considerations such the water temperature,quality and pH, vagaries of weather especially precipitation, the species distribution,the species density, as well as the number of acres treated, would affect the number of organisms actually exposed, the concentrations and durations of the exposures, andtheir consequences. .
Furthermore, the quotient does not provide a definitive value for the amount ofpesticide that will be available to fish or aquatic invertebrates. The actual amount ofpesticide available will vary depending on application method, configuration andcalibration of equipment, and specific field conditions.
In order to provide industry and the public with clear standards for ecological riskassessment and management that can be applied in an equitable fashion and tofacilitate ecological risk comparisons, the Agency established levels of concern (LOC's)for ecological effects of pesticides on fish and aquatic invertebrates [2]. These LOC'sare criteria used by the Agency to indicate potential risk to non-target organisms andthe need for a regulatory action. Exceeding the criteria indicates that a pesticide, whenused as directed, has the potential to cause undesirable effects on non-target fish andaquatic invertebrates.
There are two general categories of LOC's for fish and aquatic invertebrates,
35
acute and chronic. In order to determine if an LOC has been exceeded, first a riskquotient must be calculated and then compared to the appropriate LOC. When the riskquotient exceeds the LOC for a particular category, risk to that particular category ispresumed to exist. The LOC's for fish and aquatic invertebrates used in this analysisplus the corresponding risk presumptions are as follows:
ENDPOINT LOC PRESUMPTION
Acute RQ > 0.5 High Acute Risk
Chronic RQ > 1.0 High Chronic Risk
The specific equations used to calculate the risk quotients for acute and chronicrisk to fish and aquatic invertebrates used in this analysis follow. Calculations usingthese equations were conducted for all of the pesticides use site combinations. Exposure values were modeled using the maximum and one-half the maximum userates. Five acute RQs (acute freshwater fish RQs (EEC/LC50), acute marine/estuarinefish RQs (EEC/LC50), acute freshwater invertebrate RQs (EEC/EC50), acutemarine/estuarine crustacean RQs (EEC/EC50), and acute marine/estuarine mollusc RQs (EEC/EC50)), and two chronic RQs (chronic freshwater fish and chronic freshwaterinvertebrate EEC/NOAEC)) were calculated for both granular and spray formulations.Four quotients were calculated for each pesticide use site combination for acutefreshwater fish and aquatic invertebrate endpoints, reflecting the combinations ofmaximum and one-half the maximum use rates with the lowest and median LC50 or EC50
values. Two quotients were calculated for the other endpoints, reflecting the two userate assumptions and the lowest LC50 or EC50 values.
A. Calculation of the Acute Fish & Aquatic Invertebrate Risk Quotients
1. Acute Freshwater Fish Risk
The freshwater fish acute risk quotient is calculated using equation (9).
(9) EEC (ppb in pond water; peak) = Risk QuotientLC50 (ppb)
This equation describes acute freshwater fish risk as a quotient of the concentration oftoxicant likely to occur in ponds adjacent to pesticide applications as estimated by theGENEEC model, to the acute freshwater fish toxicity value (expressed as an LC50). The
36
result is an expression of acute risk to freshwater fish in terms of concentrationexposed to concentration tested.
Appendix 22 lists the freshwater fish risk quotient calculations for all pesticideuse site combinations. The results are presented in order of descending risk quotientsby crop.
2. Acute Marine/Estuarine Fish Risk
The marine/estuarine fish acute risk quotient is calculated using equation (9).This equation describes acute marine/estuarine fish risk as a quotient of theconcentration of toxicant likely to occur in estuarine areas adjacent to pesticideapplications as estimated by the GENEEC model, to the acute marine/estuarine fishtoxicity value (expressed as an LC50). The pond values are used as a roughapproximation of pesticide concentrations in the estuarine environment. The result isan expression of acute risk to marine/estuarine fish in terms of concentration exposedto concentration tested.
Appendix 23 lists the marine/estuarine fish risk quotient calculations for allpesticide use site combinations. The results are presented in order of descending riskquotients by crop.
3. Acute Freshwater Invertebrate Risk
The freshwater invertebrate acute risk quotient is calculated using equation (10).
(10) EEC (ppb in pond water; peak) = Risk QuotientEC50 (ppb)
This equation describes acute freshwater invertebrate risk as a quotient of theconcentration of toxicant likely to occur in ponds adjacent to pesticide applications asestimated by the GENEEC model, to the acute freshwater invertebrate toxicity value(expressed as an EC50). The result is an expression of acute risk to freshwaterinvertebrate in terms of concentration exposed to concentration tested.
Appendix 24 lists the freshwater invertebrate risk quotient calculations for allpesticide use site combinations. The results are presented in order of descending riskquotients by crop.
4. Acute Marine/Estuarine Crustacean Risk
The marine/estuarine crustacean acute risk quotient is calculated using equation

37
(10). This equation describes acute marine/estuarine crustacean risk as a quotient ofthe concentration of toxicant likely to occur in estuarine areas adjacent to pesticideapplications as estimated by the GENEEC model, to the acute marine/estuarinecrustacean toxicity value (expressed as an EC50). The pond values are used as a roughapproximation of pesticide concentrations in the estuarine environment. The result isan expression of acute risk to marine/estuarine crustaceans in terms of concentrationexposed to concentration tested.
Appendix 25 lists the marine/estuarine crustacean risk quotient calculations forall pesticide use site combinations. The results are presented in order of descendingrisk quotients by crop.
5. Acute Marine/Estuarine Mollusc Risk
The marine/estuarine mollusc acute risk quotient is calculated using equation(11). This equation describes acute marine/estuarine mollusc risk as a quotient of theconcentration of toxicant likely to occur in estuarine areas adjacent to pesticideapplications as estimated by the GENEEC model, to the acute marine/estuarinemollusc toxicity value (expressed as an EC50). The pond values are used as a roughapproximation of pesticide concentrations in the estuarine environment. The result isan expression of acute risk to marine/estuarine molluscs in terms of concentrationexposed to concentration tested.
Appendix 26 lists the marine/estuarine mollusc risk quotient calculations for allpesticide use site combinations. The results are presented in order of descending riskquotients by crop.
B. Calculation of the Chronic Fish & Aquatic Invertebrate Risk Quotients
1. Chronic Freshwater Fish Risk
The freshwater fish chronic quotient is calculated using equation (11).
(11) EEC (ppb in pond water; 56-day average) = Risk QuotientNOAEC (ppb)
This equation describes chronic freshwater fish risk as a quotient of the concentrationof toxicant likely to occur in ponds adjacent to pesticide applications as estimated bythe GENEEC model, to the chronic freshwater fish toxicity value (expressed as anNOAEC). The result is an expression of chronic risk to freshwater fish in terms ofconcentration exposed to concentration tested.
38
Appendix 27 lists all chronic freshwater fish risk quotient calculations for allpesticide use site combinations.
2. Chronic Freshwater Invertebrate Risk
The freshwater invertebrate chronic quotient is calculated using equation (12).
(12) EEC (ppb in pond water; 21-day average) = Risk QuotientNOAEC (ppb)
This equation describes chronic freshwater invertebrate risk as a quotient of theconcentration of toxicant likely to occur in ponds adjacent to pesticide applications asestimated by the GENEEC model, to the chronic freshwater invertebrate toxicity value(expressed as an NOAEC). The result is an expression of chronic risk to freshwaterinvertebrates in terms of concentration exposed to concentration tested.
Appendix 28 lists all chronic freshwater invertebrate risk quotient calculations forall pesticide use site combinations.
. A. The Aquatic Risk Column - % Pesticide Contribution to RQ Sum for Each
Endpoint on Each Site (Crop)
When comparing pesticides using RQs, the RQ scales for each endpoint are animportant consideration. As shown below, the scales for the four aquatic endpoints varywidely (pesticide and use site for the highest values are presented parenthetically):
Acute Freshwater Fish (EEC/LC50) 0 to 443 [Chemical B on Cotton] Acute Marine/Estuarine Fish (EEC/LC50) 0 to 50 [Chemical B on Cotton] Acute Freshwater Invertebrate (EEC/EC50) 0 to 4979 [Chemical G on Cotton] Acute Marine/Estuarine Crustacea (EEC/EC50) 0 to 830 [Chemical G on Cotton] Acute Marine/Estuarine Mollusc (EEC/EC50) 0 to 249 [Chemical G on Cotton] Chronic Freshwater Fish (EEC/NOAEC) 0 to 334 [Chemical B on Cotton] Chronic Freshwater Invertebrate (EEC/NOAEC) 0 to 22494 [Chemical G on Cotton]
These differences raise many questions. For example: Should we be more concernedwith chronic and acute freshwater invertebrate risk than the others, especially acutemarine/estuarine fish risk? Is the magnitude of the chronic freshwater invertebrate riskapproximately 450 times greater than the acute marine/estuarine fish risk for pesticidesused on cotton? It would be easier to compare aquatic risk between pesticides withouthaving to deal with these scale differences.
With the above information in mind, the Agency focused on each crop site. It
39
assumed that all the potential risk for a particular endpoint on a particular crop sitecould be represented by the sum of the RQ values that exceeded the LOC for all the pesticides used on that crop site. If the RQ values for that endpoint for each pesticideused on that crop site were summed, then the quotient of the sum of the individualpesticide RQs over the sum of all the RQs for all the pesticides, would represent thepercent (%) contribution of each pesticide to the total risk for that endpoint on that site.See equation (8) again.
3endpoint RQ values/pesticide/crop site x 100 = % Pesticide Contribution to RQ 3 endpoint RQ values for all pesticides/crop site Sum on Each Crop Site
This calculation provides a relative estimate of potential fish or aquaticinvertebrate risk per pesticide per aquatic endpoint by which the pesticides can becompared on a crop site basis. The comparison is relative to the total risk for eachendpoint and on each crop, represented by the sum of the RQ values which exceed theLOCs. It eliminates the problem of widely varying scales. Appendices 22a, 23a, 24a,25a, 26a, 27a, and 28a, show these calculations for acute freshwater fish risk, acutemarine/estuarine fish risk, acute freshwater invertebrate risk, acute marine/estuarinecrustacean risk, acute marine/estuarine mollusc risk, chronic freshwater fish risk, andchronic freshwater invertebrate risk, respectively.
If all the aquatic risk per endpoint can be represented by the sum of all the RQvalues exceeding the LOC for that endpoint, the total risk can be viewed as a column.Each pesticide used on that site contributes a certain percentage toward filling thecolumn. The major contributors to the total risk can be determined by showing theindividual percentages (See example in Figure 2).

40
Chemical B (47.50%)
Chemical C (22.20%)
Chemical K (17.40%)
Chemical I (8.10%)Chemical G (4.30%)
Others (0.50%)
Figure 2. Aquatic Risk
Acute Freshwater Fish Risk on Alfalfa
41
In this example, Chemical B contributes the greatest potential acute freshwaterfish risk on alfalfa, followed by Chemical C and Chemical K. Chemical I and ChemicalG contribute a combined total of 12.4%. Other Chemicals used on alfalfa contributeless than 1%.
D. Frequency (%) of LOC Exceedance
Where the risk quotients can provide an indicator of the magnitude of potentialaquatic risk, considering how often a risk quotient exceeds an LOC can provide anindicator of the frequency of the potential risk. Four acute freshwater fish risk quotientswere calculated for each pesticide/use combination (See Appendix 22); two acutemarine/estuarine fish risk quotients were calculated for each pesticide/use combination(See Appendix 23); four acute freshwater invertebrate risk quotients were calculated for each pesticide/use combination (See Appendix 24); and, two acute marine/estuarinecrustacean risk quotients were calculated for each pesticide/use combination (SeeAppendix 25); two acute marine/estuarine mollusc risk quotients were calculated foreach pesticide/use combination (See Appendix 26); two chronic freshwater fish riskquotients were calculated for each pesticide/use combination (See Appendix 27); and,two chronic freshwater invertebrate risk quotients were calculated for eachpesticide/use combination (See Appendix 28). The lowest and median toxicity valueswere included in the acute freshwater fish and invertebrate risk quotient calculations.Only the lowest toxicity value was available for the other risk quotient calculations. Themaximum use rate EEC values and one-half these values were included in allcalculations.
Appendices 22b, 23b, 24b, 25b, 26b, 27b, and 28b show how often (%) thecalculated acute and chronic risk quotients exceeded the LOC's for each pesticide/usecombination and each endpoint analyzed. The pesticides in each appendix wereordered by crop site and by decreasing summed RQ values exceeding the LOC. Thehigher the frequency (%), the more times the RQ's exceeded the LOC's. This shows therelative frequency with which a pesticide/use combination is likely to exceed an LOC.
VI. COMPARATIVE ECOLOGICAL RISK ANALYSIS
This comparative analysis relies upon readily available data for use in estimatingpotential risk. Ecotoxicity [5] and environmental fate data were readily available inAgency files and used to calculate risk quotients, % contributions to RQ sums, andfrequency (%) of exceeding LOCs. Use information [Appendix 1], such as the numberof acres treated by pesticide and crop site, as well as bird and fish incident report data[22] can also be considered in characterizing the potential risk. Together, they can beused to compare the ecological risk of pesticides used on the same crop site.
42
A. Calculation of Potential Risk (% of Risk)
Up to this point in the analysis, the risk quotients for all the pesticides have beensummed for each endpoint on each crop site to arrive at the total calculated risk foreach endpoint and each crop site. Next, the percentage contribution of each pesticideuse/combination to the total risk has been determined for each endpoint. This will becalled the percentage (%) contribution to the RQ sum, e.g., % contribution to the RQsum for avian acute risk, % contribution to the RQ sum for avian chronic risk, %contribution to the RQ sum for acute freshwater fish risk.
Further, the frequency that the calculated risk quotients for each pesticideuse/combination exceeded the LOC for each endpoint has been calculated. This will becalled the frequency (%) of exceedance.
The potential risk (which will be called the percentage (%) of risk) for a pesticideuse/combination and any endpoint was assumed to be a function of both the %contribution of the RQ sum and the frequency % of exceedance. This is expressed inequation (13).
(13) % contribution to the RQ sum x frequency (%) of exceedance = % of risk 100% 100%
Thus, the % avian acute risk for Chemical O applied at-plant to corn is equal to theproduct of the % contribution of the RQ sum for avian acute risk sum and the frequency(%) that the calculated risk quotients exceeded the LOC=0.5.
The avian chronic endpoint presents a slightly different situation. As for the otherendpoints, the % contribution to the RQ sum for avian chronic risk was calculated.However, as described above, the Time to RQ=1 was calculated in place of thefrequency of exceedance. This calculation better captured the persistence of thepesticide.
Similar to the % contribution to the RQ sum, the % contribution to the Time toRQ=1 was calculated for each pesticide use/combination. The potential avian chronicrisk, % avian chronic risk, for a pesticide use/combination was assumed to be theaverage of the % contribution to the RQ sum and the % contribution to the Time toRQ=1. This is expressed in equation (14).
(14) % contribution to the RQ sum/100% + % contribution to the Time toRQ=1/100% = % of avian2 chronic risk
Most of the pesticides considered in this case study have low NOAEC valuesand most calculated RQs exceed the LOC=1. Equation (14) assigns greater % avian
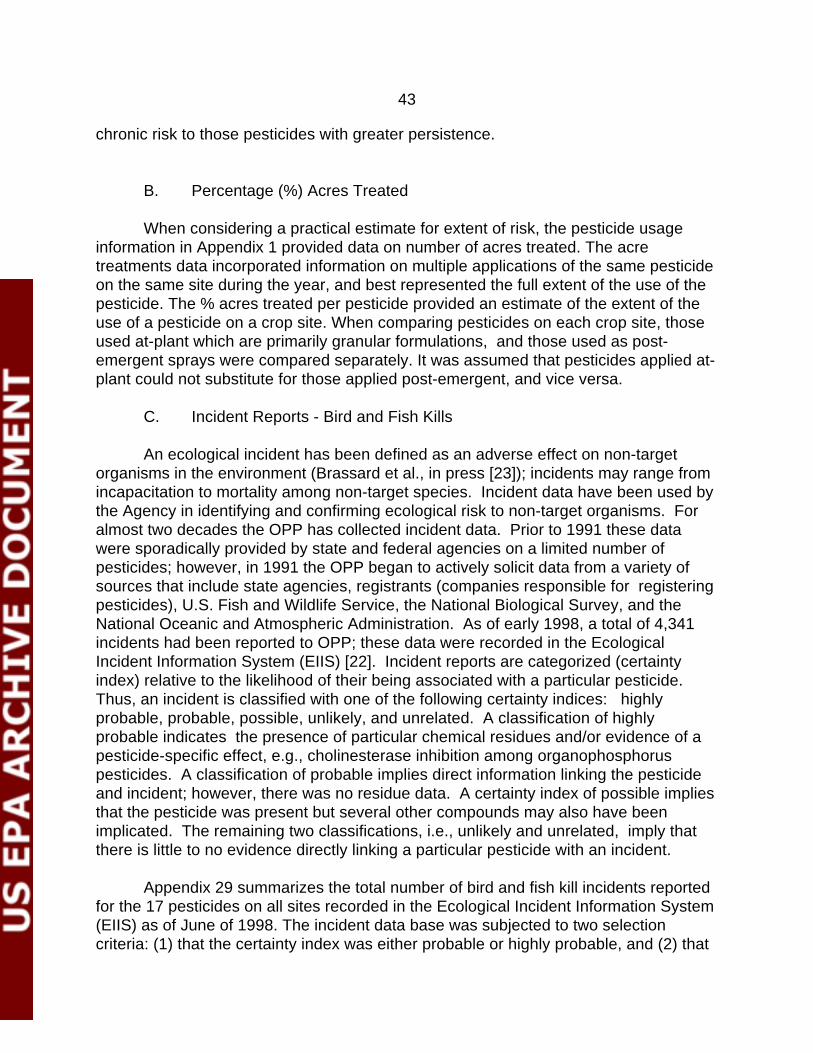
43
chronic risk to those pesticides with greater persistence.
B. Percentage (%) Acres Treated
When considering a practical estimate for extent of risk, the pesticide usageinformation in Appendix 1 provided data on number of acres treated. The acretreatments data incorporated information on multiple applications of the same pesticideon the same site during the year, and best represented the full extent of the use of thepesticide. The % acres treated per pesticide provided an estimate of the extent of theuse of a pesticide on a crop site. When comparing pesticides on each crop site, thoseused at-plant which are primarily granular formulations, and those used as post-emergent sprays were compared separately. It was assumed that pesticides applied at-plant could not substitute for those applied post-emergent, and vice versa.
C. Incident Reports - Bird and Fish Kills
An ecological incident has been defined as an adverse effect on non-targetorganisms in the environment (Brassard et al., in press [23]); incidents may range fromincapacitation to mortality among non-target species. Incident data have been used bythe Agency in identifying and confirming ecological risk to non-target organisms. Foralmost two decades the OPP has collected incident data. Prior to 1991 these datawere sporadically provided by state and federal agencies on a limited number ofpesticides; however, in 1991 the OPP began to actively solicit data from a variety ofsources that include state agencies, registrants (companies responsible for registeringpesticides), U.S. Fish and Wildlife Service, the National Biological Survey, and theNational Oceanic and Atmospheric Administration. As of early 1998, a total of 4,341incidents had been reported to OPP; these data were recorded in the EcologicalIncident Information System (EIIS) [22]. Incident reports are categorized (certaintyindex) relative to the likelihood of their being associated with a particular pesticide. Thus, an incident is classified with one of the following certainty indices: highlyprobable, probable, possible, unlikely, and unrelated. A classification of highlyprobable indicates the presence of particular chemical residues and/or evidence of apesticide-specific effect, e.g., cholinesterase inhibition among organophosphoruspesticides. A classification of probable implies direct information linking the pesticideand incident; however, there was no residue data. A certainty index of possible impliesthat the pesticide was present but several other compounds may also have beenimplicated. The remaining two classifications, i.e., unlikely and unrelated, imply thatthere is little to no evidence directly linking a particular pesticide with an incident.
Appendix 29 summarizes the total number of bird and fish kill incidents reportedfor the 17 pesticides on all sites recorded in the Ecological Incident Information System(EIIS) as of June of 1998. The incident data base was subjected to two selectioncriteria: (1) that the certainty index was either probable or highly probable, and (2) that
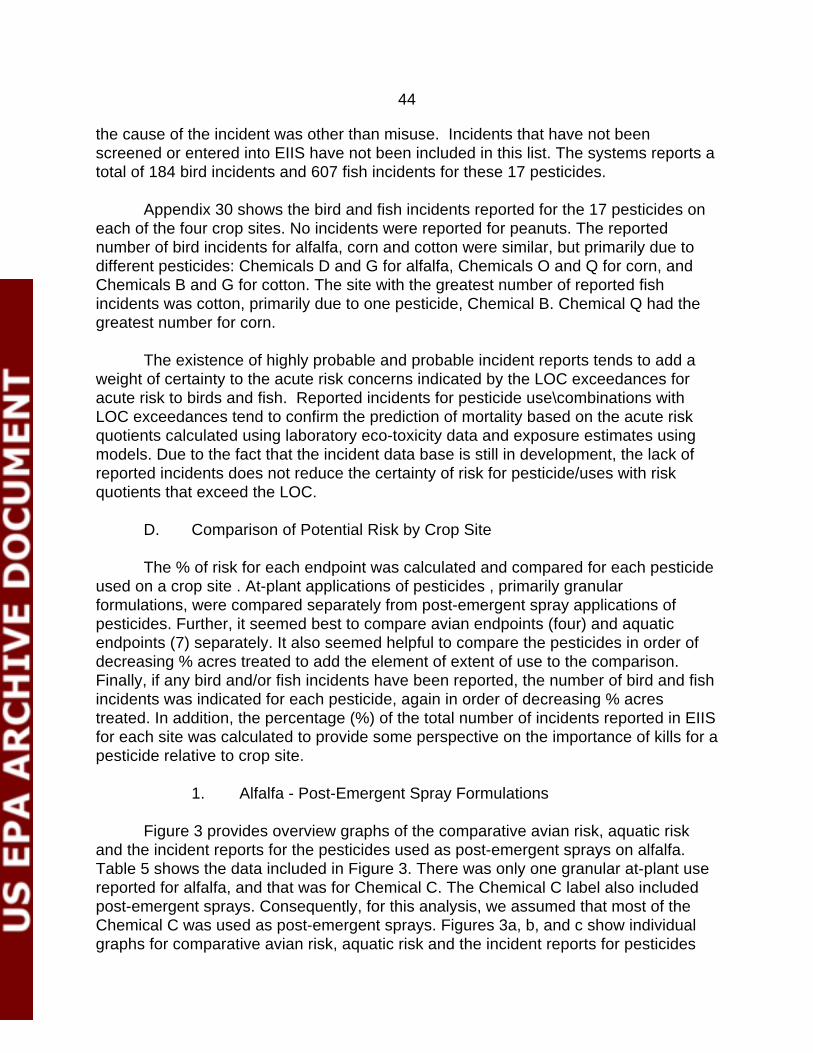
44
the cause of the incident was other than misuse. Incidents that have not beenscreened or entered into EIIS have not been included in this list. The systems reports atotal of 184 bird incidents and 607 fish incidents for these 17 pesticides.
Appendix 30 shows the bird and fish incidents reported for the 17 pesticides oneach of the four crop sites. No incidents were reported for peanuts. The reportednumber of bird incidents for alfalfa, corn and cotton were similar, but primarily due todifferent pesticides: Chemicals D and G for alfalfa, Chemicals O and Q for corn, andChemicals B and G for cotton. The site with the greatest number of reported fishincidents was cotton, primarily due to one pesticide, Chemical B. Chemical Q had thegreatest number for corn.
The existence of highly probable and probable incident reports tends to add aweight of certainty to the acute risk concerns indicated by the LOC exceedances foracute risk to birds and fish. Reported incidents for pesticide use\combinations withLOC exceedances tend to confirm the prediction of mortality based on the acute riskquotients calculated using laboratory eco-toxicity data and exposure estimates usingmodels. Due to the fact that the incident data base is still in development, the lack ofreported incidents does not reduce the certainty of risk for pesticide/uses with riskquotients that exceed the LOC.
D. Comparison of Potential Risk by Crop Site
The % of risk for each endpoint was calculated and compared for each pesticide used on a crop site . At-plant applications of pesticides , primarily granularformulations, were compared separately from post-emergent spray applications ofpesticides. Further, it seemed best to compare avian endpoints (four) and aquaticendpoints (7) separately. It also seemed helpful to compare the pesticides in order ofdecreasing % acres treated to add the element of extent of use to the comparison.Finally, if any bird and/or fish incidents have been reported, the number of bird and fishincidents was indicated for each pesticide, again in order of decreasing % acrestreated. In addition, the percentage (%) of the total number of incidents reported in EIISfor each site was calculated to provide some perspective on the importance of kills for apesticide relative to crop site.
1. Alfalfa - Post-Emergent Spray Formulations
Figure 3 provides overview graphs of the comparative avian risk, aquatic riskand the incident reports for the pesticides used as post-emergent sprays on alfalfa.Table 5 shows the data included in Figure 3. There was only one granular at-plant usereported for alfalfa, and that was for Chemical C. The Chemical C label also includedpost-emergent sprays. Consequently, for this analysis, we assumed that most of theChemical C was used as post-emergent sprays. Figures 3a, b, and c show individualgraphs for comparative avian risk, aquatic risk and the incident reports for pesticides
45
used as post-emergent sprays on alfalfa.
The total combined use for these pesticides is 4.6 million treated acres.Chemical C and Chemical D lead with greater than 20% each followed by Chemical G, Chemical I, and Chemical L at greater than 10% each.
Comparing avian risk, Chemical G leads with the greatest % avian acutebird/day risk and % avian chronic risk. Chemical L leads with the greatest % aviandietary risk. Similarly, Chemical G leads the comparative aquatic risk with the greatest% freshwater fish chronic risk, % freshwater invertebrate acute risk, and the %freshwater invertebrate chronic risk, % marine/estuarine crustacean acute risk, and %marine/estuarine mollusc acute risk. However, Chemical B has the greatest %freshwater fish acute risk, and Chemical C has the greatest % marine/estuarine fishacute risk.
Incidents have been reported for birds only, and are limited to Chemical D andChemical G. The one incident report for Chemical G is not surprising in view of the high% avian acute bird/day risk. However, the three incidents reported for Chemical D,representing 50% of bird incidents reported for Chemical D on all sites, is surprising.The % avian acute bird/day risk is comparatively very low. Additional information isneeded to attempt to characterize these incidents.
In summary for postemergent sprays on alfalfa, Chemical G stands out aspresenting the greatest potential acute and chronic risk to birds, and aquaticinvertebrates, and chronic risk to fish. The acute risk to birds appears to be supportedby and incident report. Chemical B presents the greatest acute risk to freshwater fish,Chemical C presents the greatest acute risk to marine/estuarine fish, and Chemical Lpresents the greatest dietary risk to birds. The bird incident reports raises a questionconcerning the comparatively low risk of Chemical D to birds. Overall, Chemical N,Chemical M, and Chemical P appear to be comparatively less risky than the others.
46
0%
20%
40%
60%
80%
100%
Rel
ativ
e %
CD
GI
LP
KM
BN
Pesticides
% Avian Acute Bird/Day Risk % Avian Chronic Risk
% Avian Dietary Risk % Acres Treated
Comparative Avian Risk for PesticidesUsed on Alfalfa as PostEmergent Sprays
In Order ofDecreasing %Acres Treated
(83) ( ) = MaximumRQ Values
(1259)
(113)
Combined # AcresTreated = 4.6 Million
0%
20%
40%
60%
80%
100%
Rel
ativ
e %
CD
GI
LP
KM
BN
Pesticides
% Freshwater Fish Acute Risk % Freshwater Fish Chronic Risk
% Marine/Estuarine Fish Acute Risk % Freshwater Invertebrate Acute Risk
% Freshwater Invertebrate Chronic Risk % Marine/Estuarine Crustacean Acute
% Marine/Estuarine Mollusc Acute Risk % Acres Treated
Comparative Aquatic Risk forPesticidesUsed on Alfalfa as PostEmergent Sprays
In Order ofDecreasing %Acres Treated
(49)(63)
(2154)
(9745)
( ) = MaximumRQ Values
Combined # AcresTreated = 4.6 Million(8.9) (359)
(107.7)
0
5
10
15
20
# R
epo
rted
Inci
den
ts
0%
25%
50%
75%
100%
% T
ota
l # o
f In
cid
ents
on
Alf
alfa
CD
GI
LP
KM
BN
Pesticides
# Reports - Birds % Total Reports - Birds
# Reports - Fish % Total Reports - Fish
Incident Reports for PesticidesUsed on Alfalfa as PostEmergent Sprays
Figure 3
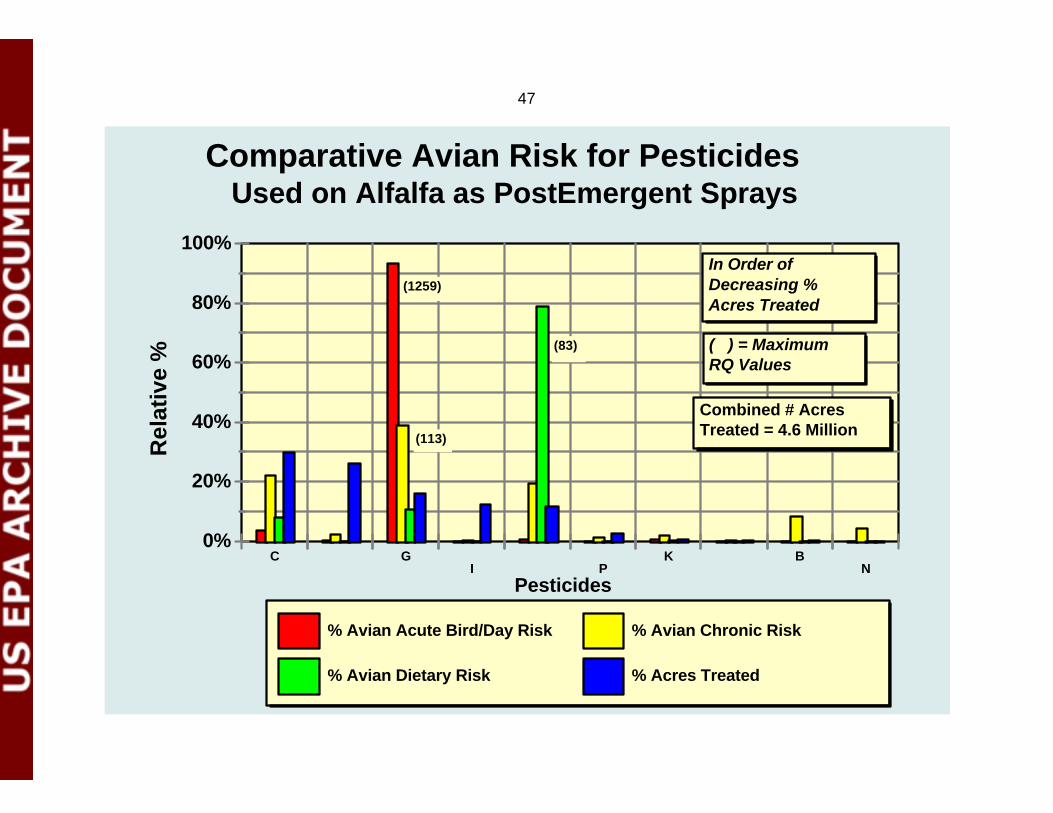
47
0%
20%
40%
60%
80%
100%
Rel
ativ
e %
C GI P
K BN
Pesticides
% Avian Acute Bird/Day Risk % Avian Chronic Risk
% Avian Dietary Risk % Acres Treated
Comparative Avian Risk for PesticidesUsed on Alfalfa as PostEmergent Sprays
In Order ofDecreasing %Acres Treated
(83) ( ) = MaximumRQ Values
(1259)
(113)
Combined # AcresTreated = 4.6 Million
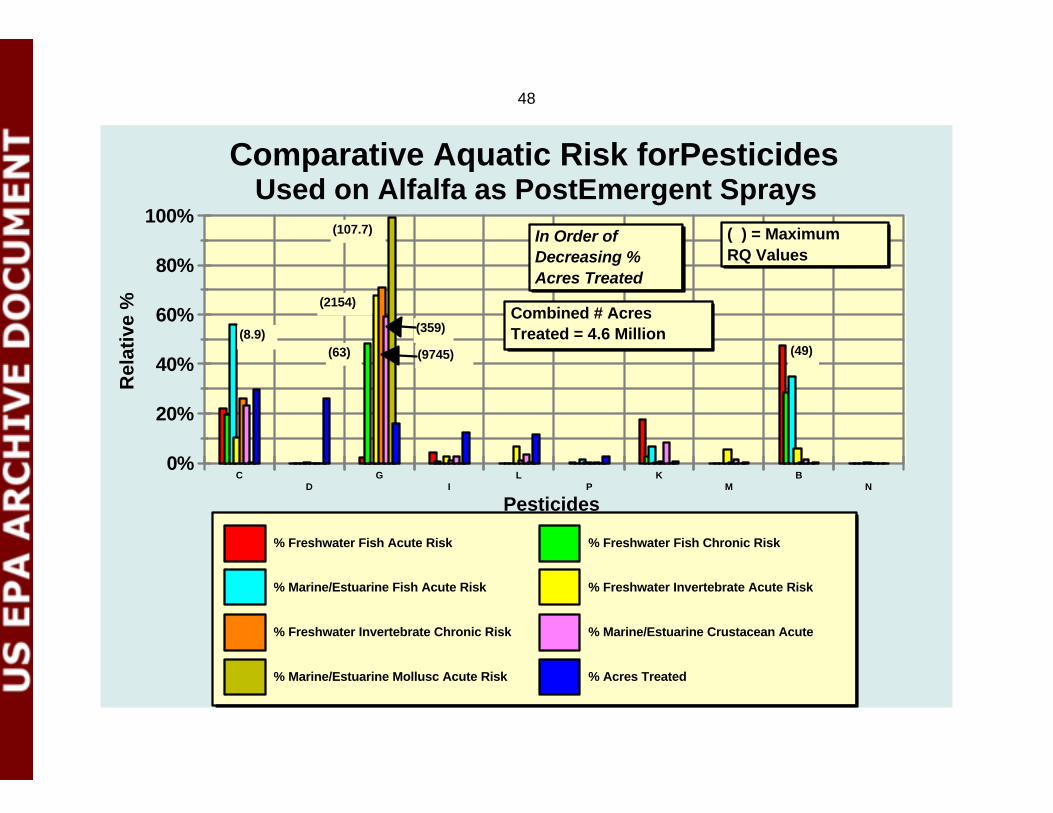
48
0%
20%
40%
60%
80%
100%
Rel
ativ
e %
CD
GI
LP
KM
BN
Pesticides
% Freshwater Fish Acute Risk % Freshwater Fish Chronic Risk
% Marine/Estuarine Fish Acute Risk % Freshwater Invertebrate Acute Risk
% Freshwater Invertebrate Chronic Risk % Marine/Estuarine Crustacean Acute
% Marine/Estuarine Mollusc Acute Risk % Acres Treated
Comparative Aquatic Risk forPesticidesUsed on Alfalfa as PostEmergent Sprays
In Order ofDecreasing %Acres Treated
(49)(63)
(2154)
(9745)
( ) = MaximumRQ Values
Combined # AcresTreated = 4.6 Million(8.9) (359)
(107.7)
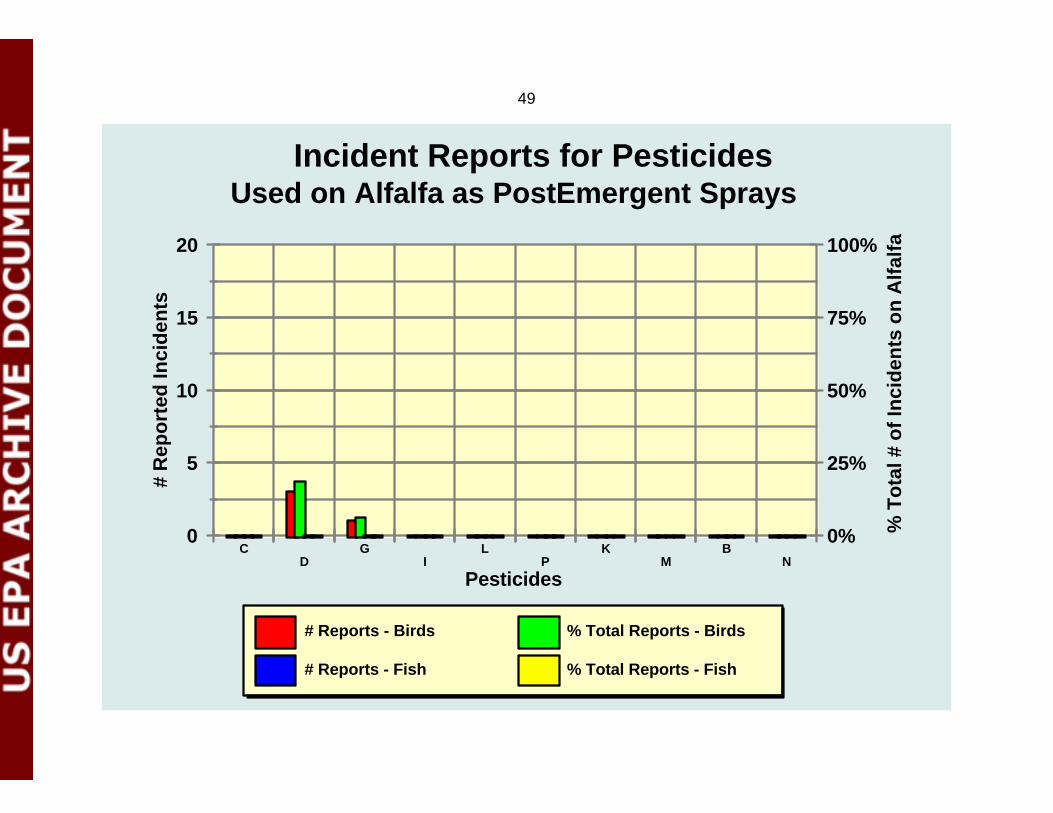
49
0
5
10
15
20
# R
epo
rted
Inci
den
ts
0%
25%
50%
75%
100%
% T
ota
l # o
f In
cid
ents
on
Alf
alfa
CD
GI
LP
KM
BN
Pesticides
# Reports - Birds % Total Reports - Birds
# Reports - Fish % Total Reports - Fish
Incident Reports for PesticidesUsed on Alfalfa as PostEmergent Sprays
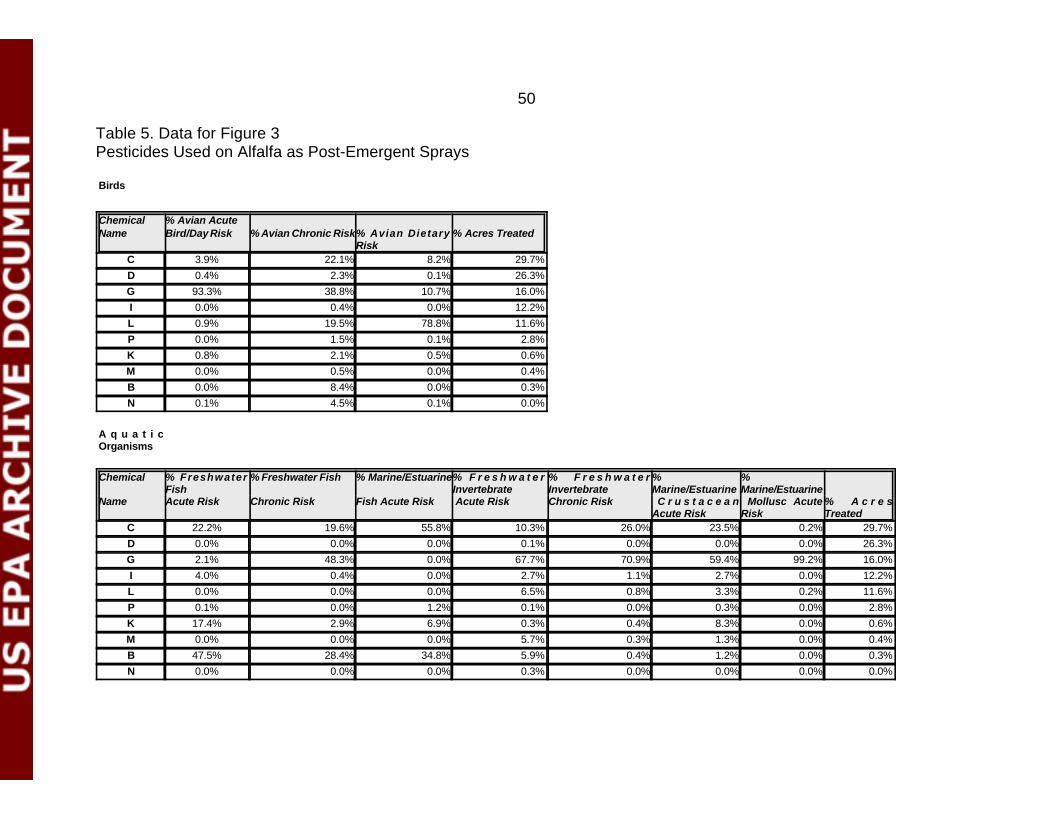
50
Table 5. Data for Figure 3Pesticides Used on Alfalfa as Post-Emergent Sprays
Birds
Chemical % Avian Acute Name Bird/Day Risk % Avian Chronic Risk% Avian Dietary
Risk% Acres Treated
C 3.9% 22.1% 8.2% 29.7%
D 0.4% 2.3% 0.1% 26.3%
G 93.3% 38.8% 10.7% 16.0%
I 0.0% 0.4% 0.0% 12.2%
L 0.9% 19.5% 78.8% 11.6%
P 0.0% 1.5% 0.1% 2.8%
K 0.8% 2.1% 0.5% 0.6%
M 0.0% 0.5% 0.0% 0.4%
B 0.0% 8.4% 0.0% 0.3%
N 0.1% 4.5% 0.1% 0.0%
A q u a t i cOrganisms
Chemical % FreshwaterFish
% Freshwater Fish % Marine/Estuarine% F r e s h w a t e rInvertebrate
% F r e s h w a t e rInvertebrate
%Marine/Estuarine
%Marine/Estuarine
Name Acute Risk Chronic Risk Fish Acute Risk Acute Risk Chronic Risk C r u s t a c e a nAcute Risk
Mollusc AcuteRisk
% A c r e sTreated
C 22.2% 19.6% 55.8% 10.3% 26.0% 23.5% 0.2% 29.7%
D 0.0% 0.0% 0.0% 0.1% 0.0% 0.0% 0.0% 26.3%
G 2.1% 48.3% 0.0% 67.7% 70.9% 59.4% 99.2% 16.0%
I 4.0% 0.4% 0.0% 2.7% 1.1% 2.7% 0.0% 12.2%
L 0.0% 0.0% 0.0% 6.5% 0.8% 3.3% 0.2% 11.6%
P 0.1% 0.0% 1.2% 0.1% 0.0% 0.3% 0.0% 2.8%
K 17.4% 2.9% 6.9% 0.3% 0.4% 8.3% 0.0% 0.6%
M 0.0% 0.0% 0.0% 5.7% 0.3% 1.3% 0.0% 0.4%
B 47.5% 28.4% 34.8% 5.9% 0.4% 1.2% 0.0% 0.3%
N 0.0% 0.0% 0.0% 0.3% 0.0% 0.0% 0.0% 0.0%
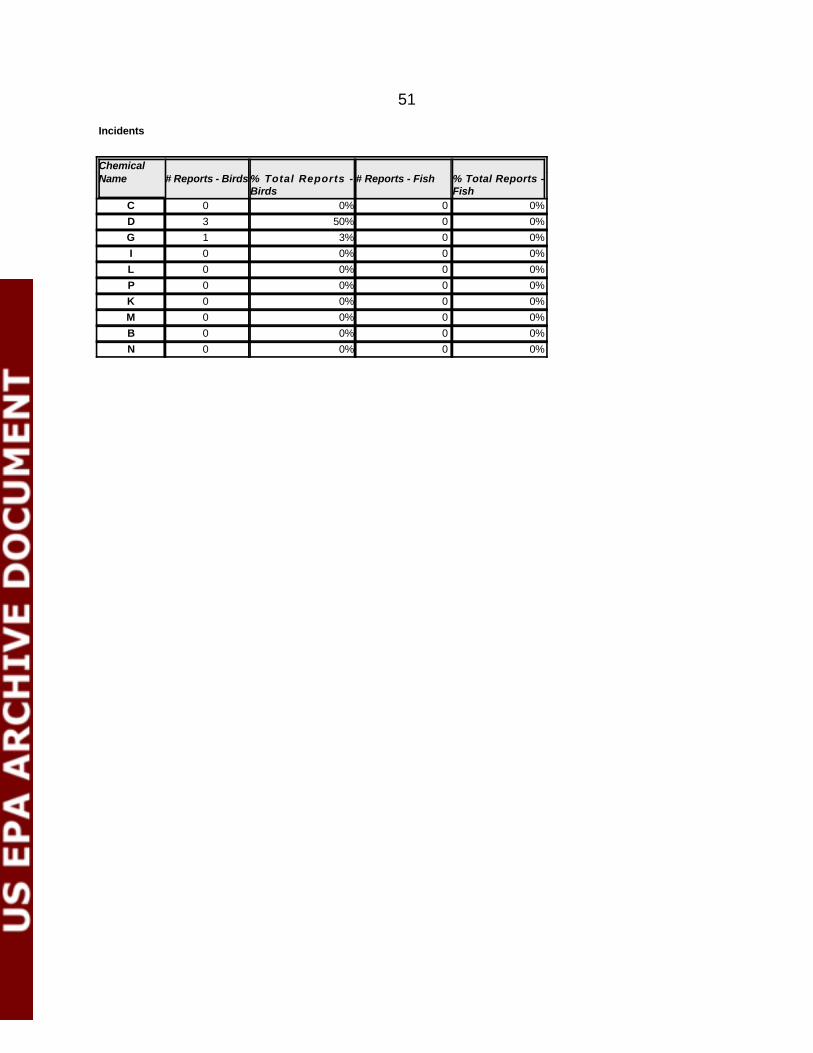
51
Incidents
Chemical Name # Reports - Birds % Total Reports -
Birds# Reports - Fish % Total Reports -
FishC 0 0% 0 0%
D 3 50% 0 0%
G 1 3% 0 0%
I 0 0% 0 0%
L 0 0% 0 0%
P 0 0% 0 0%
K 0 0% 0 0%
M 0 0% 0 0%
B 0 0% 0 0%
N 0 0% 0 0%
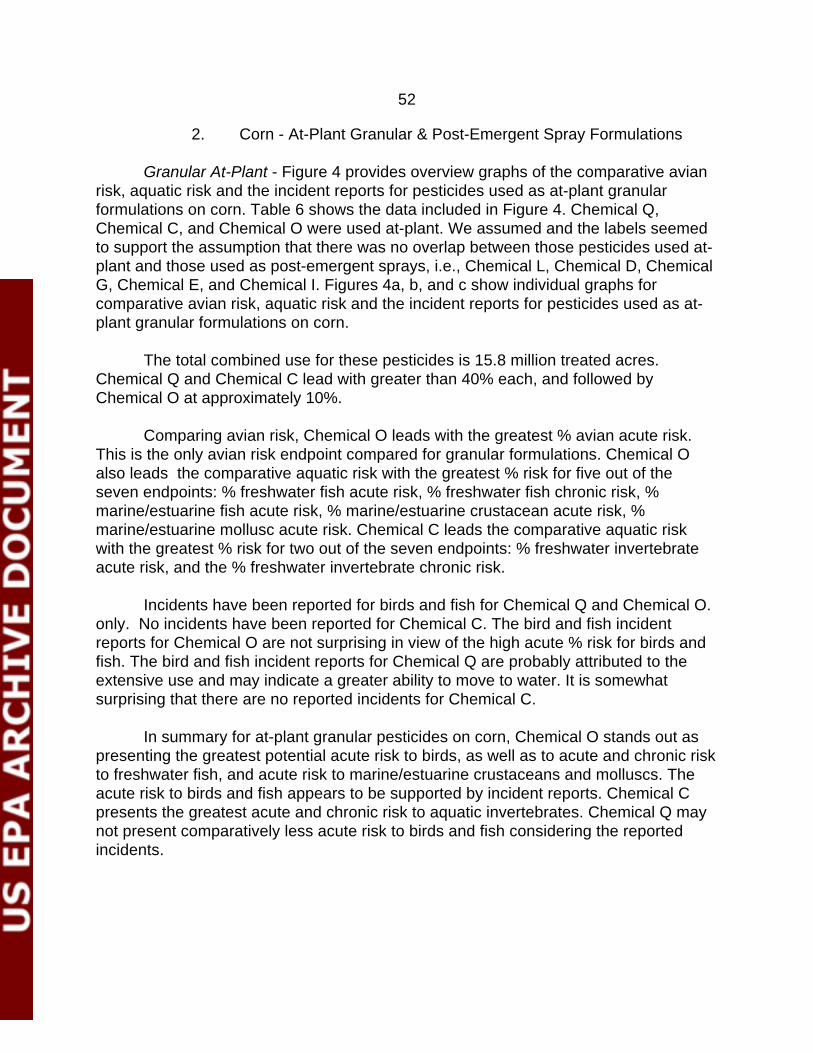
52
2. Corn - At-Plant Granular & Post-Emergent Spray Formulations
Granular At-Plant - Figure 4 provides overview graphs of the comparative avianrisk, aquatic risk and the incident reports for pesticides used as at-plant granularformulations on corn. Table 6 shows the data included in Figure 4. Chemical Q,Chemical C, and Chemical O were used at-plant. We assumed and the labels seemedto support the assumption that there was no overlap between those pesticides used at-plant and those used as post-emergent sprays, i.e., Chemical L, Chemical D, ChemicalG, Chemical E, and Chemical I. Figures 4a, b, and c show individual graphs forcomparative avian risk, aquatic risk and the incident reports for pesticides used as at-plant granular formulations on corn.
The total combined use for these pesticides is 15.8 million treated acres.Chemical Q and Chemical C lead with greater than 40% each, and followed byChemical O at approximately 10%.
Comparing avian risk, Chemical O leads with the greatest % avian acute risk.This is the only avian risk endpoint compared for granular formulations. Chemical Oalso leads the comparative aquatic risk with the greatest % risk for five out of theseven endpoints: % freshwater fish acute risk, % freshwater fish chronic risk, %marine/estuarine fish acute risk, % marine/estuarine crustacean acute risk, %marine/estuarine mollusc acute risk. Chemical C leads the comparative aquatic riskwith the greatest % risk for two out of the seven endpoints: % freshwater invertebrateacute risk, and the % freshwater invertebrate chronic risk.
Incidents have been reported for birds and fish for Chemical Q and Chemical O.only. No incidents have been reported for Chemical C. The bird and fish incidentreports for Chemical O are not surprising in view of the high acute % risk for birds andfish. The bird and fish incident reports for Chemical Q are probably attributed to theextensive use and may indicate a greater ability to move to water. It is somewhatsurprising that there are no reported incidents for Chemical C.
In summary for at-plant granular pesticides on corn, Chemical O stands out aspresenting the greatest potential acute risk to birds, as well as to acute and chronic riskto freshwater fish, and acute risk to marine/estuarine crustaceans and molluscs. Theacute risk to birds and fish appears to be supported by incident reports. Chemical Cpresents the greatest acute and chronic risk to aquatic invertebrates. Chemical Q maynot present comparatively less acute risk to birds and fish considering the reportedincidents.

53
0%
20%
40%
60%
80%
100%
Rel
ativ
e %
QC
O
% Avian Acute Risk % Acres Treated
Comparative Avian Risk for PesticidesUsed on Corn as Granular At-Plant
In Order ofDecreasing %Acres Treated (1092)
( ) = MaximumRQ Values
Combined # AcresTreated = 15.8 Million
0%
20%
40%
60%
80%
100%
Rel
ativ
e %
QC
O
% Freshwater Fish Acute Risk % Freshwater Fish Chronic Risk
% Marine/Estuarine Fish Acute Risk % Freshwater Invertebrate Acute Risk
% Freshwater Invertebrate Chronic Risk % Estuarine/Marine Crustacean Acute
% Estuarine/Marine Mollusc Risk % Acres Treated
Comparative Aquatic Risk - PesticidesUsed on Corn as Granular At-Plant
In Order ofDecreasing %Acres Treated
( ) = Maximum RQValues
Combined # AcresTreated = 15.8 Million
(92.6)
(23.8)(32.7)
(212.7)
(298.8)
(13.6)
(2682.6)
0
5
10
15
20
25
# R
epo
rted
Inci
den
ts
0%
10%
20%
30%
40%
50%
60%
70%
80%
90%
100%
'% T
ota
l # o
f In
cid
ents
on
Co
rn
QC
O
# Reports - Birds % Total Reports - Birds
# Reports - Fish % Total Reports - Fish
Incident Reports for PesticidesUsed on Corn
Figure 4
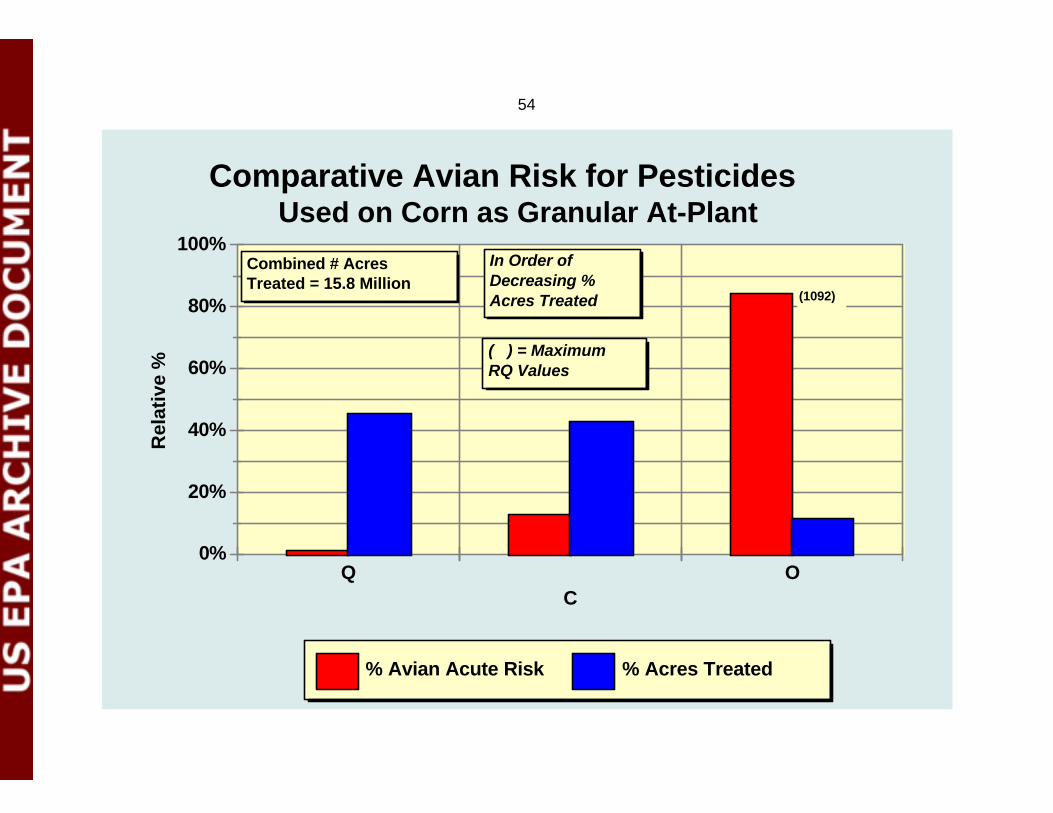
54
0%
20%
40%
60%
80%
100%
Rel
ativ
e %
QC
O
% Avian Acute Risk % Acres Treated
Comparative Avian Risk for PesticidesUsed on Corn as Granular At-Plant
In Order ofDecreasing %Acres Treated (1092)
( ) = MaximumRQ Values
Combined # AcresTreated = 15.8 Million
55
0%
20%
40%
60%
80%
100%
Rel
ativ
e %
QC
O
% Freshwater Fish Acute Risk % Freshwater Fish Chronic Risk
% Marine/Estuarine Fish Acute Risk % Freshwater Invertebrate Acute Risk
% Freshwater Invertebrate Chronic Risk % Estuarine/Marine Crustacean Acute
% Estuarine/Marine Mollusc Risk % Acres Treated
Comparative Aquatic Risk - PesticidesUsed on Corn as Granular At-Plant
In Order ofDecreasing %Acres Treated
( ) = Maximum RQValues
Combined # AcresTreated = 15.8 Million
(92.6)
(23.8)(32.7)
(212.7)
(298.8)
(13.6)
(2682.6)
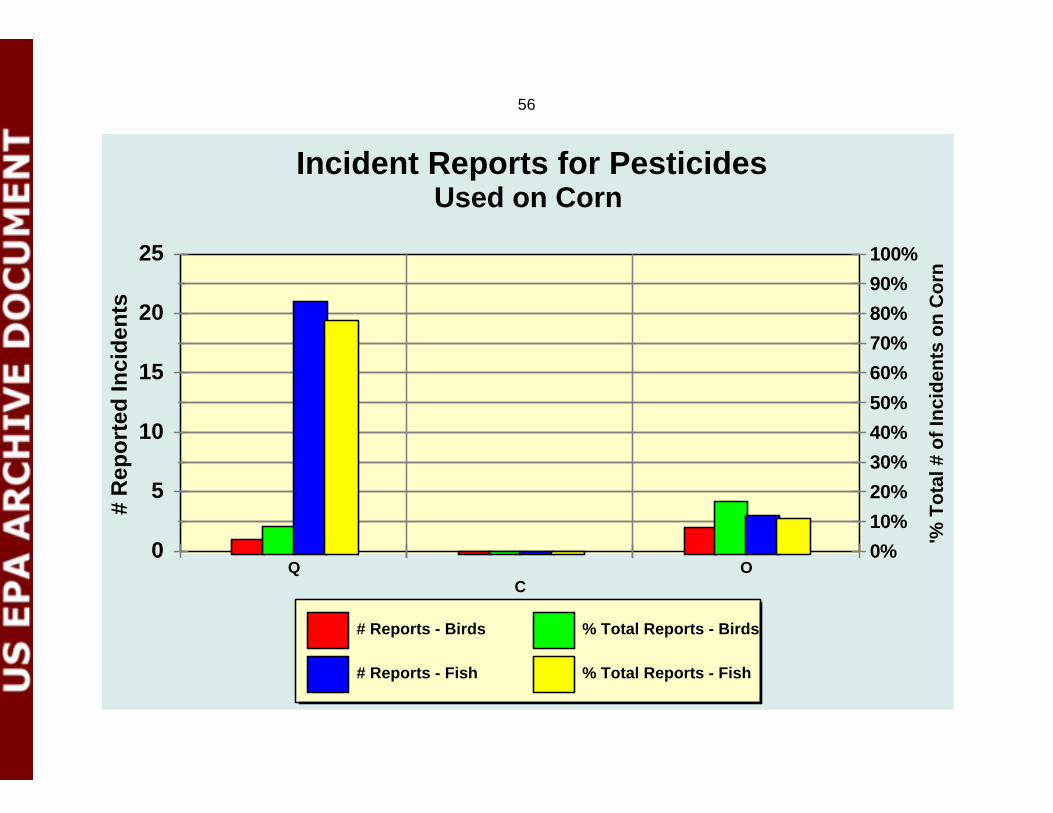
56
0
5
10
15
20
25
# R
epo
rted
Inci
den
ts
0%
10%
20%
30%
40%
50%
60%
70%
80%
90%
100%
'% T
ota
l # o
f In
cid
ents
on
Co
rn
QC
O
# Reports - Birds % Total Reports - Birds
# Reports - Fish % Total Reports - Fish
Incident Reports for PesticidesUsed on Corn
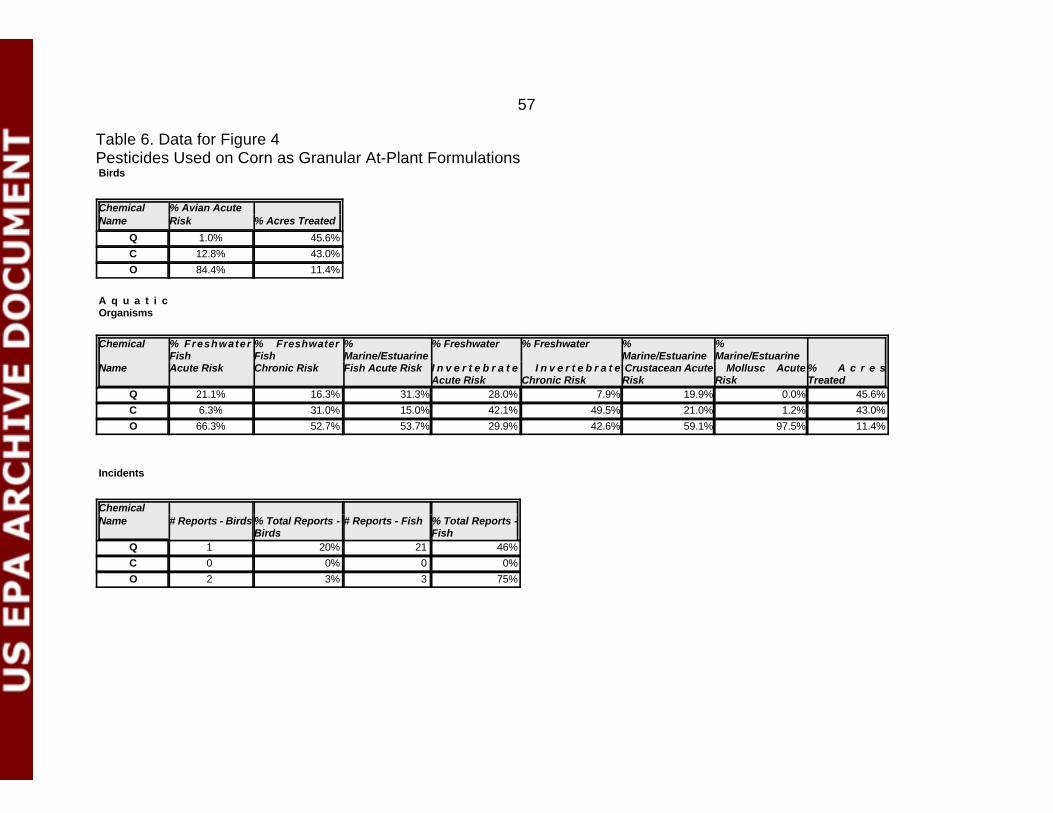
57
Table 6. Data for Figure 4Pesticides Used on Corn as Granular At-Plant FormulationsBirds
Chemical % Avian Acute Name Risk % Acres Treated
Q 1.0% 45.6%
C 12.8% 43.0%
O 84.4% 11.4%
A q u a t i cOrganisms
Chemical % FreshwaterFish
% FreshwaterFish
%Marine/Estuarine
% Freshwater % Freshwater %Marine/Estuarine
%Marine/Estuarine
Name Acute Risk Chronic Risk Fish Acute Risk I n v e r t e b r a t eAcute Risk
I n v e r t e b r a t eChronic Risk
Crustacean AcuteRisk
Mollusc AcuteRisk
% A c r e sTreated
Q 21.1% 16.3% 31.3% 28.0% 7.9% 19.9% 0.0% 45.6%
C 6.3% 31.0% 15.0% 42.1% 49.5% 21.0% 1.2% 43.0%
O 66.3% 52.7% 53.7% 29.9% 42.6% 59.1% 97.5% 11.4%
Incidents
Chemical Name # Reports - Birds % Total Reports -
Birds# Reports - Fish % Total Reports -
FishQ 1 20% 21 46%
C 0 0% 0 0%
O 2 3% 3 75%
58
Post-Emergent Sprays - Figure 5 provides overview graphs of the comparativeavian risk, aquatic risk and the incident reports for pesticides used as post-emergentsprays on corn. Table 7 shows the data included in Figure 5. Chemical L, Chemical D,Chemical G, Chemical E, and Chemical I were used post-emergent sprays. Figures 5aand b show individual graphs for comparative avian risk and aquatic risk for pesticidesused as post-emergent sprays on corn. No incidents have been reported for any of thepesticides used as post-emergent sprays on corn.
The total combined use for these pesticides is 2.6 million treated acres.Chemical L leads with greater than 50%, and followed by Chemical D at 20% andChemical G at slightly less than 20%.
Comparing avian risk, Chemical G leads with the greatest % avian acute andchronic risk. Chemical L leads with the greatest % avian dietary risk. Chemical G alsoleads the comparative aquatic risk with the greatest % risk for five out of the sevenendpoints: % freshwater fish chronic risk, % freshwater invertebrate acute risk, %freshwater invertebrate chronic risk, % marine/estuarine crustacean acute risk, %marine/estuarine mollusc acute risk. Chemical I leads the comparative aquatic risk withthe greatest % risk for two out of the seven endpoints: % freshwater fish acute risk, %marine/estuarine fish acute risk. It is important to note that the maximum RQ value forthe latter is only 0.6, just exceeding the LOC of 0.5.
In summary for post-emergent sprays on corn, Chemical G stands out aspresenting the greatest potential acute and chronic risk to birds, as well as to acute andchronic risk to freshwater invertebrates, and acute risk to marine/estuarine crustaceansand molluscs. Chemical L presents the greatest potential avian dietary risk, andChemical I the same for freshwater fish. Overall, Chemical D and Chemical E appear tobe comparatively less risky than the others.
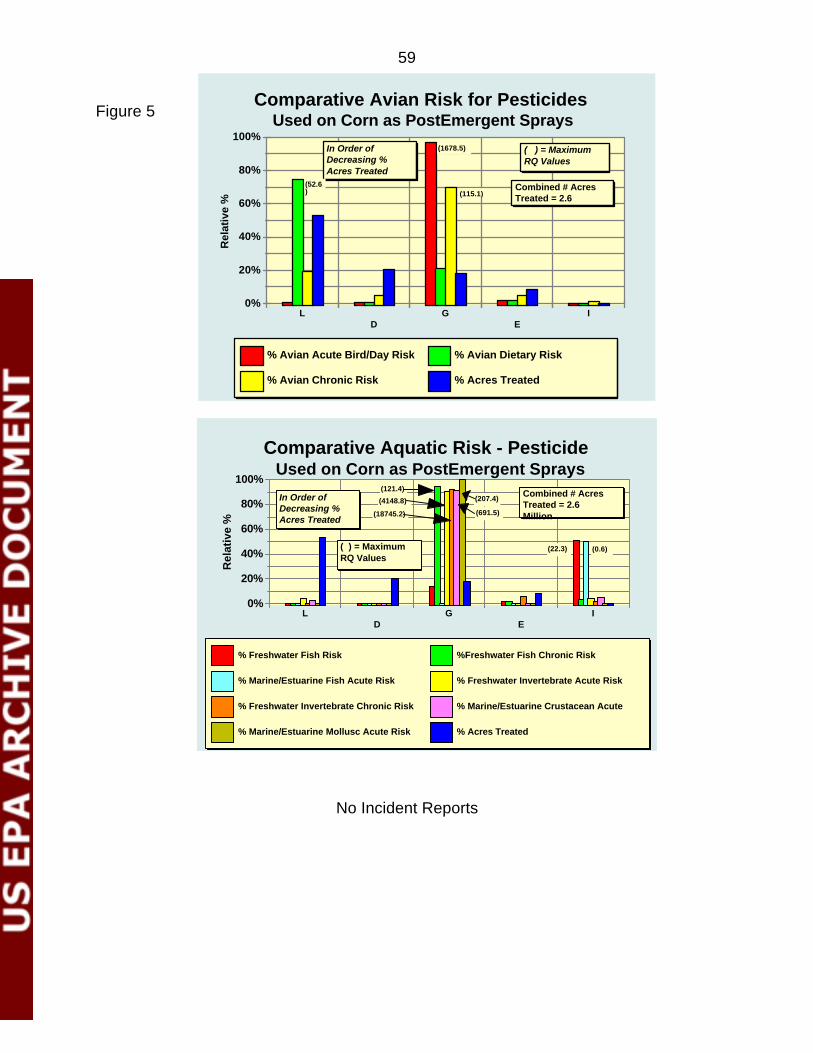
59
0%
20%
40%
60%
80%
100%
Rel
ativ
e %
LD
GE
I
% Avian Acute Bird/Day Risk % Avian Dietary Risk
% Avian Chronic Risk % Acres Treated
Comparative Avian Risk for PesticidesUsed on Corn as PostEmergent Sprays
(1678.5)In Order ofDecreasing %Acres Treated
(52.6) (115.1)
( ) = MaximumRQ Values
Combined # AcresTreated = 2.6
0%
20%
40%
60%
80%
100%
Rel
ativ
e %
LD
GE
I
% Freshwater Fish Risk %Freshwater Fish Chronic Risk
% Marine/Estuarine Fish Acute Risk % Freshwater Invertebrate Acute Risk
% Freshwater Invertebrate Chronic Risk % Marine/Estuarine Crustacean Acute
% Marine/Estuarine Mollusc Acute Risk % Acres Treated
Comparative Aquatic Risk - PesticideUsed on Corn as PostEmergent Sprays
In Order ofDecreasing %Acres Treated
( ) = MaximumRQ Values
Combined # AcresTreated = 2.6Million
(22.3) (0.6)
(18745.2)
(4148.8)
(121.4)(207.4)
(691.5)
Figure 5
No Incident Reports
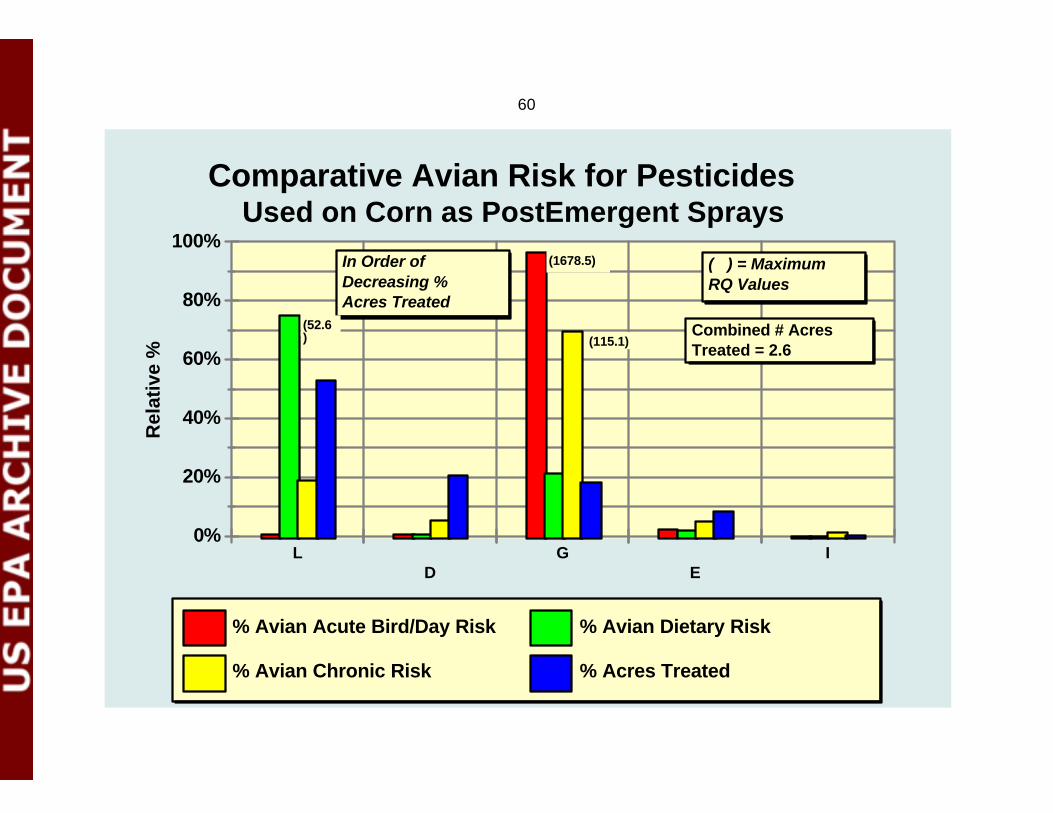
60
0%
20%
40%
60%
80%
100%
Rel
ativ
e %
LD
GE
I
% Avian Acute Bird/Day Risk % Avian Dietary Risk
% Avian Chronic Risk % Acres Treated
Comparative Avian Risk for PesticidesUsed on Corn as PostEmergent Sprays
(1678.5)In Order ofDecreasing %Acres Treated
(52.6) (115.1)
( ) = MaximumRQ Values
Combined # AcresTreated = 2.6
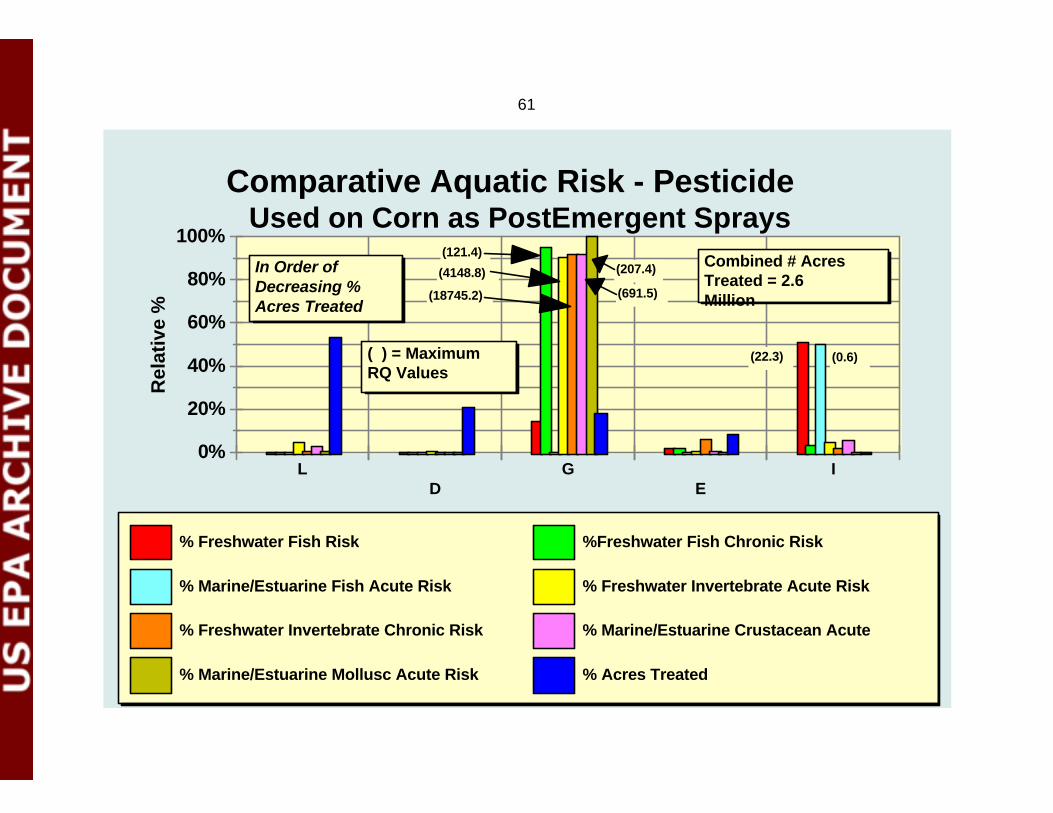
61
0%
20%
40%
60%
80%
100%
Rel
ativ
e %
LD
GE
I
% Freshwater Fish Risk %Freshwater Fish Chronic Risk
% Marine/Estuarine Fish Acute Risk % Freshwater Invertebrate Acute Risk
% Freshwater Invertebrate Chronic Risk % Marine/Estuarine Crustacean Acute
% Marine/Estuarine Mollusc Acute Risk % Acres Treated
Comparative Aquatic Risk - PesticideUsed on Corn as PostEmergent Sprays
In Order ofDecreasing %Acres Treated
( ) = MaximumRQ Values
Combined # AcresTreated = 2.6Million
(22.3) (0.6)
(18745.2)
(4148.8)
(121.4)(207.4)
(691.5)
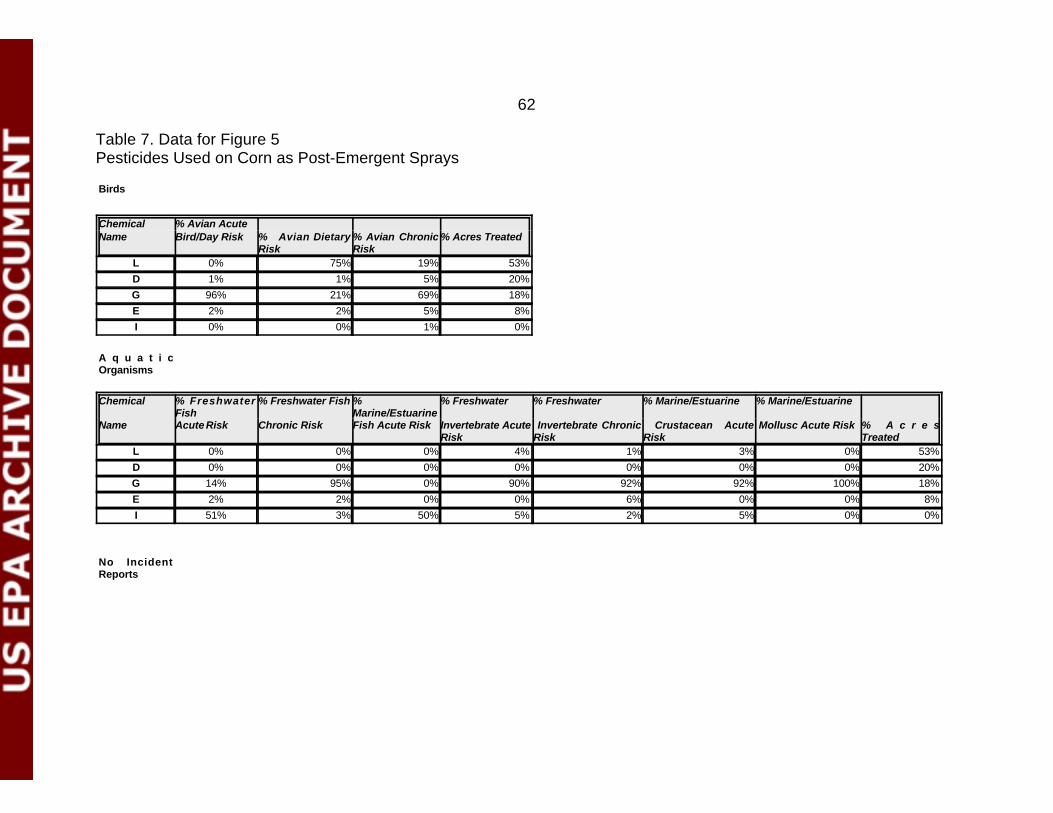
62
Table 7. Data for Figure 5Pesticides Used on Corn as Post-Emergent Sprays
Birds
Chemical % Avian Acute Name Bird/Day Risk % Avian Dietary
Risk% Avian ChronicRisk
% Acres Treated
L 0% 75% 19% 53%
D 1% 1% 5% 20%
G 96% 21% 69% 18%
E 2% 2% 5% 8%
I 0% 0% 1% 0%
A q u a t i cOrganisms
Chemical % FreshwaterFish
% Freshwater Fish %Marine/Estuarine
% Freshwater % Freshwater % Marine/Estuarine % Marine/Estuarine
Name Acute Risk Chronic Risk Fish Acute Risk Invertebrate AcuteRisk
Invertebrate ChronicRisk
Crustacean AcuteRisk
Mollusc Acute Risk % A c r e sTreated
L 0% 0% 0% 4% 1% 3% 0% 53%
D 0% 0% 0% 0% 0% 0% 0% 20%
G 14% 95% 0% 90% 92% 92% 100% 18%
E 2% 2% 0% 0% 6% 0% 0% 8%
I 51% 3% 50% 5% 2% 5% 0% 0%
No IncidentReports
63
3. Cotton - At-Plant Granular & Post-Emergent Spray Formulations
Granular At-Plant - Figure 6 provides overview graphs of the comparative avianrisk, aquatic risk and the incident reports for pesticides used as at-plant granularformulations on cotton. Table 8 shows the data included in Figure 6. Chemical A,Chemical E, Chemical O, and Chemical H were used at-plant. We assumed and thelabels seemed to support the assumption that there was no overlap with the use ofChemical O and Chemical H at-plant and those Chemicals used as post-emergentsprays. However, the remaining Chemicals used on cotton had labels for both at-plantand post-emergent sprays. There was no information separating use by formulationand timing of application. Total use figures were used for both at-plant and post-emergent sprays. Figures 6a and b show individual graphs for comparative avian riskand aquatic risk for pesticides used as at-plant granular formulations on cotton. Therewere no incident reports for pesticides used at-plant on cotton.
The total combined use for these pesticides is 2.8 million treated acres.Chemical A leads with 60%. Chemical E follows with 22%, and Chemical O is third with15%.
Comparing avian risk, Chemical O leads with the greatest % avian acute risk.This is the only avian risk endpoint compared for granular formulations. Chemical Oalso leads the comparative aquatic risk with the greatest % risk for five out of theseven endpoints: % freshwater fish acute risk, % freshwater fish chronic risk, %marine/estuarine fish acute risk, % marine/estuarine crustacean acute risk, %marine/estuarine mollusc acute risk. Chemical H leads the comparative aquatic riskwith the greatest % risk for the % freshwater invertebrate acute risk, while Chemical Eleads with the greatest % risk for freshwater invertebrate chronic risk.
In summary for at-plant granular pesticides on cotton, Chemical O stands out aspresenting the greatest potential acute risk to birds, as well as to acute and chronic riskto freshwater fish, and acute risk to marine/estuarine crustaceans and molluscs.Chemical H and Chemical E present the greatest risk freshwater to invertebrates, acuteand chronic risk respectively. Overall, Chemical A appears to present comparativelyless acute risk to birds and fish.
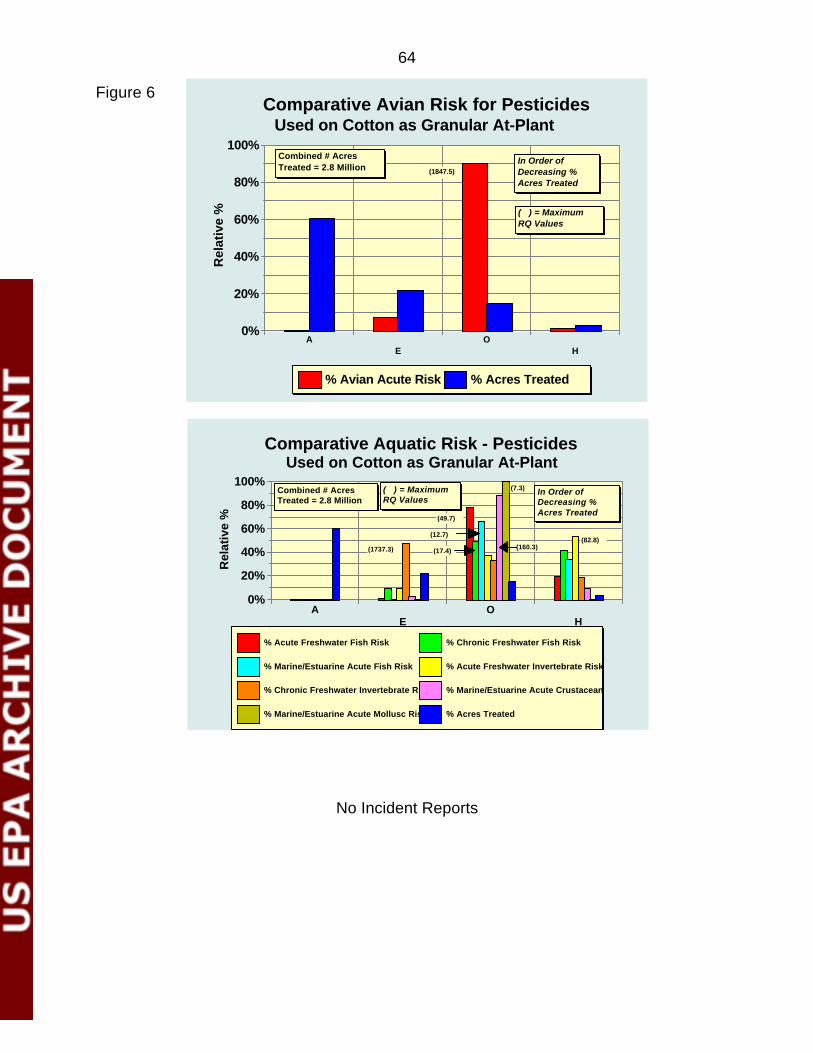
64
0%
20%
40%
60%
80%
100%
Rel
ativ
e %
AE
OH
% Avian Acute Risk % Acres Treated
Comparative Avian Risk for PesticidesUsed on Cotton as Granular At-Plant
Combined # AcresTreated = 2.8 Million
In Order ofDecreasing %Acres Treated
( ) = MaximumRQ Values
(1847.5)
0%
20%
40%
60%
80%
100%
Rel
ativ
e %
AE
OH
% Acute Freshwater Fish Risk % Chronic Freshwater Fish Risk
% Marine/Estuarine Acute Fish Risk % Acute Freshwater Invertebrate Risk
% Chronic Freshwater Invertebrate Risk % Marine/Estuarine Acute Crustacean
% Marine/Estuarine Acute Mollusc Risk % Acres Treated
Comparative Aquatic Risk - PesticidesUsed on Cotton as Granular At-Plant
Combined # AcresTreated = 2.8 Million
In Order ofDecreasing %Acres Treated
( ) = MaximumRQ Values
(1737.3)
(49.7)
(17.4)
(12.7)
(160.3)
(7.3)
(82.8)
Figure 6
No Incident Reports
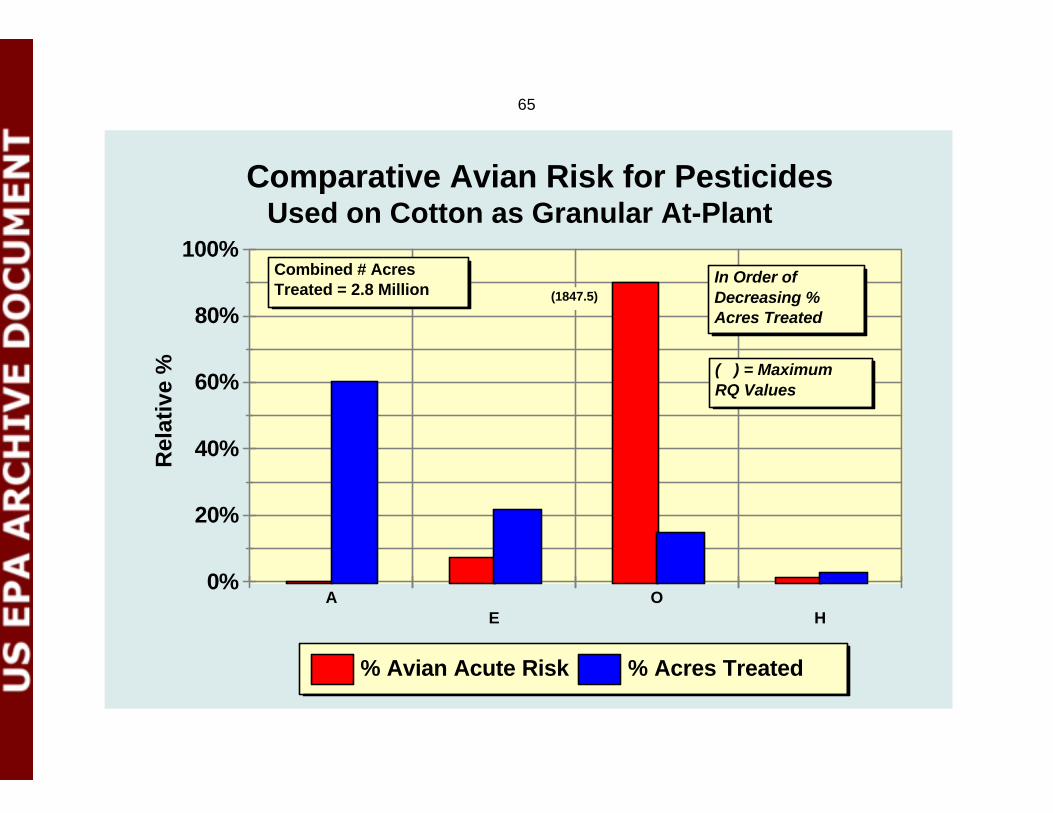
65
0%
20%
40%
60%
80%
100%
Rel
ativ
e %
AE
OH
% Avian Acute Risk % Acres Treated
Comparative Avian Risk for PesticidesUsed on Cotton as Granular At-Plant
Combined # AcresTreated = 2.8 Million
In Order ofDecreasing %Acres Treated
( ) = MaximumRQ Values
(1847.5)
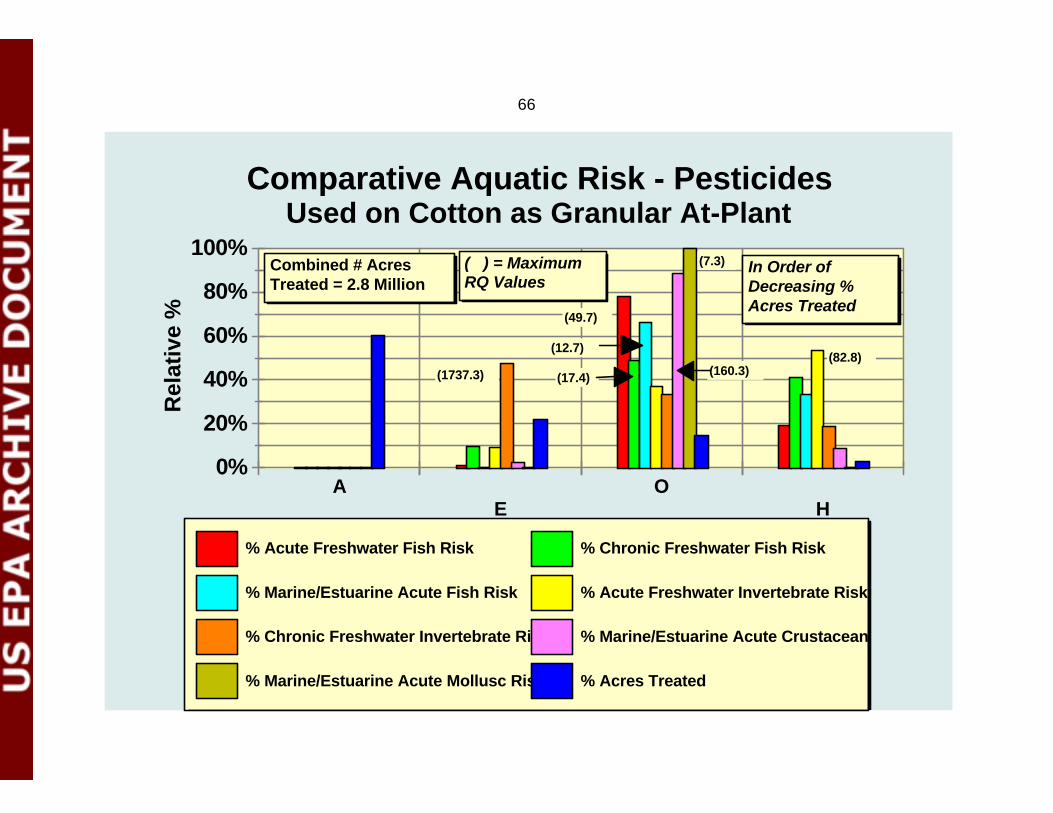
66
0%
20%
40%
60%
80%
100%
Rel
ativ
e %
AE
OH
% Acute Freshwater Fish Risk % Chronic Freshwater Fish Risk
% Marine/Estuarine Acute Fish Risk % Acute Freshwater Invertebrate Risk
% Chronic Freshwater Invertebrate Risk % Marine/Estuarine Acute Crustacean
% Marine/Estuarine Acute Mollusc Risk % Acres Treated
Comparative Aquatic Risk - PesticidesUsed on Cotton as Granular At-Plant
Combined # AcresTreated = 2.8 Million
In Order ofDecreasing %Acres Treated
( ) = MaximumRQ Values
(1737.3)
(49.7)
(17.4)
(12.7)
(160.3)
(7.3)
(82.8)
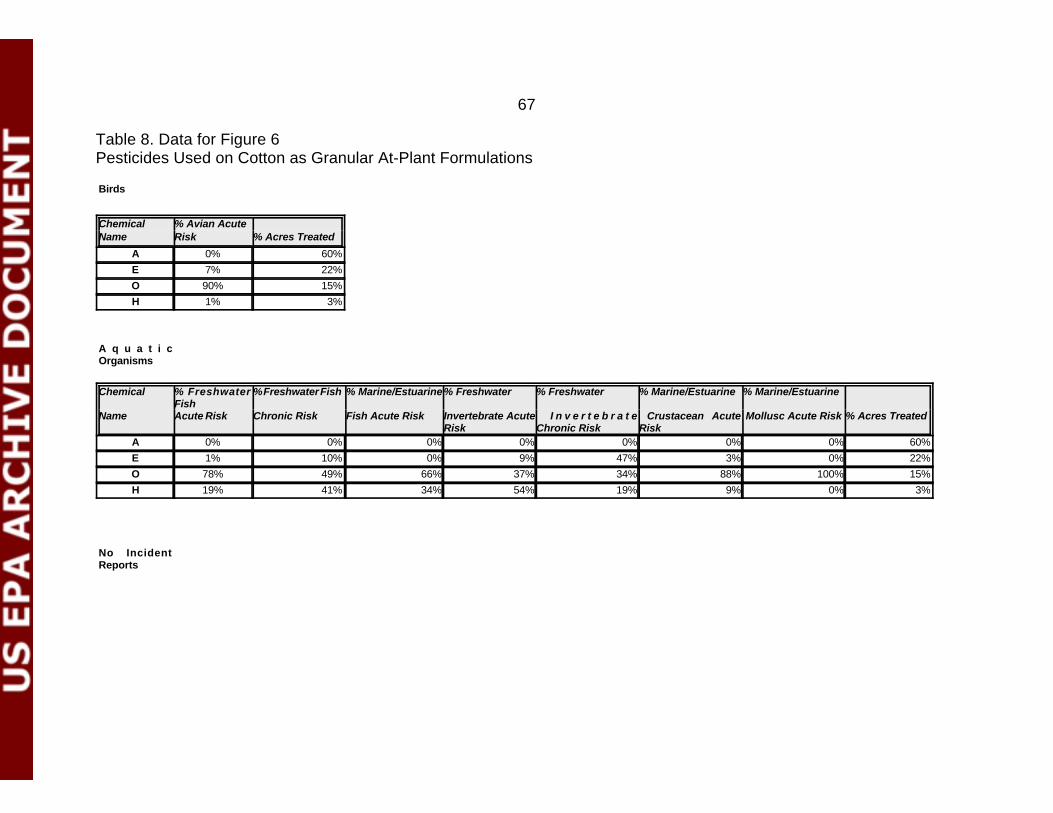
67
Table 8. Data for Figure 6Pesticides Used on Cotton as Granular At-Plant Formulations
Birds
Chemical % Avian Acute Name Risk % Acres Treated
A 0% 60%
E 7% 22%
O 90% 15%
H 1% 3%
A q u a t i cOrganisms
Chemical % FreshwaterFish
% Freshwater Fish % Marine/Estuarine% Freshwater % Freshwater % Marine/Estuarine % Marine/Estuarine
Name Acute Risk Chronic Risk Fish Acute Risk Invertebrate AcuteRisk
I n v e r t e b r a t eChronic Risk
Crustacean AcuteRisk
Mollusc Acute Risk % Acres Treated
A 0% 0% 0% 0% 0% 0% 0% 60%
E 1% 10% 0% 9% 47% 3% 0% 22%
O 78% 49% 66% 37% 34% 88% 100% 15%
H 19% 41% 34% 54% 19% 9% 0% 3%
No IncidentReports
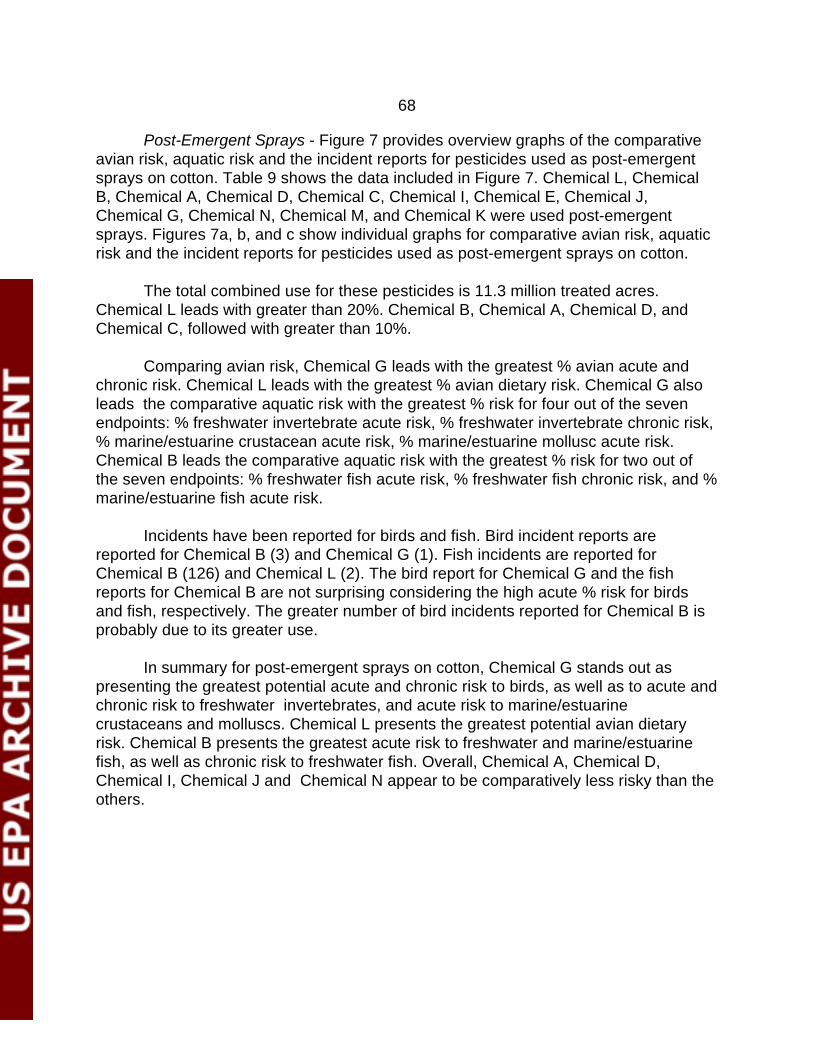
68
Post-Emergent Sprays - Figure 7 provides overview graphs of the comparativeavian risk, aquatic risk and the incident reports for pesticides used as post-emergentsprays on cotton. Table 9 shows the data included in Figure 7. Chemical L, ChemicalB, Chemical A, Chemical D, Chemical C, Chemical I, Chemical E, Chemical J,Chemical G, Chemical N, Chemical M, and Chemical K were used post-emergentsprays. Figures 7a, b, and c show individual graphs for comparative avian risk, aquaticrisk and the incident reports for pesticides used as post-emergent sprays on cotton.
The total combined use for these pesticides is 11.3 million treated acres.Chemical L leads with greater than 20%. Chemical B, Chemical A, Chemical D, and Chemical C, followed with greater than 10%.
Comparing avian risk, Chemical G leads with the greatest % avian acute andchronic risk. Chemical L leads with the greatest % avian dietary risk. Chemical G alsoleads the comparative aquatic risk with the greatest % risk for four out of the sevenendpoints: % freshwater invertebrate acute risk, % freshwater invertebrate chronic risk,% marine/estuarine crustacean acute risk, % marine/estuarine mollusc acute risk.Chemical B leads the comparative aquatic risk with the greatest % risk for two out ofthe seven endpoints: % freshwater fish acute risk, % freshwater fish chronic risk, and %marine/estuarine fish acute risk.
Incidents have been reported for birds and fish. Bird incident reports arereported for Chemical B (3) and Chemical G (1). Fish incidents are reported for Chemical B (126) and Chemical L (2). The bird report for Chemical G and the fishreports for Chemical B are not surprising considering the high acute % risk for birdsand fish, respectively. The greater number of bird incidents reported for Chemical B isprobably due to its greater use.
In summary for post-emergent sprays on cotton, Chemical G stands out aspresenting the greatest potential acute and chronic risk to birds, as well as to acute andchronic risk to freshwater invertebrates, and acute risk to marine/estuarinecrustaceans and molluscs. Chemical L presents the greatest potential avian dietaryrisk. Chemical B presents the greatest acute risk to freshwater and marine/estuarinefish, as well as chronic risk to freshwater fish. Overall, Chemical A, Chemical D,Chemical I, Chemical J and Chemical N appear to be comparatively less risky than theothers.
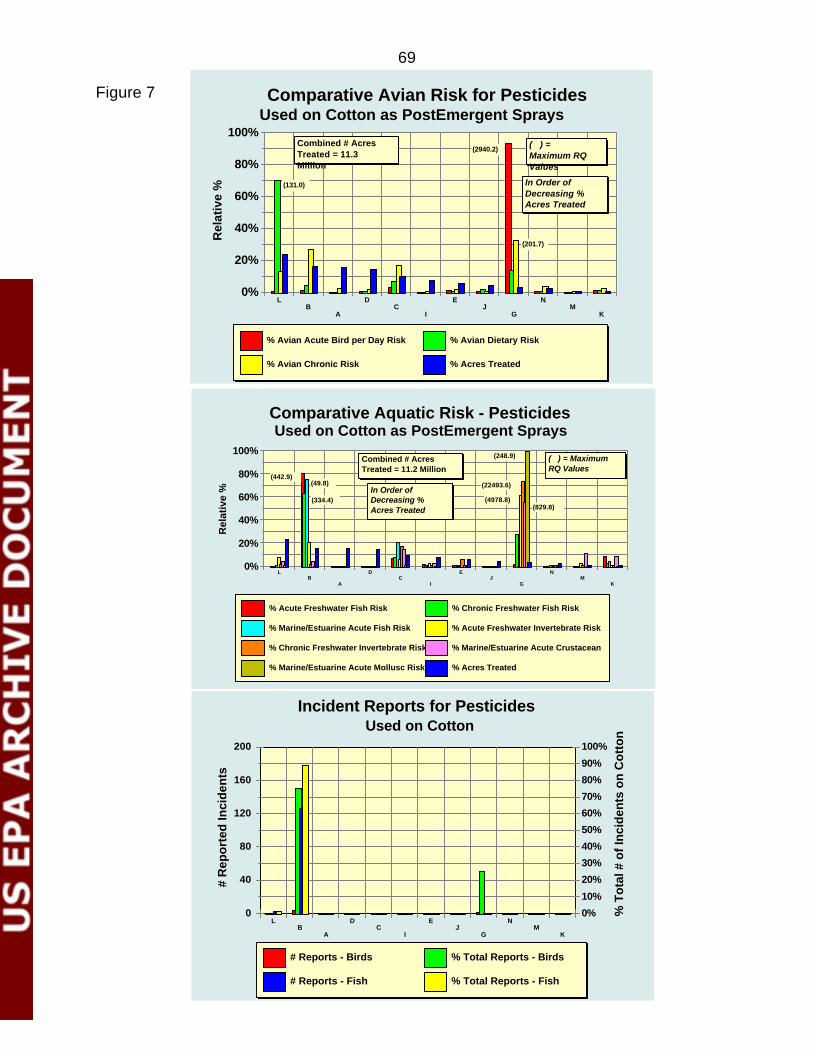
69
0%
20%
40%
60%
80%
100%
Rel
ativ
e %
LB
A
DC
I
EJ
G
NM
K
% Avian Acute Bird per Day Risk % Avian Dietary Risk
% Avian Chronic Risk % Acres Treated
Comparative Avian Risk for PesticidesUsed on Cotton as PostEmergent Sprays
Combined # AcresTreated = 11.3Million
( ) =Maximum RQValues
In Order ofDecreasing %Acres Treated
(131.0)
(2940.2)
(201.7)
0%
20%
40%
60%
80%
100%
Rel
ativ
e %
LB
A
DC
I
EJ
G
NM
K
% Acute Freshwater Fish Risk % Chronic Freshwater Fish Risk
% Marine/Estuarine Acute Fish Risk % Acute Freshwater Invertebrate Risk
% Chronic Freshwater Invertebrate Risk % Marine/Estuarine Acute Crustacean
% Marine/Estuarine Acute Mollusc Risk % Acres Treated
Comparative Aquatic Risk - PesticidesUsed on Cotton as PostEmergent Sprays
Combined # AcresTreated = 11.2 Million
( ) = MaximumRQ Values
In Order ofDecreasing %Acres Treated
(442.9)
(334.4)
(49.8)
(4978.8)
(22493.6)
(829.8)
(248.9)
0
40
80
120
160
200
# R
epo
rted
Inci
den
ts
0%
10%
20%
30%
40%
50%
60%
70%
80%
90%
100%
% T
ota
l # o
f In
cid
ents
on
Co
tto
n
LB
A
DC
I
EJ
G
NM
K
# Reports - Birds % Total Reports - Birds
# Reports - Fish % Total Reports - Fish
Incident Reports for PesticidesUsed on Cotton
Figure 7
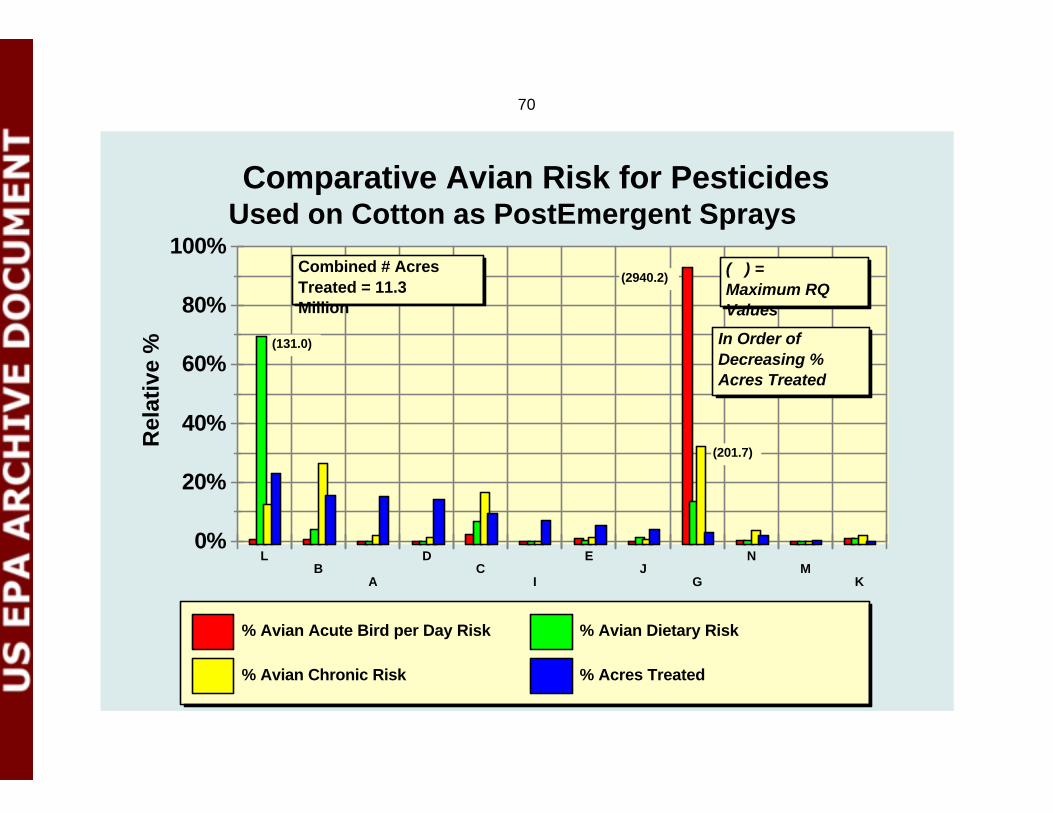
70
0%
20%
40%
60%
80%
100%
Rel
ativ
e %
LB
A
DC
I
EJ
G
NM
K
% Avian Acute Bird per Day Risk % Avian Dietary Risk
% Avian Chronic Risk % Acres Treated
Comparative Avian Risk for PesticidesUsed on Cotton as PostEmergent Sprays
Combined # AcresTreated = 11.3Million
( ) =Maximum RQValues
In Order ofDecreasing %Acres Treated
(131.0)
(2940.2)
(201.7)
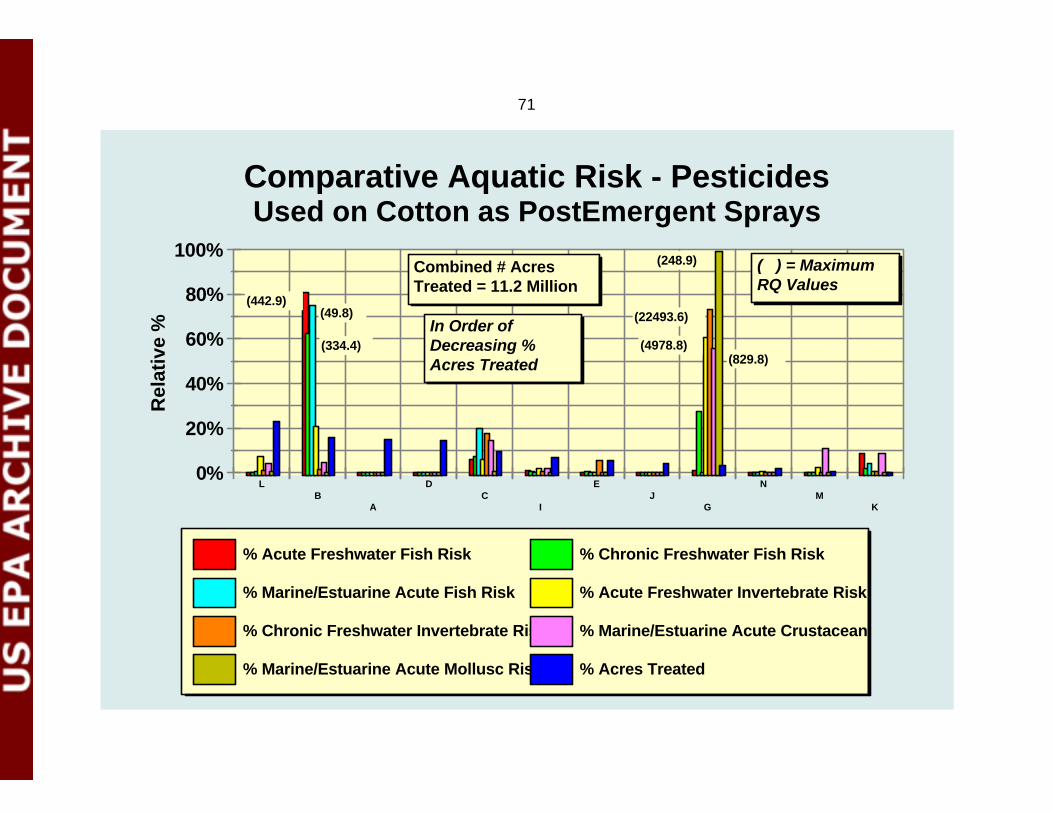
71
0%
20%
40%
60%
80%
100%
Rel
ativ
e %
LB
A
DC
I
EJ
G
NM
K
% Acute Freshwater Fish Risk % Chronic Freshwater Fish Risk
% Marine/Estuarine Acute Fish Risk % Acute Freshwater Invertebrate Risk
% Chronic Freshwater Invertebrate Risk % Marine/Estuarine Acute Crustacean
% Marine/Estuarine Acute Mollusc Risk % Acres Treated
Comparative Aquatic Risk - PesticidesUsed on Cotton as PostEmergent Sprays
Combined # AcresTreated = 11.2 Million
( ) = MaximumRQ Values
In Order ofDecreasing %Acres Treated
(442.9)
(334.4)
(49.8)
(4978.8)
(22493.6)
(829.8)
(248.9)
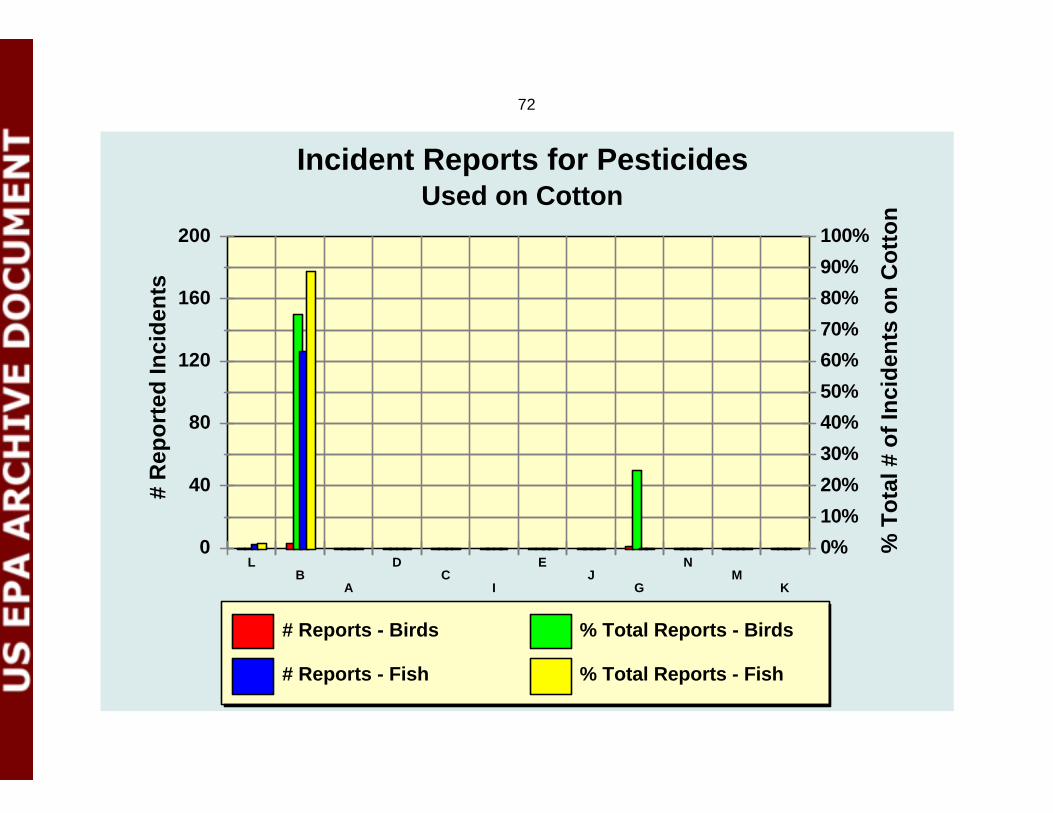
72
0
40
80
120
160
200
# R
epo
rted
Inci
den
ts
0%
10%
20%
30%
40%
50%
60%
70%
80%
90%
100%
% T
ota
l # o
f In
cid
ents
on
Co
tto
n
LB
A
DC
I
EJ
G
NM
K
# Reports - Birds % Total Reports - Birds
# Reports - Fish % Total Reports - Fish
Incident Reports for PesticidesUsed on Cotton
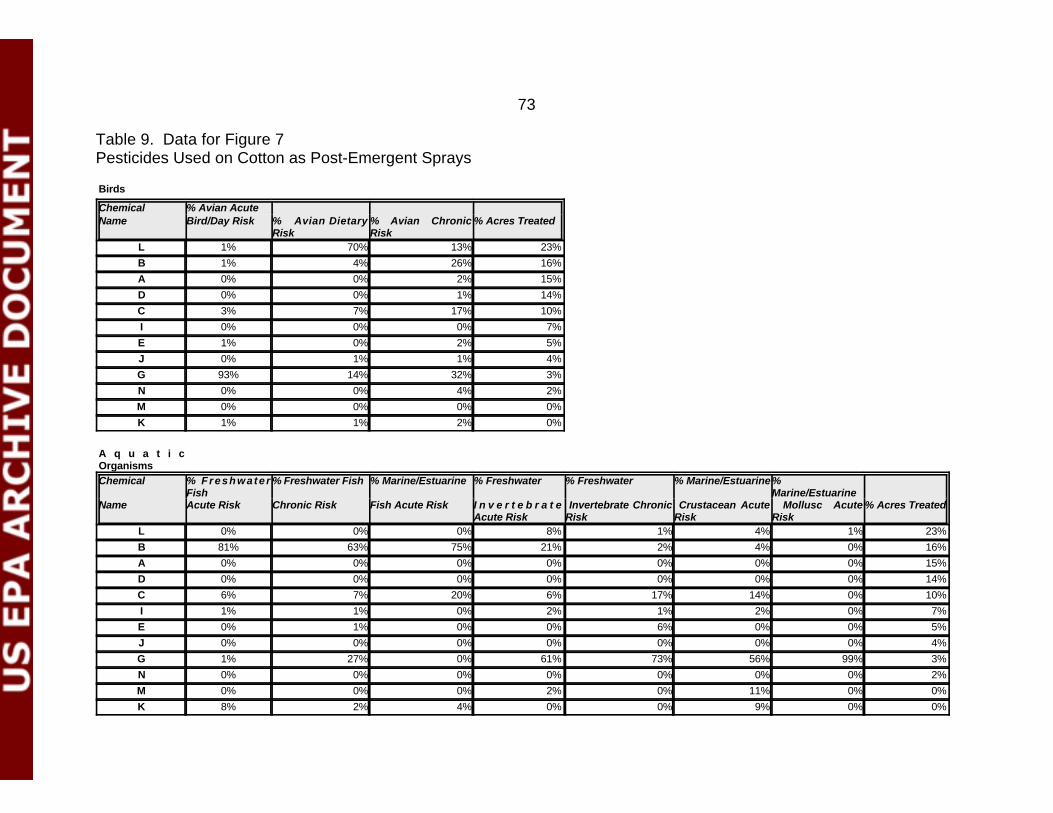
73
Table 9. Data for Figure 7Pesticides Used on Cotton as Post-Emergent Sprays
Birds
Chemical % Avian Acute Name Bird/Day Risk % Avian Dietary
Risk% Avian ChronicRisk
% Acres Treated
L 1% 70% 13% 23%
B 1% 4% 26% 16%
A 0% 0% 2% 15%
D 0% 0% 1% 14%
C 3% 7% 17% 10%
I 0% 0% 0% 7%
E 1% 0% 2% 5%
J 0% 1% 1% 4%
G 93% 14% 32% 3%
N 0% 0% 4% 2%
M 0% 0% 0% 0%
K 1% 1% 2% 0%
A q u a t i cOrganismsChemical % Freshwater
Fish% Freshwater Fish % Marine/Estuarine % Freshwater % Freshwater % Marine/Estuarine%
Marine/EstuarineName Acute Risk Chronic Risk Fish Acute Risk I n v e r t e b r a t e
Acute Risk Invertebrate ChronicRisk
Crustacean AcuteRisk
Mollusc AcuteRisk
% Acres Treated
L 0% 0% 0% 8% 1% 4% 1% 23%
B 81% 63% 75% 21% 2% 4% 0% 16%
A 0% 0% 0% 0% 0% 0% 0% 15%
D 0% 0% 0% 0% 0% 0% 0% 14%
C 6% 7% 20% 6% 17% 14% 0% 10%
I 1% 1% 0% 2% 1% 2% 0% 7%
E 0% 1% 0% 0% 6% 0% 0% 5%
J 0% 0% 0% 0% 0% 0% 0% 4%
G 1% 27% 0% 61% 73% 56% 99% 3%
N 0% 0% 0% 0% 0% 0% 0% 2%
M 0% 0% 0% 2% 0% 11% 0% 0%
K 8% 2% 4% 0% 0% 9% 0% 0%
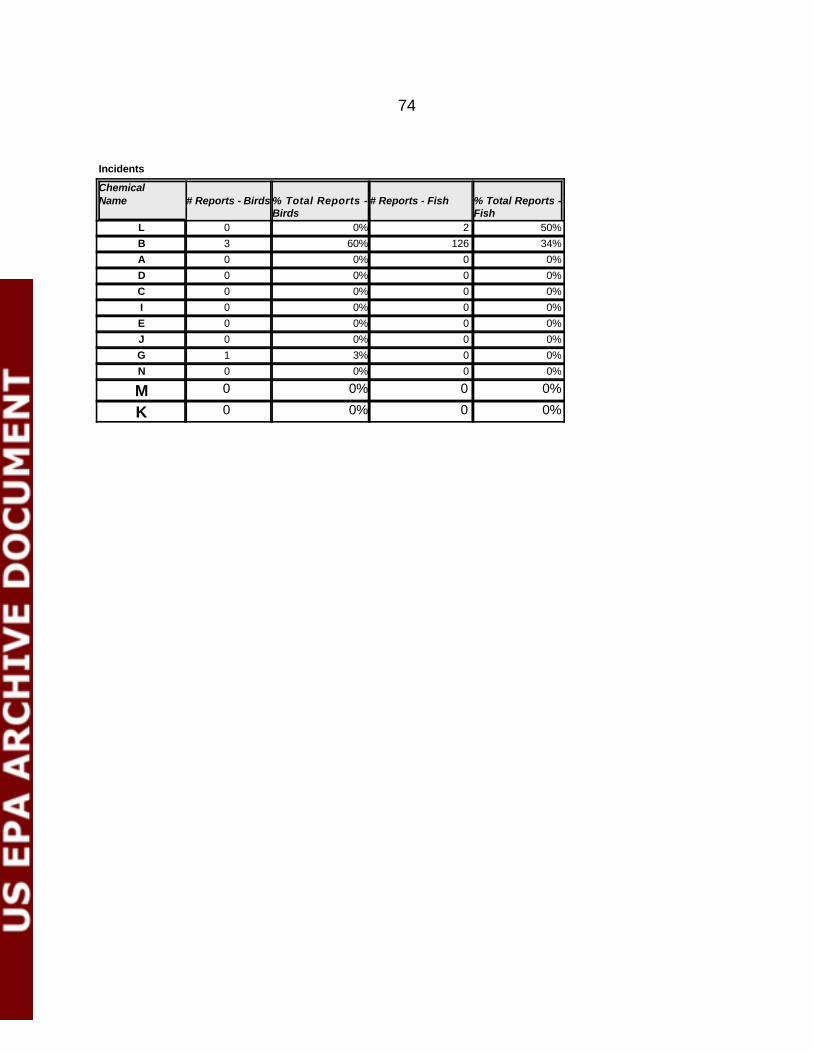
74
Incidents
Chemical Name # Reports - Birds % Total Reports -
Birds# Reports - Fish % Total Reports -
FishL 0 0% 2 50%
B 3 60% 126 34%
A 0 0% 0 0%
D 0 0% 0 0%
C 0 0% 0 0%
I 0 0% 0 0%
E 0 0% 0 0%
J 0 0% 0 0%
G 1 3% 0 0%
N 0 0% 0 0%
M 0 0% 0 0%
K 0 0% 0 0%
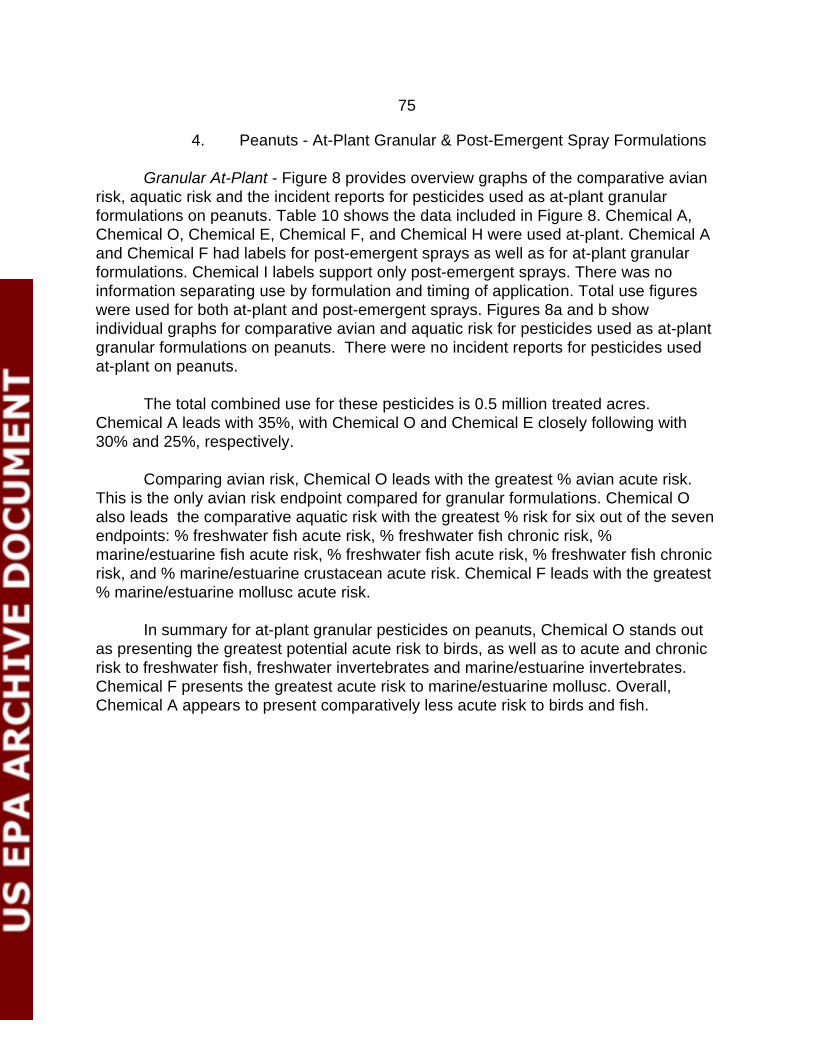
75
4. Peanuts - At-Plant Granular & Post-Emergent Spray Formulations
Granular At-Plant - Figure 8 provides overview graphs of the comparative avianrisk, aquatic risk and the incident reports for pesticides used as at-plant granularformulations on peanuts. Table 10 shows the data included in Figure 8. Chemical A,Chemical O, Chemical E, Chemical F, and Chemical H were used at-plant. Chemical Aand Chemical F had labels for post-emergent sprays as well as for at-plant granularformulations. Chemical I labels support only post-emergent sprays. There was noinformation separating use by formulation and timing of application. Total use figureswere used for both at-plant and post-emergent sprays. Figures 8a and b showindividual graphs for comparative avian and aquatic risk for pesticides used as at-plantgranular formulations on peanuts. There were no incident reports for pesticides usedat-plant on peanuts.
The total combined use for these pesticides is 0.5 million treated acres.Chemical A leads with 35%, with Chemical O and Chemical E closely following with30% and 25%, respectively.
Comparing avian risk, Chemical O leads with the greatest % avian acute risk.This is the only avian risk endpoint compared for granular formulations. Chemical Oalso leads the comparative aquatic risk with the greatest % risk for six out of the sevenendpoints: % freshwater fish acute risk, % freshwater fish chronic risk, %marine/estuarine fish acute risk, % freshwater fish acute risk, % freshwater fish chronicrisk, and % marine/estuarine crustacean acute risk. Chemical F leads with the greatest% marine/estuarine mollusc acute risk.
In summary for at-plant granular pesticides on peanuts, Chemical O stands outas presenting the greatest potential acute risk to birds, as well as to acute and chronicrisk to freshwater fish, freshwater invertebrates and marine/estuarine invertebrates.Chemical F presents the greatest acute risk to marine/estuarine mollusc. Overall,Chemical A appears to present comparatively less acute risk to birds and fish.
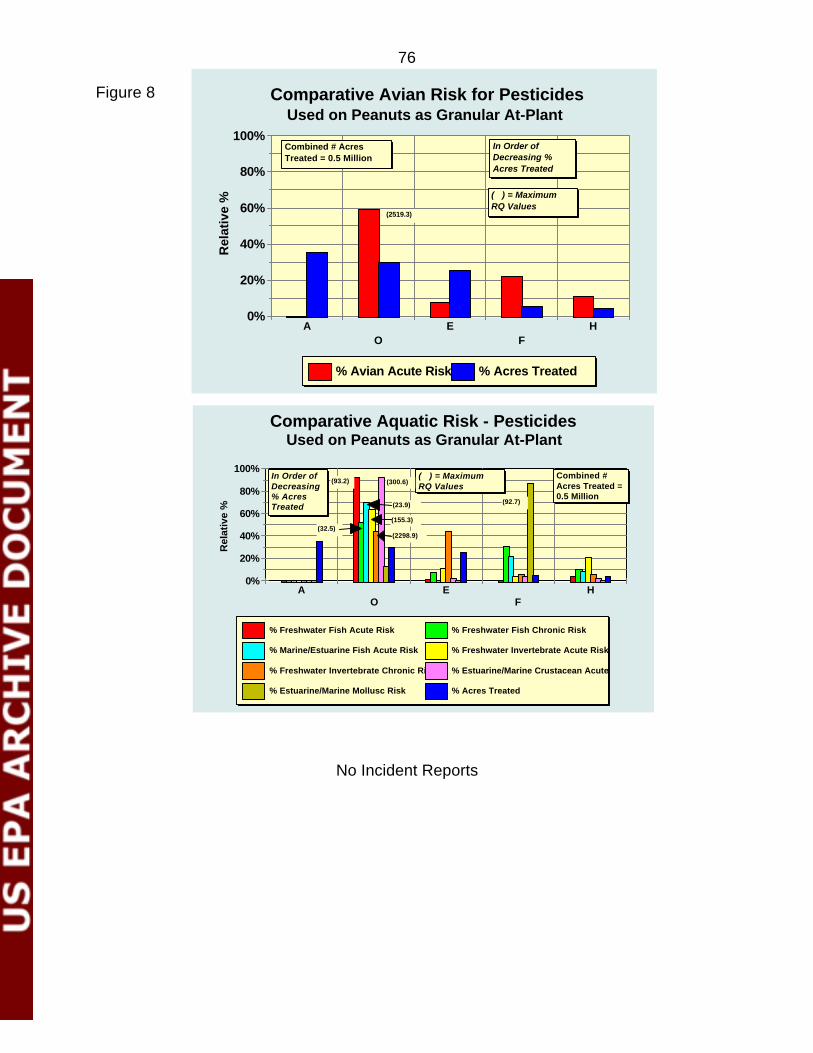
76
0%
20%
40%
60%
80%
100%
Rel
ativ
e %
AO
EF
H
% Avian Acute Risk % Acres Treated
Comparative Avian Risk for PesticidesUsed on Peanuts as Granular At-Plant
Combined # AcresTreated = 0.5 Million
In Order ofDecreasing %Acres Treated
( ) = MaximumRQ Values
(2519.3)
0%
20%
40%
60%
80%
100%
Rel
ativ
e %
AO
EF
H
% Freshwater Fish Acute Risk % Freshwater Fish Chronic Risk
% Marine/Estuarine Fish Acute Risk % Freshwater Invertebrate Acute Risk
% Freshwater Invertebrate Chronic Risk % Estuarine/Marine Crustacean Acute
% Estuarine/Marine Mollusc Risk % Acres Treated
Comparative Aquatic Risk - PesticidesUsed on Peanuts as Granular At-Plant
Combined #Acres Treated =0.5 Million
In Order ofDecreasing% AcresTreated
( ) = MaximumRQ Values
(93.2)
(23.9)
(155.3)
(300.6)
(92.7)
(32.5)(2298.9)
Figure 8
No Incident Reports
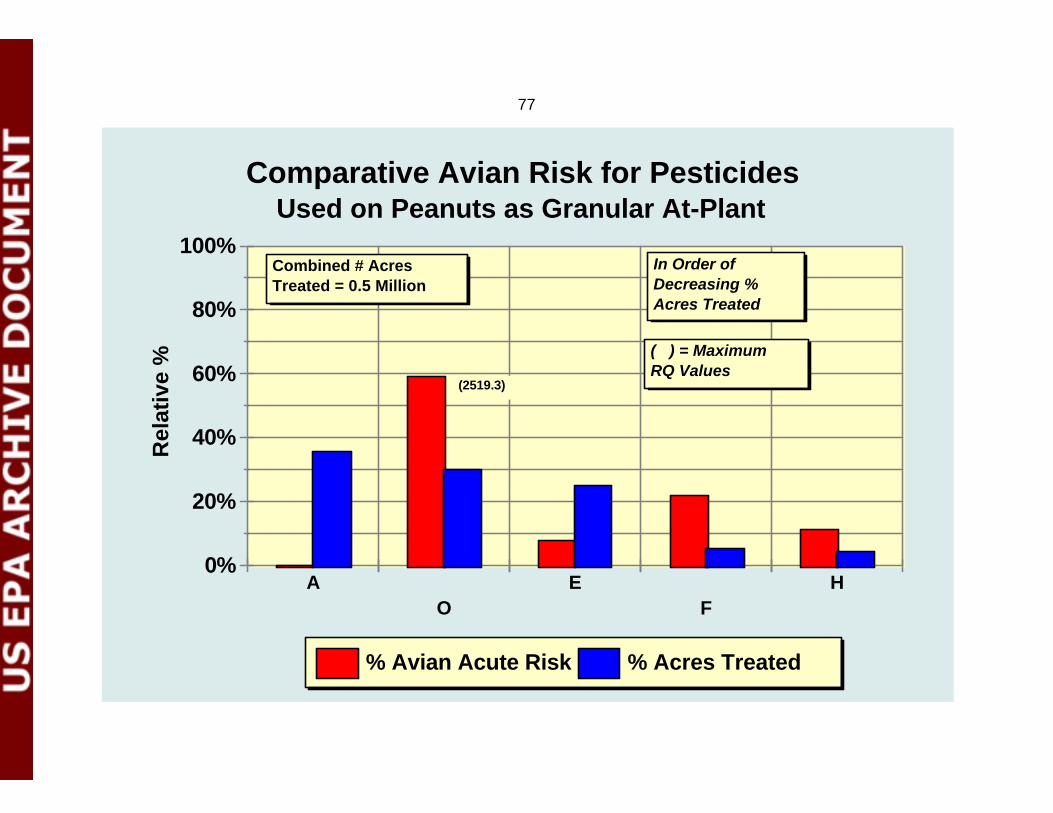
77
0%
20%
40%
60%
80%
100%
Rel
ativ
e %
AO
EF
H
% Avian Acute Risk % Acres Treated
Comparative Avian Risk for PesticidesUsed on Peanuts as Granular At-Plant
Combined # AcresTreated = 0.5 Million
In Order ofDecreasing %Acres Treated
( ) = MaximumRQ Values
(2519.3)

78
0%
20%
40%
60%
80%
100%
Rel
ativ
e %
AO
EF
H
% Freshwater Fish Acute Risk % Freshwater Fish Chronic Risk
% Marine/Estuarine Fish Acute Risk % Freshwater Invertebrate Acute Risk
% Freshwater Invertebrate Chronic Risk % Estuarine/Marine Crustacean Acute
% Estuarine/Marine Mollusc Risk % Acres Treated
Comparative Aquatic Risk - PesticidesUsed on Peanuts as Granular At-Plant
Combined #Acres Treated =0.5 Million
In Order ofDecreasing% AcresTreated
( ) = MaximumRQ Values
(93.2)
(23.9)
(155.3)
(300.6)
(92.7)
(32.5)(2298.9)

79
Table 10. Data for Figure 8Pesticides Used on Peanuts as Granular At-Plant Formulations
Birds
Chemical % Avian Acute Name Risk % Acres Treated
A 0% 35%
O 59% 30%
E 8% 25%
F 22% 5%
H 11% 4%
A q u a t i cOrganisms
Chemical % FreshwaterFish
% FreshwaterFish
%Marine/Estuarine
% Freshwater % Freshwater %Marine/Estuarine
%Marine/Estuarine
Name Acute Risk Chronic Risk Fish Acute Risk I n v e r t e b r a t eAcute Risk
Invertebrate ChronicRisk
C r u s t a c e a nAcute Risk
Mollusc AcuteRisk
% Acres Treated
A 0% 0% 0% 0% 0% 0% 0% 35%
O 92% 52% 70% 64% 44% 92% 13% 30%
E 1% 7% 0% 11% 44% 2% 0% 25%
F 0% 31% 22% 4% 6% 4% 87% 5%
H 4% 10% 8% 21% 6% 2% 0% 4%
No IncidentReports

80
Post-Emergent Sprays - Figure 9 provides overview graphs of the comparativeavian risk, aquatic risk and the incident reports for pesticides used as post-emergentsprays on peanuts. Table 11 shows the data included in Figure 9. Chemical A,Chemical F and Chemical I were used post-emergent sprays. Figures 9a and b showindividual graphs for comparative avian risk and aquatic risk for pesticides used aspost-emergent sprays on peanuts. No incidents were reported for these pesticides usedas post-emergent sprays on peanuts.
The total combined use for these pesticides is 0.2 million treated acres.Chemical A leads with over 80%. Chemical F follows with 13%.
Comparing avian risk, Chemical F leads with the greatest % avian acute, %avian dietary risk, and % avian chronic risk. Chemical F also leads the comparativeaquatic risk with the greatest % risk for five out of the seven endpoints: % freshwaterfish chronic risk, % marine/estuarine fish acute risk, % freshwater invertebrate chronicrisk, % marine/estuarine crustacean acute risk, and % marine/estuarine mollusc acuterisk. Chemical I leads the comparative aquatic risk with the greatest % risk for two outof the seven endpoints: % freshwater fish acute risk, and % freshwater invertebrateacute risk,.
In summary for post-emergent sprays on peanuts, Chemical F stands out aspresenting the greatest potential acute, dietary and chronic risk to birds, as well aspotential acute risk to marine/estuarine fish, chronic risk to freshwater fish andinvertebrates, and acute risk to marine/estuarine crustaceans and molluscs. Chemical Ipresents the greatest potential acute risk to freshwater fish and invertebrates. Overall,Chemical A appears to be comparatively less risky than the others.
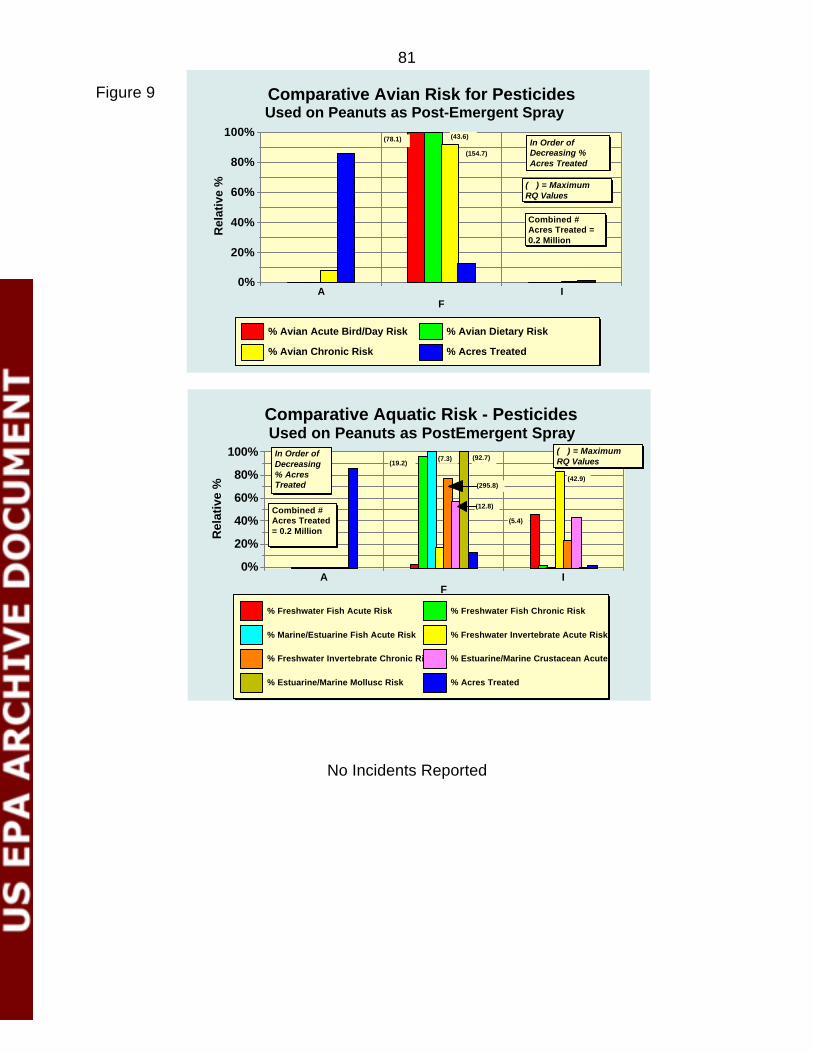
81
0%
20%
40%
60%
80%
100%
Rel
ativ
e %
AF
I
% Avian Acute Bird/Day Risk % Avian Dietary Risk
% Avian Chronic Risk % Acres Treated
Comparative Avian Risk for PesticidesUsed on Peanuts as Post-Emergent Spray
In Order ofDecreasing %Acres Treated
( ) = MaximumRQ Values
Combined #Acres Treated =0.2 Million
(43.6)(78.1)
(154.7)
0%
20%
40%
60%
80%
100%
Rel
ativ
e %
AF
I
% Freshwater Fish Acute Risk % Freshwater Fish Chronic Risk
% Marine/Estuarine Fish Acute Risk % Freshwater Invertebrate Acute Risk
% Freshwater Invertebrate Chronic Risk % Estuarine/Marine Crustacean Acute
% Estuarine/Marine Mollusc Risk % Acres Treated
Comparative Aquatic Risk - PesticidesUsed on Peanuts as PostEmergent Spray
Combined #Acres Treated= 0.2 Million
In Order ofDecreasing% AcresTreated
( ) = MaximumRQ Values
(5.4)
(7.3)
(42.9)
(12.8)
(92.7)(19.2)
(295.8)
Figure 9
No Incidents Reported

82
0%
20%
40%
60%
80%
100%
Rel
ativ
e %
AF
I
% Avian Acute Bird/Day Risk % Avian Dietary Risk
% Avian Chronic Risk % Acres Treated
Comparative Avian Risk for PesticidesUsed on Peanuts as Post-Emergent Spray
In Order ofDecreasing %Acres Treated
( ) = MaximumRQ Values
Combined #Acres Treated =0.2 Million
(43.6)(78.1)
(154.7)
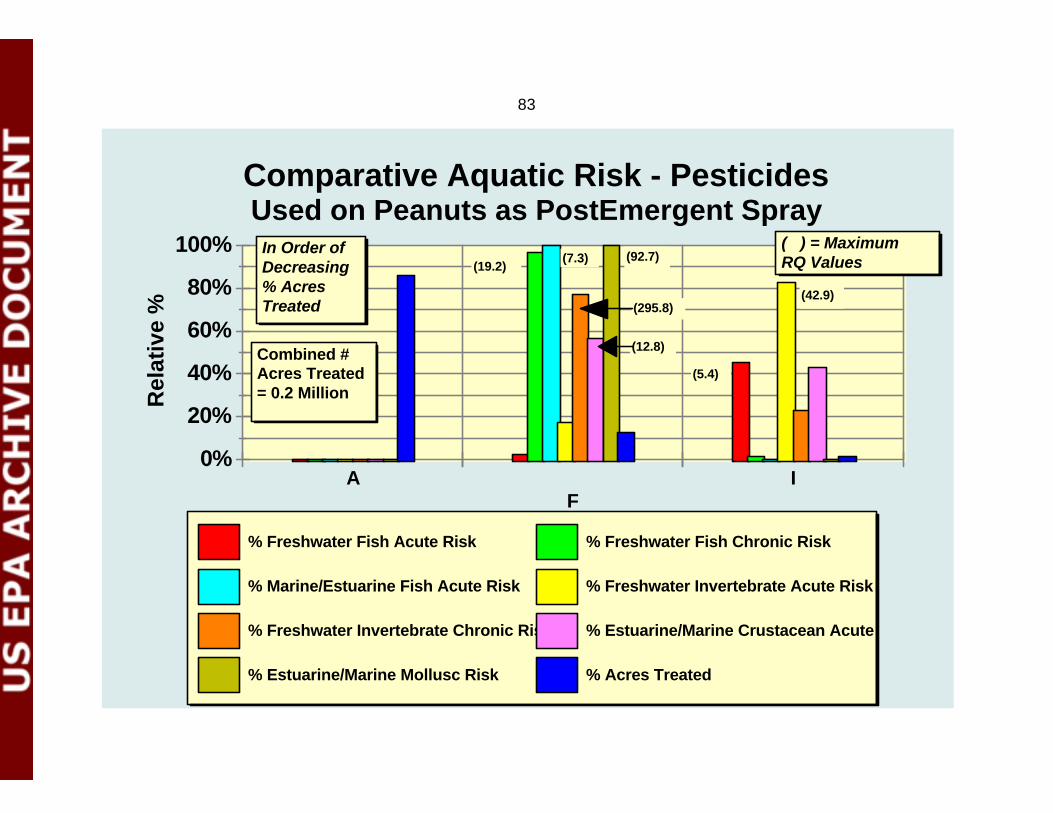
83
0%
20%
40%
60%
80%
100%
Rel
ativ
e %
AF
I
% Freshwater Fish Acute Risk % Freshwater Fish Chronic Risk
% Marine/Estuarine Fish Acute Risk % Freshwater Invertebrate Acute Risk
% Freshwater Invertebrate Chronic Risk % Estuarine/Marine Crustacean Acute
% Estuarine/Marine Mollusc Risk % Acres Treated
Comparative Aquatic Risk - PesticidesUsed on Peanuts as PostEmergent Spray
Combined #Acres Treated= 0.2 Million
In Order ofDecreasing% AcresTreated
( ) = MaximumRQ Values
(5.4)
(7.3)
(42.9)
(12.8)
(92.7)(19.2)
(295.8)
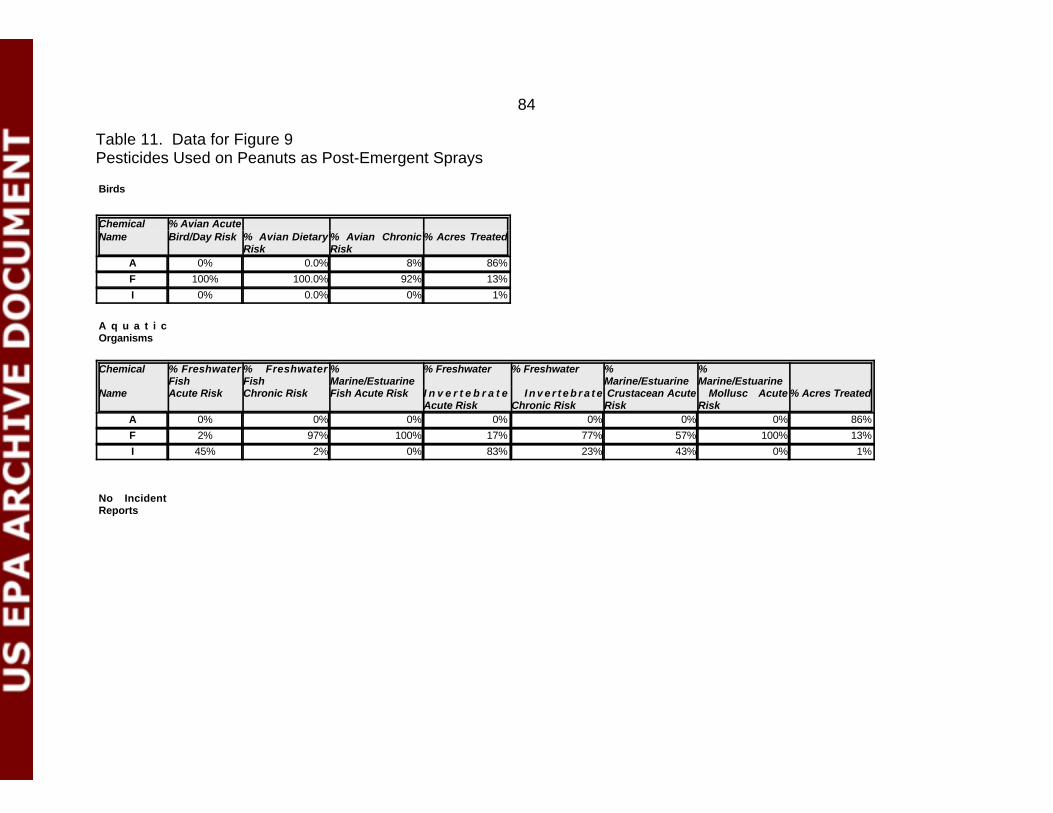
84
Table 11. Data for Figure 9Pesticides Used on Peanuts as Post-Emergent Sprays
Birds
Chemical % Avian AcuteName Bird/Day Risk % Avian Dietary
Risk% Avian ChronicRisk
% Acres Treated
A 0% 0.0% 8% 86%
F 100% 100.0% 92% 13%
I 0% 0.0% 0% 1%
A q u a t i cOrganisms
Chemical % FreshwaterFish
% FreshwaterFish
%Marine/Estuarine
% Freshwater % Freshwater %Marine/Estuarine
%Marine/Estuarine
Name Acute Risk Chronic Risk Fish Acute Risk I n v e r t e b r a t eAcute Risk
I n v e r t e b r a t eChronic Risk
Crustacean AcuteRisk
Mollusc AcuteRisk
% Acres Treated
A 0% 0% 0% 0% 0% 0% 0% 86%
F 2% 97% 100% 17% 77% 57% 100% 13%
I 45% 2% 0% 83% 23% 43% 0% 1%
No IncidentReports

85
5. Overall Summary
Figures 4, 6 and 8 show that Chemical O stands out as consistently presentingthe greatest overall potential risk for granular at-plant pesticides applied to these fourcrops.
Figures 3, 5, 7 and 9 present a more complex picture of potential risk forpesticides applied as post-emergent sprays to these four crops. Chemical G appears topresent the greatest risk to birds and aquatic invertebrates on alfalfa, corn and cotton.Chemical B presents the greatest risk to fish on alfalfa and cotton; while Chemical Ipresents the greatest risk to fish on corn. Peanuts is a separate case and is describedabove.

86
16Much of the software description here was based on a software review by Len Tashman and SaraMunro [24].
17 DecideRight was developed by Avantos Performance Systems of Emertville, California. Thecompany has since closed; however, the software is still available from Parsons Technology, P.O. Box 100,Hiawatha, IA 52233 [http://www.parsonstech.com] Mention of this commercial product does not constitutea recommendation or endorsement by EPA.
18Arlington Software Corporation, 740 Saint-Maurice, Suite 410, Montreal, Quebec, Canada, H3C1L5 [http://www.arlingsoft.com] Mention of this commercial product does not constitute a recommendationor endorsement by EPA.
VII. Decision Support Analysis to Aid Decision-Making
A. Decision Support Software16
Comparative risk assessment can become a daunting process when the riskassessor(s) are faced with ecological risks for a number of alternative pesticidescovering multiple endpoints. When attempting to decide which pesticides present thegreatest overall risk or which are comparatively less risky than others, the matrix-likeresult of such comparisons can lead the assessor(s) to rely on individual or groupintuition more than they prefer. Further, when additional information characterizing therisk, whether quantitative or not, is added for consideration in the decision makingprocess, paralysis (indecision) can set in. To address this situation, the Agency choseto explore the use of commercially available software called DecideRight (Version 1.2)17
to aid in decision-making for this case study. This software was primarily designed foruse in businesses. It is a user friendly tool to help choose among alternatives whenmany factors must be considered. The underlying methodology is SMART, the SimpleMulti-attribute Rating Technique. It was developed about 27-years ago and hasbecome a standard in decision modeling. When faced with a number of choices and anumber of criteria, SMART prescribes that (1) each choice be rated on each criterion,(2) each criterion be assigned a measure of importance to the decision-maker, (3) asummary score for each choice be calculated as a weighted average of the ratings,where the weights represent the relative importance of the criteria. Thus, the higher thesummary score, the better the choice. The result of this process has proved to besuperior to the alternative of reliance on intuition.
SMART is not rooted in probability. The assigned ratings are assumed to bebased on full knowledge of how an option works. There are no uncertainties. However,some uncertainty can be dealt with in the ratings by sensitivity testing of the results.Similarly, this analysis is not rooted in probability. However, when the tools forprobabilistic ecological risk assessments become available and are implemented inOPP/EFED, a decision tool that is capable of handling probabilities should beconsidered for comparative analysis. ERGO18 by Arlington Software Corporationcurrently is capable of handling probability in decision analysis.
87
In addition, there are no interactions between attributes in SMART. Thus,SMART ignores any interplay between two criteria. This interaction effect is handledbetter by more complex models such as ERGO.
DecideRight is easy to use and provides the results in intuitive and colorfuldecision tables. In addition to a baseline scenario, the software allows the developmentvarious additional scenarios through its scenario facility. This permits consideration ofadditional risk characterization information and also preferences of different membersin a team environment. EPA selected DecideRight for this exploratory case study.
B. Baseline Scenario - Alfalfa
The Agency chose to enter the data in Table 5, for all pesticides used on alfalfaas post-emergent sprays, into DecideRight. The twelve criteria i.e., the risk endpoints,were considered to be equally important for this scenario, and set at a level of mediumimportance. The criteria included # of bird incident reports, # of fish incident reports, %avian bird/day risk, % avian dietary risk, % avian chronic risk, % freshwater fish acuterisk, % marine/estuarine fish acute risk, % freshwater fish chronic risk, % freshwaterinvertebrate acute risk, % freshwater invertebrate chronic risk, % marine/estuarinecrustacean acute risk, % marine/estuarine mollusc acute risk.
Each pesticide was rated for each criteria using the % risk values in Table 5.The option was chosen to rate lower % risk values better. Thus, lower % risk ratingsresult in higher summary ratings. The question posed was “Which of the InsecticidesUsed on Alfalfa are Less Risky?” The corollary is “Which of the Insecticides are MoreRisky?” The results are presented in a decision table format in Figure 10.
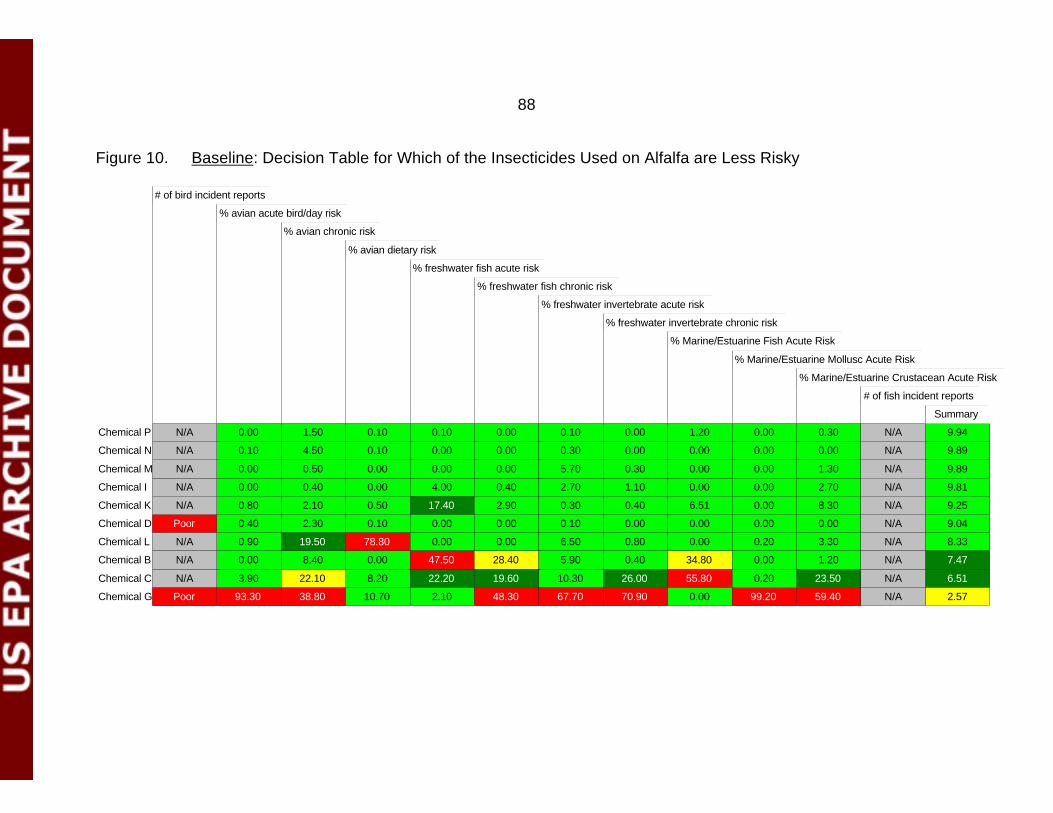
88
Figure 10. Baseline: Decision Table for Which of the Insecticides Used on Alfalfa are Less Risky
# of bird incident reports
% avian acute bird/day risk
% avian chronic risk
% avian dietary risk
% freshwater fish acute risk
% freshwater fish chronic risk
% freshwater invertebrate acute risk
% freshwater invertebrate chronic risk
% Marine/Estuarine Fish Acute Risk
% Marine/Estuarine Mollusc Acute Risk
% Marine/Estuarine Crustacean Acute Risk
# of fish incident reports
Chemical P 9.94
Chemical N 9.89
Chemical M 9.89
Chemical I 9.81
Chemical K 9.25
Chemical D 9.04
Chemical L 8.33
Chemical B 7.47
Chemical C 6.51
Chemical G 2.57
0.00
3.90
93.30
0.40
0.90
0.00
0.00
0.10
0.00
0.80
0.00
8.20
10.70
0.10
78.80
0.00
0.00
0.10
0.10
0.50
0.40
22.10
38.80
2.30
19.50
0.50
8.40
4.50
1.50
2.10
4.00
22.20
2.10
0.00
0.00
0.00
47.50
0.00
0.10
17.40
0.40
19.60
48.30
0.00
0.00
0.00
28.40
0.00
0.00
2.90
2.70
10.30
67.70
0.10
6.50
5.70
5.90
0.30
0.10
0.30
1.10
26.00
70.90
0.00
0.80
0.30
0.40
0.00
0.00
0.40
N/A
N/A
Poor
Poor
N/A
N/A
N/A
N/A
N/A
N/A
0.00
0.00
0.00
55.80
0.00
34.80
0.00
6.51
1.20
0.00
0.00
3.30
59.40
23.50
0.00
1.20
2.70
8.30
0.30
1.30
99.20
0.20
0.00
0.00
0.00
0.00
0.20
0.00
0.00
0.00
N/A
N/A
N/A
N/A
N/A
N/A
N/A
N/A
N/A
N/A
Summary
89
Alternative choices considered are listed down the left side of the table. Thecriteria used to evaluate the various options are listed along the top. Initially entered inno particular order, both the choices and the criteria were then repositioned accordingto importance of criteria, held constant in this case at medium, and effectiveness ofindividual choices in meeting them.
As criteria are evaluated and weights assigned according to which factors areconsidered to be most significant, the factors are sorted from left to right in order ofimportance (i.e., the factor considered by the decision maker to be most significant inmeeting overall needs ends up in the leftmost position). In this baseline scenario, allare equally important.
Similarly, as choices are evaluated according to effectiveness in meetingcriteria, the best choices migrate to the top of the list. When the process is complete,the best choice should emerge at the top, the worst at the bottom.
As selection alternatives and the criteria to be used in evaluating them areentered into the table, weights are assigned to each of the evaluation factors so thatthey are ranked in order of their importance in fulfilling the overall task. For thebaseline decision "Which Insecticides Used on Alfalfa are Less Risky ?," the twelvecriteria used to evaluate the choices were all weighted as Medium. Where one or morebird incidents were reported, that criterion was rated as “poor” for that chemical. Whenno bird incidents were reported, that criterion was rated as N/A for that chemical and itdid not contribute to the summary rating. No fish incidents were reported and thus thiscriterion did not contribute to the summary for any chemical.
The colors under each criteria and under the summary show four ratingcategories which indicate difference between options:
Medium Green = Top Option(s)Dark Green = Second Option(s)Yellow = Third Option(s)Red = Worst Option(s)
The summary column displays the results of the hidden calculations based onthe assigned ratings and weights for the criteria. For a more detailed explanation of theunderlying mathematical algorithms, Tashman and Munro [24] recommend a chapterentitled Decisions with Multiple Objectives in the decision analysis textbook byGoodwin and Wright [25]. The higher the summary score, the better the option, andvice versa. The scale for the summary is from 10 to 1, and is expressed as four ratingcategories as above.
Among the 10 choices (chemicals) considered, 7 were considered to be "top
90
options." (A top option is defined as follows: If the choice immediately following thepreferred choice is rated in the same rating category as the recommended selection,then all choices in that category are considered top options. If the second rankingchoice is in a different category, the top options are considered to be the recommendedchoice plus all choices in the same category as the second-place option. Thus, the"top options" list will always have at least two choices in it and may include all of thechoices considered in the entire table.) DecideRight also provides pair-wisecomparisons between the choices where the critical rating factor is identified. This wasnot included in this document.
For the decision of "Which Insecticides Used on Alfalfa are Less Risky ?," thetop options were:
Chemical PChemical NChemical MChemical IChemical KChemical DChemical L
After a careful evaluation of each option, Chemical P appears to be the bestchoice. The worst choice was Chemical G, followed by Chemicals C and B.
Finally, the relative strengths of the various choices, i.e., chemicals, in each ofthe factors is illustrated in Figure 11. The wider the band, the better the rating, i.e.,less risk, for that criteria and for that pesticide. Missing bands indicate the worst ratingfor that criteria and that pesticide.
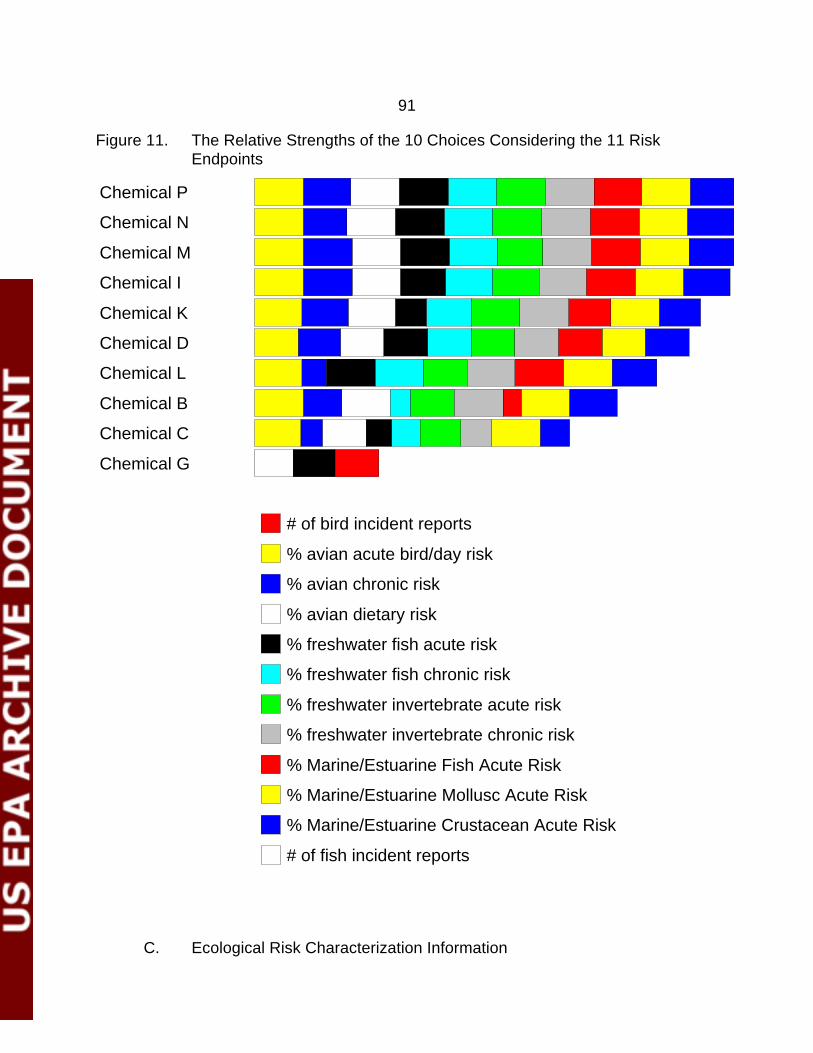
91
Figure 11. The Relative Strengths of the 10 Choices Considering the 11 RiskEndpoints
Chemical P
Chemical N
Chemical M
Chemical I
Chemical K
Chemical D
Chemical L
Chemical B
Chemical C
Chemical G
# of bird incident reports
% avian acute bird/day risk
% avian chronic risk
% avian dietary risk
% freshwater fish acute risk
% freshwater fish chronic risk
% freshwater invertebrate acute risk
% freshwater invertebrate chronic risk
% Marine/Estuarine Fish Acute Risk
% Marine/Estuarine Mollusc Acute Risk
% Marine/Estuarine Crustacean Acute Risk
# of fish incident reports
C. Ecological Risk Characterization Information
92
Following the initial screening analysis for the case study, which is based onreadily available data, we considered additional information that could furthercharacterize the potential risk of the chemicals to non-target organisms on alfalfa. Thisinformation may be quantitative in nature such as refined estimates of aquatic exposurebased on PRZM/EXAMS modelling, updated ecotoxicity data, additional reports of birdand fish incidents not recorded in the EIIS, or measured residues in the environment. Itmay also come in the form of technical or literature reports addressing the use site,application methods, and/or vulnerable populations of non-target organisms.
Terrestrial and aquatic field studies are important information to include in a comprehensive risk assessment for a pesticide. For this case study on alfalfa, however,field studies had been required to support the registration for six of the ten pesticides,but not for the other four. While most studies confirm the risk concerns raised by thepreliminary analysis, four of the pesticides lack any field testing. Since all ten cannot becompared using this criterion, an evaluation of available field study data has not beenincluded in this comparative analysis.
Following is a chemical by chemical breakdown of typical information that can beused to further characterize, and/or refine the potential risk of these 10 pesticides tonon-target organisms when used on alfalfa.
Chemical B
Two additional incidents were found:(1) In 1997 in California, 25 birds werekilled when Chemical B was sprayed on alfalfa. Residue analysis confirms Chemical Bas being the cause of the bird kill; (2) In 1991, again in California, 100+ fish were killedafter an application of Chemical B to an alfalfa field. No residue analysis was available,however, the farmer confirmed the application of Chemical B the day prior to thediscovery of the fish kill by personnel from the California Department of Fish andGame.
PRZM/EXAMS model results are available and show estimated residuesapproximately 3X greater than the GENEEC estimates.
Chemical C
PRZM/EXAMS model results are available and show estimated residues from 2to 3 X lower than the GENEEC estimates.
Chemical D
PRZM/EXAMS model results are available and show estimated residuesapproximately 2 X lower than the GENEEC peak estimates. However, by 21-days and
93
60-days the factor increased to approximately 8X and 17X lower, respectively.
Chemical G
A 100-foot buffer from sensitive aquatic habitat is required for the use of thischemical on alfalfa. PRZM/EXAMS model results are available. The spray driftcomponent of the EEC was modified. The results from the model show estimatedresidues approximately 2 X lower than the GENEEC peak estimates. The 21-dayestimated were approximately equal, and the 60-day estimates were slightly greaterthan the GENEEC estimates.
Chemical I
PRZM/EXAMS model results are available and show estimated residues slightlyless than the GENEEC peak estimates. However, by 21-days and 60-days the residueestimates were approximately 7X and 12X lower, respectively.
Chemical K
New avian reproduction study results report a NOAEC of 1 ppm. This isconsiderably lower than the predicted value of 23 ppm. In addition, PRZM/EXAMSmodel results are available and show estimated residues approximately 3Xless thanthe GENEEC peak estimates. However, by 21-days and 60-days the residue estimateswere approximately 4X lower.
Chemical L
PRZM/EXAMS model results are available and show estimated residuesapproximately 7 X less than the GENEEC peak estimates. However, by 21-days and60-days the residue estimates were approximately 16X and 20X lower, respectively.
Chemical M
PRZM/EXAMS model results are available and show estimated residuesapproximately 3 X less than the GENEEC peak and 21-day estimates. However, by 60-days the residue estimates were just slightly less than the GENEEC results.
Chemical N
PRZM/EXAMS model results are available and show estimated residuesapproximately 11 X less than the GENEEC peak, 21-day, and 60-day estimates.
94
Chemical P
PRZM/EXAMS model results are available and show estimated residuesapproximately 6 X less than the GENEEC peak and 21-day estimates. By 60-days theresidue estimates were approximately 4 X less than the GENEEC results.
D. Scenario #1 - Baseline Plus Ecological Risk Characterization Information
The software has a scenario function where the weights and ratings of thecriteria in the baseline can be changed to answer "What if...?" questions. Thus, weasked "What if the ratings of the criteria change based on the additional information inSection C above? Then, "Which are the insecticides used on alfalfa are less risky?" For this scenario, we modified the criteria ratings for % risk and # of incident reportsusing the information in Table 12. The results for Scenario #1 are presented in Figure12. below.
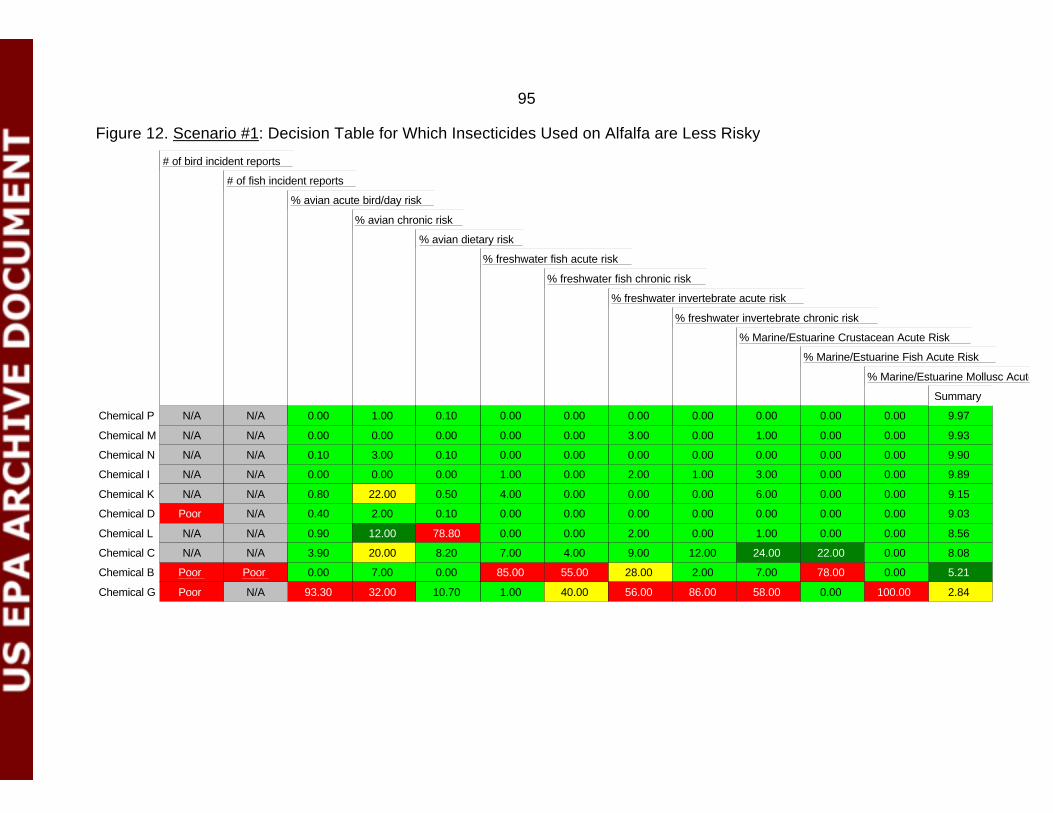
95
Figure 12. Scenario #1: Decision Table for Which Insecticides Used on Alfalfa are Less Risky
# of bird incident reports
# of fish incident reports
% avian acute bird/day risk
% avian chronic risk
% avian dietary risk
% freshwater fish acute risk
% freshwater fish chronic risk
% freshwater invertebrate acute risk
% freshwater invertebrate chronic risk
% Marine/Estuarine Crustacean Acute Risk
% Marine/Estuarine Fish Acute Risk
% Marine/Estuarine Mollusc Acute Risk
Chemical P 9.97
Chemical M 9.93
Chemical N 9.90
Chemical I 9.89
Chemical K 9.15
Chemical D 9.03
Chemical L 8.56
Chemical C 8.08
Chemical B 5.21
Chemical G 2.84
0.00 0.001.00N/A 0.00 0.00N/A 0.000.10 0.000.00 0.00
0.00 0.000.003.00 0.00N/A N/A 0.100.10 0.00 0.00 0.00
0.00 0.00 3.00N/A 0.00 0.000.000.00 0.00N/A 0.001.00
0.00 0.00N/A 1.00N/A 2.000.00 0.003.00 0.000.00 1.00
0.00N/A N/A 0.00 0.000.004.000.5022.00 0.006.000.80
0.00Poor 0.40 0.000.000.002.00 0.00 0.000.10 0.00N/A
0.0078.800.90 0.0012.00 2.00 0.00N/A N/A 0.001.00 0.00
85.000.00 28.00 2.007.000.00Poor 0.00Poor 55.00 7.00 78.00
N/A 12.009.00N/A 4.00 22.0024.007.0020.00 0.003.90 8.20
56.001.0093.30Poor 10.70 86.00 0.0032.00 100.0040.00N/A 58.00
Summary

96
Table 12. Data for Scenario #1
Pesticides Used on Alfalfa as Post-Emergent Sprays
(Includes Risk Characterization Information; Compare with Table 5)
Birds
Chemical % Avian Acute Name Bird/Day Risk % A v i a n
Chronic Risk% Avian DietaryRisk
% Acres Treated
C 3.9% 20% 8.2% 29.7%
D 0.4% 2% 0.1% 26.3%
G 93.3% 32% 10.7% 16.0%
I 0.0% 0% 0.0% 12.2%
L 0.9% 12% 78.8% 11.6%
P 0.0% 1% 0.1% 2.8%
K 0.8% 22% 0.5% 0.6%
M 0.0% 0% 0.0% 0.4%
B 0.0% 7% 0.0% 0.3%
N 0.1% 3% 0.1% 0.0%
A q u a t i cOrganismsChemical % Freshwater
Fish% FreshwaterFish
%Marine/Estuarine
% FreshwaterInvertebrate
% FreshwaterInvertebrate
%Marine/Estuarine
%Marine/Estuarine
Name Acute Risk Chronic Risk Fish Acute Risk Acute Risk Chronic Risk C r u s t a c e a nAcute Risk
Mollusc AcuteRisk
% A c r e sTreated
C 7% 4% 22% 9% 12% 24% 0.0% 29.7%
D 0% 0% 0% 0% 0% 0% 0.0% 26.3%
G 1% 40% 0% 56% 86% 58% 100.0% 16.0%
I 1% 0% 0% 2% 1% 3% 0.0% 12.2%
L 0% 0% 0% 2% 0% 1% 0.0% 11.6%
P 0% 0% 0% 0% 0% 0% 0.0% 2.8%
K 4% 0% 0% 0% 0% 6% 0.0% 0.6%
M 0% 0% 0% 3% 0% 1% 0.0% 0.4%
B 85% 55% 78% 28% 2% 7% 0.0% 0.3%
N 0% 0% 0% 0% 0% 0% 0.0% 0.0%
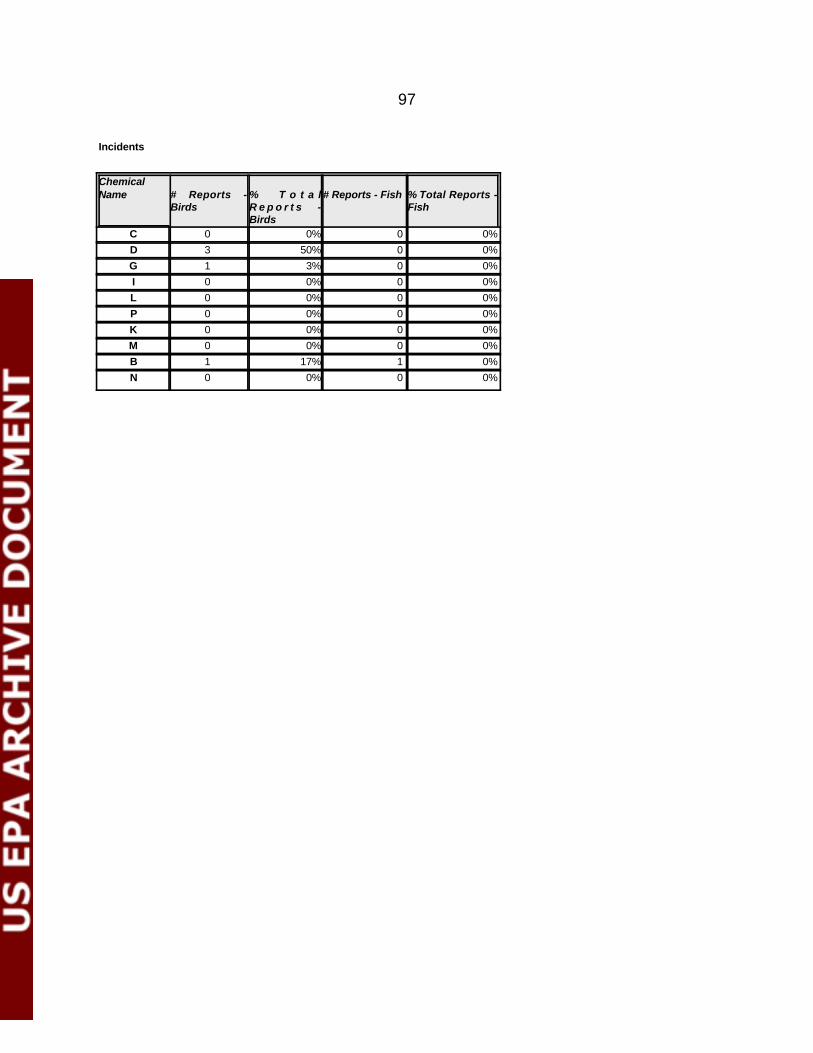
97
Incidents
Chemical Name # Reports -
Birds% T o t a lR e p o r t s -Birds
# Reports - Fish % Total Reports -Fish
C 0 0% 0 0%
D 3 50% 0 0%
G 1 3% 0 0%
I 0 0% 0 0%
L 0 0% 0 0%
P 0 0% 0 0%
K 0 0% 0 0%
M 0 0% 0 0%
B 1 17% 1 0%
N 0 0% 0 0%
98
The addition of the risk characterization information provided results which arevery similar to the baseline. After a careful evaluation of each option in Scenario #1,once again Chemical P appears to be the best choice. This time there were eight topchoices, with the addition of Chemical C. In the baseline, Chemical C followed theworst choice, Chemical G. For Scenario #1, the worst choice again was Chemical G,but his time it is followed by Chemical B.
E. Additional Scenarios - Changes in Criteria Importance
As noted previusly, one of the simplifications of the methodology used in thedecision analysis software is that there are no uncertainties. Certainly comparativeecological risk analysis involves much uncertainty. Since the software permits the userto deal with some uncertainty is by running multi-scenarios, we chose to run sevenadditional scenarios for the case study. These runs show how sensitive the differencesbetween pesticides are to change in the importance of the criteria. The results can addconfidence to overall conclusions. The additional scenarios are listed below. Thesummary columns are presented in Figure 13 below. The different scenarios reflectchanges in the importance given to various endpoints and groups of endpoints. In twoscenarios, certain criteria are considered to be unimportant and do not contribute to thecomparison. They reflect differences in importance that can typically arise duringecological risk assessments, and during discussion with risk managers.
Scenario #2 - Additional Risk Characterization Data Added; BirdEndpoints are Rated High; All Other Endpoints are RatedMedium
Scenario #3 - Additional Risk Characterization Data Added; AquaticEmdpoints are Rated High; All Other Endpoints are RatedMedium
Scenario #4 - Additional Risk Characterization Data Added; Bird & FishIncidents are Rated as N/A; All Other Endpoints are RatedMedium
Scenario #5 - Additional Risk Characterization Data Added;Marine/Estuarine Endpoints are Rated as N/A; All OtherEndpoints are Rated Medium
Scenario #6 - Additional Risk Characterization Data Added; FishEndpoints are Rated High; All Other Endpoints are RatedMedium
Scenario #7 - Additional Risk Characterization Data Added; AquaticInvertebrate Endpoints are Rated High; All Other Endpoints
99
are Rated Medium
Scenario #8 - Additional Risk Characterization Data Added; BirdEndpoints are Rated High; Aquatic Endpoints are RatedLow
Scenario #9 - Additional Risk Characterization Data Added; AquaticEndpoints are Rated High; Bird Endpoints are Rated Low
The results in Figure 13 show that Chemicals P, N, M, I, K, and D wereconsistently rated as top options regardless of the changes in importance values for thetwelve criteria. Chemical P was the top option for all scenarios except #8 where birdendpoints were given a high importance and aquatic endpoints a low importance. Inthis scenario, Chemical M was the top choice, closely followed by Chemical P. Chemical C was a top option except in the baseline option. Chemical L was a topoption in all scenarios exept scenario #8. Alternately, Chemical G is consistently ratedat the bottom as the worst option in all scenarios. Chemical B was the second worstoption except for the baseline scenario where Chemical B and C were rated equal asthe second worst option. In scenario #8, Chemicals B and L were equal as the secondworst option. Chemical D made the largest change within the top options in scenario#4 where incidents were rated as unimportant.
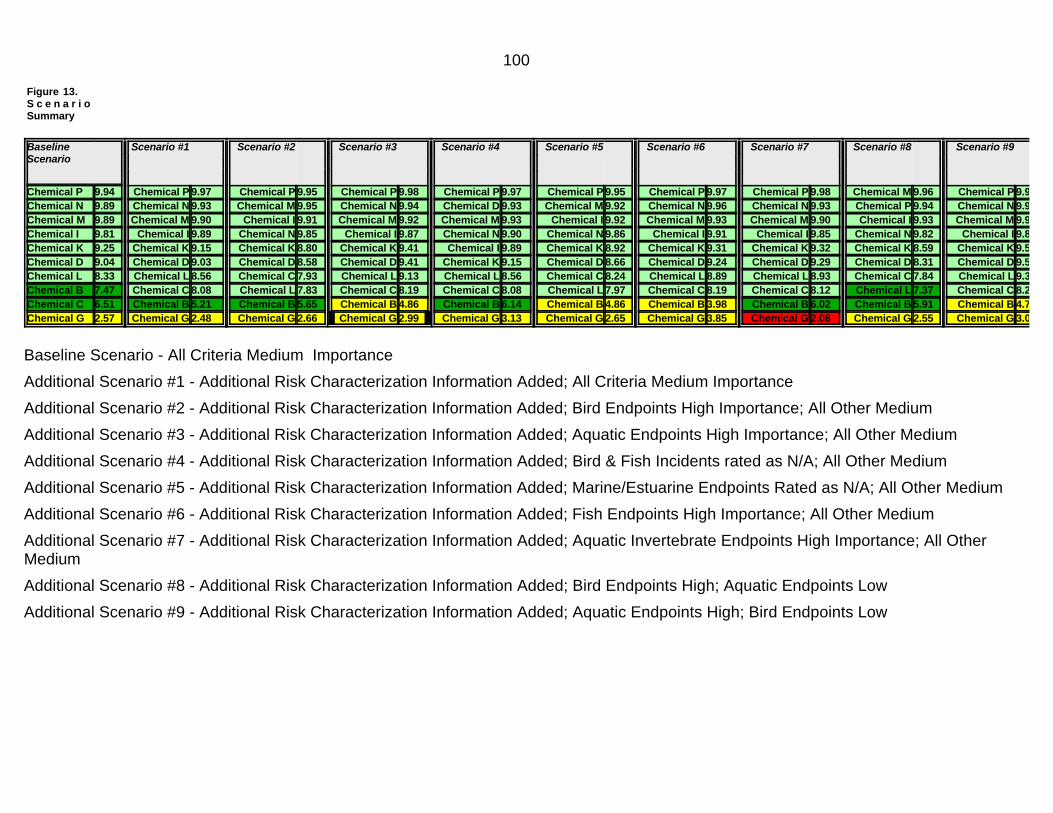
100
Figure 13. S c e n a r i oSummary
Baseline Scenario #1 Scenario #2 Scenario #3 Scenario #4 Scenario #5 Scenario #6 Scenario #7 Scenario #8 Scenario #9Scenario
Chemical P 9.94 Chemical P 9.97 Chemical P 9.95 Chemical P 9.98 Chemical P 9.97 Chemical P 9.95 Chemical P 9.97 Chemical P 9.98 Chemical M 9.96 Chemical P 9.99 Chemical N 9.89 Chemical N 9.93 Chemical M 9.95 Chemical N 9.94 Chemical D 9.93 Chemical M 9.92 Chemical N 9.96 Chemical N 9.93 Chemical P 9.94 Chemical N 9.96 Chemical M 9.89 Chemical M 9.90 Chemical I 9.91 Chemical M 9.92 Chemical M 9.93 Chemical I 9.92 Chemical M 9.93 Chemical M 9.90 Chemical I 9.93 Chemical M 9.91 Chemical I 9.81 Chemical I 9.89 Chemical N 9.85 Chemical I 9.87 Chemical N 9.90 Chemical N 9.86 Chemical I 9.91 Chemical I 9.85 Chemical N 9.82 Chemical I 9.86 Chemical K 9.25 Chemical K 9.15 Chemical K 8.80 Chemical K 9.41 Chemical I 9.89 Chemical K 8.92 Chemical K 9.31 Chemical K 9.32 Chemical K 8.59 Chemical K 9.57 Chemical D 9.04 Chemical D 9.03 Chemical D 8.58 Chemical D 9.41 Chemical K 9.15 Chemical D 8.66 Chemical D 9.24 Chemical D 9.29 Chemical D 8.31 Chemical D 9.52 Chemical L 8.33 Chemical L 8.56 Chemical C 7.93 Chemical L 9.13 Chemical L 8.56 Chemical C 8.24 Chemical L 8.89 Chemical L 8.93 Chemical C 7.84 Chemical L 9.36 Chemical B 7.47 Chemical C 8.08 Chemical L 7.83 Chemical C 8.19 Chemical C 8.08 Chemical L 7.97 Chemical C 8.19 Chemical C 8.12 Chemical L 7.37 Chemical C 8.24 Chemical C 6.51 Chemical B 5.21 Chemical B 5.65 Chemical B 4.86 Chemical B 6.14 Chemical B 4.86 Chemical B 3.98 Chemical B 6.02 Chemical B 5.91 Chemical B 4.71 Chemical G 2.57 Chemical G 2.48 Chemical G 2.66 Chemical G 2.99 Chemical G 3.13 Chemical G 2.65 Chemical G 3.85 Chemical G 2.08 Chemical G 2.55 Chemical G 3.06
Baseline Scenario - All Criteria Medium Importance
Additional Scenario #1 - Additional Risk Characterization Information Added; All Criteria Medium Importance
Additional Scenario #2 - Additional Risk Characterization Information Added; Bird Endpoints High Importance; All Other Medium
Additional Scenario #3 - Additional Risk Characterization Information Added; Aquatic Endpoints High Importance; All Other Medium
Additional Scenario #4 - Additional Risk Characterization Information Added; Bird & Fish Incidents rated as N/A; All Other Medium
Additional Scenario #5 - Additional Risk Characterization Information Added; Marine/Estuarine Endpoints Rated as N/A; All Other Medium
Additional Scenario #6 - Additional Risk Characterization Information Added; Fish Endpoints High Importance; All Other Medium
Additional Scenario #7 - Additional Risk Characterization Information Added; Aquatic Invertebrate Endpoints High Importance; All OtherMedium
Additional Scenario #8 - Additional Risk Characterization Information Added; Bird Endpoints High; Aquatic Endpoints Low
Additional Scenario #9 - Additional Risk Characterization Information Added; Aquatic Endpoints High; Bird Endpoints Low
101
In summary, the insecticides used on alfalfa as postemergent sprays which are potentially theleast risky based on the comparison using DecideRight software, including multi-scenarios, are these six:
Chemical P
Chemical N
Chemical M
Chemical I
Chemical K
Chemical D
Chemical P is the top option except where bird endpoints are rated high and aquatic endpoints rated low.In this case, Chemical M is the top option. Alternately, Chemical G is the worst option across allscenarios, and Chemical B is consistently rated as the second worst option.
This summary is similar to the summary based on the previous graphical analysis above:
"In summary for postemergent sprays on alalfa, Chemical G stands out as presenting the greatestpotential acute and chronic risk to birds, and aquatic invertebrates, and chronic risk to fish. Theacute risk to birds appears to be supported by and incident report. Chemical B presents thegreatest acute risk to freshwater fish, Chemical C presents the greatest acute risk tomarine/estuarine fish, and Chemical L presents the greatest dietary risk to birds. The bird incidentreports raises a question concerning the comparatively low risk of Chemical D to birds. Overall,Chemical N, Chemical M, and Chemical P appear to be comparatively less risky than the others."
When the use of the pesticides on alfalfa is considered (See Figure 3), we find that Chemical Cand Chemical D lead based on current estimates of % acres treated with greater than 20% eachfollowed by Chemical G, Chemical I, and Chemical L at greater than 10% each. Considering the resultsfrom the two previous analyses, the overall risk to non-target organisms from insecticides used on alfalfacould be reduced by reducing the use of Chemical G.
.
102
F. Limitations of this Analysis
This proposed methodology for comparing potential ecological risk from the use of pesticides, isintended to identify those pesticides with large differences in risk. Twelve endpoints were considered;however, other endpoints such as effects on wild mammals, non-target plants, non-target insects,reptiles and amphibians were not included. These could be included in a more comprehensive analysis.
The available ecotoxicity and environmental fate data were limited, so that in some cases missingvalues had to be estimated so that the comparison could proceed. The tools used to estimate missingvalues is not perfect as shown by the later submission of an avian chronic NOAEC value of 1 ppm forChemical K, which differed significantly from the estimated value of 23 pm.
The exposure estimates were based on maximum label rates and one-half those rates. Ideally,typical rates would be better information to use for comarison. It is interesting to note that while refinedaquatic EEC estimates based on PRZM/EXAMS were in most cases 2X to 20 X lower than the GENEECEECs, the overall top options and worst options did not change significantly (compare the summary forthe Baseline Scenario and Scenario #1 in Figure 13).
This analysis employs a number of new calculations for expressing potential risk, such as the %contribution to the RQ sum, the frequency of RQ exceedance, the % contribution to the Time to RQ=1sum, and % risk. These have not been used beyond this analysis for these 17 pesticides. Thus, we donot know how useful they will prove to be in expressing risk for other groups and combinations ofpesticides.
We have already identified a number of limitations of the decision support software, DecideRightand others are identified by Tashman and Munro [24]. Comparions with other decision support productshave not yet been made.
103
IX. REFERENCES
1. Memorandum from Linda J. Fisher, Assistant Administrator, Office of Pesticides and Toxic Substances, to Douglas Campt, Director, Office of Pesticide Programs, March 26.1992. Establishment of Ecological and Environmental Fate Data Requirements Task Force
2. Memorandum from Linda J. Fisher, Assistant Administrator, Office of Pesticides and Toxic Substances, to Douglas Campt, Director, Office of Pesticide Programs, October 29, 1992. Decisions on the Ecological, Fate, and Effects Task Force.
3. U.S. EPA. 1992 (March). Comparative Analysis of Acute Avian Risk from Granular Pesticides. U.S. EPA, Office of Pesticide Programs.
4. U.S. EPA. 1994 (September). Avian Granular Risk Reduction Initiative - Progress Report. U.S. EPA, Office of Pesticide Programs.
5. OPP Ecotoxicity Data Base, 1998. Environmental Fate & Effects Division, Office of Pesticide Programs [7507C], Washington, D.C. 20460
6. Driver, C.J., M.W. Ligotke, P. Van Voris, B. D. Greenspan and D. B. Brown. 1991. Routes of uptake and their relative contribution to the toxicologic response of northern Bobwhite (Colinus virginianus) to an organophosphate pesticide. Environ. Toxicol. Chem. 10: 21-33.
7. Erbach, D. and J. Tollefson. 1983. Granular insecticide application for corn rootworm control. Trans. ASAE-1983. Amer. Soc. Agric. Eng. 0001-2351/83/2603-0696.
8. DeWitt, J.B. 1966. Methodology for determining toxicity of pesticides to wild vertebrates. J. Applied Ecol. 3 (suppl.):275-278.
9. U.S. EPA. 1977a. Memorandum, dated 9 September 1977, to Environmental Safety Section, OPP, U.S. EPA: Classification of granulated formulations, from R. Felthousen.
10. U.S. EPA. 1986. Hazard Evaluation Division Standard Evaluation Procedure Ecological Risk Assessment. Office of Pesticide Programs, Washington, D.C. EPA 540/9-86-167.
104
11. U.S. EPA. 1989. Technical Support Document for the Special Review of Carbofuran. January 1989.
12. Hoerger, F. and E. E. Kenaga. 1972. Pesticide Residues on Plants: Correlation of Representative Data as a Basis for Estimation of Their Magnitude in the Environment. IN:F. Coulston and F. Corte, eds., Environmental Quality and Safety: Chemistry, Toxicology, and Technology. Vol I. Georg Thieme Publishers, Stuttgart, West Germany, pp. 9-28.
13. Fletcher, J.S., J.E. Nellesson and T.G. Pfleeger. 1994. Literature Review and Evaluation of the EPA Food-Chain (Kenaga) Nomogram, an Instrument for Estimating Pesticide Residues on Plants. Environ. Tox. and Chem. 13(9): 1383-1391.
14. Willis, G. H. and L. L. McDowell. 1987. Pesticide persistence on foliage. Rev. Environ. Contam. & Tox. 100: 23-73.
15. Rattner, B. A., L. Sileo, and C. G. Scanes. 1982. Oviposition and the Plasma Concentrations of LH, Progesterone and Corticosterone in Bobwhite Quail (Colinus virginianus) fed Parathion. J. Reprod. Fert. 66: 147-155.
16. Bennett, J. K. and R. S. Bennett. 1990. Effects of Dietary Chemical L on Northern Bobwhite Egg Production and Eggshell Quality. Environ. Toxicol. Chem. 19: 907-912.
17. Bennett, R. S. and L. M. Ganio. 1991. Overview of Methods for Evaluating Effects of Pesticides on Reproduction in Birds. U. S. EPA. Environmental Research Laboratory, Corvallis, OR. EPA 600/3-91/048.
18. Hill, E. F. 1994. Acute and Subacute Toxicology in Evaluation of Pesticide Hazard to Avian Wildlife. IN: R. J. Kendall and T. E. Lacher, Jr., eds., Wildlife Toxicology and Population Modeling: Integrated Studies of Agroecosystems. Special Publication of Society of Environmental Toxicology and Chemistry. Lewis Publishers, Boca Raton, FL. pp. 207-226 (Chapter 22).
19. Nagy, K. A. 1987, Field metabolic rate and food requirement scaling in mammals and birds. Ecol. Monogr. 57:111-128.
20. U. S. EPA. 1993. Wildlife Exposure Factors Handbook. Volume I of II.EPA/600/R-93/187a. Office of Research and Development, Washington,
105
D.C. 20460. p. 3-4.
21. R. D. Parker, H. P. Nelson, R. D. Jones*, 1995. GENEEC: A Screening Model for Pesticide Environmental Exposure Assessment. The International Symposium on Water Quality Modeling, American Society for Agricultural Engineering. Orlando, Florida, 1995.
22. U.S. EPA. 1994 (July). Ecological Incident Information System. U.S. EPA, Office of Pesticide Programs.
23. Brassard, C. A., L. P. Kendrick, S. M. Lees, and A. F. Maciorowski. In press. An overview of ecological incident monitoring and reporting. Society of Environmental Chemistry and Toxicology.
24. Tashman, L. and S. Munro. 1997 (January 15, 1997). Software Review -DecideRight. In The Forum, the newsletter of the International Associaction of Business Forecasting. [http://www.loyola.edu/iabf/form.htm]
25. Goodwin, P. and G. Wright. 1991. Decision Analysis for Management Judgement. John Wiley & Sons, publisher.
26. Carsel, R.F., C.N. Smith, L.A. Mulkey, J.D. Dean and P. Jowise. 1984. Users manual for pesticide root zone model (PRZM): Release 1, Rep.EPA-600/3-84-109, 219 pp. Environmental Research Laboratory, Office of Research and Development, U.S. Environmental Protection Agency, Athens, GA.
27. Mullins, J.A., R.F.Carsel, J.E. Scarbrough and A.M. Ivery. 1993. PRZM2 users manual version 1.0, Environmental Research Laboratory, Office of Research and Development, U.S. Environmental Protection Agency, Athens GA.
28. Burns, L.A. 1991. Exposure analysis modeling system: users guide for EXAMS II version 2.94, Environmental Research Laboratory, Office of Research and Development, U.S. Environmental Protection Agency, Athens, GA.
Related Documents


