NBER WORKING PAPER SERIES A COMMUNITY COLLEGE INSTRUCTOR LIKE ME: RACE AND ETHNICITY INTERACTIONS IN THE CLASSROOM Robert W. Fairlie Florian Hoffmann Philip Oreopoulos Working Paper 17381 http://www.nber.org/papers/w17381 NATIONAL BUREAU OF ECONOMIC RESEARCH 1050 Massachusetts Avenue Cambridge, MA 02138 September 2011 We are extremely grateful to Bob Barr, Andrew LaManque, Howard Irvin and Stephen Fletcher for providing the administrative data for students. Special thanks also go to Lydia Hearn, Kathleen Moberg, Mallory Newell, Jerry Rosenberg, and Rowena Tomaneng for providing detailed information on courses, minority student programs, and registration procedures. Thanks also go to Alex Haslam, David Levine, Doug Miller, Uros Petronijevic, and seminar participants at the University of Calgary, University of British Columbia, University of Manitoba, University of Victoria, the Gender and Academia Conference in Sweden, the NBER Education Program fall meeting, the Presidential and Academic Senate Leadership Presentation at De Anza College, Northern California Community Colleges Institutional Researchers workshop, Case Western University, University of Colorado Boulder, the 2013 American Economics Association annual meeting in San Diego, and RAND. The views expressed herein are those of the authors and do not necessarily reflect the views of the National Bureau of Economic Research. NBER working papers are circulated for discussion and comment purposes. They have not been peer- reviewed or been subject to the review by the NBER Board of Directors that accompanies official NBER publications. © 2011 by Robert W. Fairlie, Florian Hoffmann, and Philip Oreopoulos. All rights reserved. Short sections of text, not to exceed two paragraphs, may be quoted without explicit permission provided that full credit, including © notice, is given to the source.

Welcome message from author
This document is posted to help you gain knowledge. Please leave a comment to let me know what you think about it! Share it to your friends and learn new things together.
Transcript
NBER WORKING PAPER SERIES
A COMMUNITY COLLEGE INSTRUCTOR LIKE ME:RACE AND ETHNICITY INTERACTIONS IN THE CLASSROOM
Robert W. FairlieFlorian HoffmannPhilip Oreopoulos
Working Paper 17381http://www.nber.org/papers/w17381
NATIONAL BUREAU OF ECONOMIC RESEARCH1050 Massachusetts Avenue
Cambridge, MA 02138September 2011
We are extremely grateful to Bob Barr, Andrew LaManque, Howard Irvin and Stephen Fletcher forproviding the administrative data for students. Special thanks also go to Lydia Hearn, Kathleen Moberg,Mallory Newell, Jerry Rosenberg, and Rowena Tomaneng for providing detailed information on courses,minority student programs, and registration procedures. Thanks also go to Alex Haslam, David Levine,Doug Miller, Uros Petronijevic, and seminar participants at the University of Calgary, University ofBritish Columbia, University of Manitoba, University of Victoria, the Gender and Academia Conferencein Sweden, the NBER Education Program fall meeting, the Presidential and Academic Senate LeadershipPresentation at De Anza College, Northern California Community Colleges Institutional Researchersworkshop, Case Western University, University of Colorado Boulder, the 2013 American EconomicsAssociation annual meeting in San Diego, and RAND. The views expressed herein are those of theauthors and do not necessarily reflect the views of the National Bureau of Economic Research.
NBER working papers are circulated for discussion and comment purposes. They have not been peer-reviewed or been subject to the review by the NBER Board of Directors that accompanies officialNBER publications.
© 2011 by Robert W. Fairlie, Florian Hoffmann, and Philip Oreopoulos. All rights reserved. Shortsections of text, not to exceed two paragraphs, may be quoted without explicit permission providedthat full credit, including © notice, is given to the source.
A Community College Instructor Like Me: Race and Ethnicity Interactions in the ClassroomRobert W. Fairlie, Florian Hoffmann, and Philip OreopoulosNBER Working Paper No. 17381September 2011, Revised August 2014JEL No. I20,I23,J24,J71
ABSTRACT
Detailed administrative data from a large and diverse community college are used to examine if academicperformance depends on whether students are the same race or ethnicity as their instructors. To identifyracial interactions and address many threats to internal validity we estimate models that include bothstudent and classroom fixed effects. Given the large sample sizes and computational complexity ofthe 2-way fixed effects model we rely on numerical algorithms that exploit the particular structureof the model’s normal equations. Although we find no evidence of endogenous sorting, we furtherlimit potential biases from sorting by focusing on students with restricted course enrollment optionsdue to low registration priorities, students not getting first section choices, and on courses with nowithin-term or within-year racial variation in instructors. We find that the performance gap in termsof class dropout rates, pass rates, and grade performance between white and underrepresented minoritystudents falls by 20-50 percent when taught by an underrepresented minority instructor. We also findthese interactions affect longer term outcomes such as subsequent course selection, retention, and degreecompletion. Potential mechanisms for these positive interactions are examined.
Robert W. FairlieDepartment of EconomicsUniversity of California, Santa CruzSanta Cruz, CA [email protected]
Florian HoffmannVancouver School of EconomicsUniversity of British Columbia#997-1873 East MallVancouver, BC V6T [email protected]
Philip OreopoulosDepartment of EconomicsUniversity of Toronto150 St. George StreetToronto, ON M5S 3G7Canadaand [email protected]
1. Introduction
The achievement gap between historically underrepresented minority students and
non-minority students is one of the most persistent and vexing problems of the
educational system in the United States. African-American, Latino and Native-American
students have substantially lower test scores, grades, high school completion rates,
college attendance rates, and college graduation rates than non-minority students.1 Fryer
and Levitt (2006)and Fryer (2011) document that, for African-Americans, achievement
gaps start to appear in elementary school and persist throughout primary and secondary
education, while Reardon and Galindo (2009)find that, for Hispanics-, achievement gaps
are already substantial at the start of kindergarten.2 The empirical evidence presented by
Fry (2002) and Arcidiacono et al. (2011) suggests that similar gaps exist at post-
secondary institutions. Ultimately these gaps translate into substantially lower completion
rates for African-Americans and Latinos compared to non-minorities. A major concern is
that, in spite of substantial publicity and some affirmative action, the gap has not shrunk
over the last two decades, which contrasts sharply with trends in other educational
disparities such as the gender gap.3 Such persistent disparities in educational attainment
may have major implications for income and wealth inequality across racial and ethnic
1 See U.S. Department of Education (2010). 2 Fryer and Levitt (2013) find no black/white gap in cognitive abilities at age 8 to 12 months. An extensive literature examines the underlying causes of the black/white achievement gap among children and its persistence even after controlling for a wide range of individual and family characteristics (e.g., see Jencks and Phillips 1998). A few examples of recent explanations with empirical support include segregation (Card and Rothstein 2007), attending schools with higher black enrollment shares and less teacher experience (Hanushek and Rivkin 2008), permanent income disparities (Rothstein and Wozny 2011), lower school quality (Fryer and Levitt 2004), and differences in social norms (Austen-Smith and Fryer, 2005). For Hispanics, Reardon and Galindo (2009) find that the gaps in reading and math skills are largest for Hispanic children where English is not spoken at home, but that these children also show the greatest relative gains in the early years of schooling. 3 See e.g. Fryer and Levitt (2006).
2
groups.4 It is therefore imperative to study the sources of the racial achievement gap and
to evaluate the effectiveness of potential policy interventions.
A common, though hotly debated, policy prescription is to expand the
representation of minority instructors at all levels of the educational system. Indeed, there
is a general lack of minority instructors, especially at the post-secondary level: only 9.6
percent of all full-time instructional faculty at U.S. colleges are black, Latino or Native
American, while these groups comprise one-third of the college-age population and an
even higher percentage of children.5 As argued by many social scientists, this imposes
severe limits on the availability of role models, increases the likelihood of “stereotype
threats” and discrimination against minority students, and restricts exposure to instructors
with similar cultures and languages.
In this paper we offer the first systematic empirical study of minority interactions
between students and instructors at the post-secondary education level. We test whether
underrepresented minority students experience significant achievement gains from being
taught by an underrepresented minority professor. "Underrepresented minority", which
we use interchangeably with "minority" below, includes African-Americans, Hispanics,
and Native Americans/Pacific Islanders, but not Asian-Americans.6 These questions are
examined using a novel and unique administrative dataset with detailed demographic
information on instructors as well as students from a large and ethnically diverse
community college. Our data contain comprehensive background information on
instructors and students for each class, students’ course-level academic outcomes, and
long-term outcomes such as majors, retention, degree completion, and transfers to 4-year
4 Such arguments are made in e.g. Altonji and Blank (1999), Card (1999), and Jencks and Phillips (1998). 5 See U.S. Department of Education (2010). 6 This is the common definition used for "underrepresented minority" in California public higher education.
3
colleges. We are also able to match student-course-level data to administrative data on all
registration attempts and waitlists by students at the college, allowing us to examine
whether students get their first choice among sections.
In addition to providing general evidence on the importance of social interactions
by race and ethnicity, our study is also the first to focus on the community college
system. The lack of previous research using data from community colleges is somewhat
surprising given that they enroll nearly half of all students attending public universities.
Since community colleges, in addition to providing workforce training, serve as an
important gateway to 4-year colleges, they can be seen as a crucial part of the post-
secondary educational system in the United States. In fact, in some states, including
California, nearly half of all students attending a 4-year college previously attended a
community college.7 With recent calls for major expansions in enrollments and provision
of 4-year transfer courses, one can expect that community colleges will gain further
importance.8 Policy interventions targeting community colleges are therefore likely to
have major effects on the educational system as a whole.
It is well known that random assignment of students to classes does not occur at
community colleges or 4-year universities outside of the military post-secondary
educational system.9 We therefore employ several empirical strategies to rule out the
possibility that the estimates are driven by omitted variable biases, to explore the external
validity of our results, and to investigate the channels through which our estimated
7 See U.S. Department of Education (2010); CCCCO (2009); Sengupta and Jepsen (2006). 8 For example, President Obama has proposed an unprecedented funding increase for community colleges that aims to boost graduates by 5 million students by 2020. In California, transfers from community colleges to the California State University (CSU) system are projected to increase by 25 percent over the next decade (California Postsecondary Education Commission 2010). 9 Random assignment takes place at the U.S. Air Force Academy that provides undergraduate education for officers in the U.S. Air Force (Carrell, Page, and West 2010).
4
reduced-form effects operate. Our basic empirical approach is built on a regression model
in which the parameter of interest is the differential effect between minority and non-
minority students of being assigned to a minority-instructor in the same class. This
answers the question of whether minority students experience gains relative to non-
minority students from being taught by minority instructors. The focus on estimation of
these interaction effects from panel data such as ours permits tremendous flexibility in
the types of specifications one can estimate. In particular, the explanatory variable of
interest varies both within student and within classroom, allowing us to estimate models
that simultaneously include student and classroom fixed effects. This eliminates biases
coming from student specific differences common across courses and classroom specific
differences common across classmates.10 Including classroom fixed effects leads to
standardizing grade outcomes, since we are only using within-classroom differences
among students who complete the same assignments, take the same exams, and are
subject to the same grading policies. Furthermore, our two-way fixed effects specification
with individual and class fixed effects controls for the possibility that minority and non-
minority students enroll in courses or subjects with more lenient grading policies. Given
the sample size – we observe over 30,000 students in nearly 21,000 classes – estimation
of this model by conventional algorithms is computationally infeasible. To address this
problem, we conduct the first application of an algorithm that has been applied to the
estimation of firm and worker fixed effects with large administrative data to the
estimation of student and teacher fixed effects.11
10 Here and subsequently we use the term “class” or “classroom” to refer to a particular offering or section of a course with a specific instructor during some term, such as "Principle of Microeconomics: ECON-100". Hence, a "class" or "classroom" is uniquely defined by course title, section, and term. 11 See for example Abowd, Kramarz, and Margolis (1999) and Abowd, Creecy, and Kramarz (2002).
5
While our empirical model addresses many of the potential threats to internal
validity, we cannot directly control for differential sorting across minority student groups
that may arise if, for example, highly motivated minority students systematically sort into
minority-taught classes while highly motivated non-minority students do not. However,
with an appropriate set of observable variables that is highly correlated with unobserved
student abilities, such as a student’s past academic performance, this hypothesis of
differential sorting is testable. Implementation of such a test using a rich set of
observables does not uncover any evidence of differential sorting. Nevertheless, we
exploit the institutional features at our community college to generate samples of students
in which the incidence of endogenous sorting of students to instructors is minimized. We
take advantage of the registration priority system at the community college and focus on
students with limited class enrollment choices. Given the intense competition for classes
created by negligible tuition, absence of admissions requirements, and desirable location
of the college, students with the lowest registration priority status have severely restricted
class enrollment choices. Registration attempt data confirm the limited choices of these
students (only 55 percent get their first section choice) and allow us to further refine the
sample. We also estimate our model from a sample of courses in which students have no
choice over instructor's race within a term or even academic year, thus ruling out the
possibility of sorting within that term or year by construction.
We find that the minority achievement gap is smaller in classes taken with
minority instructors for several course outcome measures. Minority students obtain better
grades, are less likely to drop a course, are more likely to pass a course, and are more
likely to have a grade of at least a B. These gaps are reduced by 20-50percent with a
6
minority instructor and translate into longer-run impacts on taking additional courses in
subjects, major choice, retention, and degrees. Effects on dropping a course in the first
few weeks, long-term outcomes, and performance in more objectively graded courses
such as those commonly using multiple-choice exams and math courses, suggest that
students are reacting to the race and ethnicity of the instructor rather than the other way
around. We find evidence of both positive role model effects, with minority students
performing better with minority instructors, and negative influences, with non-minority
students doing worse with minority instructors.
Our paper is related to a number of studies, most notably Dee (2004, 2005, 2007)
and Ehrenberg, Goldhaber and Brewer (1995), that use data from the elementary and 8th
grade educational levels to estimate race and ethnicity interactions between students and
teachers. They find some evidence of positive student-teacher interactions by race and
gender. Our paper is also related to a small, but growing literature that focuses on gender
interactions between students and instructors at the post-secondary level. Similar to our
work, these studies rely increasingly on high-quality administrative student panel data
that can be matched to instructor-level data. They tend to conclude that female students
perform relatively better when matched to female instructors (e.g. Bettinger and Long
2005; Hoffmann and Oreopoulos 2009).12 A recent study by Carrell, Page, and West
(2010), which takes advantage of the random assignment of students to classrooms at the
U.S. Air Force Academy, also finds that female students perform better in math and
science courses with female instructors. None of these previous studies, however,
12 A larger literature studies gender interactions at the primary or secondary school level. The findings are generally mixed (see for example, Nixon and Robinson 1999, Ehrenberg, Goldhaber, and Brewer 1995, Dee 2007, Holmlund and Sund 2005, Carrington, Tymms and Merrel 2008, Lahelma 2000, and Lavy and Schlosser 2007).
7
examine the impact of an instructor’s minority status, race or ethnicity on student
outcomes at the post-secondary education level, due to not being able to obtain race
information on instructors and the lack of underrepresented minority faculty at more
selective colleges. This might be an important omission in the literature, as the effects of
minority faculty on minority students may be larger due to the sizeable racial
achievement gap and similarities in culture, language and economic backgrounds. In
addition, measures of racial inequality in education, income and other outcomes have not
decreased over the last two decades, in sharp contrast to corresponding measures of
gender inequality. Our data also allow us to explore interaction effects on a more
comprehensive set of course-level and long-term outcomes compared to previous studies.
The rest of the paper proceeds as follows: Section 2 starts by providing some
institutional background, and then describes and summarizes the data. The next section
introduces our econometric framework. Section 4 presents evidence on student sorting
and the main results on racial interactions in educational outcomes. The final section
concludes.
2. Data
2.1 Institutional Background
Our analysis is based on administrative data from De Anza College, a large
community college that is located in the San Francisco Bay Area. It is part of the
California Community College system, which is the largest higher educational system in
the United States with 110 colleges and 2.9 million students per year. De Anza College
has an average total enrolment of 22,000 students per year. It has a larger share of
8
minority students than the nationally representative community college, reflecting the
diversity of Northern California. The College is on the quarter system, and the majority
of classes are restricted to 50 or fewer students. The tuition at De Anza College is $17 per
unit (roughly $850 per year in tuition and fees) with a large percentage of students
receiving fee waivers because of financial need. Similar to all community colleges in
California it has open enrolment – anyone with a high school diploma or equivalent is
automatically admitted.
2.2 Registration Priority System
Open enrolment, very low tuition costs, mandated small class sizes, and its
location in the San Francisco Bay Area create intense competition for courses at De Anza
College. Because of the general excess demand for courses, the College has established a
strictly enforced registration priority system which determines the day on which students
are allowed to register over an eight-day period. Registration priority is determined by
whether the student is new, returning or continuing, the number of cumulative units
earned at De Anza College, and enrolment in special programs.13 It does not depend on
past academic performance. Incoming students and students who have taken a break
away from the college have the lowest priority status. Priority status improves for
continuing students by cumulative unit blocks.
13 We remove students enrolled in special and often minority-student focused programs, such as SLAM, STARS, and SSRC. These students receive special registration priority status even if they are new or returning students.
9
A student’s registration priority has a large impact on his or her choice of
classes.14 Conversations with college administrators revealed that students with a low
ranking on course-priority lists have severely limited choices in instructors. As a
consequence, for a particular course that has multiple class offerings these students
should be expected to have little control over the instructor with whom they are matched.
We confirm this anecdotal evidence by analyzing detailed registration attempt and wait-
list data from the college. We find that among students with a low registration priority,
only 54.9 percent of the course sections in which students first attempt to register result in
an actual enrolment, compared with approximately 74.5 percent for students with a
higher registration priority We also find higher probabilities of being placed on wait lists
for first registration attempts among low-registration priority students compared to
students with higher registration priorities (7.2 percent compared with 3.4 percent).
2.3 Data Set
Matching several administrative datasets from the college, National Student
Clearinghouse data, and data from other sources, we are able to examine an extensive set
of course and long-term outcomes as well as detailed demographic characteristics for
every student registered at the community college from fall quarter of 2002 to spring
quarter of 2007. The data on course outcomes record grades, course credits, and course
dropout behaviour for every class offered by De Anza College over the five-year period.
We are able to match them to detailed data on demographic characteristics of instructors,
such as race, ethnicity, age, and gender for every class. To our knowledge, this is the first
14 In personal conversations with college administrators we have learned that students often register for classes as soon as they are allowed to through the system because of the intense competition for courses.
10
dataset that contains detailed information about instructors’ race together with student
class outcomes on the post-secondary education level. A student's registration priority
together with any of her registration attempts is recorded at the beginning of each
quarter.15 Hence, the course-level dataset allows us to match students to classes that
students enrolled in before their first day of the term, regardless of whether they
completed the class or not.
Administrative data from the college provide information on majors together with
all associate and vocational degrees received through summer 2010 for each student
enrolled over the five-year period. We obtain data on an additional long-term outcome –
transfers to 4-year colleges – by linking National Student Clearinghouse data through
summer 2012 to all of the students enrolled during the five-year period.
2.4 Sample Restrictions and Summary Statistics
We first exclude recreational courses, such as cooking, sports and photography,
orientation courses, and summer courses from our analysis. In the main sample we also
exclude courses that have an average enrolment per session of less than 15 students and
small academic departments to minimize computation without losing identification
power. To remove concerns about local community residents taking classes for
recreational purposes and to focus on the general college-age population, we exclude
students who are over 35 years old in the main sample. Only 2.4 percent of all student-
class observations are for small courses, 1.2 percent of observations are for courses from
15 The registration attempt data record the exact date and time the registration attempt was made together with the outcome, such as whether the attempt was successful or ended on a waitlist.
11
a small academic department, and 9.2 percent of observations are for older students. The
resulting sample consists of 446,239 student-class observations.
Of the main sample, 29 percent of observations are from students with low
registration priority status and 10 percent of student/class observations are from entering
students (Panel A, Table 1). Another method of restricting choice among students is to
include course-term or course-year combinations for which different sections are taught
by different instructors, all of which share a particular minority status. Sixty-one percent
of student/class observations have no variation in underrepresented minority status within
quarters and 52 percent of student/class observations have no variation in
underrepresented minority status within academic-years. In terms of types of courses in
the main sample, we find that only 3 percent of student/class observations are in language
courses and 6 percent are in video-delivered classes. We also find that 26 percent of
observations are vocational courses, and 70 percent are courses that are transferable to
University of California (UC) or California State University (CSU) campuses, reflecting
the reputation of De Anza College of being a more academically oriented community
college. We conduct sensitivity analyses with all of these types of courses below.
There are important differences in student outcomes across groups. White and
Asian students have the highest average outcomes (Panel B, Table 1). Hispanics, African-
American, and Native American, Pacific Islander and other non-white students are more
likely to drop classes, are less likely to pass classes, receive lower average grades, and are
less likely to receive a good grade (B or higher).16 For most outcomes, these differences
16 Students have to drop a class by the end of the second week of the quarter to avoid paying for the class and by the end of the third week to avoid getting a record of a grade. A GPA equivalent to a letter grade of a B is commonly used as a minimum threshold for qualification for admission to the University of California.
12
are large and statistically significant, documenting that the largest differences in
academic outcomes take place along the underrepresented minority-non-underrepresented
minority margin rather than along less aggregated measures of differences in race and
ethnicity. Aggregating up these statistics for the underrepresented minority group yields a
dropout rate of 28 percent. The average GPA is 2.6 (where 4.0 is equivalent to an A), and
57 percent of classes taken by students for letter grades receive a grade of B or higher. Of
all underrepresented minority students who finish classes, the total pass rate is 83.5
percent. There also exist racial and ethnic differences in long-term outcomes. African-
American, Latino and other underrepresented students have substantially lower retention
rates, are less likely to obtain a degree from the community college, and are less likely to
transfer to a 4-year college.
Panel C of Table 1 displays the racial and ethnic composition of the student body
and instructors. White students comprise 28 percent of all students and Asians comprise
51 percent of students. Hispanic students represent the largest underrepresented minority
group with 14 percent of all students. African-American students comprise 4 percent of
students and Native American, Pacific Islanders, and other non-white students comprise 3
percent of students. Underrepresented minorities comprise 21 percent of the total student
body. The racial distribution of instructors at the college differs substantially from the
student distribution. 70 percent of instructors are white. In contrast, only 14 percent of
instructors are Asian and 6 percent of instructors are Hispanic. Interestingly, the
percentage of African-American instructors and Native American, Pacific Islander and
other non-white instructors are slightly higher than their representation in the student
body. The lack of minority instructors at De Anza College does not differ from the
13
national pattern for all colleges. Roughly 10 percent of all college instructors are from
underrepresented minority groups (U.S. Department of Education 2010). At De Anza
College, 16 percent of instructors are from underrepresented minority groups.
3. Statistical Methodology
3.1 Basic Econometric Model
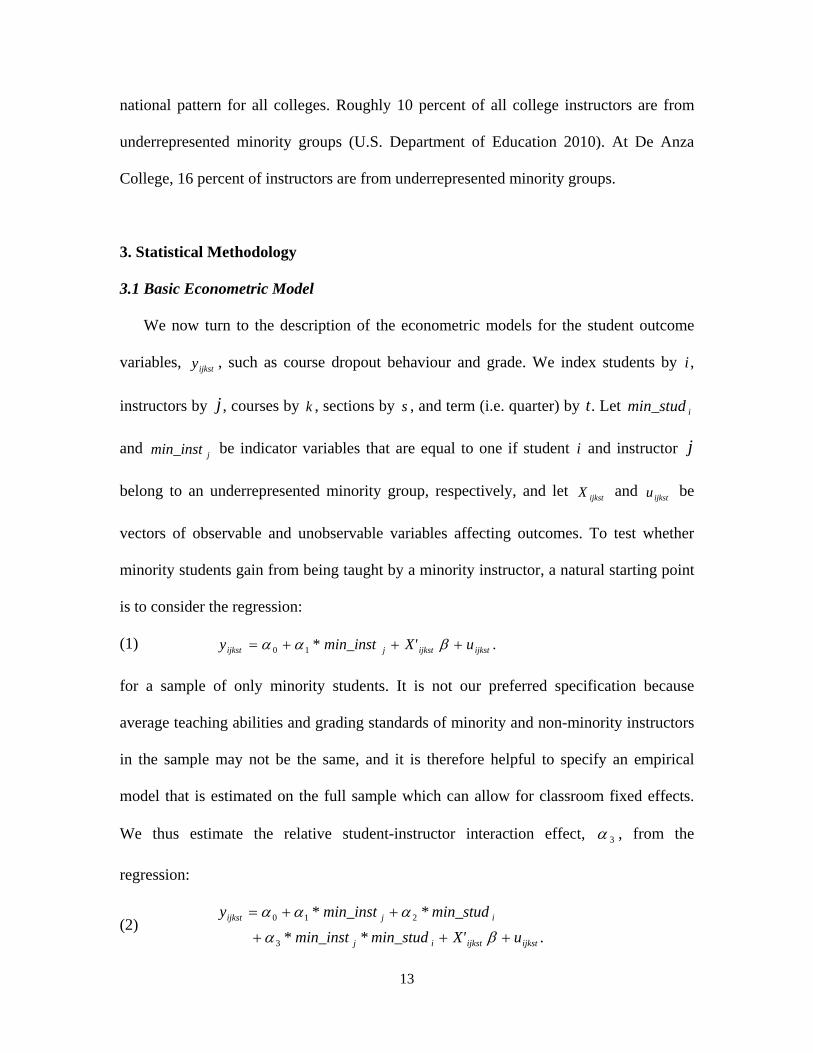
We now turn to the description of the econometric models for the student outcome
variables, ijksty , such as course dropout behaviour and grade. We index students by i ,
instructors by j , courses by k , sections by s , and term (i.e. quarter) by t. Let imin_stud
and jmin_inst be indicator variables that are equal to one if student i and instructor j
belong to an underrepresented minority group, respectively, and let ijkstX and ijkstu be
vectors of observable and unobservable variables affecting outcomes. To test whether
minority students gain from being taught by a minority instructor, a natural starting point
is to consider the regression:
(1) .10 ijkstijkstjijkst uX'min_inst*y
for a sample of only minority students. It is not our preferred specification because
average teaching abilities and grading standards of minority and non-minority instructors
in the sample may not be the same, and it is therefore helpful to specify an empirical
model that is estimated on the full sample which can allow for classroom fixed effects.
We thus estimate the relative student-instructor interaction effect, 3 , from the
regression:
(2) .*
*
3
210
ijkstijkstij
ijijkst
uX'min_studmin_inst*
min_studmin_inst*y
14
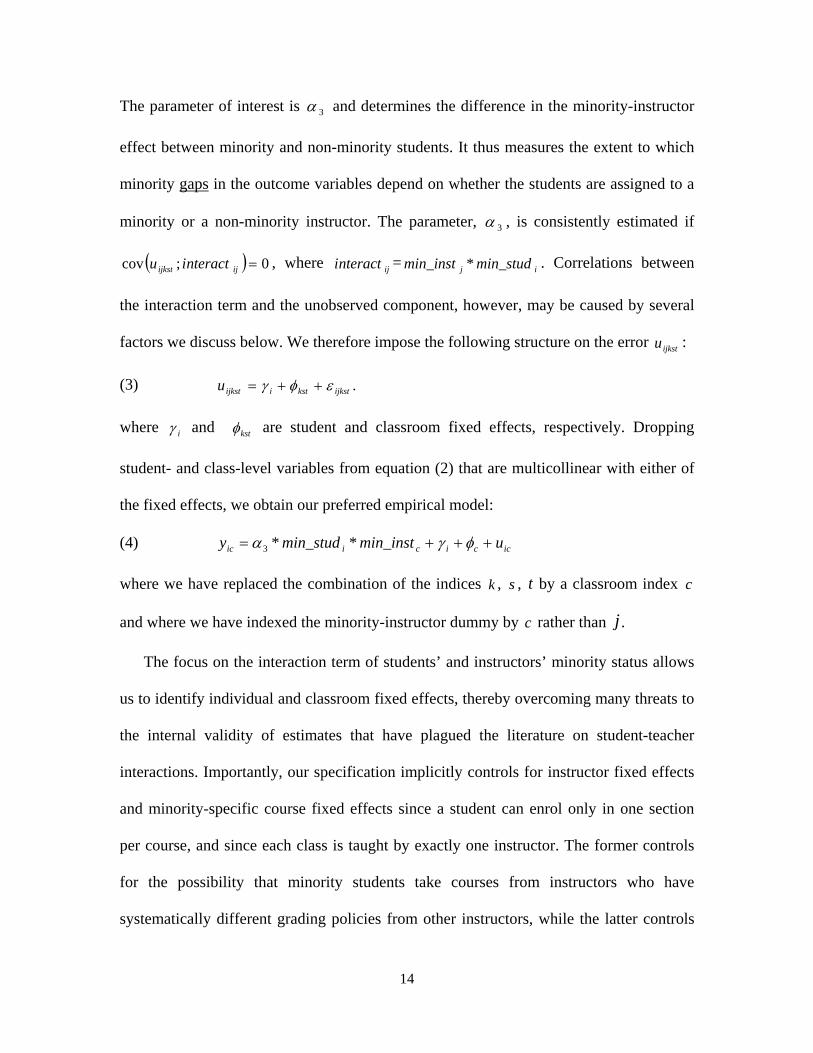
The parameter of interest is 3 and determines the difference in the minority-instructor
effect between minority and non-minority students. It thus measures the extent to which
minority gaps in the outcome variables depend on whether the students are assigned to a
minority or a non-minority instructor. The parameter, 3 , is consistently estimated if
0;cov ijijkst nteractiu , where ijnteracti = ij min_studmin_inst * . Correlations between
the interaction term and the unobserved component, however, may be caused by several
factors we discuss below. We therefore impose the following structure on the error ijkstu :
(3) .ijkstkstiijkstu
where i and kst are student and classroom fixed effects, respectively. Dropping
student- and class-level variables from equation (2) that are multicollinear with either of
the fixed effects, we obtain our preferred empirical model:
(4) icciciic umin_instmin_study **3
where we have replaced the combination of the indices k , s , t by a classroom index c
and where we have indexed the minority-instructor dummy by c rather than j .
The focus on the interaction term of students’ and instructors’ minority status allows
us to identify individual and classroom fixed effects, thereby overcoming many threats to
the internal validity of estimates that have plagued the literature on student-teacher
interactions. Importantly, our specification implicitly controls for instructor fixed effects
and minority-specific course fixed effects since a student can enrol only in one section
per course, and since each class is taught by exactly one instructor. The former controls
for the possibility that minority students take courses from instructors who have
systematically different grading policies from other instructors, while the latter controls
15
for selection by comparative advantage where minority students are drawn to courses that
are a particularly good match or in which minority instructors are relatively
overrepresented. A further advantage of including classroom fixed effects is that they
avoid the need to rely on data with standardized testing procedures across classrooms
since within the same classroom students are taking exactly the same tests. Unless
instructors discriminate against certain groups of students, consciously or subconsciously,
students within a class are subject to identical grading criteria.17 These issues are specific
examples of classroom level shocks (i.e. factors that are unobserved by the
econometrician, that vary at the classroom level, and that affect student performance). It
is therefore essential to only compare academic performances of minority and non-
minority students who enrol in the same class, which subjects them to the same class-
level shocks such as an instructor’s teaching performance or philosophy, the time of day,
or external disruptions. Finally, we include individual fixed effects i in our regressions
to control for absolute sorting that takes place if students taking classes from minority
instructors are systematically different from those who do not, irrespective of their
minority background.
While our specification addresses many of the potential threats to internal
validity, we cannot directly control for differential sorting across minority student groups
that may arise due to correlations between the unobserved component icu and the
interaction term. Such correlations exist if for example highly motivated minority
students systematically sort into minority-taught classes, while highly motivated non-
17 The possibility that student-instructor interactions may exist because instructors react to students rather than vice versa is explored in detail in section 4.6. This issue may arise, however, even if tests are standardized and if students are randomly assigned to instructors. It is thus not a matter of omitted variable
bias, but a matter of interpreting the reduced-form coefficient 3 correctly.
16
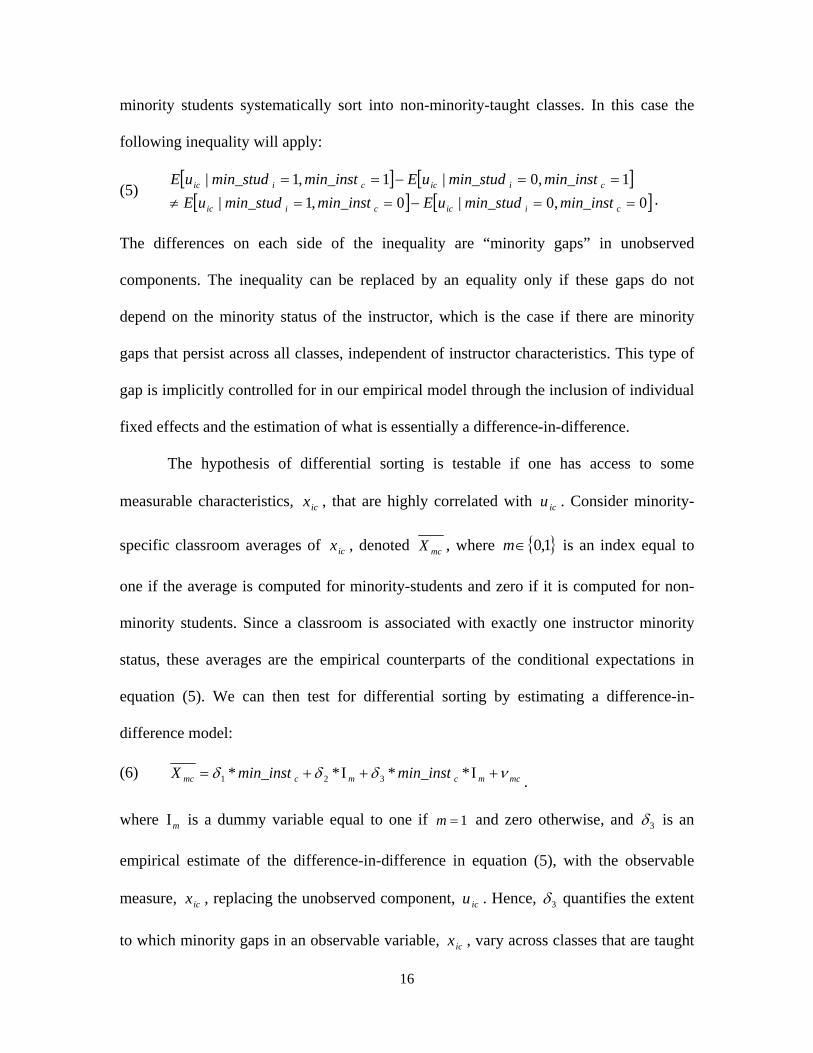
minority students systematically sort into non-minority-taught classes. In this case the
following inequality will apply:
(5) 0,0|0,1|
1,0|1,1|
ciicciic
ciicciic
min_instmin_studuEmin_instmin_studuE
min_instmin_studuEmin_instmin_studuE.
The differences on each side of the inequality are “minority gaps” in unobserved
components. The inequality can be replaced by an equality only if these gaps do not
depend on the minority status of the instructor, which is the case if there are minority
gaps that persist across all classes, independent of instructor characteristics. This type of
gap is implicitly controlled for in our empirical model through the inclusion of individual
fixed effects and the estimation of what is essentially a difference-in-difference.
The hypothesis of differential sorting is testable if one has access to some
measurable characteristics, icx , that are highly correlated with icu . Consider minority-
specific classroom averages of icx , denoted mcX , where 1,0m is an index equal to
one if the average is computed for minority-students and zero if it is computed for non-
minority students. Since a classroom is associated with exactly one instructor minority
status, these averages are the empirical counterparts of the conditional expectations in
equation (5). We can then test for differential sorting by estimating a difference-in-
difference model:
(6) mcmcmcmc min_instmin_instX **** 321 .
where m is a dummy variable equal to one if 1m and zero otherwise, and 3 is an
empirical estimate of the difference-in-difference in equation (5), with the observable
measure, icx , replacing the unobserved component, icu . Hence, 3 quantifies the extent
to which minority gaps in an observable variable, icx , vary across classes that are taught
17
by instructors of different minority groups. Clearly, an estimate of 3 is only helpful in
testing for differential sorting if icx is strongly related to icu . Given the richness of our
data, we are able to use several variables, such as past academic performance, age and
gender, as measureable characteristics to estimate a large set of “sorting regressions”
such as equation (6).
By including classroom fixed effects we implicitly control for systematic
differences in subject or course choices and associated grading differences between
minority and non-minority students. Differential sorting thus is an issue if it takes place
across class offerings of a course, which may happen if there is unrestricted student
choice of classes and multiple sections offered for the same course in the same term. To
address these remaining concerns we estimate specifications in which the sample of
students and courses is chosen to minimize the possibility of differential sorting across
classes. We estimate equation (4) using a sample of students who have the lowest
registration priority status, samples that rule out variation in instructors’ minority status
across classes within course-term or course-year, and a sample of students who do not
obtain their first section of choice identified by the registration attempt data.
We estimate this model for five different student course outcome variables. The
first four are a dummy variable for whether a student drops the course by the first three
weeks of the quarter, a dummy variable for whether a student passes the course
conditional on finishing it, a course grade variable that is normalized to have mean zero
and unit standard deviation within a course, and a dummy variable for whether the
student has a grade above a B-. All of these outcomes relate to a student’s academic
achievement in a particular course. Our data also allow an exploration of whether
18
minority interactions are relevant for a student’s future curriculum. We therefore generate
a fifth outcome variable that records whether a student takes another course in the same
subject in the next quarter, which cannot be directly influenced by the instructor.
In the main specifications, we identify the relative effect of an underrepresented
minority student being assigned to an underrepresented minority instructor (i.e. African-
American, Hispanic, Native American, Pacific Islander, or other non-white). This
specification implicitly assumes that underrepresented minority students are influenced
by any underrepresented minority instructor (e.g. Hispanics react equally whether
matched to a Hispanic or black instructor) and by a similar amount. The alternative case
of interaction effects only when a student is matched with a same race/ethnicity instructor
takes us in the other direction, assuming 1) no effect across minority types (e.g. no
interaction effect for Hispanic students matched to Black instructors or vice versa), and 2)
the performance gap from white and black students being assigned to a black instructor is
the same as that for Hispanic and black students assigned to a black instructor. As
discussed below, when we estimate a full set of interactions for each student type and
each instructor type we find evidence against both these assumptions, and therefore
estimate interaction effects with any minority instructor for our baseline results. Similar
results are obtained with the alternative specification and are displayed in Appendix
Table 3.
3.2 Estimation of Two-Way Fixed Effect Model for Course Outcomes
Estimation of two-way fixed effects models with unbalanced panel data becomes
computationally infeasible with large data sets. With more than 30,000 students and over
19
20,000 classrooms in our data, model parameters cannot be estimated directly by OLS.
Since our data set is a non-balanced panel, conventional within transformations are not
possible, either. We thus rely on recent advances in the estimation of firm-and worker
fixed effects from administrative data. The computational algorithms used to estimate
two-way fixed effects models with high-dimensional sets of dummy variables generally
rely on the fact that each individual only contributes to the identification of a subset of
the fixed effects.18 In our example, each student only contributes to the identification of
the classrooms she or he visits at one point. This implies that normal equations involve
block-diagonal (“sparse”) matrices whose inversion is much less difficult than the
inversion of non-sparse matrices. In practice, one performs a within-transformation in a
first step to eliminate individual fixed effects, and then solves the remaining normal
equations using matrix-inversion schemes that exploit the block-diagonal structure of the
remaining matrices.19
3.3 Bounds on Grades
Estimation of the econometric models for grade outcomes is possible only for the
sample of students who complete the course. The propensity to finish a course might be
affected by the variable of interest – the minority-status interactions between students and
instructors within classrooms - as well. This creates a potential sample selection problem,
formally described by the following set of equations:
18 The seminal paper in this literature is Abowd, Kramarz and Margolis (1999). Refinements have been developed by Abowd, Creezy and Kramarz (2002) and Andrews et al (2008). Cornelissen (2008) has written a Stata-routine based on these algorithms. 19 The literature estimating firm-and worker fixed effects also utilizes the fact that many workers never change firms, thus not contributing to identification of any of the firm fixed effects. This can further increase the speed of computation. In our example, we cannot apply this method since nearly all students take more than one class in the data and thus contribute to the identification of at least some classroom fixed effects.
20
(7) gradeic
gradec
gradeici
gradeic umin_instmin_studgrade **1
(8) droppedic
droppedc
droppedici
droppedic umin_instmin_studdropped **1
(9) **1 icicic gradedroppedgrade .
Equations (7) and (8) replicate equation (4) for the grade-outcome and the dropout-
variable, while equation (9) accounts for the potential selection bias. OLS-estimates of
the parameter of interest, grade1 , are biased conditionally on individual fixed effects if
dropped1 is significantly different from zero. Correcting for sample selection using a
Heckman-selection model is difficult in our case since any variable affecting dropout
behavior arguably also affects potential grades limiting our ability to find an exclusion
restriction. Furthermore, with the inclusion of classroom- and student fixed effects,
estimates from reduced-form Probit equations required for a Heckit-procedure are biased.
We thus estimate non-parametric bounds of grade1 following Lee (2009).20
In general, OLS-estimates are biased downward if minority students are less
likely to drop the course when the instructor belongs to the minority group as well, and if
the marginal students induced to stay come from the left tail of the grade distribution. The
estimates are instead biased upward if the marginal students come from the right tail of
the grade distribution. We can therefore estimate an upper (lower) bound of grade1 when
applying OLS to a sample without the ( dropped1 *100)-percent worst (best) minority
students in classes taught by a minority instructor.
We therefore apply the following procedure: In the first step we estimate equation
(8) for the dropout-variable. This provides us with an estimate of dropped1 , the “minority
20 See also Krueger and Whitmore (2002) and Hoffmann and Oreopoulos (2009) for a related application.
21
gap” in dropout behavior when the class is taught by a minority instructor. We then
calculate the ( dropped1 *100) percentile ( dropped
11 *100 percentile) of the minority-
student grade distribution for every class taught by a minority instructor and drop all
minority students with a final grade lower (higher) than this percentile. Since we are
focusing on selection due to the relative difference from having a minority instructor
between minority and non-minority students, we do not need to trim marginal non-
minority students. In the second step we use this restricted sample to estimate the same
equation as in the first step, but with final grade replacing the dropout variable as the
outcome. We also perform this algorithm by running the dropout-regressions course-by-
course, therefore providing us with course-specific estimates of dropped1 . As Lee (2009)
shows, this procedure yields the tightest bounds on the parameter of interest if the
outcome variable is continuous. We thus compute the bounds only for the grade variable,
which is our only continuous outcome variable, while leaving the results for the discrete
outcome “Passed Course” uncorrected.21
We interpret these bounds results as a robustness check rather than as the main
part of our analysis. By the logic of minority instructors serving as role-models, one may
expect that it is the lower-achieving minority students rather than the best students who
are at the margin of dropping a class and who are induced not to do so because they share
the minority status with their instructor. We test this assumption by estimating a version
of equation (4) for the course dropout variable that allows for an interaction between the
21 Strictly speaking, this variable is not continuous, either. For our application, this can be problematic because the grade distribution has mass-points at the lower and upper tail. Hence, if we trim the distribution at the x%-percentile, we might drop more than x% of the student/grade observations. We solve this problem by randomly drawing from the student/grade observations clustered at the mass-points in such a way that exactly x% of the distribution is trimmed.
22
minority interaction and prior GPA and reject the hypothesis that the minority interaction
is stronger for those with a higher prior GPA.
3.4 Long-Term Outcome Models
In addition to estimating minority instructor-student interactions effects on
subsequent subject course selection, we also examine effects on more aggregated
performance indicators: Retention at the community college, obtaining an associates or
vocational degree, and transferring to a 4-year college. As a consequence of aggregation
that generates only one observation per student we cannot include either classroom or
student fixed effects. Instead, we start with estimating a regression model for long-term
outcomes that includes a rich set of controls for student and instructor, year dummies for
the first term of enrolment, and the number of courses taken in the first term.22 This
specification is of the form of equation (2). In all regressions for aggregate outcomes we
focus on the student-instructor interactions for entering students, mainly because they are
automatically assigned to the lowest level on the registration priority list and have limited
information their first term, but also because results would be confounded by dynamic
accumulation effects otherwise.
To further address endogeneity concerns, we estimate two additional models. In
the spirit of matching estimators, the first of these models include a set of fixed effects
for each set of courses taken in the first term. Since students taking the exact same set of
courses in their first term are assigned the same fixed effect we compare individuals that
“look very similar” with respect to their behaviour at college entry. Variation in having a
22 We use age, gender, financial aid receipt, educational goals at the time of application, free and reduced lunch rate of high school and private high school attendance as controls for student characteristics, and instructor's full- vs. part-time status, gender and age as controls for instructor characteristics.
23
minority instructor would result from students taking these courses in different terms or
in some cases different sections.
The second approach follows Bettinger and Long (2005) and uses the average
deviation in minority instructor shares from steady-state minority instructor shares by
department as an instrumental variable. This instrument is arguably driven by exogenous
variation from term to term (i.e. caused by sabbatical leaves, new hires, variability in the
temporary lecturer pool, retirements, and variability in the number of section offerings).
This variation is averaged across a student's course set and then used as an instrument for
whether the student has a minority instructor in the first term.23 We present estimates for
the three specifications for all long-term outcomes.
4. Results
4.1 Evidence against Sorting
We use several strategies to rule out the possibility that our results are being
driven by unobserved classroom-specific selection. With the inclusion of classroom and
student fixed effects, the primary threat to validity arises from the possibility that classes
where minority students perform better relative to non-minority students than usual are
also classes with a minority instructor and that this effect is not due to the interaction
itself. We first investigate whether there is evidence of non-random sorting by minority
status using equation (6) for various background variables that are likely to be correlated
with the unobserved ability term. We focus on the interaction coefficient, 3 , measuring
23 The instrumental variable is equal to the difference between the minority share of instructors in that term and department and the minority share of instructors in that department over all years (i.e. the steady-state minority instructor share for that department). For additional variation we follow Bettinger and Long (2005) and define separate steady-state minority instructor shares for fall, winter and spring quarters.
24
the extent to which the minority-gap in the outcomes varies across classes taught by
minority and non-minority instructors and is thus an estimate of differential sorting.
Results using several different student background variables are presented in
Table 2. Standard errors are clustered at the course-term-minority level.24 We use the
following four outcome variables, corresponding to the variable mcX in equation (6):
student age, gender, the cumulated number of courses, and the cumulated GPA prior to
enrolment. As past GPA and present GPA are highly correlated, we view the last variable
as a particularly good measure of a potential unobserved student component that might be
related to differential selection. In particular, if the minority-non-minority gap of
accumulated GPA prior to enrolment in the current course is different in classes that are
taught by minority instructors, our assumption of no differential sorting is most likely
violated.
We do not find evidence of sorting: None of the estimates are statistically
significant at any conventional level. Furthermore, this insignificance is not driven by the
imprecision of our estimates. Rather, point estimates fluctuate considerably as we explore
the robustness of our estimates across sub-samples, indicating that we cannot detect any
systematic or robust sorting patterns in the data.25 Most importantly, minority gaps in
accumulated GPA prior to course enrolment – a variable that is most likely to be highly
correlated with unobserved student traits – do not depend on instructor race. In other
words, we do not find evidence that high ability minority students are more likely to take
24 We obtain similar results when standard errors are instead clustered at the instructor level (see Appendix Table 1). . 25 We find that these results are robust with respect to the regression specification, the sample, and the type of variation in instructor minority status across different class offerings of a course. See Fairlie, Hoffmann and Oreopoulos (2011) for results.
25
minority-taught classes compared with high ability non-minority students. We interpret
this as strong evidence in favour of our working hypothesis of no differential sorting.
4.2 Main Results
Estimates of the minority interactions between students and instructors for all five
course outcomes using the full sample and a subsample of students who are low on the
registration priority list are reported in Table 3. We also explore the sensitivity of results
with respect to the set of fixed effects included in the econometric models. As we move
along the columns, we increasingly restrict the variation used to identify our parameter of
interest. Results from our preferred specification described in equation (4) which includes
both student and classroom fixed effects are displayed in column (8) of the table. The
other specifications considered in the table include minority-specific time fixed effects
and a set of student and instructor controls (column 1), a specification that adds minority-
specific course fixed effects (column 2), a specification with minority-specific course-
time fixed effects (column 3), and specifications with student, classroom and instructor
fixed effects (columns 4 to 7, respectively). Standard errors are clustered by instructor.26
There are significant minority interaction effects on student dropout behaviour
and grade performance that are robust with respect to the sample used and the set of fixed
effects included. Our main estimates indicate a reduction of the minority gap in course
26 We follow Cameron and Miller's (2013) suggestion of adapting a conservative strategy by choosing larger clusters. A natural choice is to cluster on the instructor level since this is the level of the treatment variation in our interaction analysis. However, a potential problem with this strategy is that the majority of the instructors in our sample teach multiple classes. As a consequence, standard errors clustered at the instructor level depend directly on classroom fixed effects which are estimated with (small-sample) bias. It is therefore plausible to assume that our standard errors are inflated. We have also estimated all specifications with clustering standard errors at the classroom level. This reduces standard error estimates slightly, but does not affect overall conclusions. We report these alternative results for our main specifications in Appendix Table 2.
26
dropout behaviour when taught by a minority instructor by 2 to 3 percentage points and
in student grades by 5 percent of a standard deviation. These results are robust when
including instructor or classroom fixed effects or when using minority-course fixed
effects, implying that they are not being driven by grading differences across classes or
student sorting by comparative advantage into subjects and courses.27 Our baseline model
with both class and student fixed effects also indicates strong minority interaction effects
on the probability of passing a course among students and the probability of receiving a
grade of B or higher. All of these estimates imply large effects relative to the minority
base rates and the white-minority gaps in outcomes. Underrepresented minority students
are 1.2-2.8 percentage points more likely to pass classes relative to a minority base of 83
percent percent, 2.0-2.9 percent less likely to drop out of classes relative to minority base
of 29 percent, and 2.4-3.2 percentage points more likely to get a grade of B or higher
relative to a minority base of 55 percent in classes with underrepresented instructors. Our
evidence of interaction effects at the extensive margin, like remaining in a course, and at
the intensive margin, like grades within a course, suggests that students are influenced in
multiple ways from instructors' racial and ethnic composition. .
The minority gap in the probability of continuing a subject in the following
quarter is significantly affected by the minority status of the instructor as well.28 This is
27 The inclusion of course-minority fixed effects also helps condition out for possible minority interactions from students having a comparative advantage in some subjects. Minority students may be better at some of the subjects that minority instructors tend to teach. The inclusion of course-minority fixed effects control for this possibility. Examining performance by subject directly, we find that minority students perform at a lower level than non-minority students in all subjects. We also estimated the minority-non-minority grade gap by the concentration of minority instructors in that subject and found no relationship (see Appendix Figure 1). 28 We investigate this further by estimating three sets of regression specifications related to choosing college majors using the different sources of variation for identification discussed in Section 3.2. We examine the minority instructor effect on 1) the first course/s taken in a subject, 2) choosing to major in that subject and 3) taking any additional courses in that subject. We find evidence of positive effects of minority
27
an important outcome of interest because it cannot be directly manipulated by the
instructor and is thus more consistent with students reacting to instructors through, for
example, role model effects than through preferential grading (which we investigate in
more detail in Section 5).
Estimates vary across columns somewhat more when we use the restricted sample
of low-registration priority students, however, estimates for all outcomes in our preferred
specification reported in column 8 indicate significant minority interactions at least at the
10 percent significance level (the only exception is that we lose statistical significance for
grades although the point estimate is very similar to the full sample). The lack of
sensitivity of estimates to the low-registration priority students provides further evidence
that is consistent with the lack of racial sorting across course offerings noted above. We
continue to report estimates from both samples throughout because of the trade-off
between restricting the sample to lessen concerns about potential sorting and using the
full sample to increase precision.
Table 4 shows these results to hold generally when estimating our model for
detailed races rather than the aggregated minority group. While student fixed effects
absorb the interaction for one of the student groups – in our case “whites” - the classroom
fixed effects absorb the interaction for one of the instructor groups – again “whites”.
Thus, only 9 of the 16 race and ethnicity interactions are identified and all estimated
interaction effects are relative to outcomes for white students with alternative instructor
types. We present the P-value from F-tests for two hypotheses of major interest, namely
for the presence of an own-race interaction and for the presence of any race interaction.
instructors on minority students in majoring in that subject, taking any additional courses in that subject, and the total number of additional courses in that subject. These results confirm the course-level results for continuing a subject in the following quarter.
28
We find strong and robust evidence for own-race interactions. The positive interaction
estimates are not overly sensitive to whether we use the full sample or limit the sample to
low-registration priority students. We find positive interactions for all major racial groups
with African-American students experiencing particularly large and robust relative gains
from being taught by a same-race instructor. This is particularly noteworthy given that
African-American students and instructors account for only 4 percent and 6 percent of the
sample, respectively. We also find evidence that Hispanic student academic performance
improves from assignment to Black instructors, rather than a White instructors (but not
vice versa).
4.3 Robustness Checks and External Validity
Although there is robust evidence against differential sorting, the fixed effects
control for most problems with selection, and limiting the sample to low-registration
priority students restricts choice, we address remaining concerns that unobserved
differences in student traits between minority and non-minority students vary across
classes based on the minority-status of the instructor. We experiment with three
specifications that further restrict the variation in instructor minority status within course-
time and across classrooms. Results for various subsamples are shown in Table 5, with
individual and class fixed effects included in all specifications.
First we consider a specification that drops observations for which courses in the
same quarter are taught by both minority and non-minority instructors. Identification of
minority student-instructor interactions therefore comes only from across quarter
variation in instructor ethnicity or race. In the second of this set of regressions we further
29
restrict the sample to exclude variation in instructor minority status within an academic
year for a given course. In this case, students would have to postpone taking a course for
an entire academic year to satisfy a potential racial preference in their instructor, which
may be very difficult given the required sequencing of courses and two-year enrolment
goals. The third specification focuses on a sample of students who failed to enrol in the
course section of their first choice. We construct this sample from our unique
administrative dataset that records all registration attempts by students and their order for
any section within a course in which a student attempts to enrol. As noted above, we find
that only 54.9 percent of low-registration priority students enrol in their first section
choice.
We find a consistent pattern of significant minority interactions when using all
students which are similar to the estimates from the main sample. When relying on the
sample of students with a low registration priority our point estimates are consistent with
the evidence presented above. Although the estimates are imprecise for this sample, their
confidence intervals mostly contain the estimates from the full sample.
Further robustness exercises that are estimated on other subgroups by type of
student and type of course are shown in Appendix Table 4. To summarize, first, we do
not find evidence that the minority interactions are gender specific. Both male and female
minority students perform relatively better with minority instructors compared to non-
minority instructors. Second, results are robust to the exclusion of language courses or
video-delivered courses.
Panel B of Appendix Table 4 displays results that explore whether our findings
are driven by particular institutional features of community colleges relative to 4-year
30
colleges. A first potential concern is students who have an “unstable” academic career
and periodically enrol in courses at community college. We therefore limit our sample of
students who are lowest on the registration priority list to those who enrol at the College
for the first time. This yields point estimates that are nearly identical to those obtained
from a sample of all low registration priority students, suggesting that our results are not
driven by more senior students who are frequently leaving and returning to the college.
The smaller sample size, however, leads to insignificance of our estimates.
A second concern regarding external validity arises due to the types of courses
that are offered at community colleges. We therefore allow parameters to depend on
whether courses are vocational or not and whether they can be transferred to the
University of California and California State University systems. If anything we find that
transferable courses and non-vocational courses have larger minority interaction effects
for most outcomes.
4.4 Bounds analysis of interaction effects on grades
Table 6 displays lower and upper bounds of the minority interaction effects when
using standardized grade outcomes as the dependent variable. We compute these bounds
following the procedure described in Section 3.3 and interpret them as a robustness
exercise. When using the full sample, estimates are bounded between 3.9 percent and 7.7
percent of a standard deviation in the course grade. The estimated lower and upper
bounds are all statistically significant at conventional levels. When using the sample of
low-priority students instead, the sample sizes decrease and the bounds widen. The
bounds are 2.7 percent and 8.2 percent of a standard deviation in the course grade.
31
Standard errors increase by a factor 2, but the upper bounds are statistically significant.
Taken together, these results provide further evidence of a robust and quite substantial
minority interaction effect on grades, in addition to a substantial effect on the probability
of dropping a class.
As argued above, we interpret our uncorrected estimates as representing a lower
bound of minority interactions, since those who are at the margin of dropping a class and
who are induced not to do so because they share the minority status with their instructor
are more likely to be from the lower part of the student ability distribution. This
monotonicity assumption can be tested by estimating a version of model (4) for the
course dropout variable that allows for an interaction between the minority interaction
and prior GPA. It is violated if the minority-interaction is stronger for those with a higher
prior GPA. The estimated minority-interactions are -0.023 (s.e. 0.015) and -0.037 (s.e.
0.025) for the full sample and the sample of low registration priority students,
respectively, while the corresponding triple-interactions with prior GPA are 0.0007 (s.e.
0.005) and 0.004 (s.e. 0.009) respectively. Since the minority effects are estimated to be
negative, their positive interactions with prior GPA thus are in accordance with our
hypothesis. However, these estimates are not significant, suggesting that differential
dropout behavior does not depend systematically on a student’s academic abilities.
4.5 Long-Term Outcomes
Do the social interactions we find at the course level aggregate to affect longer-
term outcomes? We have shown that they do for subsequent course selection, but what
about other educational outcomes that are more directly correlated with labour market
32
outcomes such retention, degree completion, and transferring to 4-year colleges? Table 7
reports estimates from three main regression specifications for these aggregate outcomes
that use different sources of identifying variation. We estimate relative effects for
minority students on the share of minority instructors in the first term as described in
section 3.4.
Examining longer term outcomes prevents the use of student or classroom fixed
effects, but we can condition on students taking the same set of courses in their first term.
We can also instrument instructor minority share in first term with deviations from trend
in the share of minority instructors teaching for any given course, in any given term. Our
earlier baseline results suggest conditioning on observable student background
characteristics leads to similar estimates than when using student fixed effects. So
perhaps our long-term estimated effects are reasonably unbiased.
The first outcome examined is an indicator variable for whether the student
remains at the college over the next two quarters (a full academic year). The selection-
on-observables model reported in Column 1 suggests that raising the share of minority
instructors by one standard deviation (0.25) would increase the relative retention rate for
minorities by about 2.5 percentage points (relative to a minority base rate of 62 percent).
This change would close roughly one third of the white-minority gap in the retention rate.
We obtain a similar estimate when adding fixed effects for the set of courses a student
takes in the first term. When instrumenting instructor share with deviations from trend
we also estimate a statistically significant effect on retention, though larger and less
precise. The second outcome examined is whether a student obtains an associates or
vocational degree. A one standard deviation increase in the minority instructor share
33
leads to roughly a 1.5 percentage point higher relative probability of receiving a degree
(relative to a minority base rate of 14 percent). Estimates from the IV model indicate
larger, but less precisely estimated effects. The evidence for effects on transferring to a 4-
year college, however, is mixed. We find a small and insignificant estimate in column
one, but negative and positive estimates in the remaining two specifications. When
estimating effects on transferring only to UC or Cal State campuses, we find smaller and
less significant estimates. Overall, the race or ethnicity of an instructor appears to exert
an important influence on the long-term outcomes of students in addition to short-term
effects on grades and other course outcomes.29
4.6 Mechanisms
In this section, we further explore the candidate mechanisms driving the social
interactions we estimate above. One key question is whether our estimated effects are due
to students or instructors behaving differently. An obvious potential source of instructor
discrimination is through grading. Several pieces of evidence, however, point against this
explanation. First, we identified courses and departments that commonly use multiple
choice, true/false, matching and performance tests, and/or math courses over of
potentially more "subjective" essay-type tests, reports, presentations and class
participation by conducting an extensive examination of course syllabi and web pages,
course catalogues, and discussions with administrative staff and instructors. The use of
multiple choice, true/false and matching type exams are prevalent at the college, which
may be due in part to faculty having heavy teaching loads of 10-15 courses per academic
29 These estimates are robust to alternative measures of the outcomes, having any minority instructor instead of the minority share of instructors, using all courses instead of first term courses, using the first observed term, and the included controls.
34
year. Appendix Table 5 shows that estimation of our model on this sample yields results
that are very similar to those documented above. As these courses are graded more
objectively, these results provide evidence in favour of interactions occurring from
students reacting to instructors rather than the opposite.
Second, we have documented significant, robust, and sizable minority effects with
respect to course dropout behaviour. The minority gap in this outcome decreases by 2 to
3 percentage points if the class is taught by a minority instructor. The decision to drop
out of the class is made entirely by the student and must be made in the first three weeks
of a term, well before final grades are assigned by instructors. Third, we also find
evidence that race/ethnicity interactions affect longer term outcomes, such as taking
subsequent courses in the same subject, major choice, retention, and degree receipt.
Instructors have no direct effect through grading but possibly serve as role models or
generate interest and continuing studies in a subject.30 Fourth, when allowing minority
effects to vary across three age groups we find an absence of interaction effects for older
students (Appendix Table 5). This also goes against the theory of instructor-based
discrimination on the logic that race or ethnicity based discrimination should not depend
significantly on student age. Instead we find that our point estimates are the largest for
students who are younger than the median aged student. These results are inconsistent
with discrimination affecting all students of a certain race irrespective of age and are
more in line with the idea that young students react more to race of the instructor.31
30 Estimates of minority-interactions for long-term outcome are not sensitive to controlling for first-term grades suggesting that the indirect effect of obtaining a better grade in a course is not driving the positive estimates. 31 Although we do not find evidence of preferential grading by type of instructor, another explanation for the interaction effects we estimate is that there exists a mechanical relationship whereby instructors' grading distributions are correlated with their minority status. Bar and Zussman (2012) find evidence from 'an elite research university' that grade distributions correlate with instructor voting behavior, which in turn
35
The above suggests that our interaction estimates are likely due to students
behaving differently in response to instructor type rather than vice versa. Appendix Table
5 explores whether there are particular student groups who may be especially likely to
gain from assignment to an instructor with the same minority status. Classifying students
by whether they receive financial aid, whether they went to a private school, whether
their high school had a high fraction of students who are eligible for a free-lunch
program, or whether they grew up in a poor or rich neighbourhood, and estimating
separate interactions for these groups, the results suggest that minority effects are fairly
homogeneous. While standard errors for some of the interactions are fairly large,
particularly those for small sub-populations, the point estimates are remarkably robust
across subsamples. In most cases the minority effects are highly significant for the larger
student group, and we cannot reject equality of the minority effects across more
advantaged and disadvantaged students. Thus, minority students from all economic
backgrounds appear to share the relative gains from assignment to a minority instructor.
An important consideration for understanding these relative gains is whether they
occur due to minority students performing better with minority instructors or non-
minority students performing worse. The former may arise from instructors serving as
role models, inspiring underrepresented students. The latter may arise from group
favouritism, where non-minorities, consciously or subconsciously, find it difficult to
may correlate with race or ethnicity. Since minorities tend to score lower grades than non-minorities on average, they systematically benefit from instructors that tend to compress grades towards the upper tail. We tested for this possibility directly and found no evidence of grade distribution differences by minority instructor status. The average grade given by a minority instructor across all courses is 2.86 compared with 2.85 for non-minority instructors. The standard deviation of grades is 1.20 for minority instructors and 1.15 for non-minority instructors. The robustness of our main results to including course-minority fixed effects in regression specifications reported in Table 3 also suggest that this is not the case. Finally we also do not find that minority instructors are clustered in fields in which grades are higher or there is less variance in grades (see Appendix Figures 2 and 3, also see Appendix Table 7 for enrollments and instructor counts by department).
36
learn from a minority instructor. Our baseline results with classroom fixed effects have
the advantage of conditioning on differences across classes and teaching styles, but they
restrict our analysis to minority interactions that are only relative to non-minorities.
However, to explore who benefits and who performs worse from different instructor
types, we need to estimate student-instructor interactions separately for each student type,
thus requiring the exclusion of instructor or classroom fixed effects. We also expand
minority status into five groups: white, African-American, Hispanic, Asian, and Native
American. Doing so allows us to estimate the full set of race/ethnic interactions to
determine which kinds of social interactions matter the most. Appendix Table 6 reports
each of these estimates of 1 in equation (1) after adding student and course fixed effects
as well as instructor characteristic controls. The coefficient is the effect from being
matched to an instructor of different type to a student's own race/ethnicity relative to
being matched to one of the same type.
Appendix Table 6 shows evidence that students perform better with instructors of
the same race/ethnicity, both for minority or non-minority students. For example, white
students are 3.8 percentage points less likely to drop a course with a white instructor
compared to an African-American instructor, whereas African-American students are 4.6
percentage points less likely to drop with an African-American instructor compared to a
white instructor. This finding that whites do relatively worse with black instructors while
black students do relatively better with them suggests that the negative effects on whites
are not driven by overall instructor quality differences (since we also control for course
37
fixed effects). The results also highlight challenges in determining a preferred instructor
allocation, since alternate allocations generate both student gains and losses.32
Interestingly, we find robust negative effects on performance of white students
when being matched to non-white instructors for our other academic outcomes. The gains
for African-American students of being matched to an African-American instructor are
quite robust across samples and outcomes. We find less clear patterns for the other race-
and ethnicity groups, including Hispanics. That some ethnic groups appear to respond
less favourably when matched to instructors of their own type compared with the strong
relative effects for white students deserves mention. Dee (2007) and Hoffmann and
Oreopoulos (2009) observe similar patterns with respect to gender. In both studies, male
students generally perform worse academically with female instructors while female
students do as well with male or female instructors.
One explanation for this behaviour is that students from high status groups react
more strongly to instructors from low-status groups, leading to a kind of self-fulfilling
discrimination. Social psychologists often describe social interactions in terms of "in-
group favouritism", where individuals that identify with each other tend to respond more
positively because they perceive they have similar beliefs or culture, and respond
negatively with others (Tajfel and Turner, 1979). Less attention has been given to the
moderating role that social status plays - the greater one's social status, the greater one's
tendency to display in-group favouritism (Sidanius et al., 1994). This may explain why
white students benefit more from being with white instructors compared to Hispanic
students with Hispanic instructors. The theory deserves more attention in future research.
32 Graham, Imbens, and Ridder (2009) provide more discussion on the policy implications of multiple social interactions in the context of student classroom allocation by gender.
38
5. Conclusion
Using a unique administrative dataset that matches student course outcomes to
instructor's race, we estimate for the first time the importance of racial interactions
between instructors and students at the college level. The estimation of two-way fixed
effect models for a very large number of both students and classrooms over five years
addresses most concerns about potential biases in estimating racial interactions.
Remaining concerns about the internal validity of our estimates are addressed by taking
advantage of the severely restricted class enrolment options among low-registration
priority students at a very popular and class-rationed community college, by restricting
the variation in instructor minority status across classes within term or year, and by
examining students who do not enrol in the course section of first choice based on
registration attempt data. We find that minority students perform relatively better in
classes when instructors are of the same race or ethnicity. Underrepresented minority
students are 1.2-2.8 percentage points more likely to pass classes, 2.0-2.9 percent less
likely to drop out of classes, and 2.4-3.2 percentage points more likely to get a grade of B
or higher in classes with underrepresented instructors. All of these effects are large
relative to the minority base rates and the white-minority gaps. They represent 20-
50percent of the total gaps in classroom outcomes between white and underrepresented
minority students at the college. We also find relative effects on grades of roughly 5
percent of a standard deviation from being assigned an instructor of similar minority
status. Taken together with the large class dropout interaction effects, these impacts are
39
notably larger than those found for gender interactions between students and instructors
at all levels of schooling.
Using a compilation of data from several administrative sources we also examine
minority instructor impacts on long-term outcomes. We find evidence that an instructor's
race or ethnicity affects the likelihood of taking subsequent courses in the same subject
and majoring in the subject. The share of minority instructors in the first quarter also
affects a student's likelihood of retention and degree completion. The finding that our
classroom interaction effects appear to translate into consequential impacts on education
attainment is also noteworthy in suggesting race and ethnic influences may exist in other
settings and cumulatively matter in other ways.
In examining courses that are more objectively graded such as those commonly
relying on multiple choice tests and math courses, we find similar estimated effects on
course outcomes. Taken together with the positive effects on long-term outcomes,
negative effects on drop out behaviour, and similar effects for minority students of all
ages, these results provide evidence that our positive estimates of minority interactions
are likely due to students reacting to instructors rather than the other way around. Further
evidence from the regression results suggests that these estimated positive minority
interactions are due to both positive influences, with minority students performing better
with minority instructors, and negative influences, with non-minority students doing
worse with minority instructors.
Our results suggest that the academic achievement gap between white and
underrepresented minority college students would decrease by hiring more
underrepresented minority instructors. However, the desirability of this policy is
40
complicated by the finding that students appear to react positively when matched to
instructors of a similar race or ethnicity but negatively when not. Hiring more instructors
of one type may also lead to greater student sorting and changes to classroom
composition, which may also impact academic achievement. A more detailed
understanding of heterogeneous effects from instructor assignment, therefore, is needed
before drawing recommendations for improving overall outcomes. The topic is ripe for
further research, especially in light of the recent debates and legislative changes over
affirmative action.
41
References Abowd, J. M., F. Kramarz, and D. N. Margolis. 1999. “High Wage Workers and High Wage Firms.”Econometrica. 67(2): 251-333. Abowd, J., R. Creecy, and F. Kramarz. 2002. “Computing person and firm effects using linked longitudinal employer-employee data.” Technical Report 2002-06, U.S. Census Bureau. Altonji, J. G., and R. M. Blank. 1999. "Race and Gender in the Labor Market." Handbook of Labor Economics, Volume 3C, eds. Orley Ashenfelter and David Card, New York: Elsevier Andrews, M. J., L. Gill, T. Schank, and R. Upward. 2008. "High wage workers and low wage firms: negative assortative matching or limited mobility bias?," Journal Of The Royal Statistical Society Series A, vol. 171(3), pp. 673-697. Arcidiacono, P., E. Aucejo, and K. Spenner. 2011. “What happens after Enrollment? An Analysis of the Time Path of Racial Differences in GPA and Major Choice” mimeo, Duke University. Austen-Smith, David, and Roland G. Fryer, Jr. (2005). "An economic analysis of 'acting white'," Quarterly Journal of Economics, Vol. 120, No. 2 May 2005, pp. 551-583. Bar, Talia, and Asaf Zussman. 2012. “Partisan Grading, ” American Economic Journal: Applied Economics, 4(1): 30-48. Bettinger, E. and B. T. Long. 2005. “Do Faculty Serve as Role Models? The Impact of Instructor Gender on Female Students.” American Economic Review, vol. 95(2), pp. 152-157. California Community Colleges Chancellor’s Office. 2009. “Accountability Reporting for the California Community Colleges,” A Report to the Legislature, Pursuant to AB 1417 (Pacheco, Stat. 2004, Ch. 581). California Postsecondary Education Commission. 2010. “Ready or Not, Here They Come: California State University Undergraduate Demand Projections, 2009–2019,” Report 10-05. Cameron, A. Colin, and Douglas L. Miller. 2013. "A Practitioner's Guide to Cluster-Robust Inference," University of California, Davis Working Paper.
42
Carrington, B., Tymms, P. and C. Merrel. 2008. “Role models, school improvement and the “gender gap” – Do men bring out the best in boys and women the best in girls?”, British Educational Research Journal, 34(3): 315-327. Card, D. 1999. "The Causal Effect of Education on Earnings." Handbook of Labor Economics, Volume 3A. Ed. Ashenfelter, Orley and David Card. Amsterdam: Elsevier, p.1801-1863. Card, David, and Jesse Rothstein. 2007. "Racial segregation and the black–white test score gap,"Journal of Public Economics, 91(11–12): 2158–2184. Carrell, S. E., M. E. Page, and J. E. West. 2010. “Sex and Science: How Professor Gender Perpetuates the Gender Gap,” Quarterly Journal of Economics. 125 (3): 1101-1144. Cornelissen, T. 2008. “The Stata command felsdvreg to fit a linear model with two high-dimensional fixed effects.” Stata Journal vol. 8: 170-189. Dee, Thomas S. 2004. “Teachers, race and student achievement in a randomized experiment” The Review of Economics and Statistics, 86(1), pp. 195-210. Dee, T. S. 2005. “A Teacher Like Me: Does Race, Ethnicity or Gender Matter?” American Economic Review, 95(2), pp. 158-165. Dee, T. S. 2007. “Teachers and the Gender Gaps in Student Achievement,” Journal of Human Resources 42(3), pp. 528-554. Ehrenberg, R., D. Goldhaber and D. Brewer. 1995. "Do Teachers' Race, Gender and Ethnicity Matter? Evidence from the National Educational Longitudinal Study of 1988." Industrial and Labor Relations Review, 48(3), pp. 547-561. Fairlie, Robert W., Florian Hoffmann, and Philip Oreopoulos. 2011. "A community college instructor like me: Race and ethnicity interactions in the classroom," NBER Working Paper No. 17381. Fry, Richard (2002). "Latinos in Higher Education: Many Enroll, Too Few Graduate," Pew Hispanic Center Working Paper. Fryer, R. 2011. “Racial Inequality in the 21st Century: The Declining Significance of Discrimination.” The Handbook of Labor Economics, Elsevier. Fryer, R. and S. Levitt. 2006. “The Black-White Test Score Gap Through Third Grade.” American Law and Economics Review, 8(2), pp. 249-281. Fryer, Roland G. Jr., and Steven D. Levitt. 2013, "Testing for Racial Differences in the Mental Ability of Young Children," American Economic Review (forthcoming).
43
Fryer, Roland G. Jr., and Steven D. Levitt. 2004. "Understanding the Black-White Test Score Gap in the First Two Years of School," The Review of Economics and Statistics. Graham, Bryan S., Guido W. Imbens, Geert Ridder (2009). "Complementarity and Aggregate Implications of Assortative Matching: A Nonparametric Analysis," NBER Working Paper No. 14860. Hanushek, Eric A., and Steven G. Rivkin. 2008. "Harming the Best: How Schools Affect the Black-White Achievement Gap," Working Paper 14211 Hoffmann, F. and P. Oreopoulos. 2009. “A Professor Like Me: The Influence of Instructor Gender on University Achievement.” Journal of Human Resources, 44(2), pp. 479-494. Holmlund, H. and K. Sund. 2005. “Is the Gender Gap in School Performance Affected by the Sex of the Teacher?” Swedish Institute for Social Research, Stockholm University Working Paper No. 5, 2005. Jencks, C. and M. Phillips. 1998. “The Black-White Test Score Gap,” Washington, DC: Brookings Institution Press. Krueger, A. & Whitmore, D. 2002. “Would smaller classes help close the black-white achievement gap?” In J. Chubb and T. Loveless (Eds.), Bridging the achievement gap. Washington, DC: Brookings Institute Press. Lahelma, E. 2000. “Lack of male teachers: A problem for students or teachers?” Pedagogy, Culture and Society, 8(2), pp. 173-86. Lavy, V. and A. Schlosser. 2007. “Mechanisms and Impacts of Gender Peer Effects at School,” mimeo. Lee, D. 2009. “Training, Wages, and Sample Selection: Estimating Sharp Bounds on Treatment Effects,” Review of Economic Studies, 76(3), pp. 1071-1102. Nixon, L. and M. Robinson. 1999. “The educational attainment of young women: Role model effects of female high school faculty,” Demography, 36(2), 185-194. Reardon, Sean F., and Claudia Galindo. "The Hispanic-White achievement gap in math and reading in the elementary grades." American Educational Research Journal 46, no. 3 (2009): 853-891. Rothstein, Jesse, and Nathan Wozny. 2011. "Permanent Income and the Black-White Test Score Gap," National Bureau of Economic Research Working Paper No. 17610.
44
Sengupta, Ria, and Christopher Jepsen. 2006. "California’s Community College Students," California Counts: Population Trends and Profiles, Volume 8, Number 2, Public Policy Institute of California, November 2006. Sidanius, Jim, Felicia Pratto, and Joshua L. Rabinowitz. (1994). "Gender, Ethnic Status, and Ideological Asymmetry: A Social Dominance Interpretation," Journal of Cross-Cultural Psychology, Vol. 25, No. 2, pp. 194-216. Tajfel, Henri, and John C. Turner. "An integrative theory of intergroup conflict." The social psychology of intergroup relations 33 (1979): 47. U.S. Department of Education. 2010. Digest of Education Statistics 2009 (NCES 2009-022). National Center for Education Statistics, Institute of Education Sciences, U.S. Department of Education. Washington, DC.
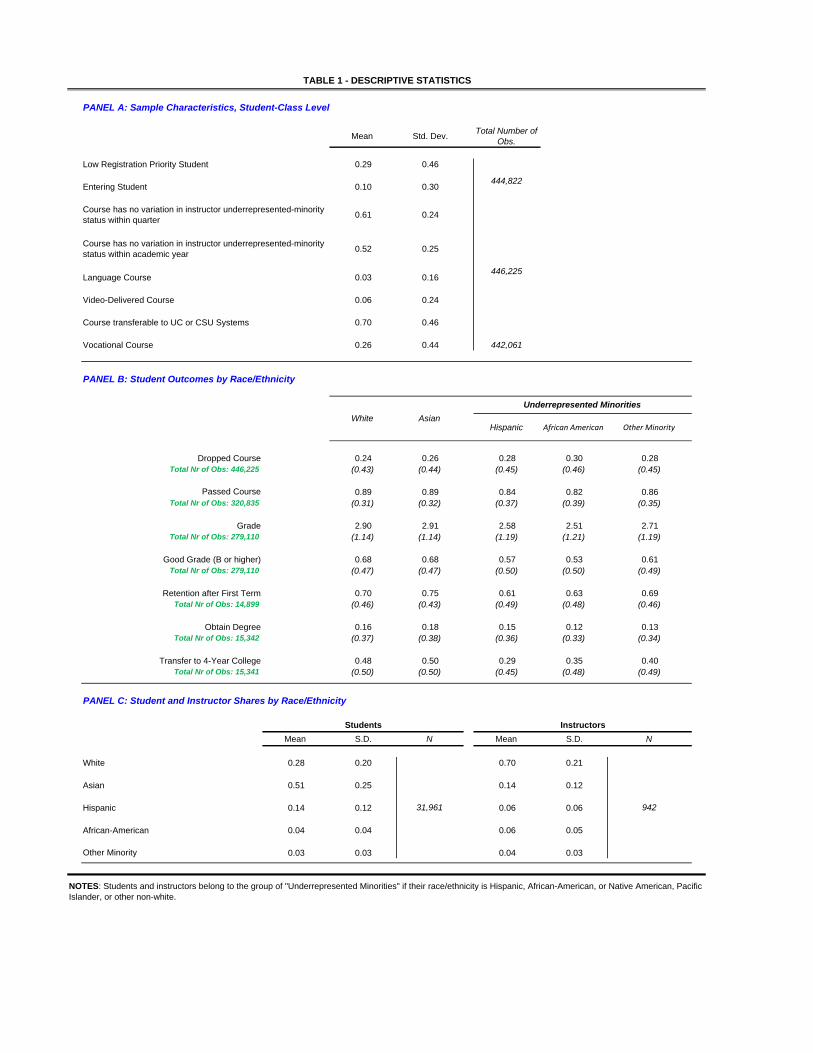
PANEL A: Sample Characteristics, Student-Class Level
Mean Std. Dev.Total Number of
Obs.
Low Registration Priority Student 0.29 0.46
Entering Student 0.10 0.30
Language Course 0.03 0.16
Video-Delivered Course 0.06 0.24
Course transferable to UC or CSU Systems 0.70 0.46
Vocational Course 0.26 0.44 442,061
PANEL B: Student Outcomes by Race/Ethnicity
Hispanic African American Other Minority
Dropped Course 0.24 0.26 0.28 0.30 0.28Total Nr of Obs: 446,225 (0.43) (0.44) (0.45) (0.46) (0.45)
Passed Course 0.89 0.89 0.84 0.82 0.86Total Nr of Obs: 320,835 (0.31) (0.32) (0.37) (0.39) (0.35)
Grade 2.90 2.91 2.58 2.51 2.71Total Nr of Obs: 279,110 (1.14) (1.14) (1.19) (1.21) (1.19)
Good Grade (B or higher) 0.68 0.68 0.57 0.53 0.61Total Nr of Obs: 279,110 (0.47) (0.47) (0.50) (0.50) (0.49)
Retention after First Term 0.70 0.75 0.61 0.63 0.69Total Nr of Obs: 14,899 (0.46) (0.43) (0.49) (0.48) (0.46)
Obtain Degree 0.16 0.18 0.15 0.12 0.13Total Nr of Obs: 15,342 (0.37) (0.38) (0.36) (0.33) (0.34)
Transfer to 4-Year College 0.48 0.50 0.29 0.35 0.40Total Nr of Obs: 15,341 (0.50) (0.50) (0.45) (0.48) (0.49)
PANEL C: Student and Instructor Shares by Race/Ethnicity
Mean S.D. N Mean S.D. N
White 0.28 0.20 0.70 0.21
Asian 0.51 0.25 0.14 0.12
Hispanic 0.14 0.12 0.06 0.06
African-American 0.04 0.04 0.06 0.05
Other Minority 0.03 0.03 0.04 0.03
31,961 942
NOTES: Students and instructors belong to the group of "Underrepresented Minorities" if their race/ethnicity is Hispanic, African-American, or Native American, Pacific Islander, or other non-white.
444,822
446,225
TABLE 1 - DESCRIPTIVE STATISTICS
Students Instructors
Underrepresented Minorities
White Asian
Course has no variation in instructor underrepresented-minority status within quarter
Course has no variation in instructor underrepresented-minority status within academic year
0.61
0.52
0.24
0.25
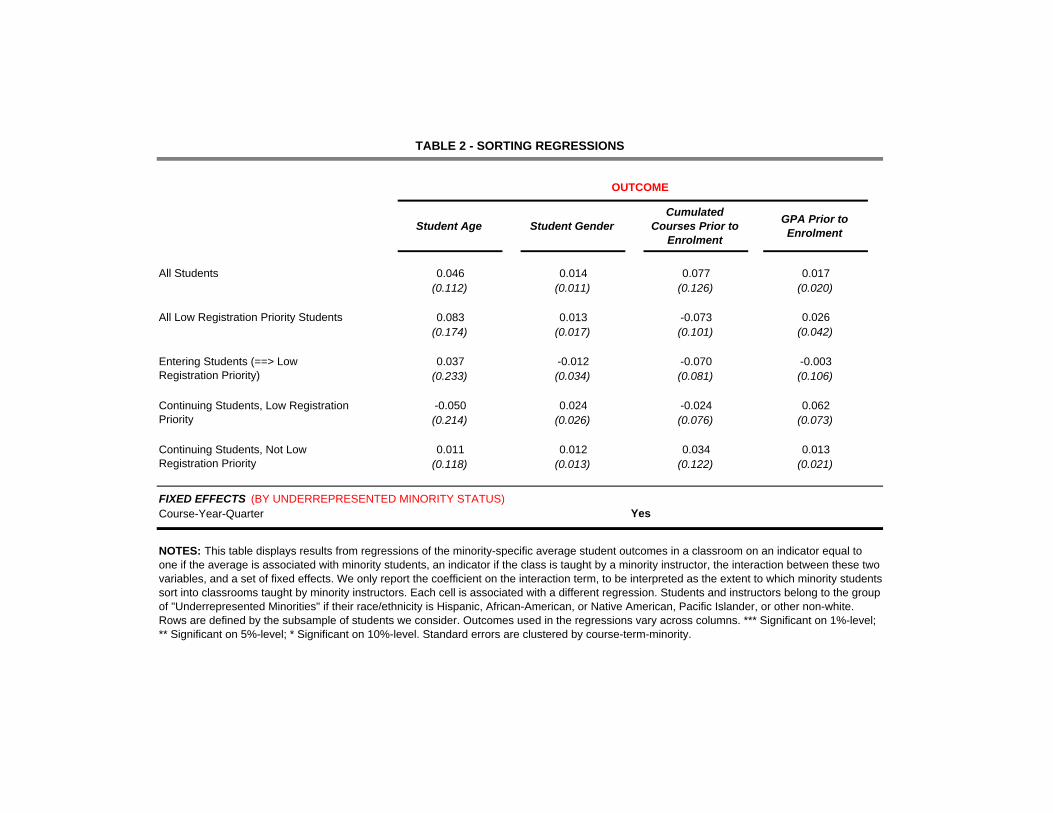
Student Age Student GenderCumulated
Courses Prior to Enrolment
GPA Prior to Enrolment
All Students 0.046 0.014 0.077 0.017(0.112) (0.011) (0.126) (0.020)
All Low Registration Priority Students 0.083 0.013 -0.073 0.026(0.174) (0.017) (0.101) (0.042)
0.037 -0.012 -0.070 -0.003(0.233) (0.034) (0.081) (0.106)
-0.050 0.024 -0.024 0.062(0.214) (0.026) (0.076) (0.073)
0.011 0.012 0.034 0.013(0.118) (0.013) (0.122) (0.021)
FIXED EFFECTS (BY UNDERREPRESENTED MINORITY STATUS)Course-Year-Quarter
NOTES: This table displays results from regressions of the minority-specific average student outcomes in a classroom on an indicator equal to one if the average is associated with minority students, an indicator if the class is taught by a minority instructor, the interaction between these two variables, and a set of fixed effects. We only report the coefficient on the interaction term, to be interpreted as the extent to which minority students sort into classrooms taught by minority instructors. Each cell is associated with a different regression. Students and instructors belong to the group of "Underrepresented Minorities" if their race/ethnicity is Hispanic, African-American, or Native American, Pacific Islander, or other non-white. Rows are defined by the subsample of students we consider. Outcomes used in the regressions vary across columns. *** Significant on 1%-level; ** Significant on 5%-level; * Significant on 10%-level. Standard errors are clustered by course-term-minority.
TABLE 2 - SORTING REGRESSIONS
OUTCOME
Entering Students (==> Low Registration Priority)
Continuing Students, Low Registration Priority
Continuing Students, Not Low Registration Priority
Yes
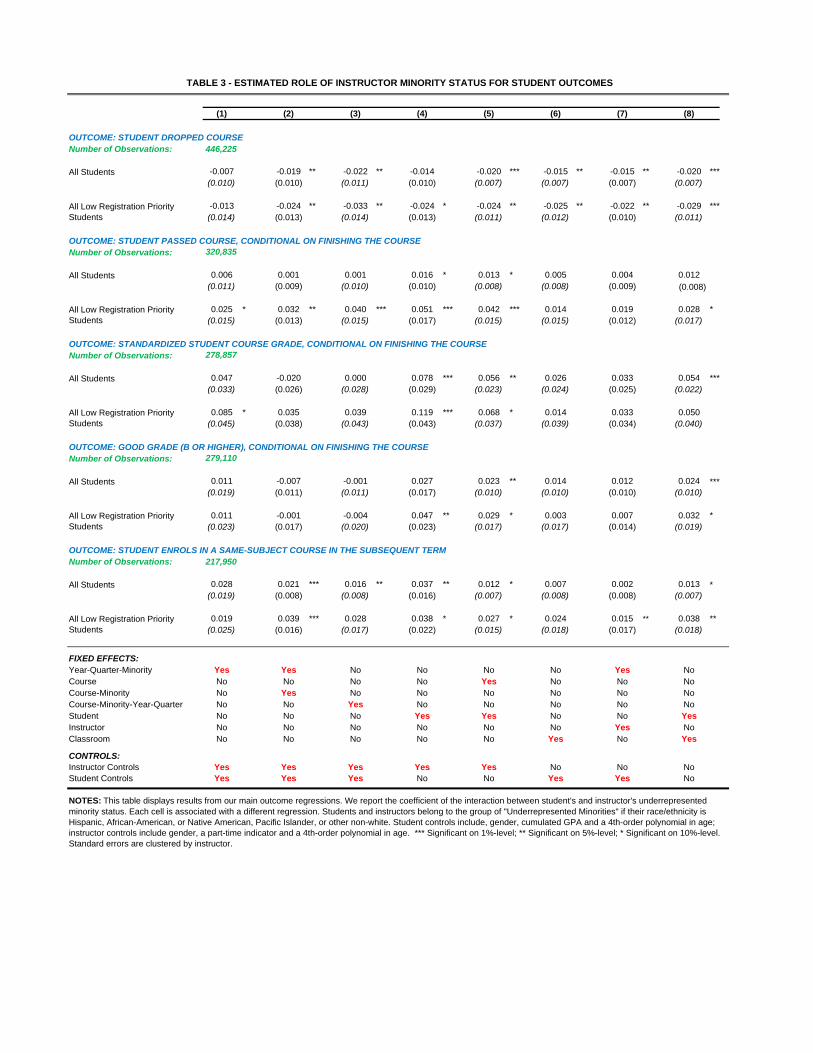
(1) (2) (3) (4) (5) (6) (7) (8)
OUTCOME: STUDENT DROPPED COURSENumber of Observations: 446,225
All Students -0.007 -0.019 ** -0.022 ** -0.014 -0.020 *** -0.015 ** -0.015 ** -0.020 ***(0.010) (0.010) (0.011) (0.010) (0.007) (0.007) (0.007) (0.007)
-0.013 -0.024 ** -0.033 ** -0.024 * -0.024 ** -0.025 ** -0.022 ** -0.029 ***(0.014) (0.013) (0.014) (0.013) (0.011) (0.012) (0.010) (0.011)
OUTCOME: STUDENT PASSED COURSE, CONDITIONAL ON FINISHING THE COURSENumber of Observations: 320,835
All Students 0.006 0.001 0.001 0.016 * 0.013 * 0.005 0.004 0.012(0.011) (0.009) (0.010) (0.010) (0.008) (0.008) (0.009) (0.008)
0.025 * 0.032 ** 0.040 *** 0.051 *** 0.042 *** 0.014 0.019 0.028 *(0.015) (0.013) (0.015) (0.017) (0.015) (0.015) (0.012) (0.017)
OUTCOME: STANDARDIZED STUDENT COURSE GRADE, CONDITIONAL ON FINISHING THE COURSENumber of Observations: 278,857
All Students 0.047 -0.020 0.000 0.078 *** 0.056 ** 0.026 0.033 0.054 ***(0.033) (0.026) (0.028) (0.029) (0.023) (0.024) (0.025) (0.022)
0.085 * 0.035 0.039 0.119 *** 0.068 * 0.014 0.033 0.050(0.045) (0.038) (0.043) (0.043) (0.037) (0.039) (0.034) (0.040)
OUTCOME: GOOD GRADE (B OR HIGHER), CONDITIONAL ON FINISHING THE COURSENumber of Observations: 279,110
All Students 0.011 -0.007 -0.001 0.027 0.023 ** 0.014 0.012 0.024 ***(0.019) (0.011) (0.011) (0.017) (0.010) (0.010) (0.010) (0.010)
0.011 -0.001 -0.004 0.047 ** 0.029 * 0.003 0.007 0.032 *(0.023) (0.017) (0.020) (0.023) (0.017) (0.017) (0.014) (0.019)
OUTCOME: STUDENT ENROLS IN A SAME-SUBJECT COURSE IN THE SUBSEQUENT TERMNumber of Observations: 217,950
All Students 0.028 0.021 *** 0.016 ** 0.037 ** 0.012 * 0.007 0.002 0.013 *(0.019) (0.008) (0.008) (0.016) (0.007) (0.008) (0.008) (0.007)
0.019 0.039 *** 0.028 0.038 * 0.027 * 0.024 0.015 ** 0.038 **(0.025) (0.016) (0.017) (0.022) (0.015) (0.018) (0.017) (0.018)
FIXED EFFECTS:Year-Quarter-Minority Yes Yes No No No No Yes NoCourse No No No No Yes No No NoCourse-Minority No Yes No No No No No NoCourse-Minority-Year-Quarter No No Yes No No No No NoStudent No No No Yes Yes No No YesInstructor No No No No No No Yes NoClassroom No No No No No Yes No Yes
CONTROLS:Instructor Controls Yes Yes Yes Yes Yes No No NoStudent Controls Yes Yes Yes No No Yes Yes No
NOTES: This table displays results from our main outcome regressions. We report the coefficient of the interaction between student's and instructor's underrepresented minority status. Each cell is associated with a different regression. Students and instructors belong to the group of "Underrepresented Minorities" if their race/ethnicity is Hispanic, African-American, or Native American, Pacific Islander, or other non-white. Student controls include, gender, cumulated GPA and a 4th-order polynomial in age; instructor controls include gender, a part-time indicator and a 4th-order polynomial in age. *** Significant on 1%-level; ** Significant on 5%-level; * Significant on 10%-level. Standard errors are clustered by instructor.
TABLE 3 - ESTIMATED ROLE OF INSTRUCTOR MINORITY STATUS FOR STUDENT OUTCOMES
All Low Registration Priority Students
All Low Registration Priority Students
All Low Registration Priority Students
All Low Registration Priority Students
All Low Registration Priority Students
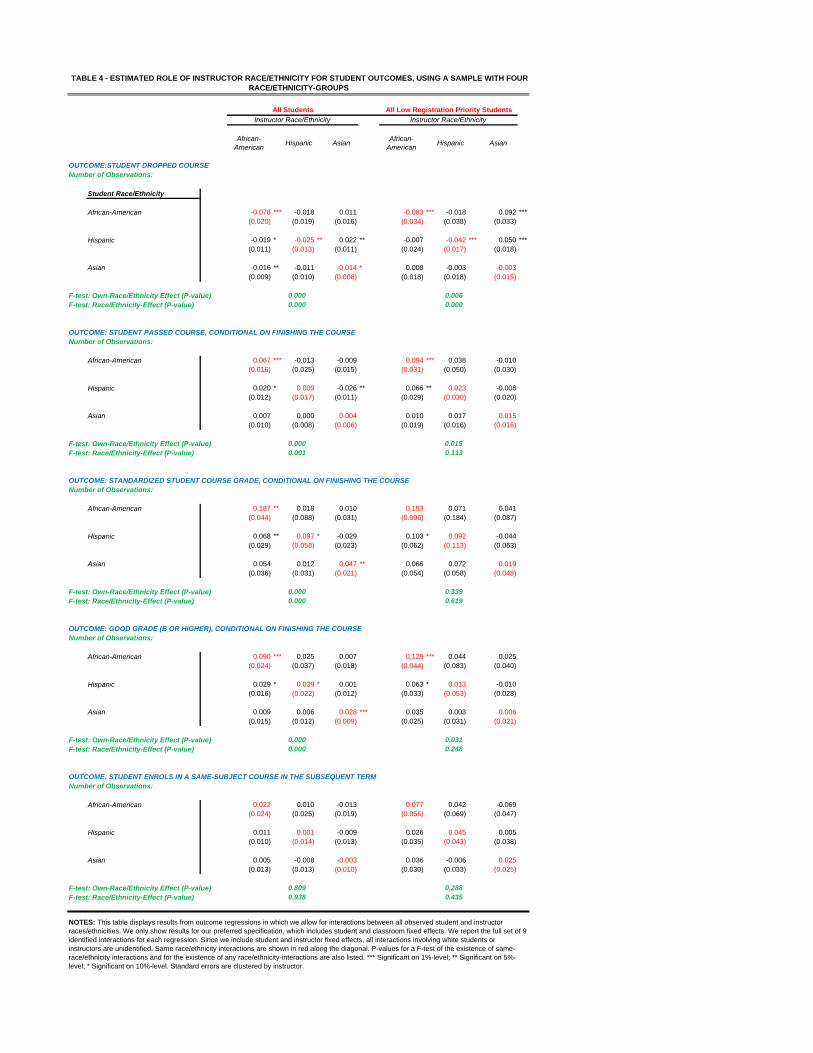
African-American
Hispanic AsianAfrican-
AmericanHispanic Asian
OUTCOME:STUDENT DROPPED COURSENumber of Observations:
Student Race/Ethnicity
African-American -0.078 *** -0.018 0.011 -0.083 *** -0.018 0.092 ***(0.020) (0.019) (0.016) (0.034) (0.038) (0.033)
Hispanic -0.019 * -0.025 ** 0.022 ** -0.007 -0.042 *** 0.050 ***(0.011) (0.013) (0.011) (0.024) (0.017) (0.018)
Asian -0.016 ** -0.011 -0.014 * 0.008 -0.003 -0.003(0.009) (0.010) (0.008) (0.018) (0.018) (0.015)
F-test: Own-Race/Ethnicity Effect (P-value)F-test: Race/Ethnicity-Effect (P-value)
OUTCOME: STUDENT PASSED COURSE, CONDITIONAL ON FINISHING THE COURSENumber of Observations:
African-American 0.067 *** -0.013 -0.009 0.094 *** 0.038 -0.010(0.016) (0.025) (0.015) (0.031) (0.050) (0.030)
Hispanic 0.020 * 0.009 -0.026 ** 0.066 ** 0.023 -0.008(0.012) (0.017) (0.011) (0.029) (0.030) (0.020)
Asian 0.007 0.000 0.004 0.010 0.017 0.015(0.010) (0.008) (0.006) (0.019) (0.016) (0.016)
F-test: Own-Race/Ethnicity Effect (P-value)F-test: Race/Ethnicity-Effect (P-value)
OUTCOME: STANDARDIZED STUDENT COURSE GRADE, CONDITIONAL ON FINISHING THE COURSENumber of Observations:
African-American 0.187 ** 0.018 0.010 0.153 0.071 0.041(0.044) (0.088) (0.031) (0.096) (0.184) (0.087)
Hispanic 0.068 ** 0.097 * -0.029 0.103 * 0.092 -0.044(0.029) (0.058) (0.023) (0.062) (0.113) (0.063)
Asian 0.054 0.012 0.047 ** 0.066 0.072 0.019(0.036) (0.031) (0.021) (0.054) (0.058) (0.048)
F-test: Own-Race/Ethnicity Effect (P-value)F-test: Race/Ethnicity-Effect (P-value)
OUTCOME: GOOD GRADE (B OR HIGHER), CONDITIONAL ON FINISHING THE COURSENumber of Observations:
African-American 0.090 *** 0.025 0.007 0.129 *** 0.044 0.025(0.024) (0.037) (0.018) (0.044) (0.083) (0.040)
Hispanic 0.029 * 0.039 * 0.001 0.063 * 0.013 -0.010(0.016) (0.022) (0.012) (0.033) (0.053) (0.028)
Asian 0.009 0.006 0.028 *** 0.035 0.003 0.006(0.015) (0.012) (0.009) (0.025) (0.031) (0.021)
F-test: Own-Race/Ethnicity Effect (P-value)F-test: Race/Ethnicity-Effect (P-value)
OUTCOME: STUDENT ENROLS IN A SAME-SUBJECT COURSE IN THE SUBSEQUENT TERMNumber of Observations:
African-American 0.022 0.010 -0.013 0.077 0.042 -0.069(0.024) (0.025) (0.019) (0.056) (0.069) (0.047)
Hispanic 0.011 0.001 -0.009 0.026 0.045 0.005(0.010) (0.014) (0.013) (0.035) (0.043) (0.038)
Asian 0.005 -0.008 -0.003 0.036 -0.006 0.025(0.013) (0.013) (0.010) (0.030) (0.033) (0.025)
F-test: Own-Race/Ethnicity Effect (P-value)F-test: Race/Ethnicity-Effect (P-value)
TABLE 4 - ESTIMATED ROLE OF INSTRUCTOR RACE/ETHNICITY FOR STUDENT OUTCOMES, USING A SAMPLE WITH FOUR RACE/ETHNICITY-GROUPS
All Students All Low Registration Priority Students
Instructor Race/Ethnicity Instructor Race/Ethnicity
0.000 0.0060.000 0.000
0.000 0.0150.001 0.113
0.000 0.3390.000 0.619
0.000 0.0310.000 0.248
NOTES: This table displays results from outcome regressions in which we allow for interactions between all observed student and instructor races/ethnicities. We only show results for our preferred specification, which includes student and classroom fixed effects. We report the full set of 9 identified interactions for each regression. Since we include student and instructor fixed effects, all interactions involving white students or instructors are unidentified. Same race/ethnicity interactions are shown in red along the diagonal. P-values for a F-test of the existence of same-race/ethnicity interactions and for the existence of any race/ethnicity-interactions are also listed. *** Significant on 1%-level; ** Significant on 5%-level; * Significant on 10%-level. Standard errors are clustered by instructor.
0.809 0.2880.938 0.435
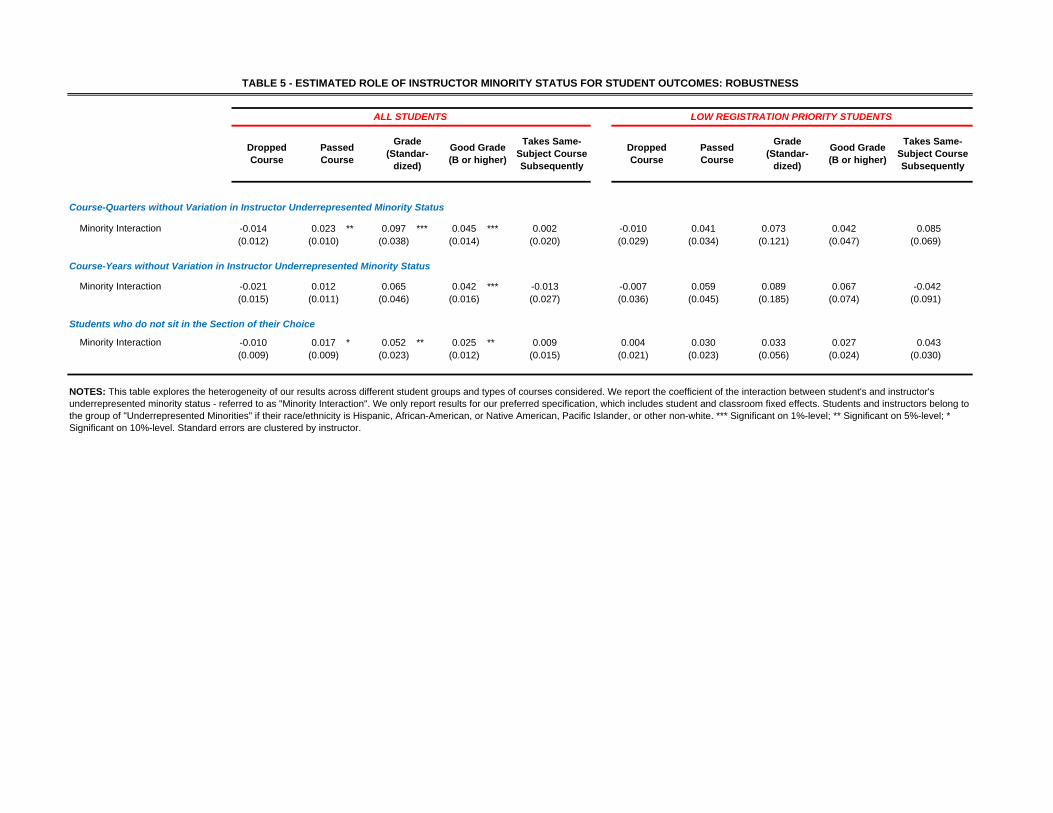
Course-Quarters without Variation in Instructor Underrepresented Minority Status
Minority Interaction -0.014 0.023 ** 0.097 *** 0.045 *** 0.002 -0.010 0.041 0.073 0.042 0.085(0.012) (0.010) (0.038) (0.014) (0.020) (0.029) (0.034) (0.121) (0.047) (0.069)
Course-Years without Variation in Instructor Underrepresented Minority Status
Minority Interaction -0.021 0.012 0.065 0.042 *** -0.013 -0.007 0.059 0.089 0.067 -0.042(0.015) (0.011) (0.046) (0.016) (0.027) (0.036) (0.045) (0.185) (0.074) (0.091)
Students who do not sit in the Section of their Choice
Minority Interaction -0.010 0.017 * 0.052 ** 0.025 ** 0.009 0.004 0.030 0.033 0.027 0.043(0.009) (0.009) (0.023) (0.012) (0.015) (0.021) (0.023) (0.056) (0.024) (0.030)
TABLE 5 - ESTIMATED ROLE OF INSTRUCTOR MINORITY STATUS FOR STUDENT OUTCOMES: ROBUSTNESS
ALL STUDENTS LOW REGISTRATION PRIORITY STUDENTS
Dropped Course
Passed Course
Grade (Standar-
dized)
Good Grade (B or higher)
Takes Same-Subject Course Subsequently
Dropped Course
Passed Course
Grade (Standar-
dized)
Good Grade (B or higher)
NOTES: This table explores the heterogeneity of our results across different student groups and types of courses considered. We report the coefficient of the interaction between student's and instructor's underrepresented minority status - referred to as "Minority Interaction". We only report results for our preferred specification, which includes student and classroom fixed effects. Students and instructors belong to the group of "Underrepresented Minorities" if their race/ethnicity is Hispanic, African-American, or Native American, Pacific Islander, or other non-white. *** Significant on 1%-level; ** Significant on 5%-level; * Significant on 10%-level. Standard errors are clustered by instructor.
Takes Same-Subject Course Subsequently
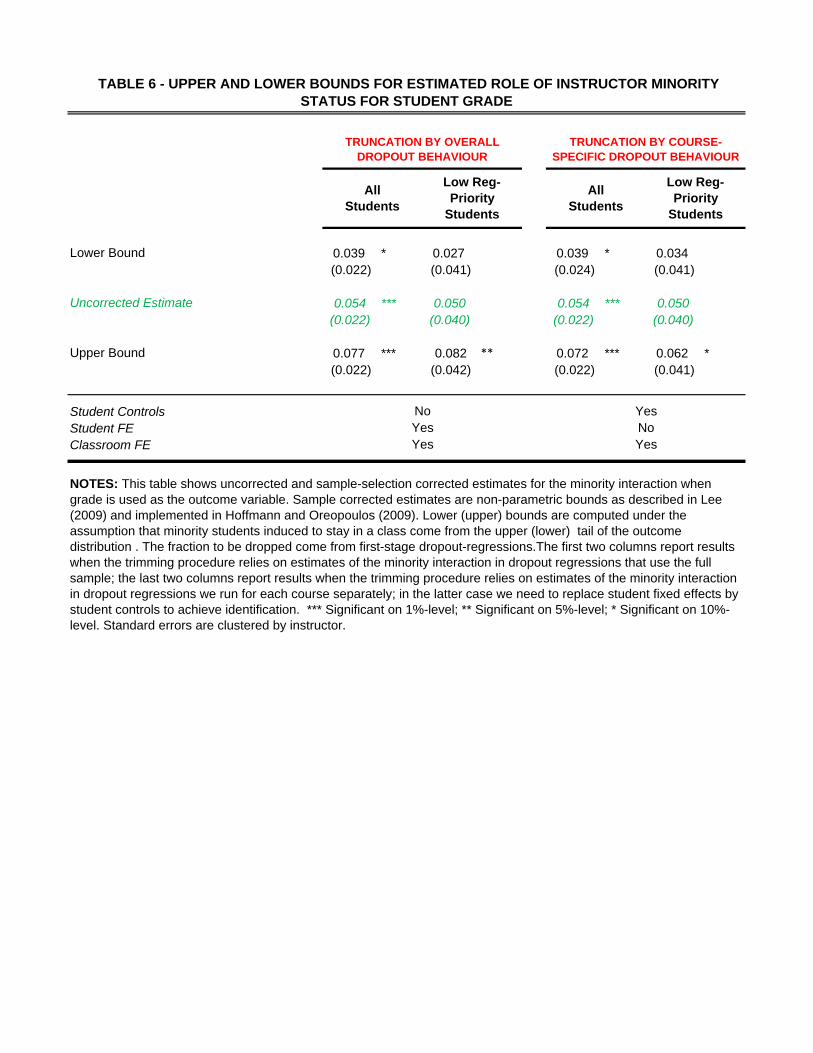
Lower Bound 0.039 * 0.027 0.039 * 0.034(0.022) (0.041) (0.024) (0.041)
Uncorrected Estimate 0.054 *** 0.050 0.054 *** 0.050(0.022) (0.040) (0.022) (0.040)
Upper Bound 0.077 *** 0.082 ** 0.072 *** 0.062 *(0.022) (0.042) (0.022) (0.041)
Student ControlsStudent FEClassroom FE
YesNoYes
NOTES: This table shows uncorrected and sample-selection corrected estimates for the minority interaction when grade is used as the outcome variable. Sample corrected estimates are non-parametric bounds as described in Lee (2009) and implemented in Hoffmann and Oreopoulos (2009). Lower (upper) bounds are computed under the assumption that minority students induced to stay in a class come from the upper (lower) tail of the outcome distribution . The fraction to be dropped come from first-stage dropout-regressions.The first two columns report results when the trimming procedure relies on estimates of the minority interaction in dropout regressions that use the full sample; the last two columns report results when the trimming procedure relies on estimates of the minority interaction in dropout regressions we run for each course separately; in the latter case we need to replace student fixed effects by student controls to achieve identification. *** Significant on 1%-level; ** Significant on 5%-level; * Significant on 10%-level. Standard errors are clustered by instructor.
NoYesYes
TABLE 6 - UPPER AND LOWER BOUNDS FOR ESTIMATED ROLE OF INSTRUCTOR MINORITY STATUS FOR STUDENT GRADE
TRUNCATION BY OVERALL DROPOUT BEHAVIOUR
TRUNCATION BY COURSE-SPECIFIC DROPOUT BEHAVIOUR
All Students
Low Reg-Priority
Students
All Students
Low Reg-Priority
Students
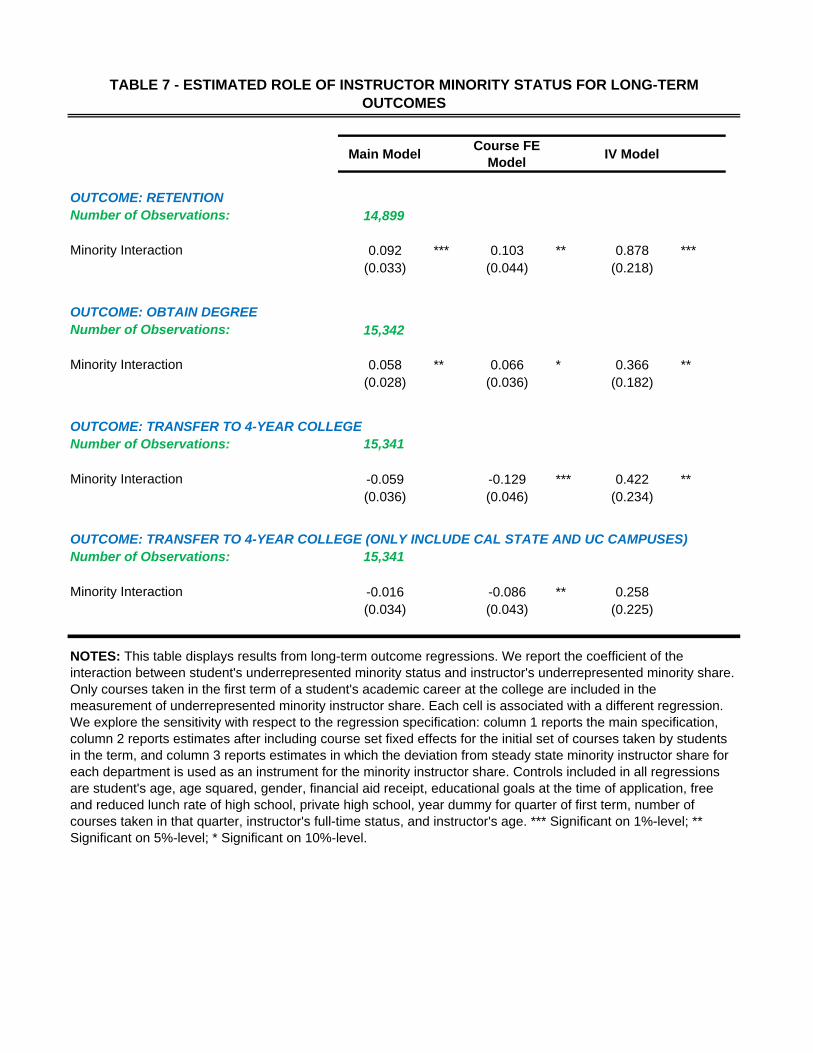
Main ModelCourse FE
ModelIV Model
OUTCOME: RETENTIONNumber of Observations: 14,899
Minority Interaction 0.092 *** 0.103 ** 0.878 ***(0.033) (0.044) (0.218)
OUTCOME: OBTAIN DEGREENumber of Observations: 15,342
Minority Interaction 0.058 ** 0.066 * 0.366 **(0.028) (0.036) (0.182)
OUTCOME: TRANSFER TO 4-YEAR COLLEGENumber of Observations: 15,341
Minority Interaction -0.059 -0.129 *** 0.422 **(0.036) (0.046) (0.234)
OUTCOME: TRANSFER TO 4-YEAR COLLEGE (ONLY INCLUDE CAL STATE AND UC CAMPUSES)Number of Observations: 15,341
Minority Interaction -0.016 -0.086 ** 0.258(0.034) (0.043) (0.225)
TABLE 7 - ESTIMATED ROLE OF INSTRUCTOR MINORITY STATUS FOR LONG-TERM OUTCOMES
NOTES: This table displays results from long-term outcome regressions. We report the coefficient of the interaction between student's underrepresented minority status and instructor's underrepresented minority share. Only courses taken in the first term of a student's academic career at the college are included in the measurement of underrepresented minority instructor share. Each cell is associated with a different regression. We explore the sensitivity with respect to the regression specification: column 1 reports the main specification, column 2 reports estimates after including course set fixed effects for the initial set of courses taken by students in the term, and column 3 reports estimates in which the deviation from steady state minority instructor share for each department is used as an instrument for the minority instructor share. Controls included in all regressions are student's age, age squared, gender, financial aid receipt, educational goals at the time of application, free and reduced lunch rate of high school, private high school, year dummy for quarter of first term, number of courses taken in that quarter, instructor's full-time status, and instructor's age. *** Significant on 1%-level; ** Significant on 5%-level; * Significant on 10%-level.
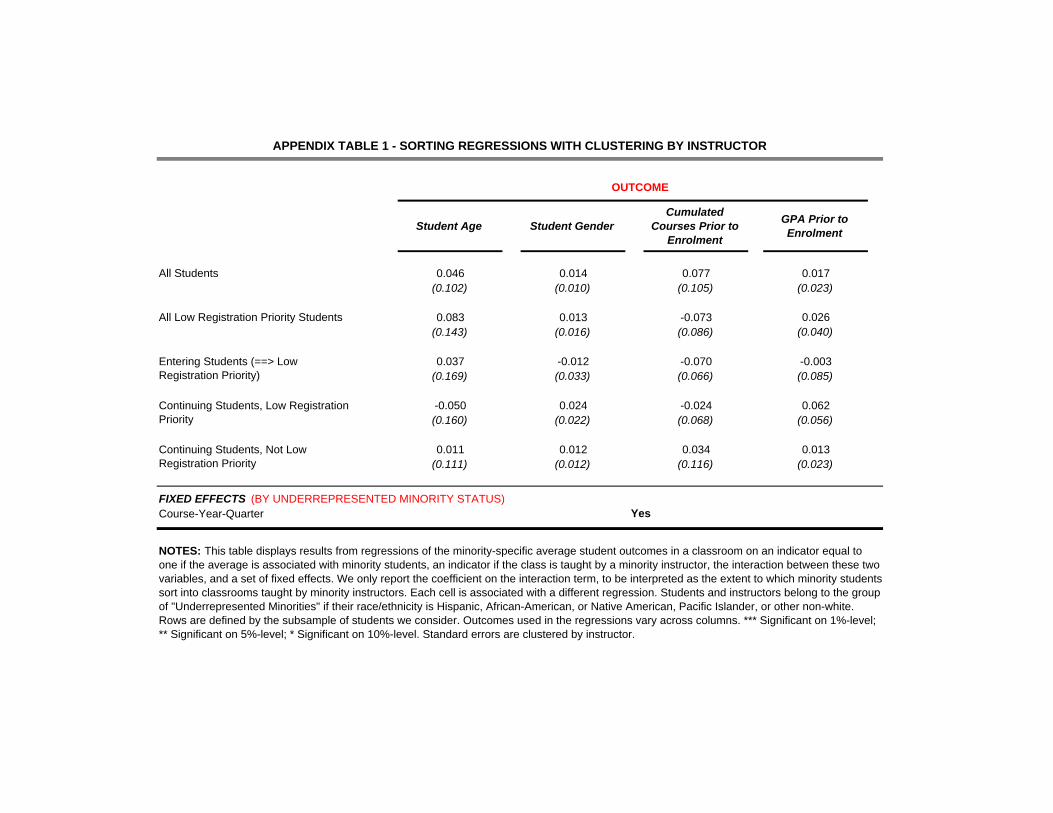
Student Age Student GenderCumulated
Courses Prior to Enrolment
GPA Prior to Enrolment
All Students 0.046 0.014 0.077 0.017(0.102) (0.010) (0.105) (0.023)
All Low Registration Priority Students 0.083 0.013 -0.073 0.026(0.143) (0.016) (0.086) (0.040)
0.037 -0.012 -0.070 -0.003(0.169) (0.033) (0.066) (0.085)
-0.050 0.024 -0.024 0.062(0.160) (0.022) (0.068) (0.056)
0.011 0.012 0.034 0.013(0.111) (0.012) (0.116) (0.023)
FIXED EFFECTS (BY UNDERREPRESENTED MINORITY STATUS)Course-Year-Quarter
NOTES: This table displays results from regressions of the minority-specific average student outcomes in a classroom on an indicator equal to one if the average is associated with minority students, an indicator if the class is taught by a minority instructor, the interaction between these two variables, and a set of fixed effects. We only report the coefficient on the interaction term, to be interpreted as the extent to which minority students sort into classrooms taught by minority instructors. Each cell is associated with a different regression. Students and instructors belong to the group of "Underrepresented Minorities" if their race/ethnicity is Hispanic, African-American, or Native American, Pacific Islander, or other non-white. Rows are defined by the subsample of students we consider. Outcomes used in the regressions vary across columns. *** Significant on 1%-level; ** Significant on 5%-level; * Significant on 10%-level. Standard errors are clustered by instructor.
APPENDIX TABLE 1 - SORTING REGRESSIONS WITH CLUSTERING BY INSTRUCTOR
OUTCOME
Entering Students (==> Low Registration Priority)
Continuing Students, Low Registration Priority
Continuing Students, Not Low Registration Priority
Yes
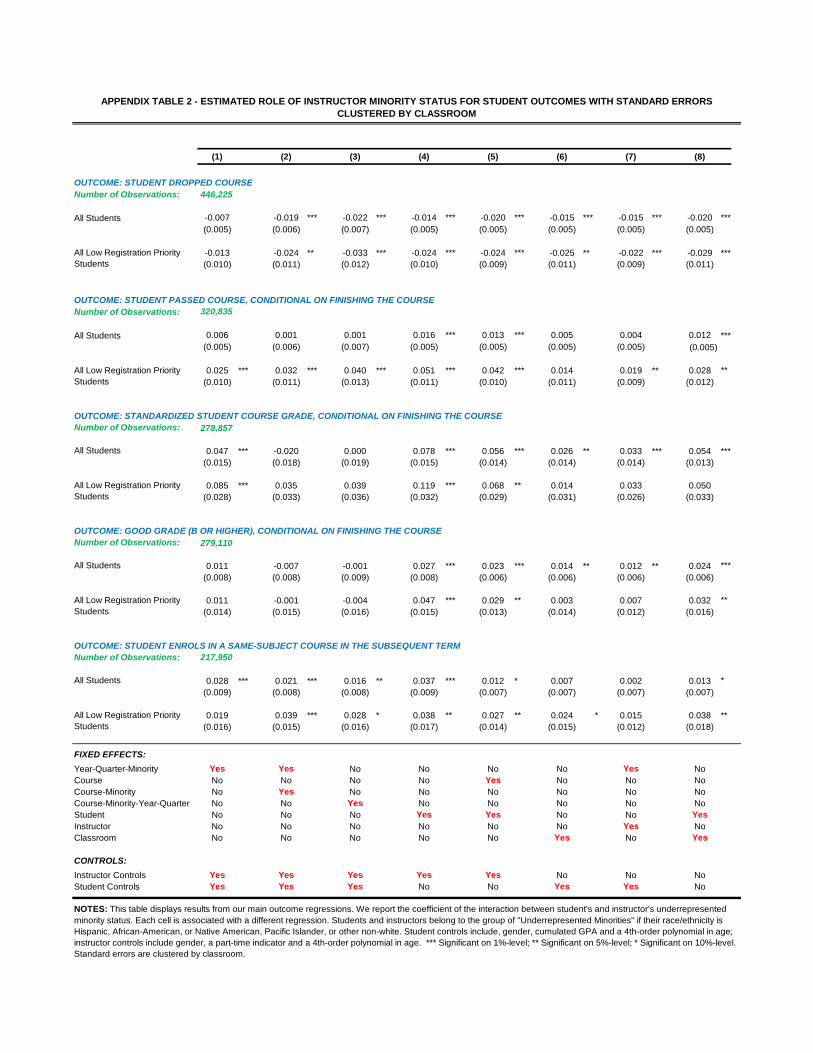
(1) (2) (3) (4) (5) (6) (7) (8)
OUTCOME: STUDENT DROPPED COURSENumber of Observations: 446,225
All Students -0.007 -0.019 *** -0.022 *** -0.014 *** -0.020 *** -0.015 *** -0.015 *** -0.020 ***(0.005) (0.006) (0.007) (0.005) (0.005) (0.005) (0.005) (0.005)
-0.013 -0.024 ** -0.033 *** -0.024 *** -0.024 *** -0.025 ** -0.022 *** -0.029 ***(0.010) (0.011) (0.012) (0.010) (0.009) (0.011) (0.009) (0.011)
OUTCOME: STUDENT PASSED COURSE, CONDITIONAL ON FINISHING THE COURSENumber of Observations: 320,835
All Students 0.006 0.001 0.001 0.016 *** 0.013 *** 0.005 0.004 0.012 ***(0.005) (0.006) (0.007) (0.005) (0.005) (0.005) (0.005) (0.005)
0.025 *** 0.032 *** 0.040 *** 0.051 *** 0.042 *** 0.014 0.019 ** 0.028 **(0.010) (0.011) (0.013) (0.011) (0.010) (0.011) (0.009) (0.012)
OUTCOME: STANDARDIZED STUDENT COURSE GRADE, CONDITIONAL ON FINISHING THE COURSENumber of Observations: 278,857
All Students 0.047 *** -0.020 0.000 0.078 *** 0.056 *** 0.026 ** 0.033 *** 0.054 ***(0.015) (0.018) (0.019) (0.015) (0.014) (0.014) (0.014) (0.013)
0.085 *** 0.035 0.039 0.119 *** 0.068 ** 0.014 0.033 0.050(0.028) (0.033) (0.036) (0.032) (0.029) (0.031) (0.026) (0.033)
OUTCOME: GOOD GRADE (B OR HIGHER), CONDITIONAL ON FINISHING THE COURSENumber of Observations: 279,110
All Students 0.011 -0.007 -0.001 0.027 *** 0.023 *** 0.014 ** 0.012 ** 0.024 ***(0.008) (0.008) (0.009) (0.008) (0.006) (0.006) (0.006) (0.006)
0.011 -0.001 -0.004 0.047 *** 0.029 ** 0.003 0.007 0.032 **(0.014) (0.015) (0.016) (0.015) (0.013) (0.014) (0.012) (0.016)
OUTCOME: STUDENT ENROLS IN A SAME-SUBJECT COURSE IN THE SUBSEQUENT TERMNumber of Observations: 217,950
All Students 0.028 *** 0.021 *** 0.016 ** 0.037 *** 0.012 * 0.007 0.002 0.013 *(0.009) (0.008) (0.008) (0.009) (0.007) (0.007) (0.007) (0.007)
0.019 0.039 *** 0.028 * 0.038 ** 0.027 ** 0.024 * 0.015 0.038 **(0.016) (0.015) (0.016) (0.017) (0.014) (0.015) (0.012) (0.018)
FIXED EFFECTS:
Year-Quarter-Minority Yes Yes No No No No Yes NoCourse No No No No Yes No No NoCourse-Minority No Yes No No No No No NoCourse-Minority-Year-Quarter No No Yes No No No No NoStudent No No No Yes Yes No No YesInstructor No No No No No No Yes NoClassroom No No No No No Yes No Yes
CONTROLS:
Instructor Controls Yes Yes Yes Yes Yes No No NoStudent Controls Yes Yes Yes No No Yes Yes No
NOTES: This table displays results from our main outcome regressions. We report the coefficient of the interaction between student's and instructor's underrepresented minority status. Each cell is associated with a different regression. Students and instructors belong to the group of "Underrepresented Minorities" if their race/ethnicity is Hispanic, African-American, or Native American, Pacific Islander, or other non-white. Student controls include, gender, cumulated GPA and a 4th-order polynomial in age; instructor controls include gender, a part-time indicator and a 4th-order polynomial in age. *** Significant on 1%-level; ** Significant on 5%-level; * Significant on 10%-level. Standard errors are clustered by classroom.
All Low Registration Priority Students
APPENDIX TABLE 2 - ESTIMATED ROLE OF INSTRUCTOR MINORITY STATUS FOR STUDENT OUTCOMES WITH STANDARD ERRORS CLUSTERED BY CLASSROOM
All Low Registration Priority Students
All Low Registration Priority Students
All Low Registration Priority Students
All Low Registration Priority Students
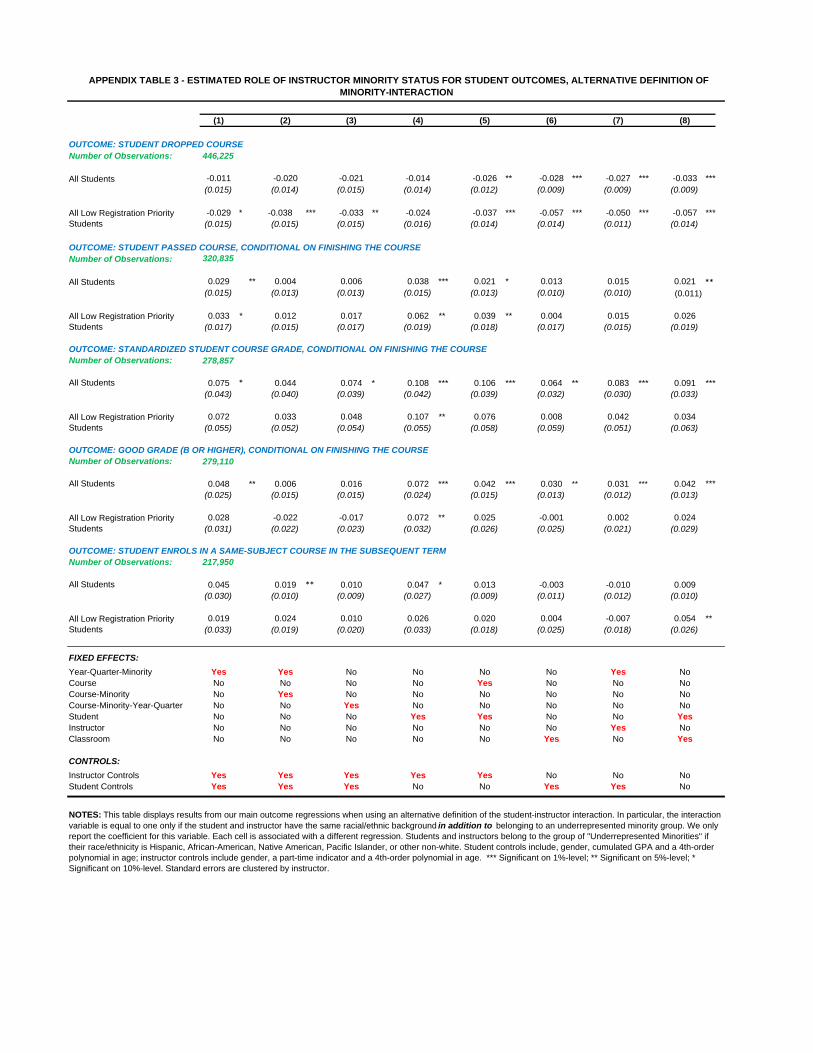
(1) (2) (3) (4) (5) (6) (7) (8)
OUTCOME: STUDENT DROPPED COURSENumber of Observations: 446,225
All Students -0.011 -0.020 -0.021 -0.014 -0.026 ** -0.028 *** -0.027 *** -0.033 ***(0.015) (0.014) (0.015) (0.014) (0.012) (0.009) (0.009) (0.009)
-0.029 * -0.038 *** -0.033 ** -0.024 -0.037 *** -0.057 *** -0.050 *** -0.057 ***(0.015) (0.015) (0.015) (0.016) (0.014) (0.014) (0.011) (0.014)
OUTCOME: STUDENT PASSED COURSE, CONDITIONAL ON FINISHING THE COURSENumber of Observations: 320,835
All Students 0.029 ** 0.004 0.006 0.038 *** 0.021 * 0.013 0.015 0.021 **
(0.015) (0.013) (0.013) (0.015) (0.013) (0.010) (0.010) (0.011)
0.033 * 0.012 0.017 0.062 ** 0.039 ** 0.004 0.015 0.026(0.017) (0.015) (0.017) (0.019) (0.018) (0.017) (0.015) (0.019)
OUTCOME: STANDARDIZED STUDENT COURSE GRADE, CONDITIONAL ON FINISHING THE COURSENumber of Observations: 278,857
All Students 0.075 * 0.044 0.074 * 0.108 *** 0.106 *** 0.064 ** 0.083 *** 0.091 ***(0.043) (0.040) (0.039) (0.042) (0.039) (0.032) (0.030) (0.033)
0.072 0.033 0.048 0.107 ** 0.076 0.008 0.042 0.034(0.055) (0.052) (0.054) (0.055) (0.058) (0.059) (0.051) (0.063)
OUTCOME: GOOD GRADE (B OR HIGHER), CONDITIONAL ON FINISHING THE COURSENumber of Observations: 279,110
All Students 0.048 ** 0.006 0.016 0.072 *** 0.042 *** 0.030 ** 0.031 *** 0.042 ***(0.025) (0.015) (0.015) (0.024) (0.015) (0.013) (0.012) (0.013)
0.028 -0.022 -0.017 0.072 ** 0.025 -0.001 0.002 0.024(0.031) (0.022) (0.023) (0.032) (0.026) (0.025) (0.021) (0.029)
OUTCOME: STUDENT ENROLS IN A SAME-SUBJECT COURSE IN THE SUBSEQUENT TERMNumber of Observations: 217,950
All Students 0.045 0.019 ** 0.010 0.047 * 0.013 -0.003 -0.010 0.009(0.030) (0.010) (0.009) (0.027) (0.009) (0.011) (0.012) (0.010)
0.019 0.024 0.010 0.026 0.020 0.004 -0.007 0.054 **(0.033) (0.019) (0.020) (0.033) (0.018) (0.025) (0.018) (0.026)
FIXED EFFECTS:
Year-Quarter-Minority Yes Yes No No No No Yes NoCourse No No No No Yes No No NoCourse-Minority No Yes No No No No No NoCourse-Minority-Year-Quarter No No Yes No No No No NoStudent No No No Yes Yes No No YesInstructor No No No No No No Yes NoClassroom No No No No No Yes No Yes
CONTROLS:
Instructor Controls Yes Yes Yes Yes Yes No No NoStudent Controls Yes Yes Yes No No Yes Yes No
APPENDIX TABLE 3 - ESTIMATED ROLE OF INSTRUCTOR MINORITY STATUS FOR STUDENT OUTCOMES, ALTERNATIVE DEFINITION OF MINORITY-INTERACTION
All Low Registration Priority Students
All Low Registration Priority Students
NOTES: This table displays results from our main outcome regressions when using an alternative definition of the student-instructor interaction. In particular, the interaction variable is equal to one only if the student and instructor have the same racial/ethnic background in addition to belonging to an underrepresented minority group. We only report the coefficient for this variable. Each cell is associated with a different regression. Students and instructors belong to the group of "Underrepresented Minorities" if their race/ethnicity is Hispanic, African-American, Native American, Pacific Islander, or other non-white. Student controls include, gender, cumulated GPA and a 4th-order polynomial in age; instructor controls include gender, a part-time indicator and a 4th-order polynomial in age. *** Significant on 1%-level; ** Significant on 5%-level; * Significant on 10%-level. Standard errors are clustered by instructor.
All Low Registration Priority Students
All Low Registration Priority Students
All Low Registration Priority Students
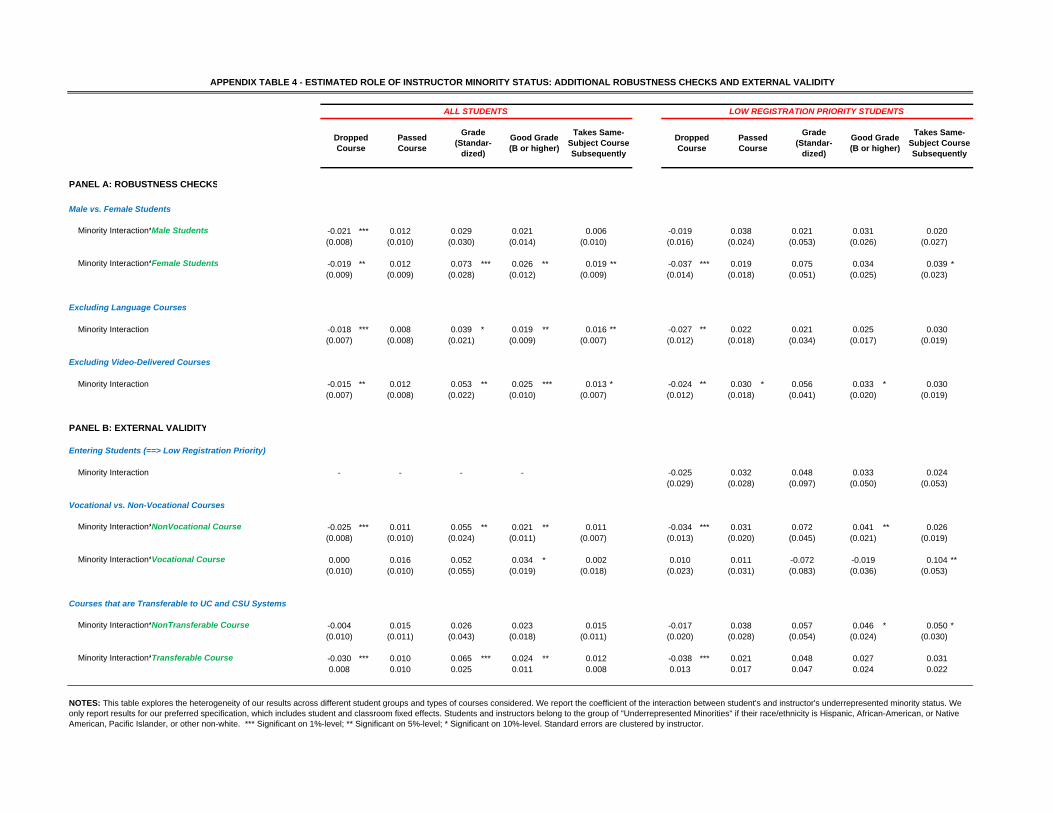
PANEL A: ROBUSTNESS CHECKS
Male vs. Female Students
Minority Interaction*Male Students -0.021 *** 0.012 0.029 0.021 0.006 -0.019 0.038 0.021 0.031 0.020(0.008) (0.010) (0.030) (0.014) (0.010) (0.016) (0.024) (0.053) (0.026) (0.027)
Minority Interaction*Female Students -0.019 ** 0.012 0.073 *** 0.026 ** 0.019 ** -0.037 *** 0.019 0.075 0.034 0.039 *(0.009) (0.009) (0.028) (0.012) (0.009) (0.014) (0.018) (0.051) (0.025) (0.023)
Excluding Language Courses
Minority Interaction -0.018 *** 0.008 0.039 * 0.019 ** 0.016 ** -0.027 ** 0.022 0.021 0.025 0.030(0.007) (0.008) (0.021) (0.009) (0.007) (0.012) (0.018) (0.034) (0.017) (0.019)
Excluding Video-Delivered Courses
Minority Interaction -0.015 ** 0.012 0.053 ** 0.025 *** 0.013 * -0.024 ** 0.030 * 0.056 0.033 * 0.030(0.007) (0.008) (0.022) (0.010) (0.007) (0.012) (0.018) (0.041) (0.020) (0.019)
PANEL B: EXTERNAL VALIDITY
Entering Students (==> Low Registration Priority)
Minority Interaction - - - - -0.025 0.032 0.048 0.033 0.024(0.029) (0.028) (0.097) (0.050) (0.053)
Vocational vs. Non-Vocational Courses
Minority Interaction*NonVocational Course -0.025 *** 0.011 0.055 ** 0.021 ** 0.011 -0.034 *** 0.031 0.072 0.041 ** 0.026(0.008) (0.010) (0.024) (0.011) (0.007) (0.013) (0.020) (0.045) (0.021) (0.019)
Minority Interaction*Vocational Course 0.000 0.016 0.052 0.034 * 0.002 0.010 0.011 -0.072 -0.019 0.104 **(0.010) (0.010) (0.055) (0.019) (0.018) (0.023) (0.031) (0.083) (0.036) (0.053)
Courses that are Transferable to UC and CSU Systems
Minority Interaction*NonTransferable Course -0.004 0.015 0.026 0.023 0.015 -0.017 0.038 0.057 0.046 * 0.050 *(0.010) (0.011) (0.043) (0.018) (0.011) (0.020) (0.028) (0.054) (0.024) (0.030)
Minority Interaction*Transferable Course -0.030 *** 0.010 0.065 *** 0.024 ** 0.012 -0.038 *** 0.021 0.048 0.027 0.0310.008 0.010 0.025 0.011 0.008 0.013 0.017 0.047 0.024 0.022
NOTES: This table explores the heterogeneity of our results across different student groups and types of courses considered. We report the coefficient of the interaction between student's and instructor's underrepresented minority status. We only report results for our preferred specification, which includes student and classroom fixed effects. Students and instructors belong to the group of "Underrepresented Minorities" if their race/ethnicity is Hispanic, African-American, or Native American, Pacific Islander, or other non-white. *** Significant on 1%-level; ** Significant on 5%-level; * Significant on 10%-level. Standard errors are clustered by instructor.
Grade (Standar-
dized)
Good Grade (B or higher)
Takes Same-Subject Course Subsequently
APPENDIX TABLE 4 - ESTIMATED ROLE OF INSTRUCTOR MINORITY STATUS: ADDITIONAL ROBUSTNESS CHECKS AND EXTERNAL VALIDITY
ALL STUDENTS LOW REGISTRATION PRIORITY STUDENTS
Dropped Course
Passed Course
Grade (Standar-
dized)
Good Grade (B or higher)
Takes Same-Subject Course Subsequently
Dropped Course
Passed Course
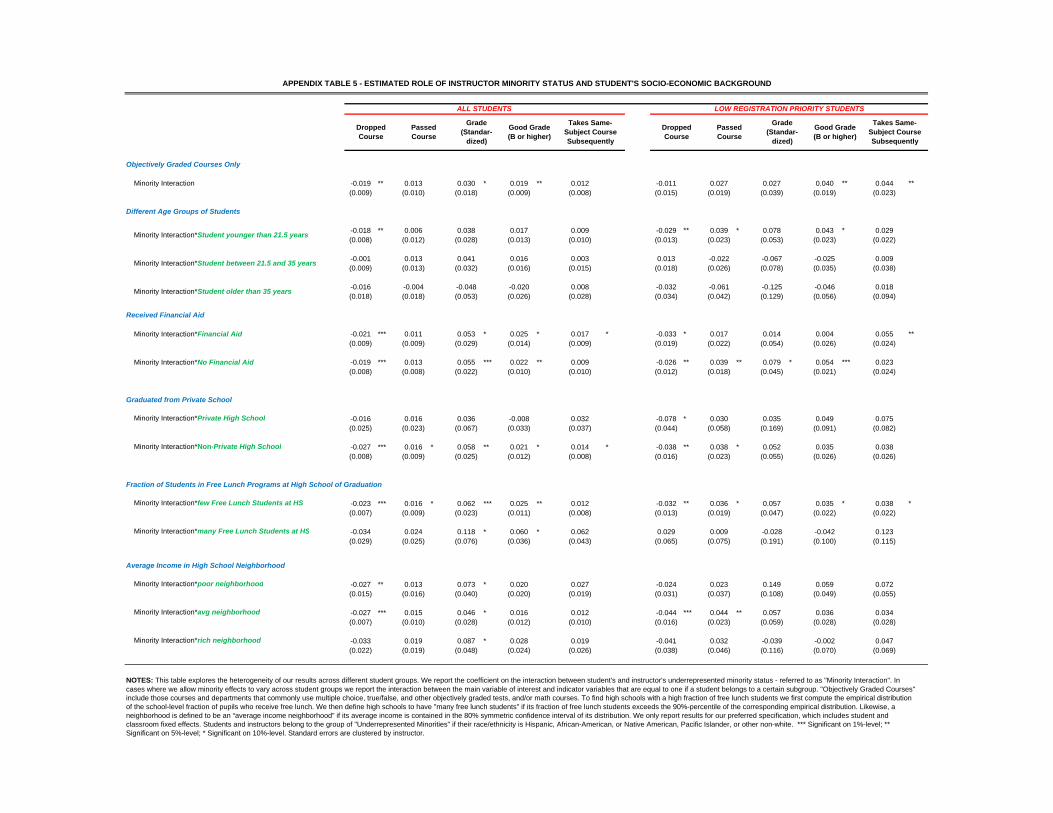
Objectively Graded Courses Only
Minority Interaction -0.019 ** 0.013 0.030 * 0.019 ** 0.012 -0.011 0.027 0.027 0.040 ** 0.044 **(0.009) (0.010) (0.018) (0.009) (0.008) (0.015) (0.019) (0.039) (0.019) (0.023)
Different Age Groups of Students
-0.018 ** 0.006 0.038 0.017 0.009 -0.029 ** 0.039 * 0.078 0.043 * 0.029(0.008) (0.012) (0.028) (0.013) (0.010) (0.013) (0.023) (0.053) (0.023) (0.022)
-0.001 0.013 0.041 0.016 0.003 0.013 -0.022 -0.067 -0.025 0.009(0.009) (0.013) (0.032) (0.016) (0.015) (0.018) (0.026) (0.078) (0.035) (0.038)
-0.016 -0.004 -0.048 -0.020 0.008 -0.032 -0.061 -0.125 -0.046 0.018(0.018) (0.018) (0.053) (0.026) (0.028) (0.034) (0.042) (0.129) (0.056) (0.094)
Received Financial Aid
Minority Interaction*Financial Aid -0.021 *** 0.011 0.053 * 0.025 * 0.017 * -0.033 * 0.017 0.014 0.004 0.055 **(0.009) (0.009) (0.029) (0.014) (0.009) (0.019) (0.022) (0.054) (0.026) (0.024)
Minority Interaction*No Financial Aid -0.019 *** 0.013 0.055 *** 0.022 ** 0.009 -0.026 ** 0.039 ** 0.079 * 0.054 *** 0.023(0.008) (0.008) (0.022) (0.010) (0.010) (0.012) (0.018) (0.045) (0.021) (0.024)
Graduated from Private School
Minority Interaction*Private High School -0.016 0.016 0.036 -0.008 0.032 -0.078 * 0.030 0.035 0.049 0.075(0.025) (0.023) (0.067) (0.033) (0.037) (0.044) (0.058) (0.169) (0.091) (0.082)
Minority Interaction*Non-Private High School -0.027 *** 0.016 * 0.058 ** 0.021 * 0.014 * -0.038 ** 0.038 * 0.052 0.035 0.038(0.008) (0.009) (0.025) (0.012) (0.008) (0.016) (0.023) (0.055) (0.026) (0.026)
Fraction of Students in Free Lunch Programs at High School of Graduation
Minority Interaction*few Free Lunch Students at HS -0.023 *** 0.016 * 0.062 *** 0.025 ** 0.012 -0.032 ** 0.036 * 0.057 0.035 * 0.038 *(0.007) (0.009) (0.023) (0.011) (0.008) (0.013) (0.019) (0.047) (0.022) (0.022)
Minority Interaction*many Free Lunch Students at HS -0.034 0.024 0.118 * 0.060 * 0.062 0.029 0.009 -0.028 -0.042 0.123(0.029) (0.025) (0.076) (0.036) (0.043) (0.065) (0.075) (0.191) (0.100) (0.115)
Average Income in High School Neighborhood
Minority Interaction*poor neighborhood -0.027 ** 0.013 0.073 * 0.020 0.027 -0.024 0.023 0.149 0.059 0.072(0.015) (0.016) (0.040) (0.020) (0.019) (0.031) (0.037) (0.108) (0.049) (0.055)
Minority Interaction*avg neighborhood -0.027 *** 0.015 0.046 * 0.016 0.012 -0.044 *** 0.044 ** 0.057 0.036 0.034(0.007) (0.010) (0.028) (0.012) (0.010) (0.016) (0.023) (0.059) (0.028) (0.028)
Minority Interaction*rich neighborhood -0.033 0.019 0.087 * 0.028 0.019 -0.041 0.032 -0.039 -0.002 0.047(0.022) (0.019) (0.048) (0.024) (0.026) (0.038) (0.046) (0.116) (0.070) (0.069)
APPENDIX TABLE 5 - ESTIMATED ROLE OF INSTRUCTOR MINORITY STATUS AND STUDENT'S SOCIO-ECONOMIC BACKGROUND
Grade (Standar-
dized)
Good Grade (B or higher)
Takes Same-Subject Course Subsequently
LOW REGISTRATION PRIORITY STUDENTS
Dropped Course
Passed Course
Grade (Standar-
dized)
Good Grade (B or higher)
Takes Same-Subject Course Subsequently
Dropped Course
Passed Course
Minority Interaction*Student between 21.5 and 35 years
Minority Interaction*Student older than 35 years
ALL STUDENTS
NOTES: This table explores the heterogeneity of our results across different student groups. We report the coefficient on the interaction between student's and instructor's underrepresented minority status - referred to as "Minority Interaction". In cases where we allow minority effects to vary across student groups we report the interaction between the main variable of interest and indicator variables that are equal to one if a student belongs to a certain subgroup. "Objectively Graded Courses" include those courses and departments that commonly use multiple choice, true/false, and other objectively graded tests, and/or math courses. To find high schools with a high fraction of free lunch students we first compute the empirical distribution of the school-level fraction of pupils who receive free lunch. We then define high schools to have "many free lunch students" if its fraction of free lunch students exceeds the 90%-percentile of the corresponding empirical distribution. Likewise, a neighborhood is defined to be an “average income neighborhood” if its average income is contained in the 80% symmetric confidence interval of its distribution. We only report results for our preferred specification, which includes student and classroom fixed effects. Students and instructors belong to the group of "Underrepresented Minorities" if their race/ethnicity is Hispanic, African-American, or Native American, Pacific Islander, or other non-white. *** Significant on 1%-level; ** Significant on 5%-level; * Significant on 10%-level. Standard errors are clustered by instructor.
Minority Interaction*Student younger than 21.5 years
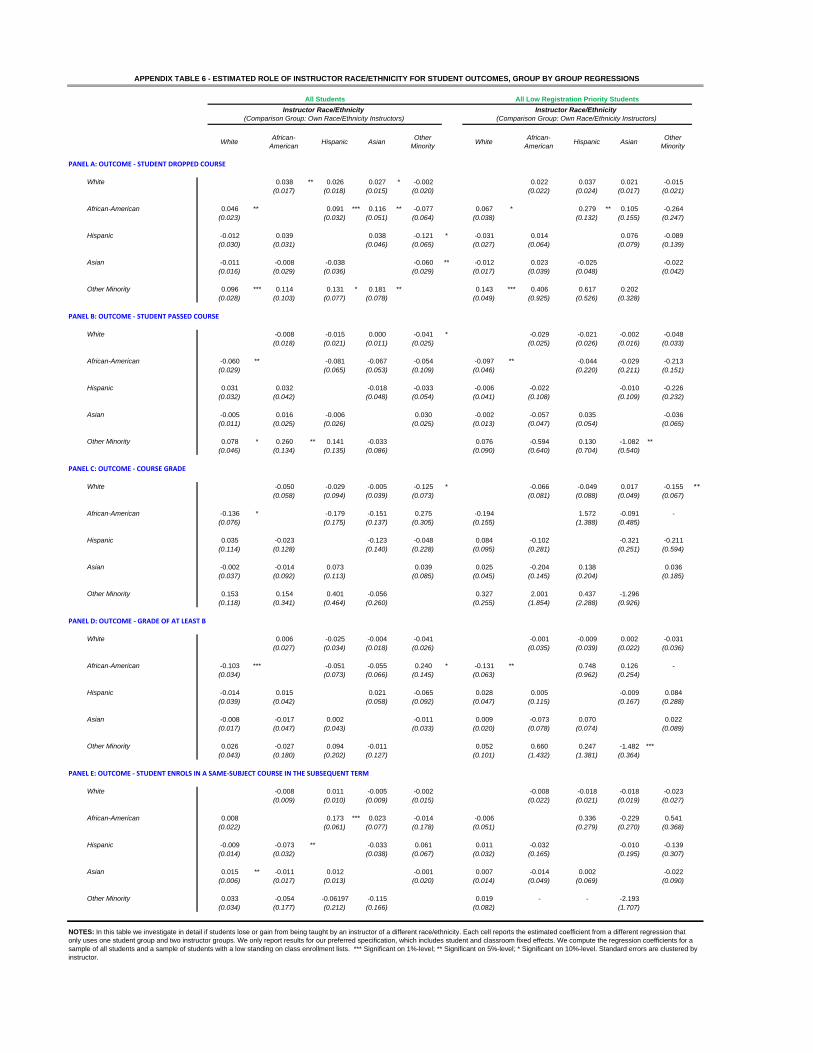
WhiteAfrican-
AmericanHispanic Asian
Other Minority
WhiteAfrican-
AmericanHispanic Asian
Other Minority
PANEL A: OUTCOME ‐ STUDENT DROPPED COURSE
White 0.038 ** 0.026 0.027 * -0.002 0.022 0.037 0.021 -0.015(0.017) (0.018) (0.015) (0.020) (0.022) (0.024) (0.017) (0.021)
African-American 0.046 ** 0.091 *** 0.116 ** -0.077 0.067 * 0.279 ** 0.105 -0.264(0.023) (0.032) (0.051) (0.064) (0.038) (0.132) (0.155) (0.247)
Hispanic -0.012 0.039 0.038 -0.121 * -0.031 0.014 0.076 -0.089(0.030) (0.031) (0.046) (0.065) (0.027) (0.064) (0.079) (0.139)
Asian -0.011 -0.008 -0.038 -0.060 ** -0.012 0.023 -0.025 -0.022(0.016) (0.029) (0.036) (0.029) (0.017) (0.039) (0.048) (0.042)
Other Minority 0.096 *** 0.114 0.131 * 0.181 ** 0.143 *** 0.406 0.617 0.202(0.028) (0.103) (0.077) (0.078) (0.049) (0.925) (0.526) (0.328)
PANEL B: OUTCOME ‐ STUDENT PASSED COURSE
White -0.008 -0.015 0.000 -0.041 * -0.029 -0.021 -0.002 -0.048(0.018) (0.021) (0.011) (0.025) (0.025) (0.026) (0.016) (0.033)
African-American -0.060 ** -0.081 -0.067 -0.054 -0.097 ** -0.044 -0.029 -0.213(0.029) (0.065) (0.053) (0.109) (0.046) (0.220) (0.211) (0.151)
Hispanic 0.031 0.032 -0.018 -0.033 -0.006 -0.022 -0.010 -0.226(0.032) (0.042) (0.048) (0.054) (0.041) (0.108) (0.109) (0.232)
Asian -0.005 0.016 -0.006 0.030 -0.002 -0.057 0.035 -0.036(0.011) (0.025) (0.026) (0.025) (0.013) (0.047) (0.054) (0.065)
Other Minority 0.078 * 0.260 ** 0.141 -0.033 0.076 -0.594 0.130 -1.082 **(0.046) (0.134) (0.135) (0.086) (0.090) (0.640) (0.704) (0.540)
PANEL C: OUTCOME ‐ COURSE GRADE
White -0.050 -0.029 -0.005 -0.125 * -0.066 -0.049 0.017 -0.155 **
(0.058) (0.094) (0.039) (0.073) (0.081) (0.088) (0.049) (0.067)
African-American -0.136 * -0.179 -0.151 0.275 -0.194 1.572 -0.091 -(0.076) (0.175) (0.137) (0.305) (0.155) (1.388) (0.485)
Hispanic 0.035 -0.023 -0.123 -0.048 0.084 -0.102 -0.321 -0.211(0.114) (0.128) (0.140) (0.228) (0.095) (0.281) (0.251) (0.594)
Asian -0.002 -0.014 0.073 0.039 0.025 -0.204 0.138 0.036(0.037) (0.092) (0.113) (0.085) (0.045) (0.145) (0.204) (0.185)
Other Minority 0.153 0.154 0.401 -0.056 0.327 2.001 0.437 -1.296(0.118) (0.341) (0.464) (0.260) (0.255) (1.854) (2.288) (0.926)
PANEL D: OUTCOME ‐ GRADE OF AT LEAST B
White 0.006 -0.025 -0.004 -0.041 -0.001 -0.009 0.002 -0.031(0.027) (0.034) (0.018) (0.026) (0.035) (0.039) (0.022) (0.036)
African-American -0.103 *** -0.051 -0.055 0.240 * -0.131 ** 0.748 0.126 -(0.034) (0.073) (0.066) (0.145) (0.063) (0.962) (0.254)
Hispanic -0.014 0.015 0.021 -0.065 0.028 0.005 -0.009 0.084(0.039) (0.042) (0.058) (0.092) (0.047) (0.115) (0.167) (0.288)
Asian -0.008 -0.017 0.002 -0.011 0.009 -0.073 0.070 0.022(0.017) (0.047) (0.043) (0.033) (0.020) (0.078) (0.074) (0.089)
Other Minority 0.026 -0.027 0.094 -0.011 0.052 0.660 0.247 -1.482 ***(0.043) (0.180) (0.202) (0.127) (0.101) (1.432) (1.381) (0.364)
PANEL E: OUTCOME ‐ STUDENT ENROLS IN A SAME‐SUBJECT COURSE IN THE SUBSEQUENT TERM
White -0.008 0.011 -0.005 -0.002 -0.008 -0.018 -0.018 -0.023(0.009) (0.010) (0.009) (0.015) (0.022) (0.021) (0.019) (0.027)
African-American 0.008 0.173 *** 0.023 -0.014 -0.006 0.336 -0.229 0.541(0.022) (0.061) (0.077) (0.178) (0.051) (0.279) (0.270) (0.368)
Hispanic -0.009 -0.073 ** -0.033 0.061 0.011 -0.032 -0.010 -0.139(0.014) (0.032) (0.038) (0.067) (0.032) (0.165) (0.195) (0.307)
Asian 0.015 ** -0.011 0.012 -0.001 0.007 -0.014 0.002 -0.022(0.006) (0.017) (0.013) (0.020) (0.014) (0.049) (0.069) (0.090)
Other Minority 0.033 -0.054 -0.06197 -0.115 0.019 - - -2.193(0.034) (0.177) (0.212) (0.166) (0.082) (1.707)
NOTES: In this table we investigate in detail if students lose or gain from being taught by an instructor of a different race/ethnicity. Each cell reports the estimated coefficient from a different regression that only uses one student group and two instructor groups. We only report results for our preferred specification, which includes student and classroom fixed effects. We compute the regression coefficients for a sample of all students and a sample of students with a low standing on class enrollment lists. *** Significant on 1%-level; ** Significant on 5%-level; * Significant on 10%-level. Standard errors are clustered by instructor.
APPENDIX TABLE 6 - ESTIMATED ROLE OF INSTRUCTOR RACE/ETHNICITY FOR STUDENT OUTCOMES, GROUP BY GROUP REGRESSIONS
All Students All Low Registration Priority Students
Instructor Race/Ethnicity (Comparison Group: Own Race/Ethnicity Instructors)
Instructor Race/Ethnicity (Comparison Group: Own Race/Ethnicity Instructors)
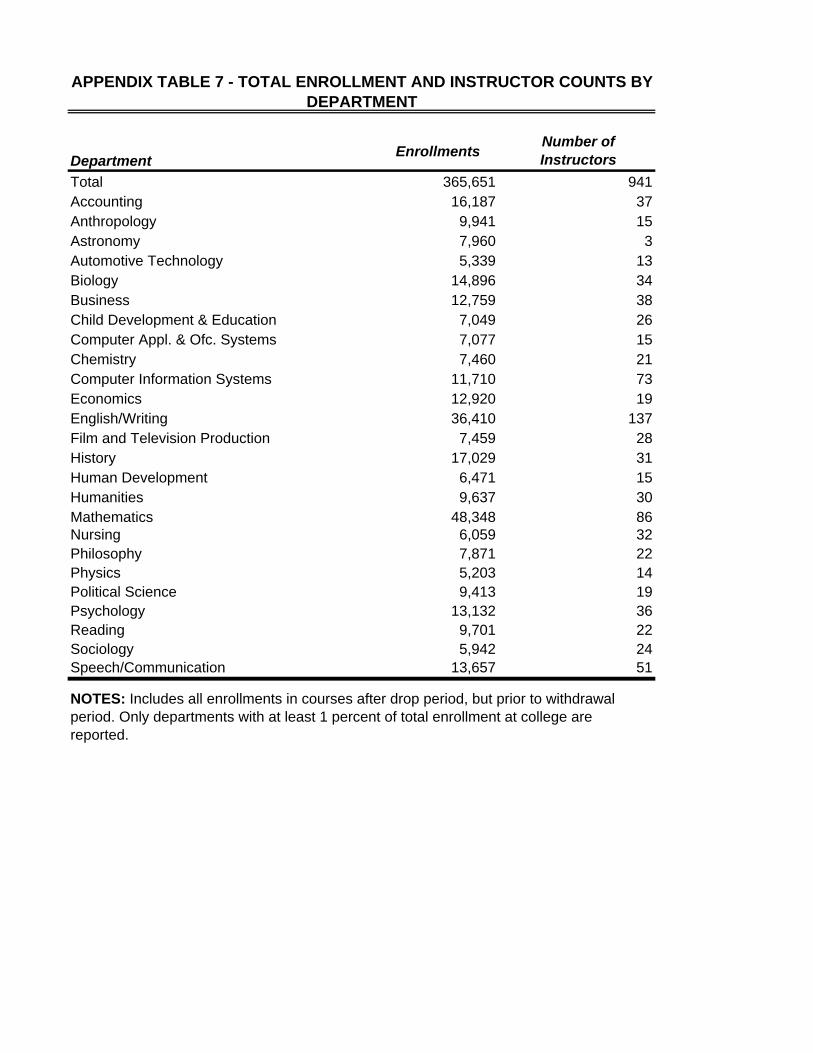
DepartmentEnrollments
Number of Instructors
Total 365,651 941Accounting 16,187 37Anthropology 9,941 15Astronomy 7,960 3Automotive Technology 5,339 13Biology 14,896 34Business 12,759 38Child Development & Education 7,049 26Computer Appl. & Ofc. Systems 7,077 15Chemistry 7,460 21Computer Information Systems 11,710 73Economics 12,920 19English/Writing 36,410 137Film and Television Production 7,459 28History 17,029 31Human Development 6,471 15Humanities 9,637 30Mathematics 48,348 86Nursing 6,059 32Philosophy 7,871 22Physics 5,203 14Political Science 9,413 19Psychology 13,132 36Reading 9,701 22Sociology 5,942 24Speech/Communication 13,657 51
NOTES: Includes all enrollments in courses after drop period, but prior to withdrawal period. Only departments with at least 1 percent of total enrollment at college are reported.
APPENDIX TABLE 7 - TOTAL ENROLLMENT AND INSTRUCTOR COUNTS BY DEPARTMENT
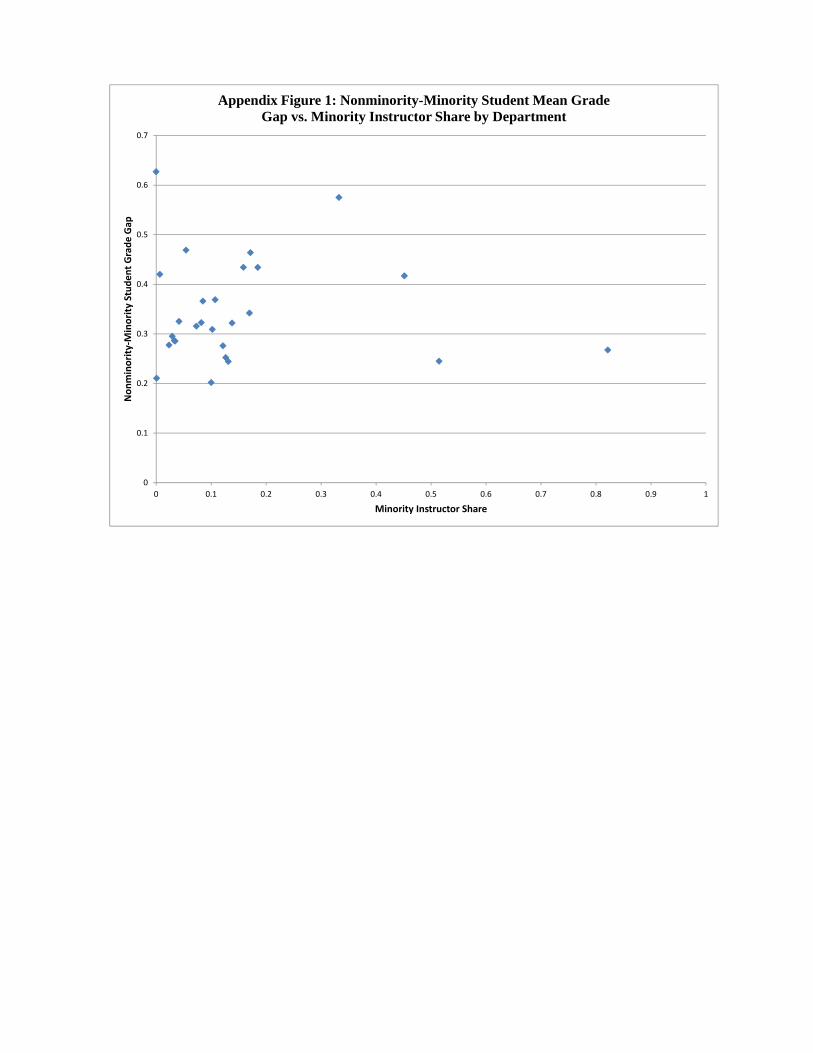
0
0.1
0.2
0.3
0.4
0.5
0.6
0.7
0 0.1 0.2 0.3 0.4 0.5 0.6 0.7 0.8 0.9 1
Nonminority‐M
inority Student Grade Gap
Minority Instructor Share
Appendix Figure 1: Nonminority-Minority Student Mean GradeGap vs. Minority Instructor Share by Department
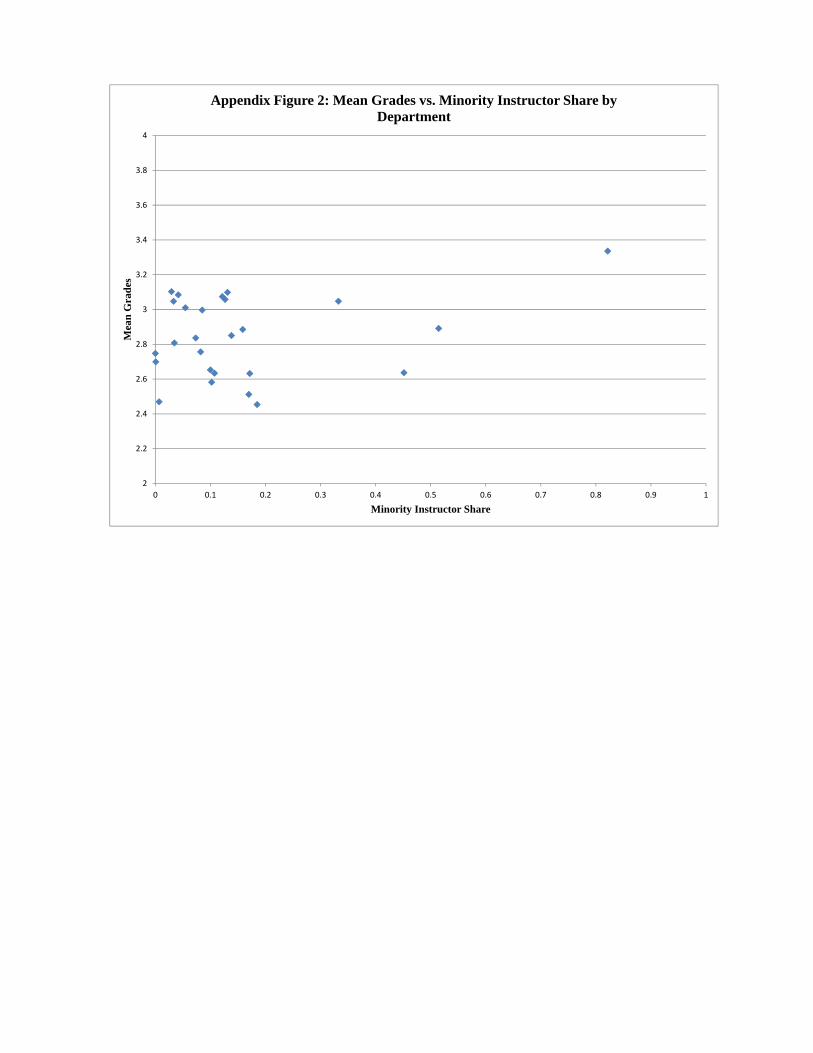
2
2.2
2.4
2.6
2.8
3
3.2
3.4
3.6
3.8
4
0 0.1 0.2 0.3 0.4 0.5 0.6 0.7 0.8 0.9 1
Mea
n G
rad
es
Minority Instructor Share
Appendix Figure 2: Mean Grades vs. Minority Instructor Share by Department
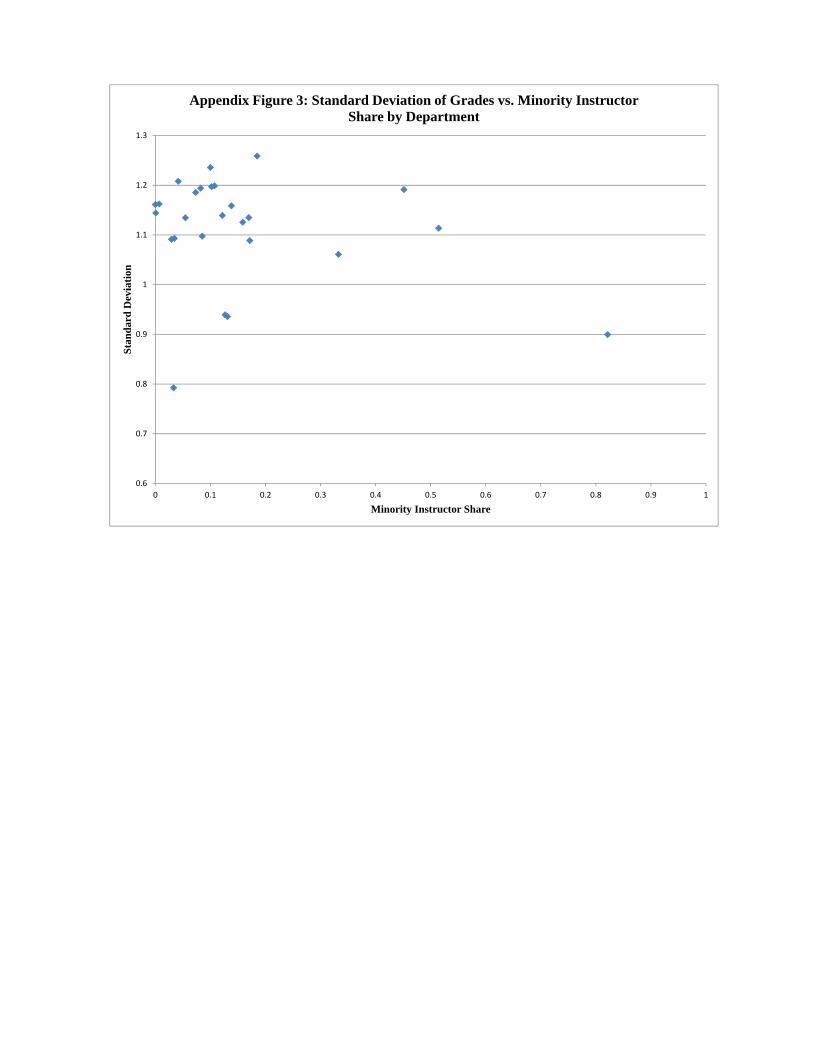
0.6
0.7
0.8
0.9
1
1.1
1.2
1.3
0 0.1 0.2 0.3 0.4 0.5 0.6 0.7 0.8 0.9 1
Sta
nd
ard
Dev
iati
on
Minority Instructor Share
Appendix Figure 3: Standard Deviation of Grades vs. Minority Instructor Share by Department
Related Documents


![BUILDING RAPPORT WITH YOUR STUDENTS - … · “Students don’t like me” “I’m afraid they will take advantage of me ... I don’t feel like my instructor [built] any rapport](https://static.cupdf.com/doc/110x72/5b98cb9009d3f219118cc959/building-rapport-with-your-students-students-dont-like-me-im.jpg)