Feb. 3 - 7, 2014 2014 Gas-Lift Workshop 1 A Combined Experimental & Numerical Research Program to Develop a Computer Simulator for Intermittent Gas-lift Bordalo, S. (1) , Barreto, M. (2) , Pestana, T. (1) , Ochoa Lara, I. (1) (1) UNICAMP, (2) PETROBRAS 37 th Gas-Lift Workshop Houston, Texas, USA February 3 – 7, 2014

Welcome message from author
This document is posted to help you gain knowledge. Please leave a comment to let me know what you think about it! Share it to your friends and learn new things together.
Transcript

Feb. 3 - 7, 2014 2014 Gas-Lift Workshop 1
A Combined Experimental &
Numerical Research Program
to Develop a Computer Simulator
for Intermittent Gas-lift
Bordalo, S.(1), Barreto, M.(2),
Pestana, T.(1), Ochoa Lara, I.(1)
(1) UNICAMP, (2) PETROBRAS
37th Gas-Lift Workshop Houston, Texas, USA February 3 – 7, 2014

Motivation
• Hundreds of petroleum wells, mainly in the northeast
region of Brazil, are equipped with Intermittent Gas-Lift
systems (IGL), due to the high number of mature fields
with low reservoir static pressure.
• Desire for a rational tool to evaluate the IGL’s
performance and to compare artificial lift methods
Slide 3
Objective
Slide 4
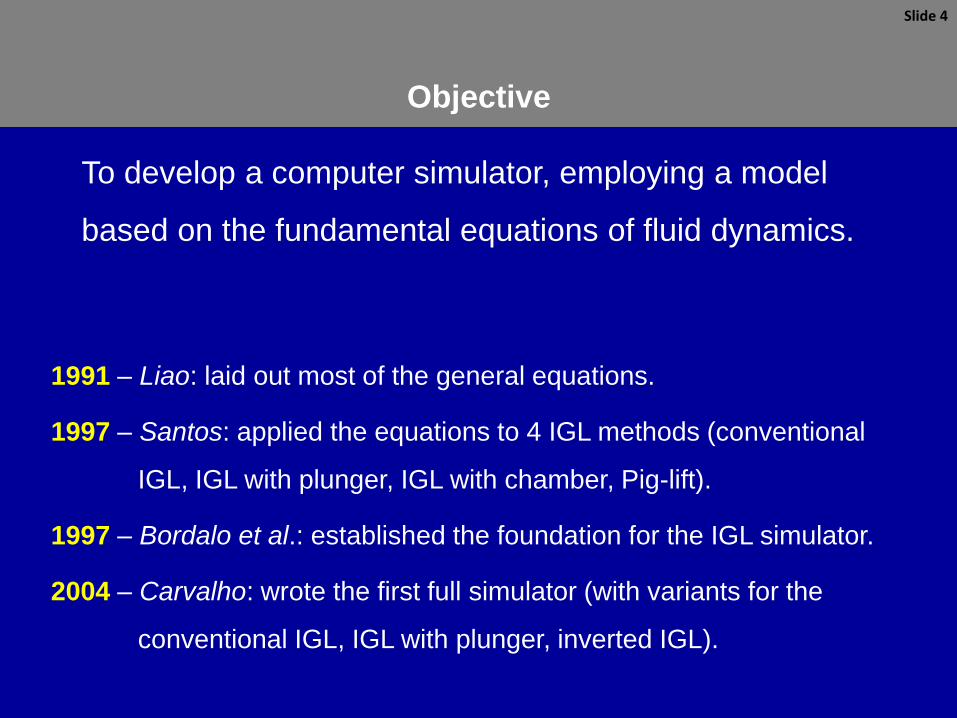
To develop a computer simulator, employing a model
based on the fundamental equations of fluid dynamics.
1991 – Liao: laid out most of the general equations.
1997 – Santos: applied the equations to 4 IGL methods (conventional
IGL, IGL with plunger, IGL with chamber, Pig-lift).
1997 – Bordalo et al.: established the foundation for the IGL simulator.
2004 – Carvalho: wrote the first full simulator (with variants for the
conventional IGL, IGL with plunger, inverted IGL).
Intermittent Gas Lift
Slide 5
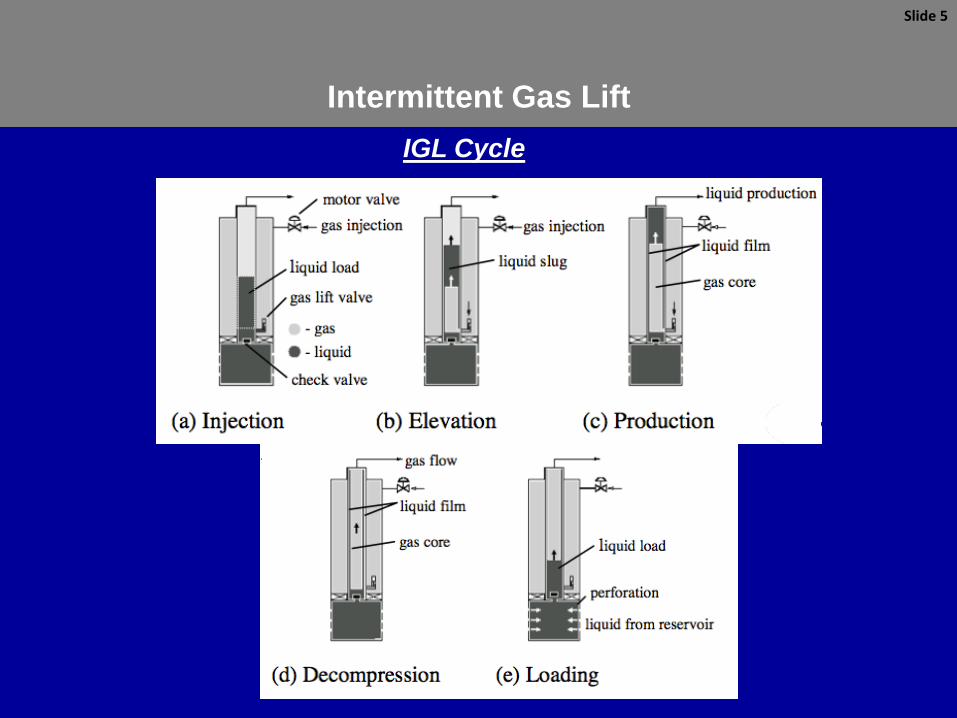
IGL Cycle

Pestana’s work:
Based on the simulator developed by Carvalho (2004)
Introduction of specific formulations for topics such as:
•the throttling flow regime of the gas-lift valve
•the behavior of the pressure upstream of the motor valve
•the behavior of the bottom-hole pressure when the standing valve closes
•the gas velocity during the decompression stage
•the two-phase flow in the production line
Slide 6
Mathematical Modeling

Mathematical Modeling
Pressure Upstream of the Motor Valve:
Slide 7
Mass Conservation
applied to the gas
injection line
Pressure Upstream of the Motor Valve is estimated
New gas flow is estimated
Weymouth’s
Correlation
Pressure Upstream of
the Motor Valve
Thornhil-Craver’s
equation
Mathematical Modeling
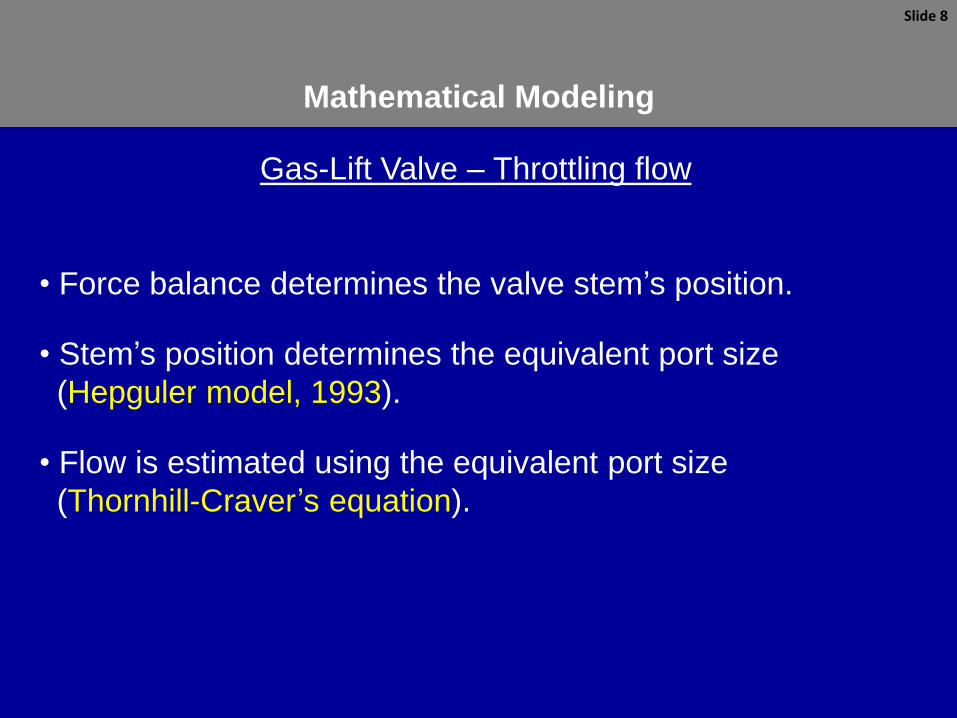
Gas-Lift Valve – Throttling flow
• Force balance determines the valve stem’s position.
• Stem’s position determines the equivalent port size
(Hepguler model, 1993).
• Flow is estimated using the equivalent port size
(Thornhill-Craver’s equation).
Slide 8
Mathematical Modeling
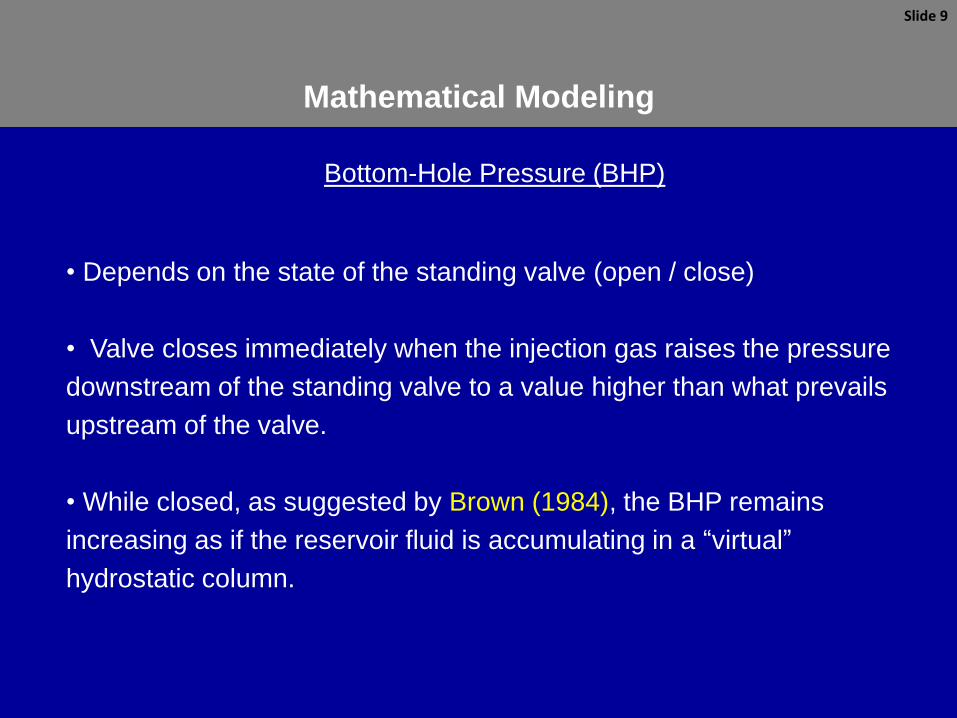
Bottom-Hole Pressure (BHP)
• Depends on the state of the standing valve (open / close)
• Valve closes immediately when the injection gas raises the pressure
downstream of the standing valve to a value higher than what prevails
upstream of the valve.
• While closed, as suggested by Brown (1984), the BHP remains
increasing as if the reservoir fluid is accumulating in a “virtual”
hydrostatic column.
Slide 9
Mathematical Modeling
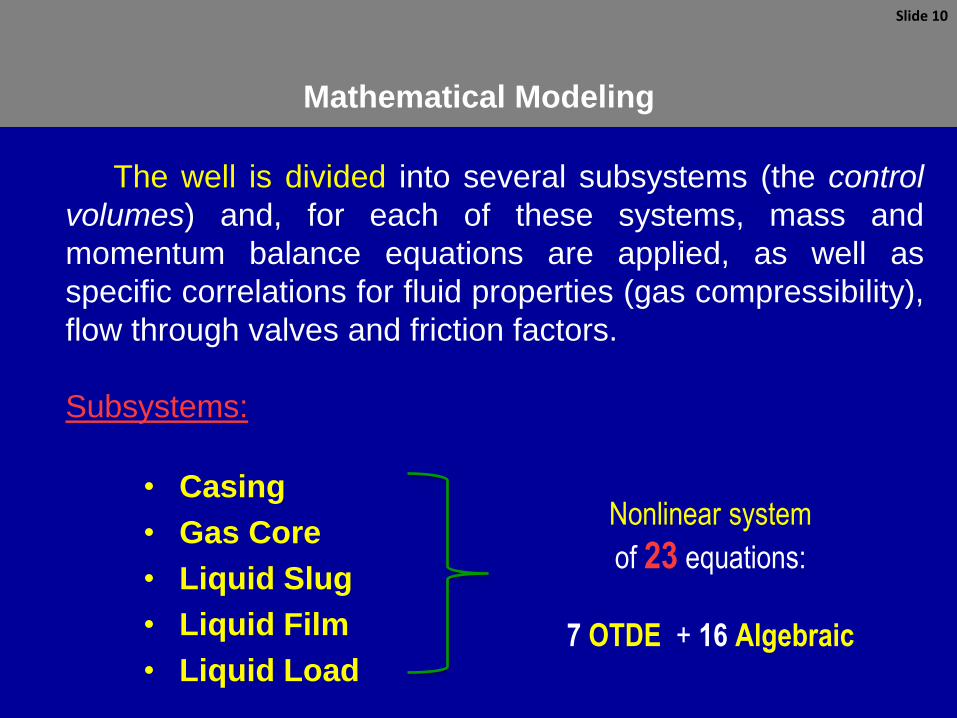
The well is divided into several subsystems (the control
volumes) and, for each of these systems, mass and
momentum balance equations are applied, as well as
specific correlations for fluid properties (gas compressibility),
flow through valves and friction factors.
Subsystems:
• Casing
• Gas Core
• Liquid Slug
• Liquid Film
• Liquid Load
Slide 10
Nonlinear system
of 23 equations:
7 OTDE + 16 Algebraic
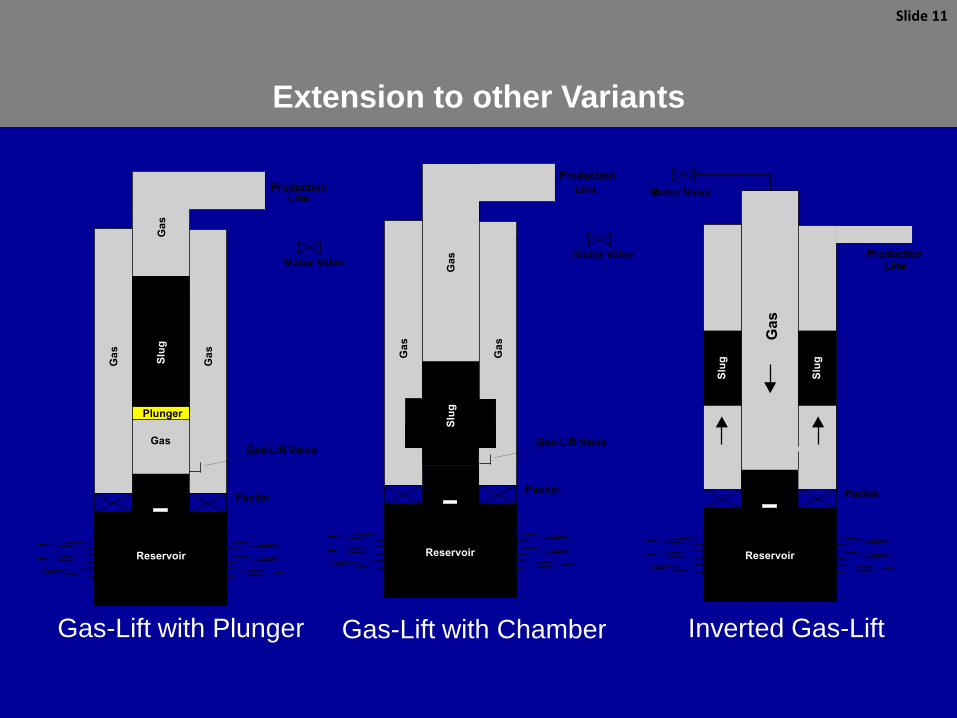
Extension to other Variants
Slide 11
Motor Valve
Ga
s
Ga
s
Ga
s
Reservoir
Gas-Lift Valve
Line
Production
Packer
Slu
g
Ga
s
Reservoir
ProductionLine
Packer
Motor Valve
Slu
g
Slu
g
Motor Valve
Slu
g
Ga
s
Ga
s
Gas
Ga
s
Reservoir
Gas-Lift Valve
LineProduction
Packer
Plunger
Gas-Lift with Plunger Gas-Lift with Chamber Inverted Gas-Lift
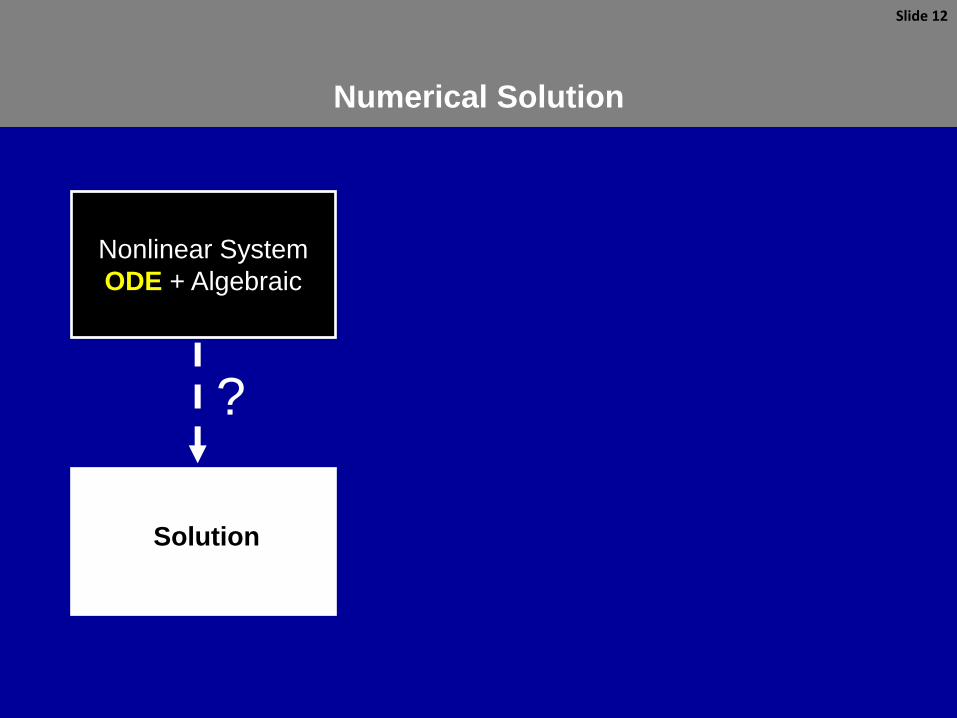
Numerical Solution
Slide 12
Nonlinear System
ODE + Algebraic
Solution
?

Numerical Solution
Slide 13
Nonlinear System
ODE + Algebraic
System of Nonlinear
Algebraic Equations
System of Linear
Equations
Solution based on a
Convergence Criteria
LU Decomposition
Newton-Raphson
Method
Crank-Nicolson
Method
For each time-step

Mathematical Modeling
Bottom-Hole Pressure (Pbh) and Tubing Pressure (Pt)
Slide 14
Pbh
Pt - glv

Computational Code / Graphical User Interface
• Codes were implemented using FORTRAN 90
• Each gas-lift method was implemented independently and has it’s own
executable code.
• The Graphical User Interface was developed using Python and the
PySide library (freeware).
Slide 15
Numerical Output Graphical Output
Volume of produced liquid Bottom-Hole Pressure
Fallback Wellhead Pressure
Volume of Injected Gas Tubing & Casing Pressure
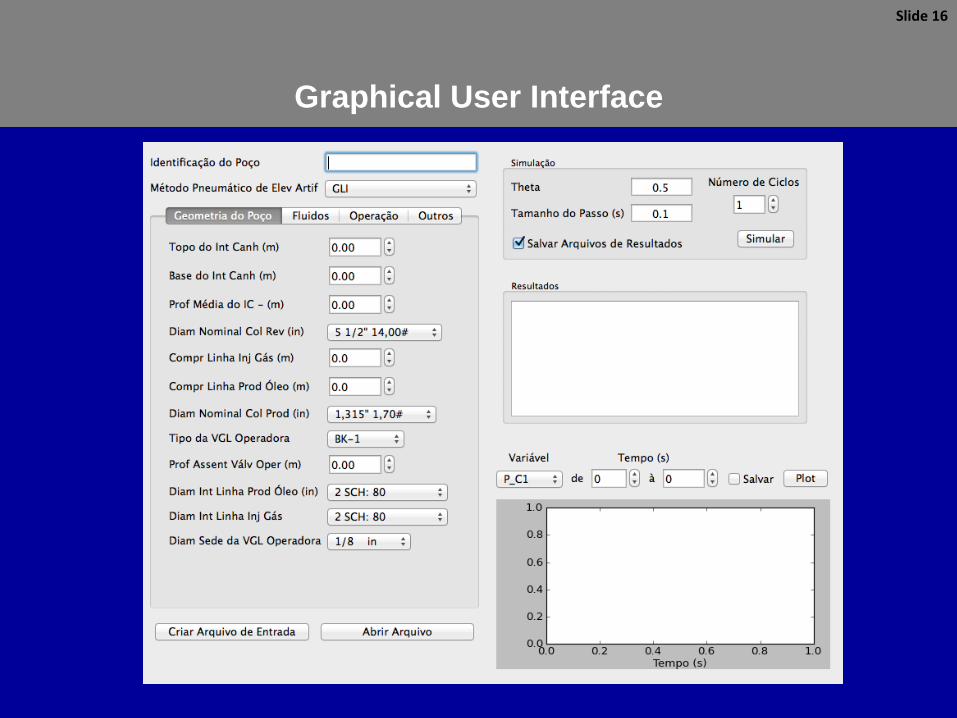
Graphical User Interface
Slide 16
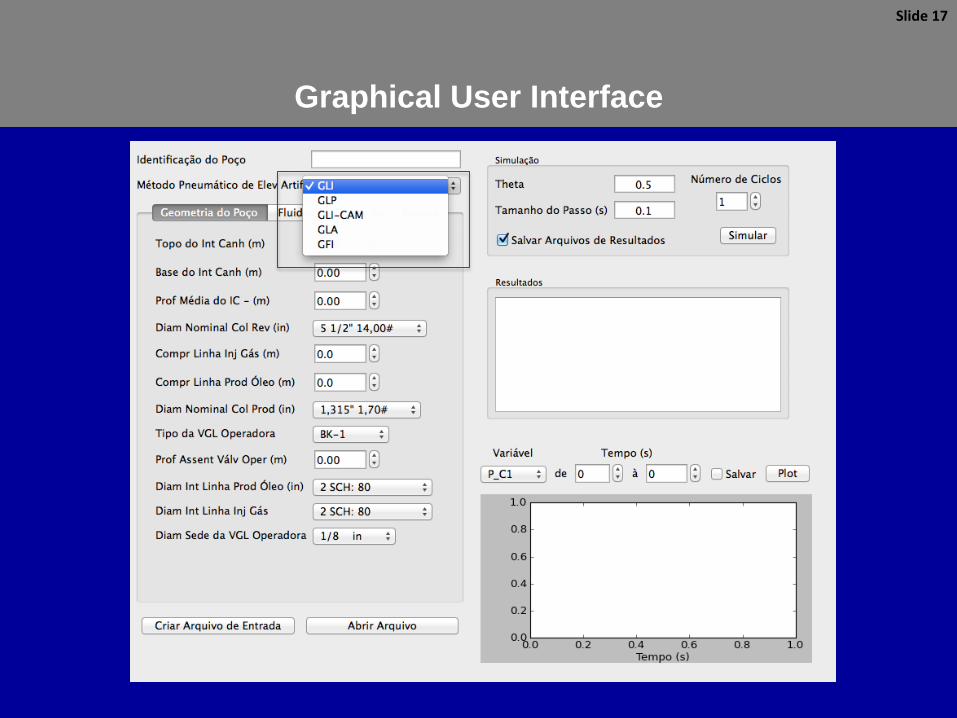
Graphical User Interface
Slide 17
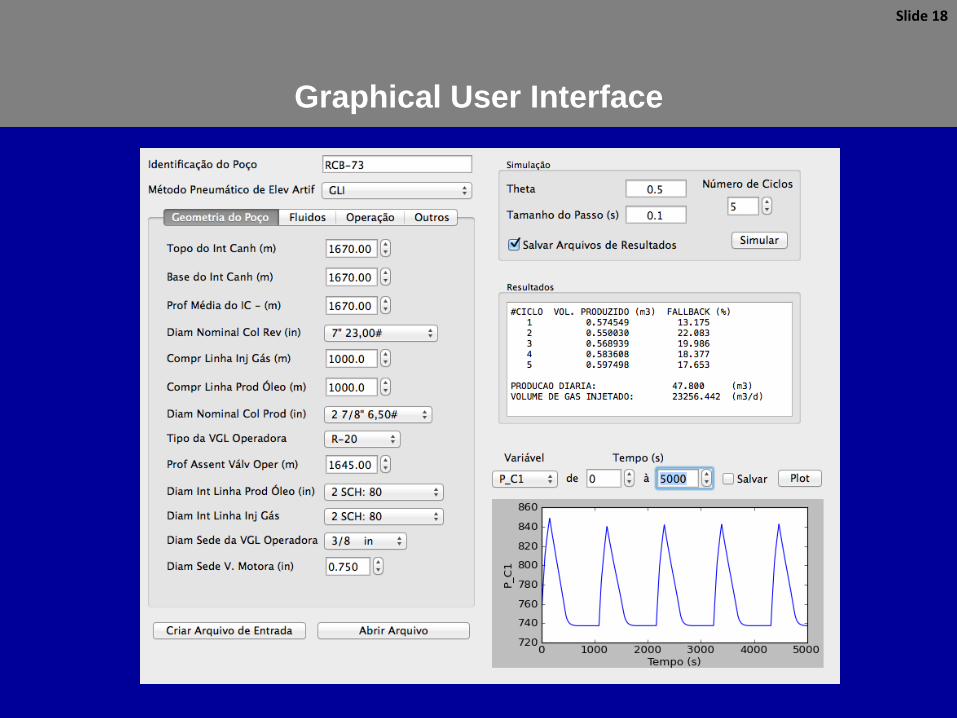
Graphical User Interface
Slide 18

Graphical User Interface
Slide 19
1.5
2
2.5
3
3.5
4
4.5
5
5.5
0 500 1000 1500 2000 2500 3000
Bo
ttom
Ho
le P
ressure
(M
Pa
)
Time (s)
Graphical Output
Bottom-hole Pressure

Slide 20
2
3
4
5
6
7
0 500 1000 1500 2000 2500 3000
Tub
ing P
ressu
re (
MP
a)
Time (s)
Tubing Pressure
Graphical User Interface
Graphical Output

Slide 21
0.6
0.7
0.8
0.9
1
1.1
1.2
1.3
1.4
0 500 1000 1500 2000 2500 3000
We
llhea
d P
ressu
re (
MP
a)
Time (s)
Wellhead Pressure
Graphical User Interface
Graphical Output
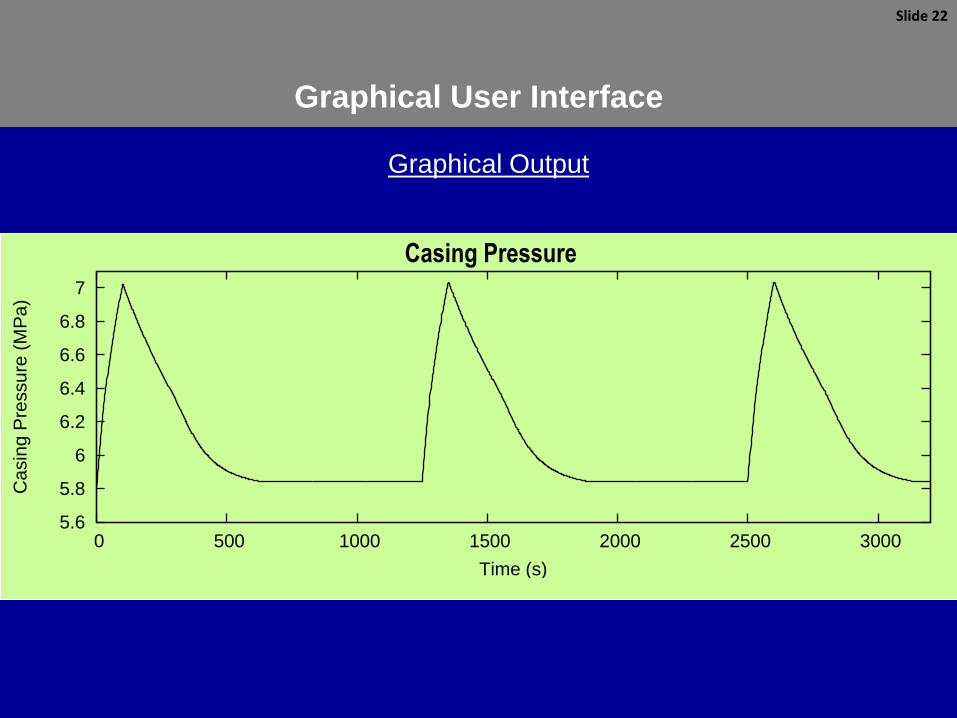
Slide 22
5.6
5.8
6
6.2
6.4
6.6
6.8
7
0 500 1000 1500 2000 2500 3000
Ca
sin
g P
ressu
re (
MP
a)
Time (s)
Casing Pressure
Graphical User Interface
Graphical Output

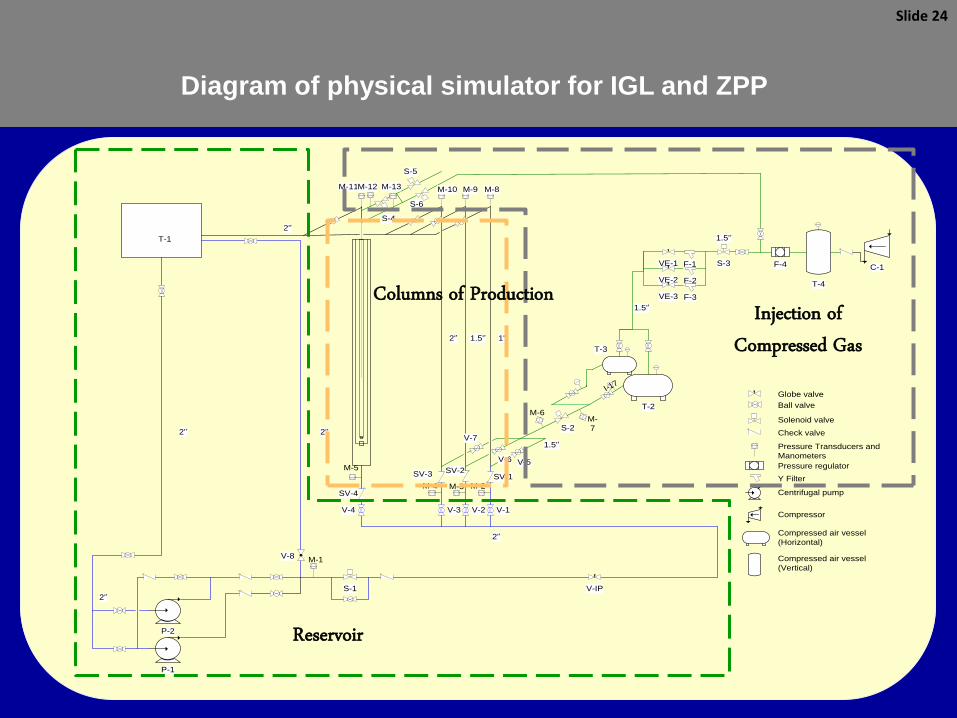
Intermittent Gas-Lift & Zadson pneumatic pump
Slide 23
Similar to the IGL, the ZPP lifts of oil through
cycles of compression and decompression of
gas.
The gas injection occurs at regular time
intervals synchronized with the feeding of
oil from the reservoir to the well.
T-1
2'’
2'’
2'’
S-1
V-3 V-1V-2
1'’1.5'’
2'’
1.5'’
V-5V-6
V-7
I-17
T-2
T-3
VE-1
VE-2
VE-3
F-1
F-2
F-3
S-3
T-4
F-4 C-1
V-4
SV-4
2'’
S-6
S-5
S-4
V-8
P-2
P-1
M-1
M-2M-3M-4
M-5
M-6M-
7
S-2
1.5'’
1.5'’
2'’
M-8M-9M-10M-11
Globe valve
Ball valve
Solenoid valve
Check valve
Pressure Transducers and
Manometers
Pressure regulator
Y Filter
Centrifugal pump
Compressor
Compressed air vessel
(Horizontal)
Compressed air vessel
(Vertical)
M-13M-12
V-IP
SV-1SV-2SV-3
Diagram of physical simulator for IGL and ZPP
Slide 24
Reservoir
Injection of Compressed Gas
Columns of Production
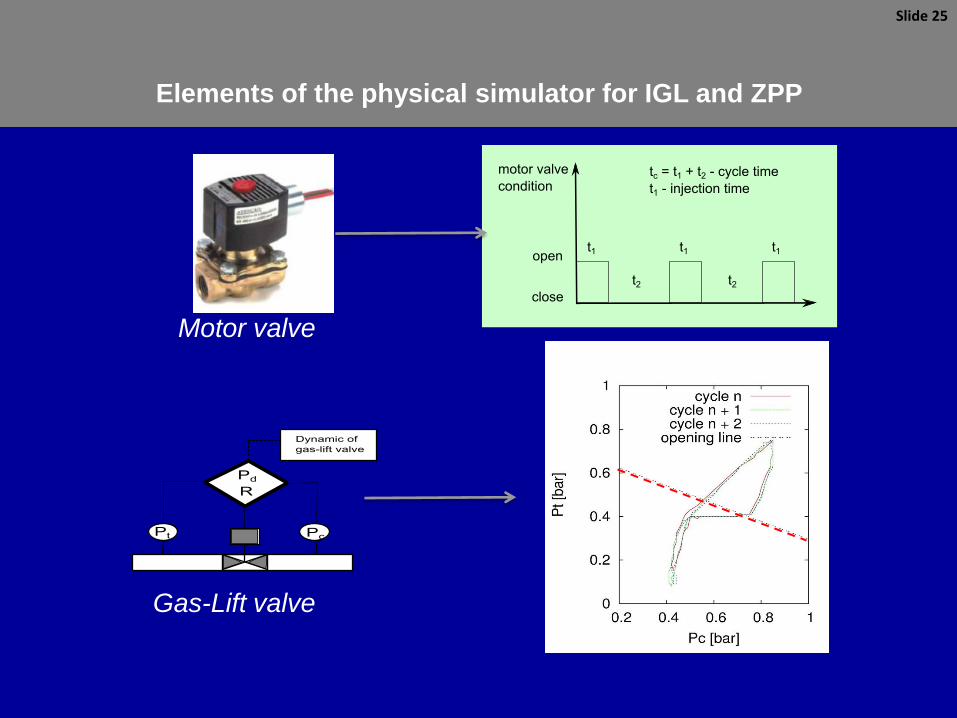
Elements of the physical simulator for IGL and ZPP
Slide 25
Motor valve
Gas-Lift valve
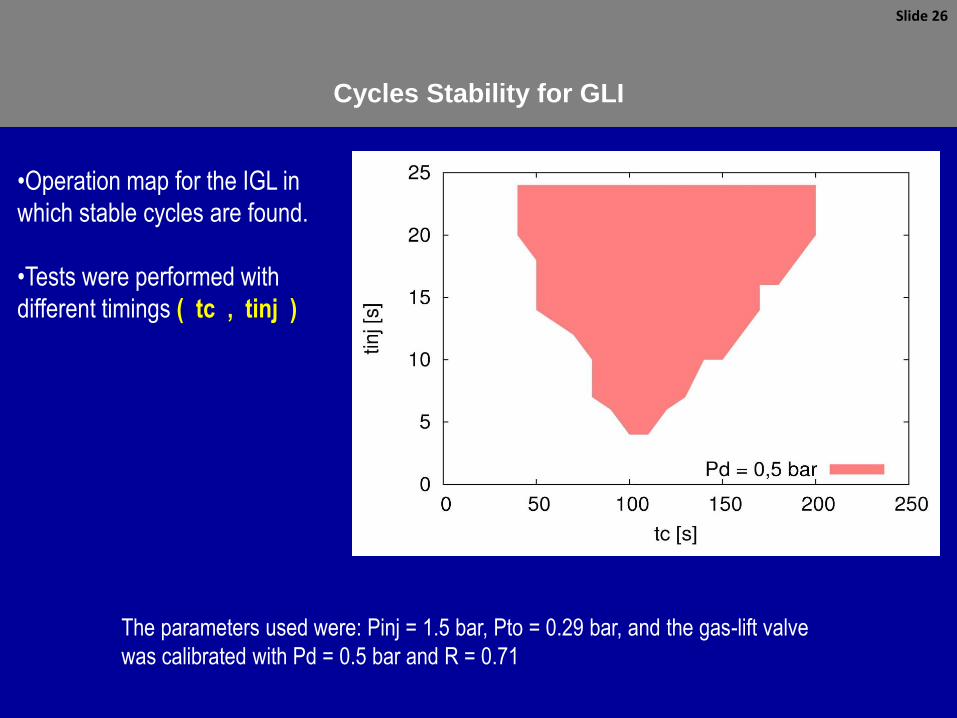
Cycles Stability for GLI
Slide 26
•Operation map for the IGL in
which stable cycles are found.
•Tests were performed with
different timings ( tc , tinj )
The parameters used were: Pinj = 1.5 bar, Pto = 0.29 bar, and the gas-lift valve
was calibrated with Pd = 0.5 bar and R = 0.71
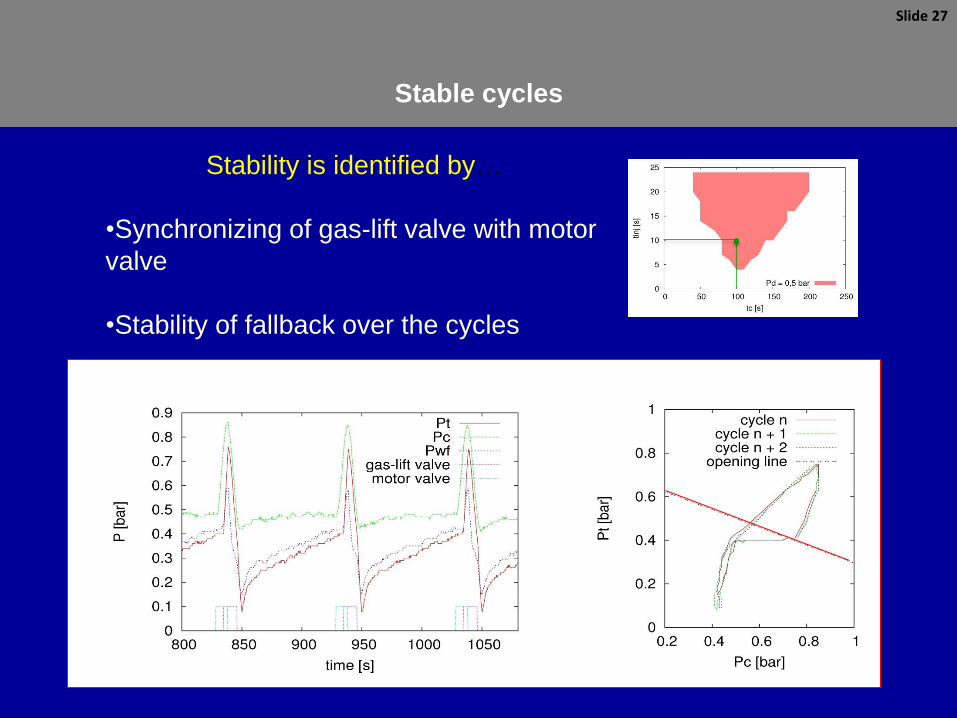
Stable cycles
Slide 27
Stability is identified by…
•Synchronizing of gas-lift valve with motor
valve
•Stability of fallback over the cycles
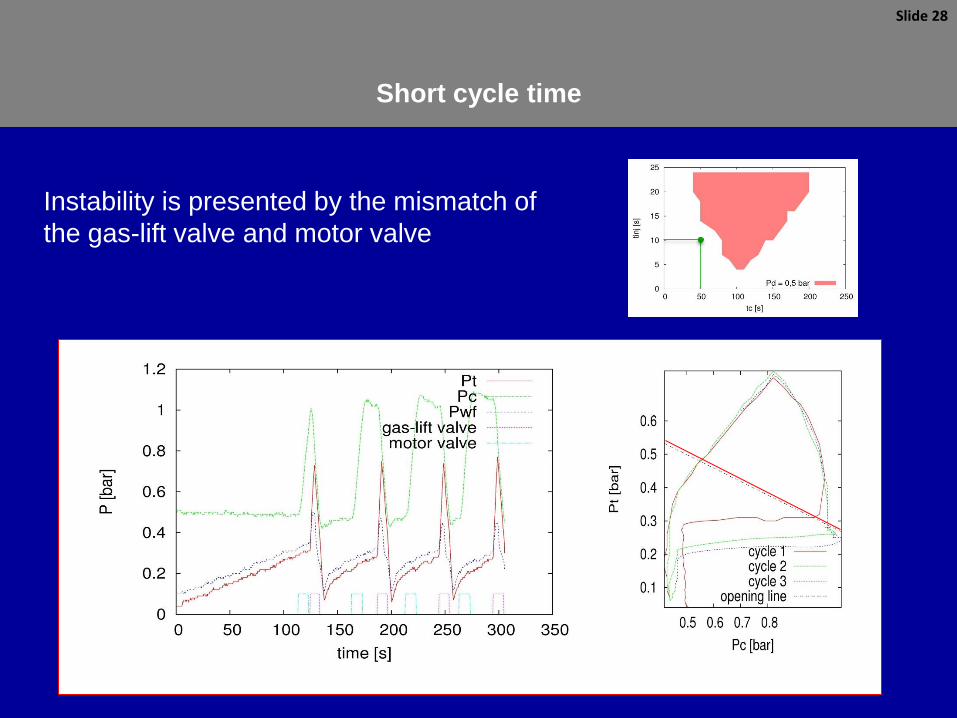
Short cycle time
Slide 28
Instability is presented by the mismatch of
the gas-lift valve and motor valve

Long cycle time
Slide 29
Tubing pressure at the moment of the
injection increases with the number of
cycles; greater fallback at each cycle; gas
cannot adequately lift the liquid load fed into
the tubing.

Influence of dome pressure on stability
Slide 30
• Increasing the dome pressure shifts the stable area to the “right”
• Higher cycle times are required to acchieve stable cycles

Dynamic behavior of ZPP for first mode
Slide 31
• Behavior of key pressures, featuring a
ZPP cycle in Mode 1.
• During the second pressurization, part
of the accumulated gas in the
intermediate annular is transferred to
the internal annular, passing through the
V2 valve.
• The moment when the liquid reaches
the surface is identified by increasing
wellhead pressure (Pwh).
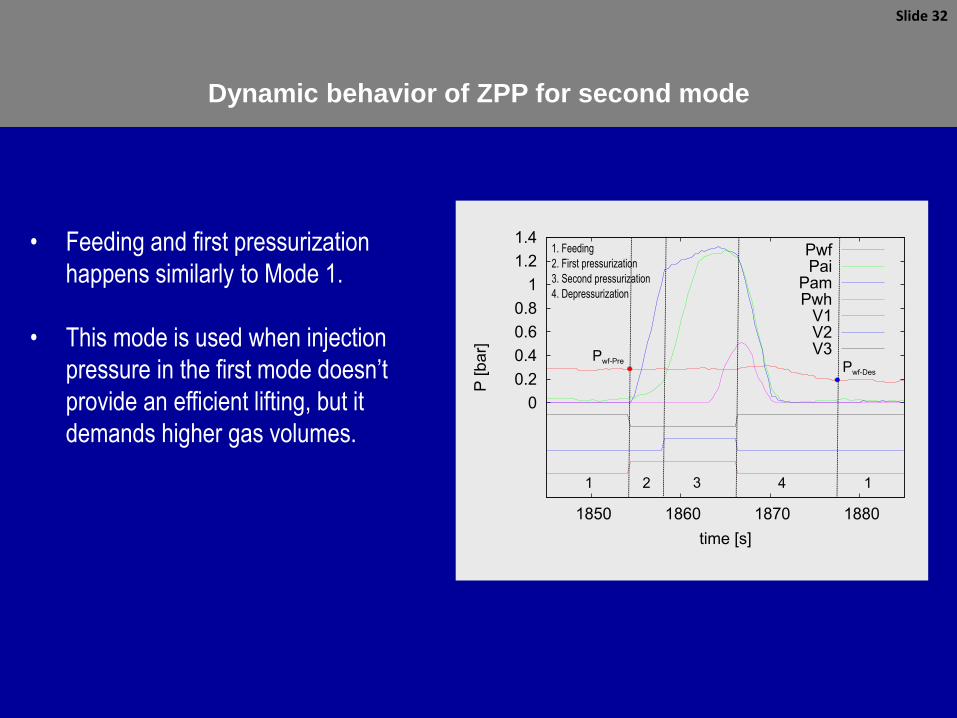
Dynamic behavior of ZPP for second mode
Slide 32
• Feeding and first pressurization
happens similarly to Mode 1.
• This mode is used when injection
pressure in the first mode doesn’t
provide an efficient lifting, but it
demands higher gas volumes.

Dynamic behavior of ZPP for third mode
Slide 33
• The principle of lifting in the third mode
is similar to a Sucker Rod Pump (SRP),
in which the tubing is totally filled and
the volume fed into the tubing is
produced at the surface
• Figure shows the behavior of the Pam
and Pwf vs time, as well as the
actuation of V1 and V3 valves following
compression and decompression

Conclusions
• a working computer simulator was developed for the dynamics of IGL systems,
using a rational mechanistic approach.
• results are qualitatively consistent.
• a GUI was created to operate the simulator.
• the IGLsim may be improved using lab or field data.
• the IGLsim may be expanded with new features.
• a laboratory apparatus was built for the study of the Intermittent Gas-lift and
Zadson Pneumatic Pump.
• a map was draw as a function of tc and tinj indicating the region where the
cycles are stable.
• increasing dome pressure requires higher cycle times for stable cycles
• the dynamics of the stages of a ZPP cycle can be observed, for all the three
modes of operation, by monitoring key pressures.
• produced volumes and fallback can be determined.

The authors wish to acknowledge the support of Petrobras and
the Gas-lift Lab of the Dept. of Petroleum Engineering at UNICAMP.

Feb. 3 – 7, 2014
2014 Gas-Lift Workshop 36
Copyright
Rights to this presentation are owned by the company(ies) and/or author(s) listed on the title page. By submitting this presentation to the Gas-Lift Workshop, they grant to the Workshop, the Artificial Lift Research and Development Council (ALRDC), and the American Society of Mechanical Engineers (ASME), rights to:
– Display the presentation at the Workshop.
– Place it on the www.alrdc.com web site, with access to the site to be as directed by the Workshop Steering Committee.
– Place it on a CD for distribution and/or sale as directed by the Workshop Steering Committee.
Other uses of this presentation are prohibited without the expressed written permission of the company(ies) and/or author(s) who own it and the Workshop Steering Committee.

Feb. 3 – 7, 2014 2014 Gas-Lift Workshop 37
Disclaimer
The following disclaimer shall be included as the last page of a Technical Presentation or Continuing Education Course. A similar disclaimer is included on the front page of the Gas-Lift Workshop Web Site.
The Artificial Lift Research and Development Council and its officers and trustees, and the Gas-Lift Workshop Steering Committee members, and their supporting organizations and companies (here-in-after referred to as the Sponsoring Organizations), and the author(s) of this Technical Presentation or Continuing Education Training Course and their company(ies), provide this presentation and/or training material at the Gas-Lift Workshop "as is" without any warranty of any kind, express or implied, as to the accuracy of the information or the products or services referred to by any presenter (in so far as such warranties may be excluded under any relevant law) and these members and their companies will not be liable for unlawful actions and any losses or damage that may result from use of any presentation as a consequence of any inaccuracies in, or any omission from, the information which therein may be contained.
The views, opinions, and conclusions expressed in these presentations and/or training materials are those of the author and not necessarily those of the Sponsoring Organizations. The author is solely responsible for the content of the materials.
The Sponsoring Organizations cannot and do not warrant the accuracy of these documents beyond the source documents, although we do make every attempt to work from authoritative sources. The Sponsoring Organizations provide these presentations and/or training materials as a service. The Sponsoring Organizations make no representations or warranties, express or implied, with respect to the presentations and/or training materials, or any part thereof, including any warrantees of title, non-infringement of copyright or patent rights of others, merchantability, or fitness or suitability for any purpose.
Related Documents


