A COiWPARATIVE ANALYSIS OF THE ECONOMICS OF PULP PRODUCTiON IN NORTH AND SOUTH AMERICA FOR THE EUROPEAN MARKET by Donald George Fletcher 8. A. , Simon Fraser University, 1968 A THESIS SUBMITTED IN PARTlAL FULFILLMENT OF THE REQUIREMENTS FOR THE DEGREE OF MASTER OF ARTS in the Department of Econom ics and Commerce DONALD GEORGE FLETCHER 1 974 SIMON FRASER UNI VERSI TY A p r i l 1974

Welcome message from author
This document is posted to help you gain knowledge. Please leave a comment to let me know what you think about it! Share it to your friends and learn new things together.
Transcript

A COiWPARATIVE ANALYSIS OF THE
ECONOMICS OF PULP PRODUCTiON IN
NORTH AND SOUTH AMERICA FOR THE
EUROPEAN MARKET
by
Donald George Fletcher
8. A. , Simon F rase r Universi ty, 1968
A THESIS SUBMITTED IN PARTlAL FULFILLMENT OF
THE REQUIREMENTS FOR THE DEGREE O F
MASTER OF A R T S
in the Department
of
Econom ics and Commerce
DONALD GEORGE FLETCHER 1 974
SIMON FRASER UNI VERSI TY
A p r i l 1974

APPROVAL
Name: Donald George F le t che r
Degree: Master o f A r t s
T i t l e o f Thesis: A Comparat ive Ana l ys i s o f the Economics o f Pu lp Product ion in Nor th and South Amer i ca f o r the European Market
Examin ing Committee:
Chairman: Dr. R. A. Holmes
Dr. S. Sydneysmith Sen io r Supe rv i so r
Dr. D. Beck Examin ing Committee
Dr. G. Steed Examin ing Committee
Date Approved:

TABLE OF CONTENTS
Table of Contents
L i s t of Tables
L i s t of Maps and Char ts
Symbols and Conversion Fac to rs
I INTRODUCTION
I I EUROPEAN INDUSTRIAL WOOD BALANCE
I I I FOREST RESOURCE POTENTIAL O F T H E AMERICAS
3. 1 Nor th Amer ica
3 .2 La t i nAmer i ca
I V THE STUDY AND ITS SETTING
4. I Hypothetical M i l l Locations
4.2 Locational Fac to rs
4.3 Comparative Data
4.4 Scale of Operations
4.5 M i l l Operations
4.6 Product Market and P r i ces
V LOCAY I O M L FACTOR COMPARISON

Transportat ion Requirements
WiJater Requirements
Environmental Control
Chem ical Requirements
Energy Requirements
Labour Considerat ions
Investment Capital - Costs and Avai labi l i ty
Social Capital
Po l i t ical and Economic Environment
VI COMPARATIVE COST ANALYSIS
6. 1 Cost St ruc ture
6.1.1 Manufacturing Costs
6. 1.2 Non-manufacturing Costs
6.1.3 Total Costs
6.2 Return on lnvestment
6.3 Qualitative Considerations
V I I CONCLUSIONS
L i s t of References
Bib1 iography

LIST OF TABLES
I industr ial Wood Balance, Europe
I I Apparent Consumption of Paper, Paperboard, and Dissolving Pulp, Europe
Ill Industrial Vdood Balance by Region, Europe
IV Net Trade Balance i n Paper Grade Pulp, VJestern Europe
V Net Trade Balance i n Paper Grade Pulp, North America
V I Paper Grade Pulp Exports, United States and Canada
VI I Paper Grade Pulp Exports to Europe from United States and Canada
V l l l Net Trade Balance i n Paper Grade Pulp, La t in America
IX Bleached Kra f t Pulp Prices, Western European Market
X Del ivered Wood Costs
X I Transportat ion Component of Del ivered Wood Costs
XI I Product Transportat ion Costs
Xlll Effluent Control Systems, Capital Costs
X I V A i r Po l lution Abatement Systems, Capital Costs
X V Pr inc ipa l Chemicals Ut i l ized i n the Bleached K ra f t Pulp Process
XVI Chemical Costs
X V l l Heat Balances and Purchased Fuel Requirements
XV I l l WagesandFr ingeBenef i ts
XIX lnvestment Requirements
XX Manufacturing and Non-Manufactur ing Costs
XXI ManufacturingCosts, Rankingbysi te
XXl I Non-Manufactur ing Costs, Ranking by Site
XXl l I Total Manufacturing and Non-Manufacturing Costs, Ranking by Si te
XXIV Net Earnings and Return on lnvestment
XXV Return on Investment, Ranking by Site
L I S T OF MAPS AND CHARTS
I Hypothetical Mi l I Locations
2 Investment Requirements as a Function of M i l l Size, Bleached K ra f t Pulp Production
3 Product ion Costs as a Function of Mi l l Size, Bleached Kra f t Pu lp Product ion
4 Manufacturing Cost Components
5 Total Cost Components

SYMBOLS AND CONVERSlON FACTORS
ADMT
Bbl
Ha
K W
KWH
M C ~ I / H ~
MCF
M i l l
$US
WRME
a i r d ry metr ic ton (1 0 % moisture)
ba r re l
hectare
ki lowatt
k i lovvatt hour
thousand calor iks/hour
thousand cubic feet
$. 001
United States do1 la r
wood raw material equivalent
Length
1 metre - 3.281 feet 1 ki lometre - 0.621 miles
A rea
1 square metre - 10.76 square feet 1 hectare - 2.471 acres
I I - 10,000 square metres
Volume
1 cubic metre - 35.34 cubic feet 1 metre/hectare - 14.29 cubic feet/acre
Mass
1 ki logram - 2.205 pounds 1 met r ic ton - 1,000 ki lograms
I I - 2,204.6 pounds I I - 1 . 1 023 short tons I I - 0.9842 long tons

I
INTRODUCTION
Rapid increases i n the consumption of paper, paperboard and
other wood based products have resulted i n a shortage of wood f i b re
i n regions of the wor ld such as Western Europe and Japan. T o ensure
continued supplies of wood fibre, multi-national pulp and paper corpo-
rat ions serving these fibre-deficit areas have been forced to extend
their pulp operations to other areas of the wor ld wi th surplus forest
resources. Consequently, many of these fu l ly integrated corporations
operate paper plants located i n the major market areas and pulp mi l Is
located close to available forest resources. Th i s symbiotic interde-
pendence of markets and resource regions i s character is t ic of the in-
ternational pulp and paper industry and presents the industry w i th unique
problems i n locational decision making.
I n the process of evaluating new pulp m i l l prospects, managers
of multi-national pulp and paper corporations a re faced wi th a number
of alternative investment opportunities i n both developed and developing
economies. One of the objectives of this study i s to develop a number
of locational factors common to the pulp industry which would provide
a systematic framework for a comparative analysis of potential locations.

A second major objective of the study i s to apply the locational
factors to a current situation i n the international pulp and paper industry.
F o r this purpose, f ive major pulp producing.areas i n North and South
America a re examined on the basis of their abi l i ty to produce pulp for
the European market. B y ut i l iz ing the llhypothetical mi l l technique" for
comparative economic analysis, hypothetical m i l l s located i n each area I
may be evaluated in terms of the locational factors and an attempt can be
made to determine the re lat ive attractiveness of each si te i n a quantita-
tive and qualitative manner. On the basis of assumptions outlined i n the
model, s i tes may then be ranked i n terms of both manufacturing and non-
manufacturing costs developed in the analysis.
The study commences with an overview of industrial wood sup-
p ly requirements i n Europe. A comparison i s made of regional demands
re lat ive to forest resource capabil i t ies and supply demand balances for
paper grade market pulp are examined. I n Chapter Ill, the forest re -
source potential and the pulp industry i n North and South America are
discussed br ief ly .
The setting of the study i s outlined i n Chapter IV which pre-
sents locational factors used i n the comparytive analysis, hypothetical
mi l l locations and basic operating data. Pulp pr ices and the product
market a re also established in this chapter.
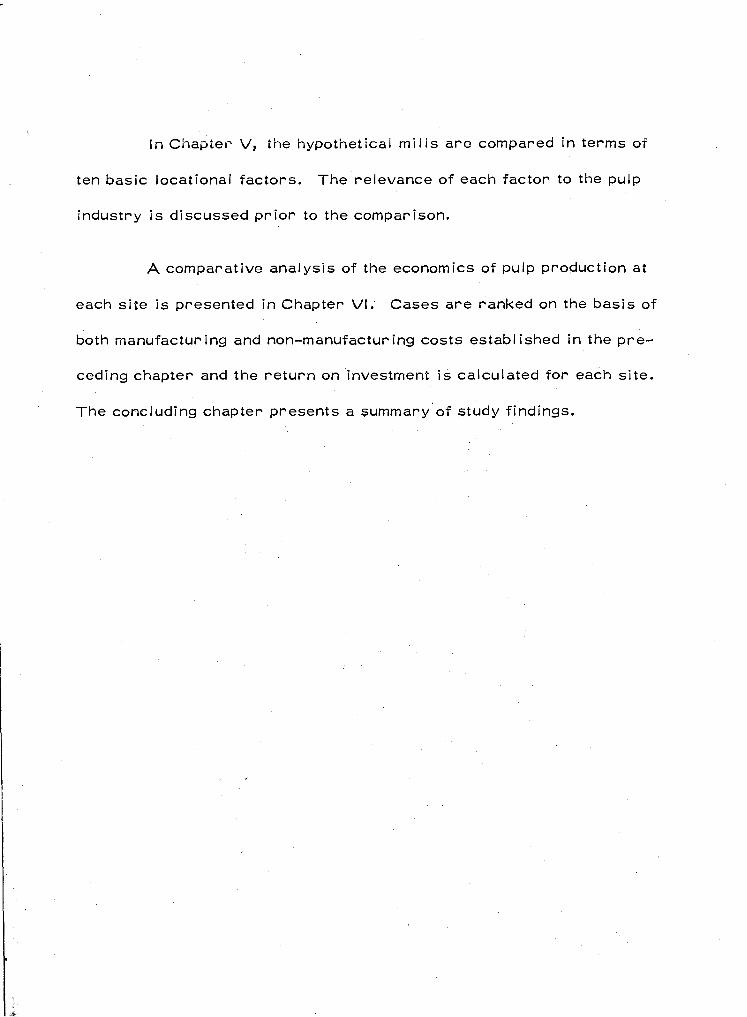
i i l Chapter V, the hypotheticai m i i i s a re compared i n terms of
ten basic locational factors. The relevance of each factor to the pulp
industry i s discussed p r i o r to the comparison.
A comparative analysis of the economics of pulp production at
each site i s presented i n Chapter VI. Cases are ranked on the basis of
both manufacturing and non-manufacturing costs established i n the pre-
ceding chapter and the re tu rn on investment i s calculated fo r each site.
The concluding chapter presents a summary of study findings.
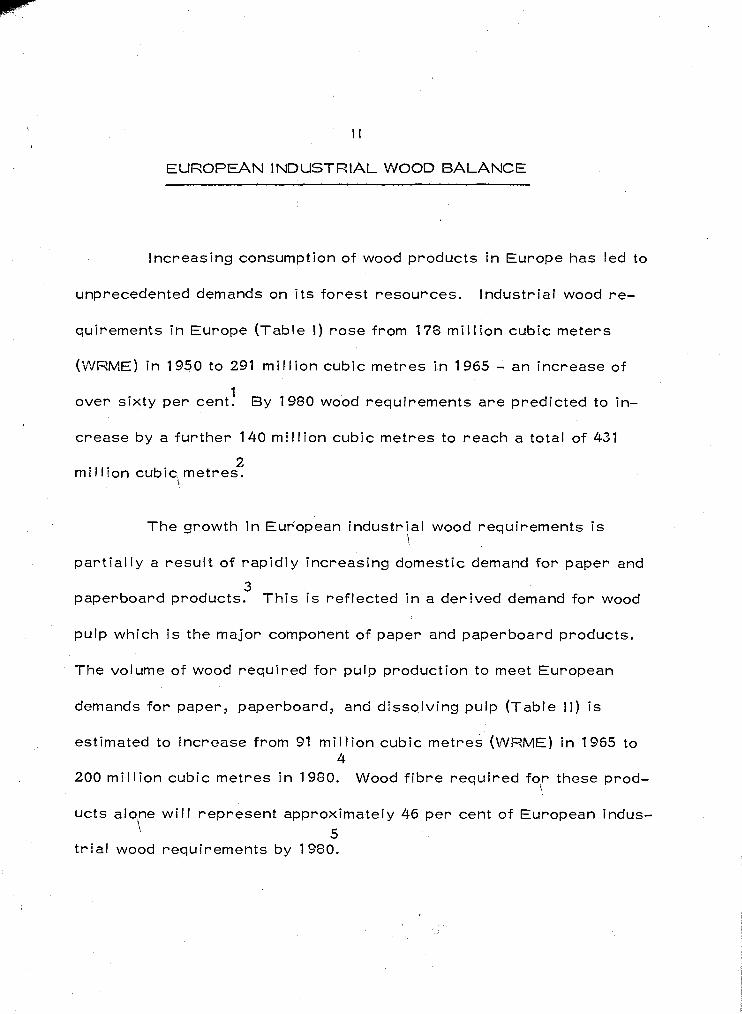
EUROPEAN INDUSTRIAL WOOD BALANCE
Increasing consumption of wood products i n Europe has led to
unprecedented demands on i t s forest resources. Industrial wood re -
quirements i n Europe able I) rose from 178 mi l l ion cubic meters
(WRME) i n 1950 to 291 mi l l ion cubic metres i n 1965 - an increase of
1 over sixty per cent. By 1980 wood requirements a re predicted to in-
crease by a fur ther 140 mi l l ion cubic metres to reach a total of 431
2 mil l ion cubic metres.
\
The growth i n European industrial wood requirements i s \
par t ia l ly a resul t of rapid ly increasing domestic demand fo r paper and
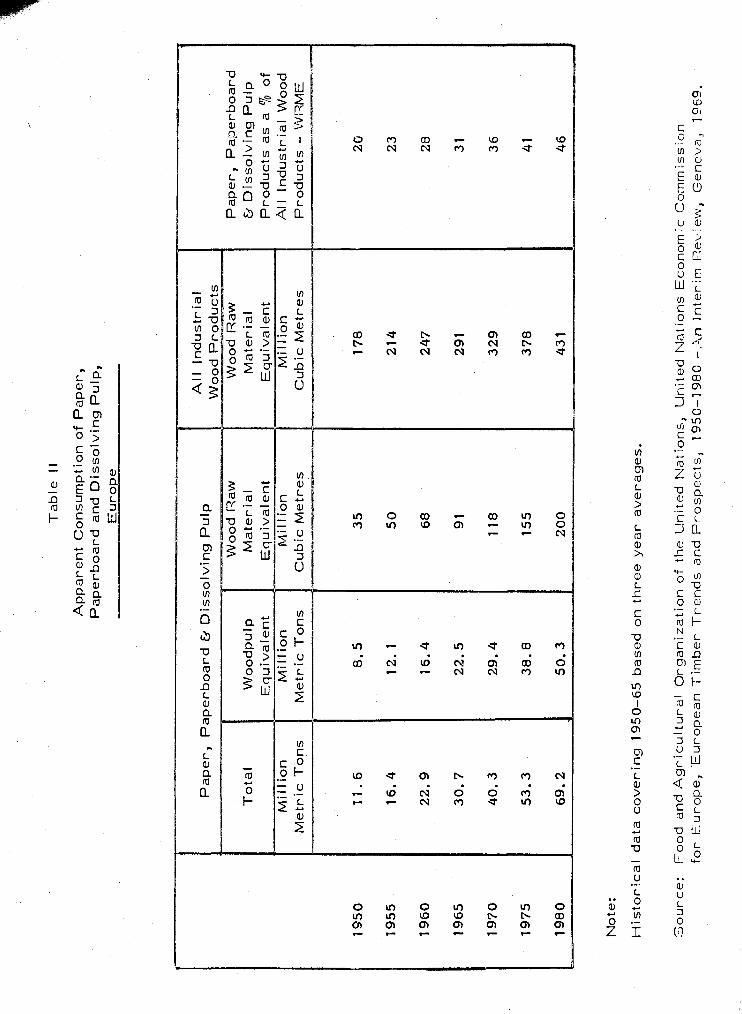
3 paperboard products. Th is i s reflected i n a derived demand fo r wood
pulp which i s the major component of paper and paperboard products.
The volume of wood required for pulp production to meet European
demands fo r paper, paperboard, and dissolving pulp (Table 11) i s
estimated to increase from 91 mi l l ion cubic metres (WRME) i n 1965 to 4
200 mi l l ion cubic metres i n 1980. Wood f ib re required fo r these prod- \
ucts alone w i l l represent approximately 46 per cent of European indus- 1 5
t r i a l wood requirements by 1980.

Ind
ustr
ial
Wood Balance
Eu
rop
e
(Mil
lio
n C
ub
ic M
etr
es - W
ood R
aw
Ma
teri
al
Eq
uiv
ale
nts
)
A.
Ap
pa
ren
t C
on
su
mp
tio
n o
f S
aw
nw
oo
d,
PI y
wood
and V
en
ee
rs
I E
uro
pe
an
Re
mo
va
ls o
f S
aw
log
s,
Ve
ne
er
Lo
gs,
etc
. --
Ap
pa
ren
t D
efi
cit
--
--
5.
Ap
pa
ren
t C
on
su
mp
tio
n o
f O
the
r ln
du
str
ial
Wood P
rod
uc
ts
Eu
rop
ea
n R
em
ova
ls o
f P
ulp
wo
od
, P
itp
rop
s,
Mis
c.
Roundw
ood a
nd R
esid
ue
Tra
ns
fers
Ap
pa
ren
t S
urp
lus
or D
efi
cit
C.
To
tal
Ap
pa
ren
t C
on
su
mp
tio
n
To
tal
Eu
rop
ea
n R
em
ova
ls p
lus R
esid
ue
Tra
ns
fer
Su
rplu
s o
r D
efi
cit
P
No
tes
:
1.
Su
rplu
s i
nd
ica
ted
by
+
De
fic
it i
nd
ica
ted
by -
2.
His
tori
ca
l d
ata
co
ve
rin
g 1
950-6
5
ba
se
d o
n t
hre
e y
ea
r a
ve
rag
es.
3.
Fig
ure
s m
ay n
ot
add d
ue t
o r
ou
nd
ing
.
So
urc
e:
Fo
od
and A
gri
cu
ltu
ral
Org
an
iza
tio
n o
f th
e U
nit
ed
Na
tio
ns,
Un
ite
d N
ati
on
s E
co
no
mic
Co
mm
issio
n
for
Eu
rop
e,
Eu
rop
ea
n T
imb
er
Tre
nd
s a
nd P
r.o
sp
ects
, 1
95
0-1
99Q -
An
in
teri
m R
evie
w,
Geneva,
19
69
.
Ta
ble
II
Ap
pa
ren
t C
on
su
mp
tio
n o
f P
ap
er,
P
ap
erb
oa
rd a
nd
Dis
so
lvin
g P
ulp
,
--
Eu
rop
e
Pa
pe
r,
Pa
pe
rbo
ard
& D
iss
olv
ing
Pu
lp
To
tal
Mil
lio
n
Me
tric
To
ns
Wo
od
pu
l p
Eq
uiv
ale
nt
Mil
l io
n
Me
tric
To
ns
- W
oo
d R
aw
M
ate
ria
l E
qu
iva
len
t M
illi
on
C
ub
ic M
etr
es
No
te:
His
tori
ca
l d
ata
co
ve
rin
g 1
95
0-6
5 b
ase
d o
n t
hre
e y
ea
r a
ve
rag
es.
--
All
In
du
str
ial
Wo
od
Pro
du
cts
W
oo
d R
aw
M
ate
ria
l E
qu
iva
len
t M
ill i
on
C
ub
ic M
etr
es
Pa
pe
r,
Pa
pe
rbo
ard
,9
Dis
so
lvin
g P
ulp
P
rod
uc
ts a
s a
la o
f A
ll In
du
str
ial
Wood
Pro
du
cts
- W
RM
E
C-
.>o
urc
e:
Fo
od
an
d A
gri
cu
ltu
ral
Org
an
iza
tio
n o
f th
e L
!nit
ed
Na
tio
ns,
Un
ite
d N
ati
on
s E
co
no
mic
Co
mm
issio
n
for
Eu
rop
e,
'Eu
rop
ea
n T
imb
er
Tre
nd
s a
nd
Fro
sp
ec
ts,
19
50
-1 9
80
-,A
n
Inte
rim
Re
vie
w,
Ge
ne
va
, 1
96
9.

\
A1 though European forest resources st i l l support, the major
proport ion of domestic wood demands, industr ial wood removals are
steadily fa l l ing behind domestic requirements. The balance between
domestic wood consumption and supply a able 1 1 1 ) has turned from a
surplus of 1 mi l l ion cubic metres (WRME) i n 1950 to a def ic i t of 34
mi l l ion cubic metres i n 1965. By 1980, the def ic i t i s expected to
grow to 67 mi l l ion cubic metres and w i l l account fo r approximately 15 #
6 per cent of Europe's industr ial wood requirements. The greatest
impact of the imbalance wit l be fel t i n the European Economic Community
7 which may be experiencing a def ic i t of 157 mi l l ion cubic metres by 1900.
Greater emphasis on s i lv icu l tura l measures designed to i r l -
crease wood output i n Europe would probably have only a limited e f f e ~ t
on reducing the def ic i t as removals at the intensive margin W O U ! ~ lead
to increased wood costs. Although domestic forest resources i n Europe
a re re lat ive ly close to major markets i t i s doubtful whether Europe
could increase wood costs and s t i I l remain competitive when other areas
of the wor ld already possess surplus soft wood resources o r .environ-
ments suitable f o r producing low cost plantation wood.
One of the largest imbalances i n European wood requirements
stems from the shortage of pulpwood required fo r the manufacture of
paper and paperboard products. Consequently, Europe w i l l be forced

No
rth
ern
Eu
rop
e
'
Eu
rop
ea
n E
co
no
mic
Com
muni t
y
Bri
tis
h I
sle
s
Ce
ntr
al
Eu
rop
e
So
uth
ern
Eu
rop
e
Ea
ste
rn E
uro
pe
Ta
ble
Ill
Ind
us
tria
l W
oo
d B
ala
nce
By
Re
gio
n
Eu
rop
e
(Mil
lio
n C
ub
ic M
etr
es
- W
oo
d R
aw
Ma
teri
al
Eq
uiv
ale
nts
)
Ap
pa
ren
t C
on
su
mp
tio
n
Ro
un
dw
oo
d R
em
ova
ls a
nd
In
du
str
ial
Wood S
urp
lus
or
De
fic
it 1
Woa
19
60
-
85
56
3
21
9
52
-
22
6 -
No
tes:
1.
Eu
rop
ea
n r
eg
ion
al
gro
up
ing
s a
re a
s f
ollo
ws:
No
rth
ern
Eu
rop
e:
De
nm
ark
, F
inla
nd
, Ic
ela
nd
. N
orw
ay.
Sw
ed
en
E
uro
pe
an
Eco
no
mic
Co
mm
un
ity:
Be
lgiu
m-L
uxe
mb
ou
rg,
Fra
nc
e,
Ita
ly,
Ne
the
rla
nd
s,
We
ste
rn G
erm
an
y
Bri
tis
h I
sle
s:
Ire
lan
d,
Un
ite
d K
ing
do
m
Ce
ntr
al
Eu
rop
e:
Au
str
ia,
Sw
itz
erl
an
d,
Yu
go
sla
via
S
ou
the
rn E
uro
pe
: G
ree
ce
, P
ort
ug
al,
S
pa
in,
Tu
rke
y
Ea
ste
rn E
uro
pe
: B
ulg
ari
a,
Cze
ch
oslo
va
kia
, E
as
tern
Ge
rma
ny,
Hu
ng
ary
, P
ola
nd
, R
om
an
ia
Th
e E
uro
pe
an
Eco
no
mic
Co
mm
un
ity r
eg
ion
in
clu
de
s t
he
ori
gin
al
me
mb
er
co
un
trie
s a
nd
exclu
de
s t
he
U
nit
ed
Kin
gd
om
, Ir
ela
nd
and D
erm
ark
.
2.
Su
rplu
s i
nd
ica
ted
by
t
De
fic
it i
nd
ica
ted
by -
3
. H
isto
ric
al
da
ta c
ov
eri
ng
1950-6
5 b
ase
d o
n t
hre
e y
ea
r a
ve
rag
es.
4.
Fig
ure
s m
ay n
ot
add d
ue t
o r
ou
nd
ing
.
Re
sid
ue
Uti
liz
ati
on
So
urc
e:
Fo
od
and A
gri
cu
ltu
ral
Org
an
iza
tio
n o
f th
e U
nit
ed
Na
tio
ns,
Un
ite
d N
ati
on
s E
co
no
mic
Co
mm
issio
n
for
Eu
rop
e,
Eu
rop
ea
n T
imb
er
Tre
nd
s a
nd P
rosp
ects
, 1
95
0-1
98
0 - A
n I
nte
rim
Re
vie
w,
Ge
ne
va
, 1969.

to look beyond i t s borders for i nc~eas ing supplies of wood f ib re i n the
form of pulpwood, pulp, paper, and paperboard products. Th is imbal-
ance wi l I have a marked effect on non-integrated paper producers i n
Western Europe who w i l l have to tu rn to non European sources for an
8 increasing share of their market pulp requirements.
The consumption of paper grade pulp i n Western Europe has
been estimated by the Food and Agr icu l tu ra l Organization to increase
from 26.2 mi l l ion met r ic tons i n 1970 to 52.3 mi l l ion met r ic tons i n 1985 - 9
an increase of over 56 per cent. Pulp producers i n Western Europe
w i l l be unable to meet this demand which wi l l resu l t i n the widening
deficit presented i n the fol lowing table.
Table IV
Net Trade Balance i n Paper Grade Pulp Western Europe
illio ions of Metr ic Tons)
Consumption 33.41 41.77 52.32
Domestic Product ion 31.07 37.59 44.47
Net Trade Def ic i t -2.34 -4.18 -7.85
Source: Food and Agr icul tura l Organization, Outlook for Pulp and Paper Consumption, Production and Trade to 1 985, Advisory Committee on Pulp and Paper, Rome, 1972.

As the gap between paper- grade pu lp consurnptiot? and produe-
tion widens i n Europe, new export opportunities a re ar is ing in other
regions of the wor Id w i th surpi us forest resources o r environments
conducive to plantation product ion.

l!!
FOREST RESOURCE POTENTIAL O F THE AMERICAS
Growing attention i s being paid to regions of the wor ld capable
of supplying European wood requirements. In this chapter, the poten-
t ia l contribution of North and South America i s discussed. The forest
resource base and pulp industry i n each region i s b r ie f l y examined and
a forecast of the consumption and production of pulp i n North and South
America i s presented to provide an indication of export pulp potential.
3.1 North America
North America encloses approximately one f i f th of the wor Id 's
1 forest land. Softwood timber volumes within this region are in the
order of 39.5 b i l l ion cubic metres and represent close to 20 per cent
2 of the wor ld softwood supply. Approximately 8% of the wor ld 's hard-
3 wood timber volumes are also located within this region.
Prospects for increased pulp exports from North America to
European markets are favourable as the forest resource appears to be
capable of supporting a major increase i n domestic consumption whi le
s t i l l yielding a substantial surplus fo r export markets. J.A. Zivnuska
has predicted that the annual harvest from North American forests may
increase from 450 mi l l ion cubic metres i n 1971 to 71 0 mi l l ion cubic
metres i n the next f i f ty years, despite a decline i n the area of produc-
4 t ive timberland. Close to one th i rd of the future harvest would be
5 available for export markets. Th is increase i n harvest would requ i re
that industry adjust to specie mix and location of-avai l
pressure on the resource i s becoming severe i n many
United States. Northern regions of Canada s t i l l re ta i
capacity fo r increased timber production.
able timber as
areas of the
n considerable
The forest industry i n North America i s among the most ad-
vanced i n the world. Close to one half of the wor ld ts production of
pulp and plywood, over 45 per cent of the wor ld 's production of paper
and paperboard and nearly one th i rd of the softwood lumber originates
6 i n Canada and the United States. In addition to surplus forest reserves
and the established forest industry base, factors such as technical
abil i ty, capital, in f rastructural requirements, and pol i t ical stabi l i ty
are present to contribute towards export pulp expansion.
Production of papw grade pulp i n North America increased
from 33.5 mil l ion metr ic tons i n 1960 to 57. 1 mi l l ion metr ic tons i n
7 1972--an average annual increase of 4.5 per cent. According to F A 0
forecasts presented i n Table V, paper grade pulp production i n North
America w i l l reach 90 mi l l ion metr ic tons by 1985. Th is level of

production w i l l resu l t i n an increasing surplus which may amount to
approximately 12 mi l l ion metr ic tons by 1985.
Table V
Net Trade Balance fo r PaperGrade Pulp North America
illio ions of Metr ic Tons)
Product ion
Consumption
Net Trade Surplus
Source: Food and Agr icu l ture Organization, Outlook f o r Faulp 0 Paper Consumption, Production, and Trade to 1985, Advisory Committee on Pulp O Paper, Rome, 1972.
In 1970, Canada and the United States were responsible for 8
close to one half of the wor ld 's export pulp trade. Paper g-ade pulp
exports to Europe i able VI I) increased from 81 4 thousand metr ic tons
i n 1960 to 2.4 mi l l ion metr ic tons in 1970. A s Europe i s current ly the
major export market outside of North America fo r both Canada and the
United States and as demand i n Europe for pulp imports i s growing, i t
i s l ike ly that an increasing volume of North American pulp w i l l be
placed on the European market i n the future.

Table Vi
PaperGrade Pu lp Expor ts United States and Canada
(~housands of Met r ic Tons)
United States
62
399
666
Canada
1,411
1,847
2,140
3,145 3,385 3,554 4,175 4, 9'0 5
4,761 4,832 5,252
Total -
Source:
American Paper Institute, Wood Pu lp Statist ics, 36th Edit ion, New York, 1972.
American Paper Institute, Monthly Stat is t ica l Summary, New York, Volume 51, October 1973.
Canadian Pu lp 0 Paper Association, Reference Tables 1973, 27th Edition, Montreal, 1973.

Tabie VII
Paper Grade Pu lp Exports to Europe From United States and Canada
I
(Thousands of Metr ic Tons)
United States Canada , Total
Sources:
American Paper Institute, 'flood Pu lp Stat ist ics, 37th Edit ion, New York, 1973.
Canadian Pulp & Paper Association, Reference Tables 1973, 27th Edition, Montreal, 1973.
Stat is t ics Canada, Exports by Commodities, Catalogue #65-004, December 1972.
3.2 La t i n Amer ica
Close to one quarter of the wor ld 's natural forest area l ies
within La t i n America; however, only a small percentage of the resource 9
i s commercial l y u t i l ized by the forest industry at present. Less than
one th i rd of the total resource i s classif ied as economically accessible
and only one th i rd of the economically accessible area, o r approxi- 10
mately 120 mi l l ion hectares i s current ly ut i l ized by the forest industry.
In 1969, the La t i n American timber harvest was i n the order of 274
mi l l ion cubic metres wi th only 17 per cent c lassi f ied as industr ial re -
1 1 movals.
Over 95 per cent of the La t i n American forest base i s com-
pr ised of broadleaved species; however, the bulk of the industr ial wood
presently harvested from the natural forests consists of coniferous
12 species. F rom the viewpoint of the pulp industry, one of the major
problems of the La t i n American broadleaved forests l ies i n the wide 13
mixture of species found i n a typical stand. A s the physical and chemi-
cal propert ies of the species vary markedly and as i t i s not usually
possible to obtain a suff icient supply of one o r more species wi th simi-
l a r pulping character ist ics, problems ar ise i n maintaining a uniform
quality of pulp wi th a f i b re supply containing a mixture of species.

With continued research on the pulpabil i ty of mixed tropical
species and the development of new pulping technology, increased 14
ut i l izat ion of these forests may become feasible i n the future. A t
present, expansion w i l l more l ikely be based on l imited areas of natu- '
r a l coniferous forest and rapid ly expand
plantations.
Manmade plantations have contr i
ng hardwood and softwood
buted to industr ial require-
ments far i n excess of their share of the forest area. They have be-
come part icular ly important in many area? below the northern temper-
ate zone which are often poorly endowed i n terms of commercially
usable indigenous forests but possess a favourable c l imate, suitable
land, and inexpensive labour fo r the development of plantations.
Growth rates wi th in the plantations are often f ive to ten times greater
than the northern temperate zone forests where pulp production i s 15
current ly centralized. Not only may plantations be tailormade to suit
the raw material and locational requirements of the user industry but
may also generate many indirect benefits i n the form of soi l conserva-
tion, water f low regulation, w i ld l i fe protection, and increased rec-
reational values.
Plantations i n La t i n America, which pr imar i ly contain pine
and various species of eucalyptus, cover approximately 2.2 mi 1 l ion

16 hectares. Coniferous plantations extending over 865 thousand hectares
11 7 are located predominantly i n Braz l l , Chi le and Argentina. The majori ty
of the hardwood plantations covering nearly 1 . 3 mil l ion hectares are
1 a established i n B raz i I, Argentina, and Uruguay.
The attractiveness of plantations i s sl ight ly diminished by sev-
eral problems associated wi th their growth. Pu re even-aged stands of
one species have been found to be more susceptible to insects, diseases,
and climate. In addition, monoculture may adversely affect soil condi-
tions. Despite these drawbacks, plantations i n La t i n America offer a
means of quickly providing large quantities of low cost industrial round-
wood. Due to the l imited opportunities fo r large scale expansion based
on natural broadleaved forests and the paucity of natural coniferous
forests, plantations w i l l continue to supply a major share of the f ibre
supply for the L a t i n American pulp industry.
The pulp industry i n La t in America i s concentrated i n Brazi l ,
Chile, Argentina, Colombia and Mexico. Pulp production i n this region
increased from 821 thousand metr ic tons i n 1960 to 2.53 mil l ion tons i n 19
1972--an average annual growth ra te of 9.8 per cent. According to
recent forecasts, production of paper g-ade pulp w i l l reach 6.3 mi l l ion
20 metr ic tons by 1985.

In the past, growth of the pulp industry i n La t in American has
not been sufficient to keep abreast of domestic demand. However, wi th
the projected rap id increase i n pulp production to 1985, the F A 0 pre-
dicts a steady reduction i n net import requirements. Supply-demand
projections a re shown i n the fol lowing table.
Table Vlll
Net Trade Balance for PaperGrade Pulp .Latin America
(Mil l ion Metr ic Tons)
Consumption 3.42 4. 60 6.33
Product ion 2.75 - 4.25 6.07
Net Trade Def ic i t -0.67 -0.35 -0.26
Source: Food and Agr icu l ture Organization, Outlook for Pulp and Paper Consumption, Production, and Trade to 198.5, Advisory Committee on Pulp 0 Paper, Rome, 1972.
I t i s unl i
por ter to Europe
region's potential
kely that La t i n Ameri
over the next decade.
for pulp production i
ca w i l l become a major pulp ex-
A t present, development of the
s pr imar i ly directed toward a
goal of self sufficiency centered on import substitution. In addition, a
scarci ty of technical expertise, lack of capital and low level of infra-
structure i n the more outlying areas presently tends to discourage the
development of large production units necessary for entry into export
markets.

I n the future when domestic demands are met and new planta-
tions are established i n areas suited by soi l and climate fo r cheap pro-
duction of f ibre, La t i n America could become a leading pulp exporter.
Fu l l development of this region's potential w i l l l ike ly come at a time
when the remaining surplus reserves i n the northern temperate zone
forests are more fu l ly ut i l ized and wood costs i n the northern region
are r i s i ng due to increased pressure on the resource.
f 'd
THE STUDY AND I T S SETTING
In the course o f analyzing prospects for the export of pulp
from the Americas to European markets, a comparison w i l I be made of
the economics of producing pulp in the major pulp producing regions of
the Americas. The basic framework for the comparative analysis i s in-
troduced in this chapter. Locations of the hypothetical mi l ls are esta-
blished and locational factors for the pulp industry, which form the
basis for regional comparison, are introduced. A b r i e f discussion i s
also presented on economies of scale in the pulp industry followed by
hypothetical mi l l s ize selection and basic operating data.
4. 1 Hypothetical M i l l Locations
F o r this study, the fol lowing locations in Nor th and South
America were selected as representative pulp producing regions:
Case A - Western Canada - Central B r i t i s h Columbia Case B - Eastern Canada - Central Quebec Case C - Southern United States - Georgia Case D - Chi le - Concepcion Region Case E - Braz i l - Sao Paulo Region
The following northern European si te was also selected for
comparative purposes:
Case F - Scandinavia - Southeastern Sweden

The location of each s i te i s shown on Map 1.
4. 2 Locational Factors
Hypothetical m i l l s at the above sites were compared on the
basis o f the fol lowing locational factors which take into account eco-
nomic, social, and pol i t ica l elements:
f ib re supply r-
transportation requirements water supply .. environmental control chemical inputs . energy requirements labour considerations capital - costs and availabil i ty social capital pol i t ical and economic environment
I t was reasoned that no si te would l ike ly prove to be ideal
from the standpoint of a l l factors. However, by balancing the advan-
tages and 'disadvantages of each site in both quantitative and qua1 i ta-
t ive terms, an attempt was made to determine the re lat ive attractiveness
of each si te in terms of export production for the European market.
4.3 Comparative Data
Regional variations in production, transportation, and other
costs provide the major quantitative data for the locational factor
evaluation. Recently pub1 ished cost data was found to be scarce as

Map 1
I fypothetical M i l I Locations

companies and associations generally re f ra in from pub1 ishing the type
of data required for an analysis of this nature. Detailed industry cost
information by region i s not readi ly avai table from government sources
due to confidentiality requirements. Consequently, heavy re1 iance was
placed upon cost data obtained from interview o r correspondence with
forestry, marketing, economic and engineering consultants as we1 l as
major forest product companies.
Cost data was predominantly based upon mi l ls recently studied
o r constructed i n the regions under consideration but modified to suit
the conditions outlined in each case. Although significant cost varia-
tions can occur within regions, the cost f igures are believed to be
reasonably accurate for comparative purposes. A l l cost f igures are
expressed in U. S. do1 lars, unless noted otherwise, and correspond to
pr ice levels prevai l ing in mid 1973,
F o r comparative purposes, i t i s preferable that the mi l Is
under examination be of simi lar size. In order to select a mi l l s ize
that would be compatible at a l l sites, the effects of economies of scale
in the pulp industry should be taken into consideration.

Economies of scale are very pronounced in t he pulp industry.
As mi l l capacities increase, total investment requirements per unit of
output decline markedly. Th is is part icular ly evident in structures,
and plant supporting faci l i ties such as onsi te roads and railways. In
North America, investment costs per dai ly metr ic ton of pulp may de-
crease from approximately $1 60 thousand for a 400 ton per day mi l l to
under $120 thousand per ton of product i n a 800 ton per day mil I . The
approximate investment requirements expressed as a function of mi I I
size under North American cost levels in 1973 are shown i n Chart 2.
Production costs per ton of output also show a marked reduc-
tion with increasing m i l l s ize unt i l a range i s reached where costs de-
cl ine very gradually. In Chart 3 bleached k ra f t pulp production costs
are presented as a function of m i l l size under typlcal North American
conditions in 1973.
The reduction in production costs per ton o f output i s very
pronounced in labour, administrative, and overhead costs. F o r
instance, labour requirements r i s e only moderately with changes in the
size of plant as operators are generally oversears of one o r more
stages of the process regardless of size. By doubling the scale o f a
pulp m i l l from 400 to 800 tons per day, personnel requirements may
1 only increase by 30 per cent.
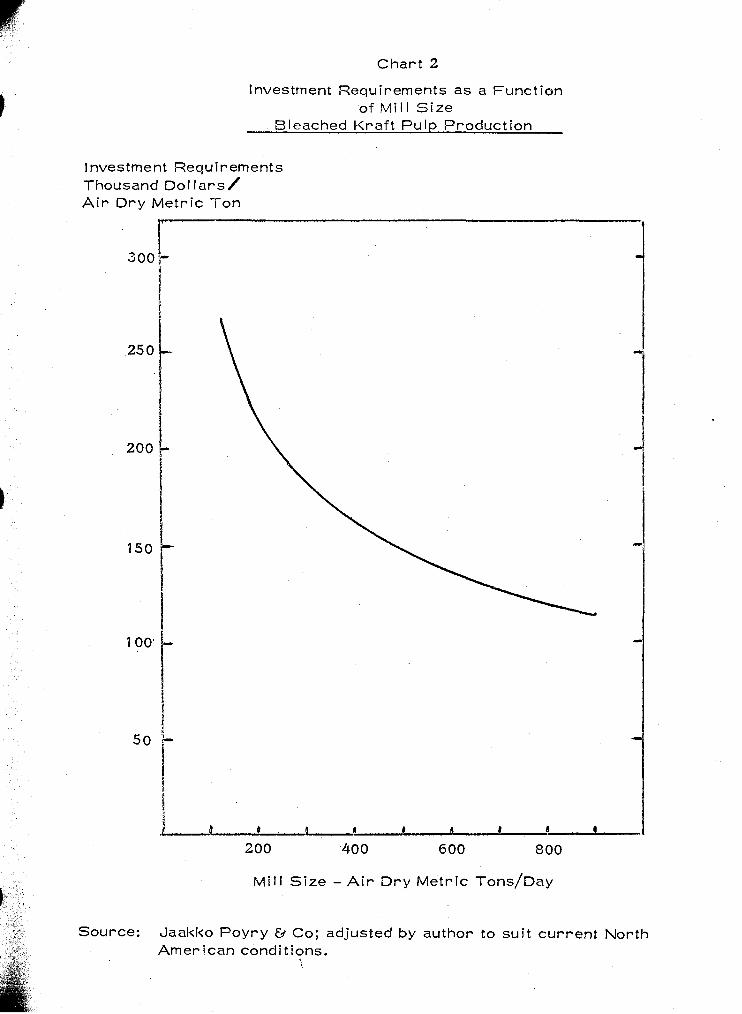
Investment Requirements Thousand DOI ta rs / A i r D r y Metr ic Ton
M i l l S ize - A i r D r y Metr ic ~ o n s / ~ a ~
Source: Jaakko Poyry 0 Co; adjusted by author to suit current North American conditions.
',

m I) a n 0 11 n 8 a 200 400 600 8 00
P r o d u c t i o n - A i r D r y M e t r i c ~ o n s / D a ~
S o u r c e : J a a k k o P o y r y 0 Co. ; a d j u s t e d by a u t h o r t o s u i t c u r r e n t Nor th A m e r i c a n cond i t i ons .

Beyond a cer ta in size of plant, the beneficial effects fr-om
economies of scale may be part ia l ly offset by other factors. F o r
instance, as wood requirements increase with the size o f mi l l , average
haul distances increase which may lead to higher del ivered wood costs.
With larger mil ls, problems may ar ise in obtaining an adequate water
supply and disposing of large quantities of effluent. Moreover, the
arrangement of adequate financing for large m i l I s may be d i f f icu l t
par t icu lar ly i n developing countries.
The relat ionship between mi l l s ize and i t s present and poten-
t ial market must also be considered as the volume o f demand may l imit
the s ize o f the mi l I. In the past, mi l l s were often l imited by the size o f
domestic markets and were seldom able to take fu l l advantage of eco-
nomies of scale. However, wi th increasing international trade in pulp,
markets have expanded considerably al lowing larger plants to be con-
structed.
in the regions under consideration Actual pulp m i l l operations
cover a wide range of sizes. At one extreme in B r i t i sh Columbia the
pulp industry takes ful l advantage o f export markets, abundant timber
supplies, and economies of scale by establishing mi I l s with capacities
up to 1,000 tons per day. On the other hand, mi l Is i n B raz i l and Chi le
generally a re sized at less than 400 tons per day due to a combination

o f factors such as the lack o f basic in f rast ructure, inadequate timber
supplies in close prox imi ty to the m i l Is, f inancing problems, and l imited
access to other than domestic markets.
F o r the purpose o f this study, the hypothetical m i l l s were
sized at 575 m e t r i c tons per day. By cur ren t standards, th is scale o f
operation would be on the small s i ze when compared to recent ly estab-
l ished Nor th American m i l l s and would be considered as ra ther large i n
terms o f South Amer ican mi l l s . However, i t was assumed to be a
reasonable compromise between the wide range o f m i l l s izes in the
areas under examination and could also be considered as a minimum eco-
nomic s ize i n terms o f internat ional competition.
4. 5 M i l l Operations
I t was assumed that the hypothetical m i l l s would u t i l i ze the
k ra f t process which i s commonly used i n the product ion of chemical
pulp today. M i l l design was assumed to be i n accordance wi th modern
technological developments and would incorporate conventional cooking,
washing, screening, bleaching, sheet formation, d r y i n g and chemical
fac i l i t ies. The degree o f mechanization wi th in each m i l l was considered
to be equal.

it-1 al iowiny for major maintenance and holiday shutdowns, p ~ o -
duction calculations were based on 350 operating days a year. Annual
pulp production at each m i l l was assumed to be 200, 000 a i r d r y metr ic
tons. By-products of k ra f t pulping such as turpentine and ta l l o i l were
not taken into account as the
considered to be negl igible.
4.6 Product Market and Pr
I t was assumed that
r impact on the comparative economics was
the total production from each mi 1 1 would
be exported to the port o f Rotterdam. The pulp would be consumed by
paper manufacturers within the European Economic Community.
Pr ices obtained In Europe for pulp from each hypotheticai mi l i
are presented in Table IX. Since each mi l 1's f i b re supply i s based on
different mixes o f wood species which ref lect the character ist ics of a
mi I l l s forest base, each mi l l faces a different p r i ce for pulp landed in
Europe. The pr ices vary according to the qua1 i t ies of pulp produced
from the different specie mixes. F o r instance, a lower p r i ce was
given to pulp produced from pine species in the southern United States
in comparison to pr ices assigned to premium spruce-pine grades from
2 the Northern Temperate Zone forests of Canada and Sweden.

Table !X
Bleached Kra f t Pulp Pr ices Western European Market - C I F Rotterdam
(u. S. Dol l a r s / ~ i r D r y Met r ic Ton)
Producer F i b r e - Pr i ce
Case A - Western Canada spruce, pine $ 230
Case B - Eastern Canada spruce $ 235
Case C - Southern United States pine $ 222
Case D - Chi le pine
Case E - Braz i l eucalyptus $ 222-1
Case F - Southern Sweden spruce, pine $ 2107 $ 235
Source: C. J. Bergendahl & Associates AD., Marketing Consultants; pr ices were adjusted by the author to suit each case.
The pr ices outlined in Table 1X correspond to European mar-
ket pulp p r i ce levels in mid 1973. Throughout the f i r s t half of 1973,
pulp pr ices increased sharply fol lowing a period of depressed pr ices
stemming from a downturn in European economic activity. A s demand
for pulp i s continuing to strengthen, further pr ice increases are ex-
pected dur ing 1973.

v
LOCATI ONAL FACTOR COMPARISON
In this chapter, the hypothetical mi l ls are compared in terms
of the basic locational factors outlined in Chapter IV. The relevance
of each factor to the pulp industry i s discussed p r i o r to the comparison.
5 . 1 F i b r e Supply
The size, quality, and economic accessibil i ty of a f ib re
source' is an extremely significant factor in the location of a pulp mi l l
as i t i s the major cost element in the manufacturing process. In the
production of pulp In the northern temperate zone, wood costs usually 1
range from 40 to 60 per cent of total manufacturing costs. Consequently,
an inexpensive source of f ib re can greatly enhance the competitiveness
of a mi l l . '
In the production of k ra f t pulp large quantities of f ibre are con-
sumed. Between 3.8 and 5.7 cubic metres of wood are required for the
production of a ton o f bleached k ra f t pulp at the mil Is under considera-
tion. A s over one half of thewdght of the wood input becomes waste dur-
ing the k ra f t pulping process, mi l ls are generally located as close as
possible to their wood source.

In many areas o f t h e world, the influence of the raw material
on the location o f a pulp mi l l has declined somewhat due to the increased
ut i l izat ion o f wood chips which may normally be transported at less
cost than roundwood due to their size, shape, and handling character-
2 ist ics. Despite this development, locations in close proximity to the
wood source are s t i l l the normal procedure in pulp mi l l operations and
w i l l probably continue to be i n the future. Consequently, the hypothet-
ical mi l ls under consideration are assumed to be located as close as
possible to their wood sources.
The species util ized, del ivered wood costs, and wood costs
p e r ton of production for each case are presented i n Table X. A b r ie f
outiine of the forest resource base of each of the cases follows.
Case A: B r i t i sh Columbia
t h e central in ter ior forests of B r i t i sh Columbia provide the
f ib re source for Case A representing the Western Canadian pulp indus-
try.
In B r i t i sh Columbia, sixty per cent of the land area i s classi-
fied as forest land which supports close to 7.6 b i I l ion cubic metres of 3
mature timber. Over one ha l f of the Canadian forest resource and 73 4
per cent of the Canadian softwood inventory i s located within this area.

Ta
ble
X
De
liv
ere
d W
ood C
os
ts
-
Ca
se
A.
Bri
tis
h C
olu
mb
ia
B.
Quebec
C.
Ge
org
ia
D.
Ch
ile
E.
Bra
zil
F.
So
uth
ern
Sw
ed
en
sp
ruc
e (
65
%)
Pin
e
(35
%)
Sp
ruc
e
Pin
e
Pin
e
Eu
ca
lyp
tus
Sp
ruc
e (
50
%)
Pin
e
(50
%)
Fo
rm
~o
un
dw
oo
d (45 %
) C
hip
s
(55
%)
Roundw
ood (
85 %
) C
hip
s
(15
%)
Roundw
ood (
80
%
Ch
ips
(2
0%
Roundw
ood
Roundw
ood
Roundw
ood (
80
% )
Ch
ips
(2
0%
)
De
liv
ere
d C
ost
($ U
. S
. /c
ub
ic M
etr
e)
10
.00
5
.50
Fib
re I
~~
U~
/A
DM
T
61.
Kra
ft P
ulp
(C
ub
ic M
etr
es)
So
urc
e:
Co
un
cil o
f P
ulp
an
d P
ap
er
Pro
du
ce
rs o
f Q
uebec,
Th
e C
om
pe
titi
ve
Po
sit
ion
of
the Q
uebec P
ulp
and P
ap
er
Ind
ustr
y,
1972.
Da
ly O C
om
pany L
td.,
T
he
Ca
na
dia
n F
ore
st
Pro
du
cts
In
du
str
y,
1969.
Gil
lig
an
, G
.S.,
It
Ho
pe
O D
es
pa
ir f
or
Ca
na
da
's I
nd
ustr
y, l1
Pu
lp U
Pa
pe
r,
Vo
l.
47
(Ap
ril
1973),
P
art
1,
p.5
1-5
5.
Go
ve
rnm
en
t o
f N
ew
Bru
ns
wic
k,
Re
po
rt o
f th
e I
nd
us
tria
l In
qu
iry
Co
mis
sio
n o
n t
he P
ulp
E*
Pa
pe
r In
du
str
y i
n N
ew
B
runsw
ick,
Fre
de
ric
ton
, 1972.
Ha
ir,
D.,
Ph
elp
s,
R.B
.,
Th
e D
em
and U
Pri
ce
Sit
ua
tio
n f
or
Fo
res
t P
rod
uc
ts 1
972-7
3,
U.S
. D
ep
art
me
nt
of
Ag
ric
ult
ure
, F
ore
st
Se
rvic
e,
1973.
Fib
re C
OS
~/A
DM
T
Bl.
K
raft
Pu
lp
($U
.S.)
Ha
vila
nd
, W
.E.,
T
aka
csy,
N.S
.,
Cape,
E.M
. ,
Tra
de
Lib
era
liz
ati
on
and t
he C
an
ad
ian
Pu
lp a
nd P
ap
er
Ind
ustr
y,
Pri
va
te P
lan
nin
g A
ss
oc
iati
on
of
Canada,
Un
ive
rsit
y o
f T
oro
nto
Pre
ss
, 1968.
Str
ey
ffe
rt,
T.,
i'Jo
rld
Pu
lpw
oo
d,
Sto
ckh
olm
, 1968.
Da
ta f
rom
so
urc
e d
ocum
ents
h
as b
ee
n a
dju
ste
d b
y t
he a
uth
or
to s
uit
ea
ch
case.

Ta
ble
X
De
liv
ere
d W
ood C
os
ts
-
Ca
se
A.
Bri
tis
h C
olu
mb
ia
8.
Quebec
C.
Ge
org
ia
D.
Ch
ile
E.
Bra
zil
F.
So
uth
ern
Sw
ed
en
So
urc
e:
Sp
ecie
Sp
ruc
e (
65
%)
Pin
e
(35
%)
Sp
ruc
e
Pin
e
Pin
e
Eu
ca
lyp
tus
Sp
ruc
e (
50
%)
Pin
e
(50
%)
Roundw
ood (
45
%)
Ch
ips
(5
5%
)
Roundw
ood (
85 %
) C
hip
s
(15
%)
~o
un
dw
oo
d (8
0%
)'
Ch
ips
(2
0%
)
Roundw
ood
Roundw
ood
~o
un
dw
oo
d (8
0%
) C
hip
s
(20
%)
De
liv
ere
d C
ost
($
U.S
. /c
ub
ic
Me
tre
)
Fib
re I
~~
U~
/A
DM
T
Bl.
K
raft
Pu
lp
(Cu
bic
Me
tre
s)
Co
un
cil
of
Pu
lp a
nd
Pa
pe
r P
rod
uc
ers
of
Quebec,
Th
e C
om
pe
titi
ve
Po
sit
ion
of
the Q
uebec P
ulp
and P
ap
er
Ind
ustr
y,
1972.
Da
ly O
Com
pany L
td.,
T
he
Ca
na
dia
n F
ore
st
Pro
du
cts
In
du
str
y,
1969.
Gil
lig
an
, G
. S
.,
"Hope O D
es
pa
ir f
or
Ca
na
da
's In
du
str
y,
I'
Pu
lp E
* P
ap
er,
V
ol.
47
(Ap
ril
1973),
P
art
1,
p. 51-5
5.
Go
ve
rnm
en
t o
f N
ew
Bru
ns
wic
k,
Re
po
rt o
f th
e In
du
str
ial
Inq
uir
y C
om
issio
n o
n t
he P
ulp
O P
ap
er
Ind
ustr
y i
n N
ew
B
run
sw
ick,
Fre
de
ric
ton
, 1972.
Ha
ir,
D.,
P
he
lps,
R.B
.,
Th
e D
em
and E
* P
ric
e S
itu
ati
on
fo
r F
ore
st
Pro
du
cts
1972-7
3,
U.S
. D
ep
art
me
nt
of
Ag
ric
ult
ure
, F
ore
st
Se
rvic
e,
1973.
Ha
vila
nd
, W
. E
.,
Ta
ka
csy,
N.S
.,
Cape,
E.M
. ,
Tra
de
Lib
era
liz
ati
on
and t
he C
an
ad
ian
Pu
lp a
nd P
ap
er
Ind
ustr
y,
Pri
va
te P
lan
nin
g A
ss
oc
iati
on
of
Canada,
Un
ive
rsit
y o
f T
oro
nto
Pre
ss
, 1968.
Str
ey
ffe
rt,
T.,
V
Jo
rld
Pu
lpw
oo
d,
Sto
ckh
olm
, 1968.
Da
ta f
rom
so
urc
e d
ocum
ents
h
as b
ee
n a
dju
ste
d b
y t
he a
uth
or
to s
uit
ea
ch
case.
Fib
re C
OS
~/A
DM
T
BI.
K
raft
Pu
lp
($
US
.)

Principal species in B r i t i sh Columbia include spruce (24O/0), western
hemlock (22q0), balsam fir (18%), lodgepole pine (13%), r ed cedar 5
(1 1 %), and Douglas f i r (7%). Coastal forests a re dominated by hem-
lock while western spruce i s the major species i n the in ter ior forests.
The forest industries of B r i t i sh Columbia ut i l ized only 57 per
cent of the province's potential timber harvest in 1970. Timber re -
movals in 1970 were 55 mil lion cubic metres in comparison to ari e5i:-
6 mated allowable cut of 96 mil l ion cubic metres. On this basis, a con-
siderable increase in timber harvest i s possible part icular ly in the
northern and central regions where the majori ty of forest industry ex-
pansion w i l l take place in the future.
The forests in B r i t i sh Columbia supp!y a rapid ly expsnding
pulp industry as production of pulp increased from 705 thousand metr ic
7 tons i n 1950 to 4. 1 mi l l ion metr ic tons in 1970. Approximately 55 per
cent of the pulp produced in B r i t i sh Columbia in 1970 was exported from
Canada and close to 900 thousand metr ic tons o r 22 per cent was shipped
8 to European markets.
In Case A, white spruce and lodgepole pine were selected as
the representative f ib re furnish. A high quality pulp with character-
ist ics s imi lar to Scandinavian and Eastern Canadian softwood pulps may
be obtained from this specie mix.

In the chemical pulp process, wood input per ton o f puip pro-
duction var ies in re la t ion to specie density. Assuming a specie mix o f
65 per cent white spruce and 35 per cent lodgepole pine, the average
wood density would be approximately 376 ki lograms per cubic metre
(oven d r y green volume). On the basis o f a 43 per cent pulping yield,
5.7 cubic metres of roundwood would be requ i red fo r each a i r d r y 9
metr ic ton of product.
I t was assumed that the f ib re supply fo r Case A would be de-
l ivered in two forms - roundwood and chips. Wood chips would be de-
l ivered to the m i l l from lumber and veneer m i l Is in the immediate area.
The widespread and eff ic ient use o f wood residues in this manner i s one
o f the major factors i n the competitive posit ion o f the B r i t i s h Columbia
pulp industry as residues in the form o f wood chips are generally a
less costhy source o f f i b re than roundwood.
In 1970 close to 55 per cent o f the wood supply fo r pulp produc-
10 t ion in B r i t i s h Columbia was in the form of wood residues. The same
roundwood/chip r a t i o was used in the f i b re supply for Case A.
The cost o f wood chips del ivered to the m i l l s i te was assumed
to be $5.50 per (sol id) cubic metre and del ivered roundwood was
assumed to be $10.00 per cubic metre. With a 45-55 roundwood/chip
mix, the wood cost per a i r d r y metr ic ton o f product was $42.70.

Case B: Quebec, Canada
The forests of central Quebec provide the f ibre source for
Case B representing the Eastern Canadian pulp industry.
Commercial forest covers 42 per cent o f the province of
1 1 Quebec. Approximately 66 thousand hectares of commercial forest a re
12 considered suitable for current timber harvest. The volume of mer-
chantable timber exceeds 3. 7 b i l l ion cubic metres and allowable cut i s
13 estimated to be in the order of 60 mi l l ion cubic metres. As removals i n
1970 were 29 mi l l ion cubic metres o r 48 per cent of the allowable cut
there i s considerable potential for an expanded timber harvest although 14
much of the surplus i s in areas of high cost wood.
Close to 60 per cent o f the industr ial wood harvested in Quebec
i s directed to the pulp and paper industry. In 1970, this industry con-
sumed approximately 18 m i l l ion cubic metres o f roundwood and 3 mi l l ion 15
cubic metres of wood residue. In the same year the industry produced
5.9 mi I I ion metr ic tons of pulp o r 36 per cent o f Canadian pulp produc-
Black spruce was selected for the wood input at the hypothet-
ical pulp mi l I. On the basis of an average wood density of 400 k i lograms
per cubic metre (oven d r y green volume) and a 43 per cent pulping

yield, 5.2 cubic metres o f roundwood would be required for the produc- 17
tion of an a i r d r y metr ic ton of pulp.
The cost of roundwood delivered to this mi I1 was assumed to be
$14.00 per cubic metre. Chips would be delivered to the m i l l for $1 3. 50
per (solid) cubic metre. These wood costs are substantially above
those found in other major pulp producing regions o f North America and
are par t ia l ly a resu l t o f the small s ize of trees, low stocking per acre,
and unfavourable topography and climate.
In 1970, approximately 15 per cent o f the wood supply for pulp 18
production in Quebec was in the form of chips. On the basis of this
chip/roundwood ra t i o and the costs presented in the previous paragraph,
the f ib re cost at Case B was calculated to be $72.40 per a i r d r y metr ic
ron of pulp.
CaseC: Georgia
The pulp industry i n the Southern United States i s represented
by Case C where the f ib re supply i s drawn from the pine forests of
Georgia.
In the southern states, commercial forest land covers 78
19 mi I I ion hectares. Close to 40 per cent of the commercial forest area in

20 the United States l ies within this pegion. Pr inc ipal species include
shortleaf, loblolly, longleaf and slash pine as wel l as white and r e d
oak.
The total growing stock on commercial
2 1 i s approximately 4.6 b i 1 l ion cubic metres. One
stock i s softwood species which have increased
forest land in the south
half o f the growing
in volume- by 20 per 22
cent since 1963 despite the r i s i n g annual-harvest.
growth o f softwood species on southern forest land
153 mi l l ion cubic metres; some 35 per cent greater 23
In 1970, the net
was estimated at
than total softwood
removals. The combined softwood and hardwood net growth o f 244
million cubic metres accounted for near ly one ha l f o f the timber growth * 24
in the United States.
According to recent studies, the southern region has the 25
biological capacity to produce 445 mi l l ion cubic metres annually. Con-
sequently, forest industry expansion appears to be possible in this
area due to the magnitude o f growth over current removals and the
apparent upward trend i n softwood inventories. There are, however,
some pulpwood shortages presently being experienced in a number o f
heavily ut i l ized areas in the South but these appear to be of a short
26 term nature.

The southern forests have supplied a rapid ly expanding pulp
industry over the past twenty years. Pulp production i n this region
rose from 7. 3 mi l l ion metr ic tons in 1950 to 27.4 mil l ion metr ic tons i n 27
1972 -. an annual average growth ra te of 6.2 per cent. In 1972, the
southern region accounted for 65 per cent o f total pulp production i n
28 the United States.
F i b r e furnish for Case C in Georgia was assumed to be a mix-
ture of southern pine species which would produce a lower qua1 i ty pulp
in comparison to the hypothetical mi l Is in Canada based pr imar i ly on
spruce. The average density of the southern pine specie mix was
approxIn?ate!y 450 kl!ograms/cublc metre compared to 376 for the mi l l
in B r i t i sh Columbia and 400 in Quebec. As southern pines a re much
denser than northern conifers, f ib re yield per cubic metre i s signif i-
cantly higher. On the basis of a 43 per cent pulping yield, approxi-
mately 4. 6 cubic metres of wood would be required for each a i r d r y '
29 ton o f product.
The cost o f del ivered wood and chips was assumed to be $9.80
and $8.50 per cubic metre respectively. The cost of roundwood i s con-
siderably lower than the previous case in Quebec due to factors such as
the forest resource being closer to mi l Is, shorter rotations, re lat ively
high yields per hectare, f lat and open terrain, extensive public trans-
30 portat ion networks and a favourable climate.
In 1970, twenty per cent s f the wood input used i n the produc-
tion of pulp i n Georgia, the south's largest pulp producer, was in the 3 1
form of wood residues and the remainder in roundwood. Th is propor-
tion of roundwood to chips i s used in the f i b re supply for Case C. On
the basis of the above ra t io and the wood costs presented in the pre-
vious paragraph, the f ib re cost for Case C was calculated to be $43.90
per metr ic ton of pulp.
Case D: Chi le
The f ib re supply for Case D in Chi le i s assumed to be drawn
from pine plantations located i n the general v ic in i ty of the province of
Maule. Plantations provide the majori ty of the wood supporting the
pulp and paper industry in Chi le as well as in many other Lat in America
countries.
Chi le contains the largest areas of coniferous plantations in
Lat in America. The most prominent species used in the production of
pulp i s insiqnis pine which occupies more than 90 per cent of the 32
400,000 hectares of exotic plantations established i n Chile. The prov-
inces of Maule, Bio-Bio, and Auracuo contain the largest areas of pine
plantations.
Plantation grown insignis pine i s one o f the fastest growing
commercial t rees in the world. Average annual yields from the planta-
tions have been conservatively estimated at 20 cubic metres per hect-
a re and annual growth ra tes as high as 30 cubic metres per hectare
33 have been noted. Under these conditions pulpwood size logs may be
harvested on a 12 to 15 year cyc le whi le sawlogs may be obtained in 25 34
to 30 years. In contrast, up to 60 to 90 years may be requ i red for
mixed sawlog and pulpwood production in the nor thern temperate zone
of Nor th America.
The major i ty o f plantations in Chi le a re pr ivate ly owned. Due
to their widespread success, past administrations supported an ambi-
tious reforestat ion programme wi th the objective o f planting 50 thousand 35
hectares per year. By 1975, the pine plantations were expected to
y ie ld 3.8 mi l l ion cubic metres o f pulpwood annually, however, planting
36 programs are cu r ren t l y fa1 l ing we1 l behind schedule. Long range plans
include the reservat ion of three mi l l ion hectares fo r plantations and i f
these plans come to f ru i t ion the potential annual y ie ld would be in the
37 order o f 54 mi l l ion cubic metres by the year 2050.
Due to the recent heavy increase in the industr ia l use of plan-
tation wood, l i t t l e uncommitted pulpwood i s presently available for new
expansion. However, this appears to be a short term problem and in

the next decade increased cut from plantations should al low for fa i r ly
substantial increases in pulp capacity.
Chi le possesses a we1 l established pulp industry and i s the
only country in South America which i s a net exporter of pulp and
paper. Wood pulp production in Chi le has increased from 102 thousand
metr ic tons i n 1960 to 368 thousand tons in 1970--an average annual
38 increase of 13.7 per cent. in 1972 pulp exports represented 28 per
39 cent of total production. The major markets for sulphate pulp exports
are located i n the L A F T A countries of Argentina, Mexico, Colombia
40 and Peru.
Insignis pine, the f ibre source for Case D, produces a pulp
which i s sl ight ly superior to softwood pulp from the southern United
States but i s generally not as wel l accepted as Scandinavian o r East-
41 ern Canadian softwood pulps. On the basis of an average wood density
of 450 kilograms per cubic metre (oven d r y green volume) and a 43 per
cent pulping yield, 4.7 cubic metres of roundwood would be required
42 for each a i r d r y metr ic ton of pulp. A l l the f i b re supply for the m i l l
was assumed to be in the form of roundwood which i s the common prac-
tice in the Chilean pulp industry.
In developing countries large regional variat ions are often
found in the cost o f del ivered pulpwood which generally can be traced
to inadequate transport systems. in case D, the cost of delivered pulp-
wood was assumed to be $7.60 per cubic metre. Consequently, f ib re
cost per a i r d r y metr ic ton of pulp was in the order o f $35.70.
Case E: B raz i l
The f ib re supply for Case E i n Braz i I was assumed to be
drawn from eucalyptus plantations in the v ic in i ty o f Sao Paulo where
the pulp and paper industry i s hqavily concentrated.
43
Lat in America's largest plantations are found i n Braz i l . They
a re pr imar i ly eucalyptus which was introduced to B raz i l over f i f ty
years ago. At present, the eucalyptus plantations which cover 560
thousand hectares are mainly concentrated in the provinces of Sao 44
Pauio and Minais Gerais.
Eucalyptus plantations have proven to be extremely produc-
t ive in Braz i l . Annual yields of up to 30 to 40 cubic metres per hect-
are on re lat ively poor so i l are not uncommon and a growth harvest 45
cycle of seven to ten years i s possible. A s a resu l t of the high yields
and low cost of land and labour, they are one of the cheapest f ib re
sources i n the wor ld and consequently, the Braz i l ian government i s
46 actively encouraging plantation expansion through f iscal incentives.

Braz i l ' s pulp industry, which i s pr imar i ly dependent upon !cart-
made plantations, i s the largest in La t in America. Production o f pulp
47 in Braz i l reached 1 . 03 mi l l ion metr ic tons i n 1972. Pulp exports total-
48 l ing 139 thousand metr ic tons were only sl ight ly less than imports. As
domestic demands a re nearly met, the Braz i l ian pulp industry w i l l
l ikely become a major Lat in American exporter due to i t s low cost wood
supply and, in time, may prove to be one of the most competitive export
pulp producing areas i n the Americas.
Eucalyptus was selected for the f ib re furnish at Case E due to
i t s re lat ive avai labi l i ty as there i s presently a shortage o f coniferous
species. I t i s we1 I suited for the manufacture o f chemical pulp and i s
k l ! y accepted in internationai markets. Although pulp from most soft-
wood species i s a superior product where strength i s involved due to
i ts longer f ibre lengths, there i s current ly a healthy demand for hard-
wood pulp such as eucalyptus for use in many fine paper grades where
i t tends to enhance sheet formation, opacity, surface smoothness, and
pr int ing properties.
The average density of the eucalyptus furnish was assumed to
be 520 ki lograms per cubic metre (oven d r y green volume). Pulping
yield would be in the order of 46 per cent. On this basis, 3.8 cubic

49 product. The del ivered cost of eucalyptus roundwood to the s i te was
assumed to be $7.40 per cubic metre which would represent a f ib re
cost of $20. 10 per a i r d r y met r ic ton of product.
Case F: Southern Sweden
The f ib re supply fo r
pulp industry was assumed to
western Sweden.
Case F representing the Scandinavian
be drawn from natural forests in south-
Productive forest land i n Sweden covers 23. 5 mi l l ion hectares
50 and the growing stock exceeds 2.3 b i l l ion cubic metres. Forests in
this region a re re lat ive ly slow growing. Annual growth rates range
from one to three cubic metres per hectare in the far nor thern regions
51 to s i x to eight cubic metres pet- hectare in the southernmost regions.
Annual cut in Sweden was in excess of 70 mi l l ion cubic metres 52
in 1972. According to recent studies, annual growth i s reported to be 53
in the order of 78 mi l l ion cubic metres. On this basis there appears to
be limited room for expansion in Swedish pulp production. In many
areas o f Sweden pulpwood supply i s already l imit ing industry expansion.
Swedish forest resources support a pulp industry which i s the
fourth largest in the wor ld and the major pulp exporter i n Western
Europe. I n 1972, Sweden produced close to 8.3 mi l l ion met r ic tons of

54 pulp of which 45 per cent was exported. The major i ty o f t h e export
pulp was consumed in the United Kingdom, France and Western
55 Germany.
The major species in Sweden's forests are spruce (45%), 56
pine (40%), and b i r ch ( 1 1 %). Spruce and pine were selected as the
f ibre furnish at Case F. On the basis o f a 50-50 specie mix, the aver-
age density of the furnish would be approximately 385 k i lograms per
cubic metre (oven d r y green volume). Assuming a 43 per cent pulping
yield, 5.4 cubic metres o f wood input would be requ i red for each a i r
57 d r y metr ic ton o f pulp.
Approximately 20 per cent of the f i b re supply for the Swedish
pulp industry i s i n the form of chips from wood processing plants and
the same roundwood chip r a t i o was used for the f i b re furnish at the 58
hypothetical m i l I.
Sweden has the highest wood costs of the si tes under consid-
eration pr imar i ly as a resu l t o f industr ial pressure on the resource.
Del ivered wood costs at Case F were assumed to be $16.50 per cubic
metre o f roundwood and $16.00 per (solid)cubic metre o f wood chips.
On this basis, the cost o f f ib re supply per met r ic ton o f product was

5. 2 Transportat ion Requirements
Transportation costs are an important and often decisive
factor in locational analysis. Th is i s part icular ly true in the pulp in-
dustry where freight costs represent a major share of total costs and
play an important r o l e in determining the re la t ive competitiveness of
mil ls.
In the pulp industry, considerable tonnage of raw materials
and products a re transported to and from the mi l I. A m i l l producing
500 tons of pulp per day may experience daily transport tonnages in ex-
cess of 2 thousand tons. Consequently, there i s a close relationship
between the development of a pulp industry and the state o f a region's
transportation infrastructure. In developing countries, the lack of
adequate transportation faci l i t ies close to a f i b re source has often
ru led out the establishment of a m i l l which could otherwise be competi-
tive.
The following three major categories o f transportation must
be considered in the location of a pulp industry:
1 ) F i b r e supply from point o f or ig in to m i l l
2) Conversion inputs (other than f ib re supply) from point o f or ig in to m i l l
3) Product from mi l I to market

The f i r s t category, the cost of transport ing the f lbre supply
to the mi l I, normal ly overr ides al i other transportation costs and
tends to draw m i l l s toward their f ib re source. M i l l s considered in
this study were assumed to be central ly located in terms o f their pulp-
wood supply i n o rder to minimize this cost.
Table XI provides a rough estimate o f the cost o f transport-
ing pulpwood from forest to m i l l at the si tes under consideration.
These costs range between $2.00 and $3.30 per cubic metre. A t the
,northern si tes A, 8, and F, the costs o f transport ing pulpwood fa1 I
within a close range o f $2.90 to $3.00 per cubic metre. At Case C
in Georgia, the cost was assumed to be only $2.00 per cubic metre due
to the re la t ive ly f lat and open ter ra in and extensive road networks.
Cases D and E in Lat in America were assumed to have
shorter haul distances than other sites as a smal l e r pulpwood supply
area i s required from plantations with high yields per hectare. How-
ever, benefits stemming from the smal l e r supply areas a re usually
par t ia l ly offset i n developing areas by inadequate transportation net-
works and methods. Consequently, pulpwood transportation costs to
mi l l sites in B raz i l and Chi le were assumed to be $3.20 and $3.30 per
cubic metre. These costs represented 43 per cent of the total del ivered
wood costs.

Table XI
Transportation Component of Del ivered Wood Costs
Case
A - B r i t i sh Columbia
B - Quebec
C - Georgi a
D - Chi le
E - Braz i l
I
F - Southern Sweden
L
Delivered Wood Cost
( $ u.s./ mbic metre)
Component Component as a percentage of Del ivered Wood
Source:
Council of Pulp and Paper Producers of Quebec, The Competitive Posi- t ion of the Quebec Pulp and Paper Industry, 1972.
Daly 0 Company Ltd., The Canadian Forest Products Industry, 1969.
Streyf fer t , T. , '~Vorld Pulpwood, Stockholm, 1968.
Data from source documents was adjusted by the author to suit each case.

The second category of tpansportation costs covering the
transport of other inputs such as chemicals and fuel i s normally of
minor importance when compared to the costs of transporting round-
wood and the finished product. The influence of this category on loca-
tion i s sl ight in North America and Scandinavia. I t s significance in-
creases considerably in less developed areas of La t in America where
transportation networks a re often deficient and inputs are general ly
transported over longer distances. A t sites in B raz i l and Chile, pro-
duction costs per ton of pulp may increase by as much as s i x do l la rs
over North American sites as a resul t of higher transportation costs in
this category alone.
The th i rd category of transportation cost covering the trans-
port of pulp to market represents a substantial share of total product
cost. According to Canadian Pulp and Paper Association estimates,
320 mi l l ion do1 la rs were expended on transporting Canadian pulp and 59
paper products to their markets in 1965. Th is outlay represented an
average transport cost of $21.90 per ton of pulp and paper.
Advancements in pulp transportation methods a re influencing
the competitive structure of the pulp industry by reducing long distance
transportation costs. Innovations such as specialized bulk ca r r i e r s
and sophisticated cargo handling techniques have increased the potential

market areas of many existIncj mi ! ls and created opportunities f u ~ nevL
sites.
Product transportation costs for the si tes under consideration
are presented in Table XI!. F o r comparative purposes, the costs of
transporting pulp to market are separated into two components:
a) inland freight cost
b) ocean freight cost
Inland freight covers the cost o f transport ing pulp from each
mi l l s i te to the nearest ocean transshipment point. Ocean freight i s
based on the cost o f shipping pulp from the transshipment point to the
port of Rotterdam. These costs are based upon conventional methods
of transporting pulp and do not ful l y re f lec t the cost reductions result-
ing from more specialized forms of transportation.
An adequate water supply i n terms of both quantity and quality
i s essential in the manufacture o f pulp and consequently i s a c r i t i ca l
determinant of location. In terms o f quantity, the 575 ton per day
bleached k ra f t pulp m i l l s presented in this study would requ i re a water
60 supply of approximately 24.7 mi l l ion gal Ions per day.

Table XI!
Product Transportat ion Costs Mi l ls i te to Rotterdam
(u. S. ~ o l l a r s / ~ D ~ ~ pulp)
Case
A - B r i t i sh Columbia
B - Quebec
C - Georgia
D - Chi le
F - Southern Sweden
Ocean Trans-shipmen t
Point
Van couver B. C.
T r o i s R iv ie res P. a.
Savannah Georgia
Concepcion Chi le
Santos Braz i I
Karlshamn Sweden
-- -
In land Freight
Cost d Ocean
Fre ight Cost !?/
Mi l l s i te to trans-shipment point. Trans-shipment point to Rotterdam.
Note: Fre ight costs include insurance, wharfage and handling charges.
Source:
Daly 0 Company Ltd. , The Canadian Forest Products Industry, 1969. Government of B r i t i s h Columbia, B r i t i sh Columbia Fabricated Forest Products Exports, 1970. , Victor ia, Department of Industrial Develop- ment, Trade &+ Commerce, 1971.
Report of the lndustr ial Inquiry Commission on the Pulp and Paper Industry i n New Brunswick, Fredericton, 1972.
Streyf fer t , T. , Wor Id Pulpwood, Stockholm, 1968.
Interviews wi th personnel i n transportation departments of forest product companies.
Data from source documents and interviews was adjusted by the author to suit each case.
Qualitative water requirements vary according to intended
use. Process water must be of high quality to conform with s t r ic t
standards covering colour, suspended solids, dissolved minerals, and
organic matter. Boi l e r feedwater requirements are extremely demand-
ing i n order to reduce suspended matter and prevent caustic embri ttle-
ment, corrosion, and scale formation. Cool ing water requirements are
also quite r i g i d as corrosion and the accumulation of scale, sediment,
and organic growths must be minimized. In order to meet these re -
quirements, water treatment plants are often installed to upgrade the
quality of a local water source.
All sites i n the study were assumed to be located adjacent to a
around o r surface water supp!y whrch was adequate in quantitative - terms. I t was also assumed that water treatment plants would be re-
qu i r ed at each s i te and approximately 1. 5 mi I1 ion do l la rs was included
in the capital costs for cases A, B and F in Nor th America and
Sweden to cover expenditures on water treatment and pumphouse facil-
6 1 i t ies. Capital expenditures for simi lar fac i l i t ies at cases D and E in
Chi le and Braz i I were assumed to be 1.8 and 1.7 mi l l ion do1 la rs respec-
tively.

5.4 Environmental Control
Effluent control and a i r pollution abatement regulations vary
between locations. In order to conform with these regulations, f i rms
must incur substantial capital and operating costs which can have a
marked effect on the economics of pulp manufacture. As concern with
environmental pollution increases, more str ingent standards are being
imposed which are becoming progressively more costly to meet.
In the major i ty of cases reasonable standards have been set
after consideration has been given to the balance between costs and
benefits within the overal l framework of social and economic goals.
Occasionally the pol i t ica l popularity of environmental control has
culminated in excessively stringent standards where costs of conform-
ing to the standards have greatly weakened a locaiion's competitive
advantage. In some cases, potential locations have been ru led out 62
ent irely on the grounds of protecting the local environment.
In the past, the pulp and paper industry has been one of the
major sources o f stream pol lution; however, the industry has recently
car r ied out intensive research and incurred large expenditures on
6 3 pollution control measures. In the industr ial ized countries, pr imary
treatment systems to remove suspended sol ids from the effluent by
gravitational sett l ing a re normally required to meet basic
and the use of secondary treatment systems incorporating
standards
nutr ient

addition, activated sludge hanc Aling fac i l i ties, and aeration lagoon faci !-
i t ies a re becoming increasingly common due to more stringent standards.
In some cases, ter t ia ry treatment systems are also installed in order to
correct undesirable effects such as colour i n effluent discharge.
Table X l l l presents a rough estimate of capital costs required
for effluent control faci l i t ies satisfying current regulations in the areas
under consideration.
Case A
B
C
D
E
F
Source:
Table X l l l
Eff luent Control Systems Capital Costs
illio ions of Dol lars)
B r i t i sh Columbia 4.0
Quebec 4.0
Georgia 3.8
Chi le 1.0
Braz i l 1.4
Southern Sweden 4. 2
Food and Agr icu l ture Organization, B r i e f Note on Effluent Treatment and Disposal Fac i l i t ies i n the Pulp G, Paper Industry, Document # 5 . 2 , Rome, F A 0 Advisory Committee on Pulp 0 Paper, 1968;
Julson, J. A. , IIEnvironmental 'Protection - How Much W i l l I t Cost Your M i l l ?I1 Pulp G, Paper Volume 43 (Apr i l 1 969), p. 1 52;
Organization for Economic Cooperat ion and Development, Advanced Pollution Abatement Technology in the Pulp G, Paper Industry, Paris, Environmen't Directorate, 1 972;
Interviews with engineering consultants specializing i n the pulp G, paper industry, and forest industry personnel ;
Estimates from source documents have been adjusted by the author to suit each case.

As the costs of effluent control fac i l i t ies a re strongly depen-
dent upon local conditions such as the character ist ics o f the receiving
stream, systems must be tai lormade for each mil l . Consequently, the
capital costs indicated above are only general indications o f current
costs i n each region.
Water pollution regulations for mi l Is located i n the more in-
dustr ial ized countries are, in general, f a i r l y stringent and are re -
flected i n the re la t ive ly higher costs o f fac i l i t ies at cases A, B, D,
and F. A s requirements at cases D and E in Chi le and B raz i l a re mini-
mal, expenditures on pol lution control faci l i t ies were assumed to be
light. In the future, more sophisticated faci l i t ies w i l l be required at
cases D and E as public opinion in the developing countries w i l l not
l ikely remain indifferent to the quality of the environment. At present,
industrial development appears to be of greater concern than environ-
mental considerations.
A i r pollution regulations governing the nature and amount o f
pollutants discharged into the atmosphere also vary between locations.
In the case of k ra f t pulp mills, a i r pollution stems from both gaseous
emissions and particulates.
he most c r i t i ca l a i r pollution problem associated with the
kra f t process i s the emission of highly odiferous compounds from
gaseous effluents. These odours created by the emission o f hydrogen

~ l p h i d e and mercaptans are detecrable at very low concentrations and
are extremely d i f f icu l t to control. As the odour threshold of these
gases i s in the order of f ive parts per b i l lion, the emission of even
64 smal I quantities can seriously affect community relations.
Capital outlays incurred in conforming to a i r pollution regu-
lations are current ly lower than the costs o f meeting water standards.
Table XIV presents capital cost estimates for a i r pol lution abatement
systems considered adequate for the sites under consider at ion.
Table XIV
Ai r Pol lution Abatement Systems Capital Costs
( ~ i I lions of Dol lars)
Case A Br i t i sh Columbia 1.3
B Quebec 1.3
C Georgia 1.2
D Chi le 0.5
E Braz i l 0.7
F Southern Sweden 7.5
Source:
Julson, J. O., ftEnvironmental Protection - How Much W i I l I t Cost Your M i l l ? " Pulp &Paper VoI.43 (Apr i l 1969), p. 152;
Organization for Economic Cooperat ion and Development, Advanced Pollution Abatement Technology in the Pulp & Paper Industry, Paris, Environment Directorate, 1 972;
Interviews with pulp m i l l engineering consultants and forest industry personnel;
Estimates from source documents and interviews were adjusted by the author to suit each case.
The above estimates are very rough since a i r pollutiort contt.01
costs depend heavily upon the location o f each s i te in relat ion to local
topography, prevai l ing winds, cl imatic conditions, and local land use.
As a i r pollution abatement requirements i n the tradit ional pulp
procuding areas of industrial ized countries a re fa i r l y s t r ic t , expendi-
tures on abatement systems at cases A, 6, C, and F were re lat ively
high. On the other hand, i t was assumed that a i r pollution abatement
requirements at cases D and E in Chi le and Braz i
previous sites which accounts for the modest capi
I were less than the
tat expenditures.
5 . 5 chem.ical Requirements
Large quantities of chemicais a re required in the production
of bleached k ra f t pulp and, as market demand i s strengthening for
grades of pulp of higher brightness, the consumption of bleaching
chemicals in the process w i l I l ikely increase. As the cost o f chemical
inputs represents a significant share of operating costs, variances i n
del ivered chemical costs between sites may influence the locational
decision.
In the bleached kra f t process, at least 150 kilograms o f chem-
icals a re consumed in the production o f a metr ic, ton o f pulp. The pr in-
cipal chemicals used and quantities consumed in the process are pre-
sented in Table XV. Chemicals required for effluent disposal, boi ler
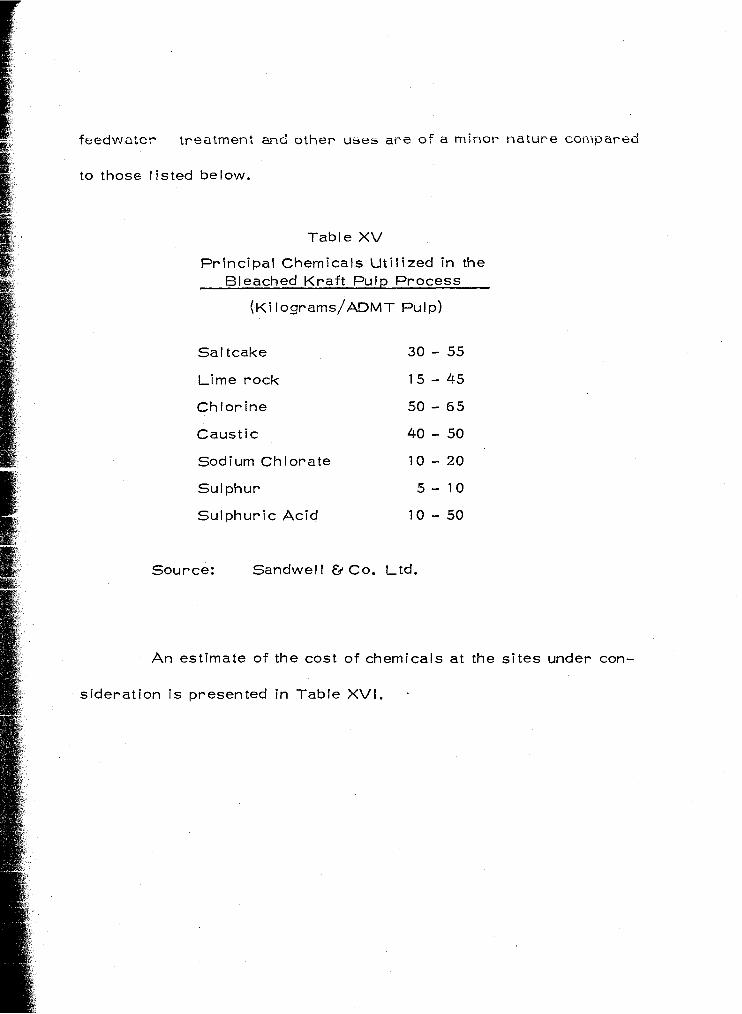
f e e d w a t e r t r e a t m e n t and other uses ape of a m i n o r n a t u r e corilpared
to those l isted below.
Table XV
Pr inc ipa l Chemicals Ut i l ized i n the Bleached Kra f t Pulp Process
( ~ i I O ~ ~ ~ ~ S / A D M T pulp)
SaI tcake 30 - 55 Lime rock 1 5 - 45
Chlor ine 50 - 65
Caustic 40 - 50
Sodium Chlorate 10 - 20
SuI phur 5 - 10
Sulphuric Acid 1 0 - 50
Source: Sandwel l & Co. Ltd.
An estimate of the cost of chemicals at the si tes under con-
sideration i s presented in Table XVI. .

Tabie XVI
Chemical c o s t s
(u. S. Dol I ~ ~ S / A D M T Bleached K ra f t Pulp)
Case A B r i t i sh Columbia 17.00
B Quebec 17.00
C Georgia 17.00
D Chi le 24.00
E B raz i I 22.00
F Southern Sweden 17.50
Source:
Daly &+ Company Ltd. , The Canadian Forest Products Industry, 1 969.
Estimates from F. L.C. Reed and Associates Ltd., Consult ing Economists ;
Data from source documents and interviews were adjusted by the author to suit each case.
Chemical costs were assumed to be the same at the sites in
Nor th America which are a l l located in major pulp producing regions.
Costs were s l ight ly higher i n Southern Sweden.
At the si tes in B raz i l and Chile, chemical costs were
assumed to be at least f ive do1 la rs greater than in Nor th America. The
higher costs at these si tes were mainly attr ibutable to increased chemi-
cal t ransport charges. The economics of establishing onsite chemical
producing fac i l i t ies for the production o f bleaching chemicals such as
chlorine at the si tes i n La t in America were not examined although this
i s often a pract ica l al ternat ive when chemical costs a re high.

5 . 5 Energy ReqzI rements
Energy costs may have an influence on the locational decision
although the avai labi l i ty o f a number of al ternat ive sources tends to
minimize cost d i f ferent ia ls between sites. F o r example, fuel types
such as coal, oi l , o r natural gas may be substituted in accordance with
thei r avai labi l i ty and re lat ive cost. In areas where energy costs a re
re lat ive ly high, process design may also be modified to provide more
favourable heat and power economies at the expense o f higher capital
costs.
F o r comparative purposes, energy requirements w i l l be dealt
with under the fol lowing two categories:
a) purchased e lec t r ic power requirements
b) purchased fuel requirements
a) Purchased E lec t r i c Power Requirements
E lec t r i c power requirements at a l l s i tes would be in the order
o f 700 kwh per ton o f product. A t Case A in B r i t i sh Columbia, power
could be purchased from the publ ic u t i l i t y for approximately 6.0 mi l IS/
65 kwh. A t this r a te i t i s more economical to purchase e lec t r ic power
rather than instal l ing onsite power generation faci l i t ies. Consequently,
the cost of purchased power would be approximately $4.20 per ton of
product.

The cost o f purchased power at si tes in Quebec, Georgia, and
66 Southern Sweden would range between 6. 5 to 8.0 m i l ls/kwh. I n this
range, the economics of purchasing power o r generating onsite power
would be quite simi lar. F o r the purpose o f this a
assumed that onsite generating fac i l i t ies would be
6 7 nat ive. Capital costs incur red i n the instal lation
6 8 would be in the order o f 3. 0 m i l l ion do1 lars. Add
~a lys is , i t was
the pre fer red a l ter-
of such fac i l i t ies
tional fuel require-
ments for onsi te power generation a re accounted for i n the fol lowing
sect ion.
A t the sites in B raz i l and Chi le purchased e lec t r ic power
69 would be i n the order o f 10 to 15 mi l ls/kwh. With these rates e lec t r ic
power would be more economically generated on s i te ra ther than pur-
chased from a public ut i l i ty. Capitai expenditures on power generation
fac i l i t ies at these si tes would be approximately 3.5 mi l l ion dollars.
b) Purchased Fue l Requirements
In the chemical pulp process, the main source o f fuel for the
generation o f steam is spent cooking l iquor which contains used chemi-
cals as wel l as l ignin and other constituents dissolved from the wood
material. Bark and other residues from the wood input also supply a
portion of the total fuel requirements. Additional fuel must be purchased
to make up the balance of the fuel requirements.
Two simpl i f ied heat balances which indicate heat demands in
re lat ion to sources o f supply are presented in Table XVII. Balance A
outlines purchased fuel requirements for the hypothetical m i l l i n
B r i t i sh Columbia which was assumed to purchase e lec t r ic power from a
70 public ut i l i ty. Balance B may be applied to the hypothetical mi l l s which
generate onsi te e lec t r ic power.
I n actual pract ice heat balances would d i f fe r for each mi l I .
F o r instance, heat losses would be less at m i l l s i n mi lder climates and
the ca lo r i f i c value o f hog fuel would vary between si tes in accordance
to specie mix. However, for the purposes o f this study, heat balances
allowing for purchased o r onsite generated e lec t r ic power were con-
sIdered to be suff iciently accurate.
At Case A in B r i t i sh Columbia, heat requirements from pur-
chased fuel would be in the order o f 73,700 ~ ~ a l / h r . The most eco-
nomical fuel at this s i te would be natural gas purchased at approximately
7 1 $O.48/~cf . On the basis of an hourly demand of 266 Mcf, the cost o f
72 purchased fuel would be approximately $5.40 per ton of pulp.
Heat requirements from purchased fuel at cases 6, C and F in
Quebec, Georgia, and Sweden total led 85, 500 ~ ~ a l / h r . The higher
requirements at these si tes in comparison to Case A was attr ibutable
to onsi te power generation facil i t ies. Oi l purchased at approximately

Tab! e XVI I
Heat Balances and Purchased Fuel Requirements
Balance A Balance B
Purchased Onsite Power Power Generat ion
Heat - ~ ~ a l / h r .
Demand:
for process power generat ion
Supply :
from recovery boi le r power boi ler bark
Purchased Fue i Requirements - ~ ~ a l / h r .
To power boi l e r 58,200 70,000 To k i l n 1 5, 500 1 5, 500
73,700 85, 500
Note: power bo i le r eff iciency i s assumed to be 85 per cent.
Source:
Marsh, R., !tShould Your New M i l l Generate E lec t r i c Power, 11 Pulp and Paper, Vol . 43 ( ~ u n e l969), p. 78.
Nasman, R., !!Heat and Power Economy i n Pulp and Paper M i l l s i n Developing Countries, Pu lp and Paper Development i n A f r i c a and the Near East, Rome, Vol. 3, p. 1 1 17-1 140.
Robb, G.A., "Energy Supply and U t i l i ra t ion - Cost Reduction, Con- servation, Pulp and Paper Magazine of Canada, Vol. 74 No. C arch 1973), p. 82.
Estimates from H. A. Simons (~nternat ional) Ltd., Consult ing Engi- neers.
Data from source documents and interviews was adjusted by the author to suit each case.

$5.25/bbl was considered to be the most economics! fuel !r! these
73 regions. With a demand o f 54 bbls. /hr. the fuel cost per ton o f pulp at
74 these si tes would be in the order o f $1 1.90.
Heat requirements at cases D and E in Ch i le and B raz i l were
also 8 5 , 500 ~ ~ a l / h r . The most economical fuel at these si tes would
be o i l del ivered fo r approximately $5. 50/bbl. in Chi le and $5. 25 in
Braz i l . Based on an hour ly requirement o f 54 bbls., fuel cost per ton
o f pulp would be approximately $12. 50 at the s i te in Chi le and $1 1.90
in Braz i l .
5. 7 Labour Considerations
The locational decision i s influenced by geographical var ia-
tions in labour supply, sk i I l levels, remuneration, legislation and
labour management attitudes.
Technological advances have substanti a1 ly reduced the number
o f staff requi red in a pulp m i l l operation. I n the United States, the
number o f production workers in the industry increased by less than
eight per cent between 1947 and 1960 whi le product iv i ty per worker
75 rose by close to 60 per cent. A t present, a modern 575 ton per day
pulp m i l l located in Nor th Amer ica would requ i re approximately 275
employees o f which 55 would be classi f ied as salar ied staff, 65 as
76 maintenance staff, and 155 as operat ing personnel.

,Ithough labour requirements are re lat ively modest in terms
of the actual number of employees, a high level of technical and profes-
sional sk i l l s a re required due to the complexity of operations. I f an
area did not possess a suitable labour force, compensatory incentives
to attract sk i l led labour and costly training programmes to upgrade the
indigenous labour force would have to be considered.
The estimated cost of wages and fr inge benefits at the loca-
tions under consideration are presented i n the fol lowing table.
Table XVlll
Wages and Fr inge Benefits
(u. S. Dol I ~ ~ S / A D M T Bleached K ra f t pulp)
C a s e A Br i t i shColumbia
B Quebec
C Georgia
D Chi le
E Braz i I
F Southern Sweden
Source:
Daly & Company Ltd. , The Canadian Forest Products Industry, 1969.
Sowers, L. J., f fLabour Costs Abroad," Paper presented at the Ameri- can Association of Cost Engineers annual meeting, Los Angeles, 1965.
Stat ist ics Canada, Employment, Earninqs and Hours, Catalogue #72-002.
Streyffert , T. , World Pulpwood, Stockholm, Almquist and Wiksell, 1968.
U. S. Department of Labour, Employment and Earnings, Bul let i n 1 370-9, Bureau of Labour Stat ist ics.
Estimates from F. L. C. Reed and Associates Ltd., Consult ing Economists.
Data from source documents were adjusted by the author to suit each case.

Sites i n North America and Sweden are iocated In we1 t estabz
lished pulp producing areas where a sufficient supply of ski l led labour
and managerial personnel a re available. Labour costs at these loca-
tions were highest at Case A i n B r i t i sh Columbia and lowest at Case F
in Sweden. Differences in labour legislation and labour management
attitudes exist but these were not considered to be significant for the
purpose o f this study.
An adequate pool of operating personnel and managerial staff
would not l ike ly be available at cases D and E in Chi le and Brazi l .
This i s common i n developing countries where economic and industrial
expansion i s often handicapped by a paucity of professional and techni-
cal &!!is. i t was assumed, therefore, that many of the key operating
positions at these si tes wo?rld be f i l led by foreign staff attracted to the
area by compensatory benefits. Sufficient indigenous unski l led labour
would be avai lable but t ra in ing programmes would be required to up-
grade basic ski1 Is.
A s pulp mi l Is in La t i n America are generally overstaffed, i t
,was assumed that the hypothetical mi l Is in B raz i l and Chi le would have
twenty per cent more staff than their counterparts i n North America and
77 Sweden. Wages and fringe benefits at these mi l Is were estimated to be
approximately $ 1 1.50 per ton of product.

5.8 lnvestment Capital - Costs and Avai labi l i ty
Geographic location has a distinct influence on a mi l l ' s capi-
tal requirements. F o r instance, regional variat ions i n the cost and
productivity of construct ion labour are ref lected in investment costs
as approximately one th i rd of the d i rect costs of structures and equip-
78 ment are attr ibutable to construction labour and related overheads.
Other factors such as climate and earthquake zoning d i rec t ly affect the
design of structures and hence capital costs. I n addition, the cost of
land for a mil ls i te may vary signif icantly between locations.
In remote areas, onsite costs of equipment and materials are
higher due to increased trarsportat ion costs. Construction camps may
be a necessity and premium time allowances may also be required to
attract a suitable construction labour force. lnvestment costs are in-
creased further in isolated locations where extensive maintenance
shops and spare par t inventories are required. Moreover, costs of
materials and equipment may be signif icantly higher in developing
countries i f import duties are levied on such items.
An assessment o f capital requirements for the hypothetical
mi l ls i s presented in Table XIX. The lowest capital investment


generation fac i l i t ies were not reqolred. Capital costs at Case C in
Georgia were less than Case B i n Quebec due to lower equipment costs
and reduced requirements for housing equipment in a milder climate.
As the hypothetical mi l Is in the northern hemisphere were assumed to
be located in close proximity to fa i r ly well established communities, no
additional expenditures would be required for construction camps and
long term communi ty developments.
Capital investment at cases 5 and E in Chi le and B raz i l was
considerably higher than other sites despite lower expenditures on
effluent control and a i r pol lut ion abatement systems. The additional
i nvestment required at these sites was pr imar i ly attr ibutable to higher
onsite cost s of equipment and materials, expenditures on community
79 services, and increased working capital requirements. With the ex-
ception o f cost sharing on basic community services, i t was assumed
that a l l fac i l i t ies external to the plant sites such as roads and rai lways
would be provided from public funds.
The cost o f capital seldom varies signif icantly within indus-
t r ia l ized countries when s imi lar pulp m i l l projects are compared. When
considered i n terms of pro jects i n both developed and developing countries
the cost of capital does take on a degree o f geographical expression.
F o r instance, interest rates are generally higher in a country where

capital i s scarce, the stabi l i ty of the government Is ir! question, and
social and economic conditions are unfavourabl e.
In many developing countries capi tal markets are poorly de-
veloped and the l imi ted avai labi l i ty of pr ivate domestic capital can be-
come an obstacle to industr ial development. F o r example, pr ivate loan
50 rates in B raz i l generally range between 25 to 40 per cent. However,
for projects of fer ing sound investment opportunities, re lat ively low
interest and long term loans are often available from international
agencies such as the International Finance Corporat ion and various
regional development banks.
The interest rate on borrowed capital for the hypothetical
mi l ls in the northern hemisphere was assumed to be nine per cent. A t
the sites i n Chi le and B raz i l the interest ra te was 7. 5 per cent. The
latter ra te was based on interest charges on loans to developing
countries by international financing agencies and, consequently, was
lower than current market rates in more highly industr ial ized countries.
5 . 9 Social Capital
The social capital factor expresses the re la t ive attractiveness
i- i of a location from the standpoint o f the m i l l ' s personnel. Considera- 4
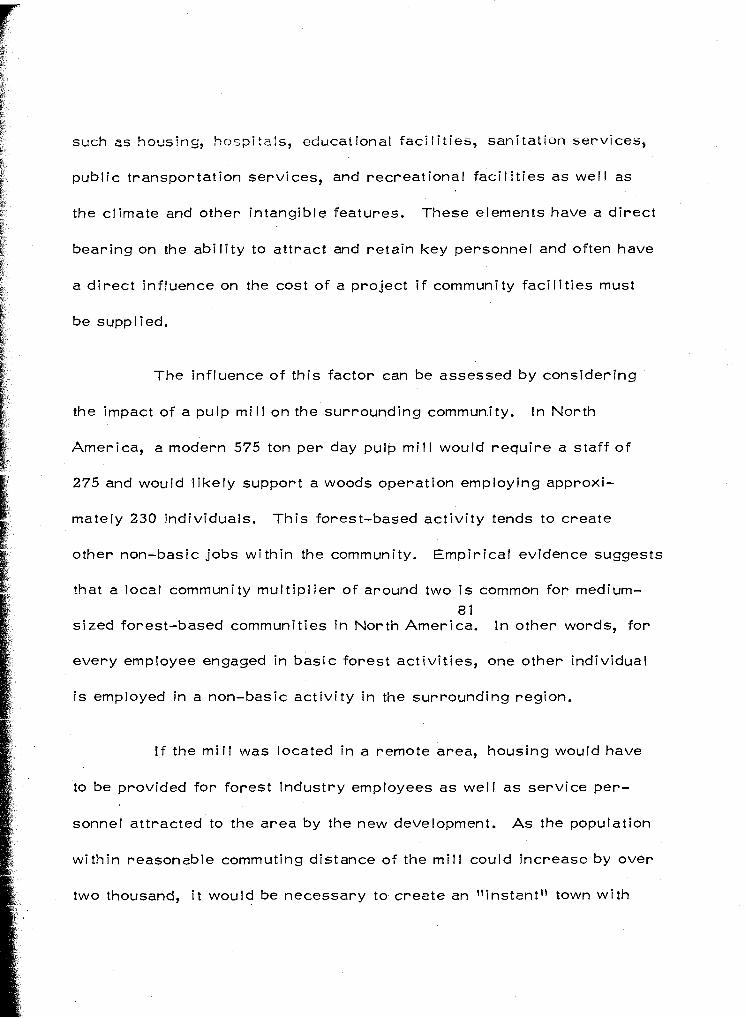
such as hoesing, h o s p l t a i s , educalional faci i i i ies, sani tatiori services,
public transportation services, and recreational faci l i t ies as we1 I as
the climate and other intangible features. These elements have a d i rect
bearing on the abi l i ty to attract and reta in key personnel and often have
a d i rect influence on the cost of a project i f community faci l i t ies must
be supp I i ed.
The influence o f this factor can be assessed by considering
the impact of a pulp mi l l on the surrounding commun.ity. In North
America, a modern 575 ton per day pulp m i l l would requ i re a staff o f
275 and would l ike ly support a woods operation employing approxi-
mately 230 individuals. This forest-based act iv i ty tends to create
other non-basic jobs within the community. Empir ical evidence suggests
that a local community mult ipl ier of around two i s common for medium-
8 1 sized forest-based communities i n North America. I n other words, for
every employee engaged in basic forest activit ies, one other individual
i s employed in a non-basic act iv i ty i n the surrounding region.
I f the mi I l was located in a remote area, housing would have
to be provided for forest industry employees as wel l as service per-
sonnel attracted to the area by the new development. As the population
within reasonable commuting distance of the mi l l could increase by over
two thousand, i t would be necessary to create an "instantI1 town with

provision for basic community services and amenities such as non in- %
dustr ial power, sanitation services, schools, and recreational faci l i t iea.
Consequently, the degree of social capital established within an area
can exert a strong locational force as many of the problems and costs
of building a suitable community are often borne by the new industry.
Hypothetical mi l I s i n the northern hemisphere were assumed
to be located in close proximity to existing communities with an estab-
lished and readi ly expandable nucleus of services and social amenities.
Costs associated wi th community expansion would not be borne by the
new industry with the exception of re lat ively small expenditures for
public relat ions purposes. The attractiveness o f these sites in terms
of c l imate and recreational sources was assumed to be largely a matter
of personal preference.
Sites i n Chi le and B raz i l were assumed to be less favour-
able in terms o f this factor. In order to assist i n the provision of
basic amenities such as housing, domestic water supply and sanitation
services, the new industry would l ikely expend in the order of one
mi I l ion do1 tars. I t was assumed that the major port ion of community
development costs at these sites would be provided from pub1 i c funds.

6.0 Pol i t ica l andE~onomicEnv i ronment
General economic condi tions and government pol icies, pro-
cedures, and institutional arrangements can exert a posit ive o r nega-
t ive effect on capital investment. A s the pulp industry i s highly capital
intensive, a climate conducive to pr ivate investment i s a c r i t i ca l factor
when assessing the attractiveness of alternative sites.
The nature and character ist ics o f an economy i n i t s existing
state and the direct ion and growth of i t s development in the past has a
marked influence on future investment. F o r instance, conditions such
as chronic and uncontrol led inflation and general lack o f growth may
dampen the incentive to invest in an area which i s otherwise suitable
for the estabiishment of a pulp industry.
Government motives, objectives, and methods o f control vary
between regions and tend to affect the tempo of investment accordingly.
Development may be curta i led through government instabi l i ty and sus-
tained lack of support. D i rec t and indirect government intervention i n
a f i rm's administrative operations also tends to discourage private in-
vestment. In addition, a lack of public investment i n physical in f ra-
structure such as transportation fac i l i t ies may often preclude pulp pro-
duction in desirable locations.

d
The estab!lst~me:~t of pulp and al l ied forest industries a r e
normally encouraged by governments due to their propulsive effect on
the development of a regional economy. A pulp industry tends tocreate
a new growth pole which generates a stream o f both tangible and in-
tangible benefits throughout the economy. Through a series of forward
and backward linkages, the paral let development o f secondary, te r t ia ry
and associated industries i s encouraged which provides an effective
means of promoting regional development.
In many developing countries, the pulp and al l ied forest in-
dustr ies are among the f i r s t group o f industries to take advantage of
existing natural resources. The production o f domestic pulp in l ieu of
imported pulp i n these countries i s of key importance due to increasing
domest lc demands for pulp and paper products. In addition, production
for export i s also attract ive part icular ly when supplies o f foreign ex-
change are limited.
m c e the industry's contribution to the economic and soci at
d evelopment of a region i s recognized, governments may posit ively
encourage investment in a var iety of ways. Investment r i s ks may be
reduced through equitable legal and administrative systems, legislative
laws, and investment guarantees. P r i o r o r paral le l expenditures on
basic inf rastructure such as roads, harbours, and u t i l i t ies may improve
the relat ive attractiveness of an area by providing the necessary
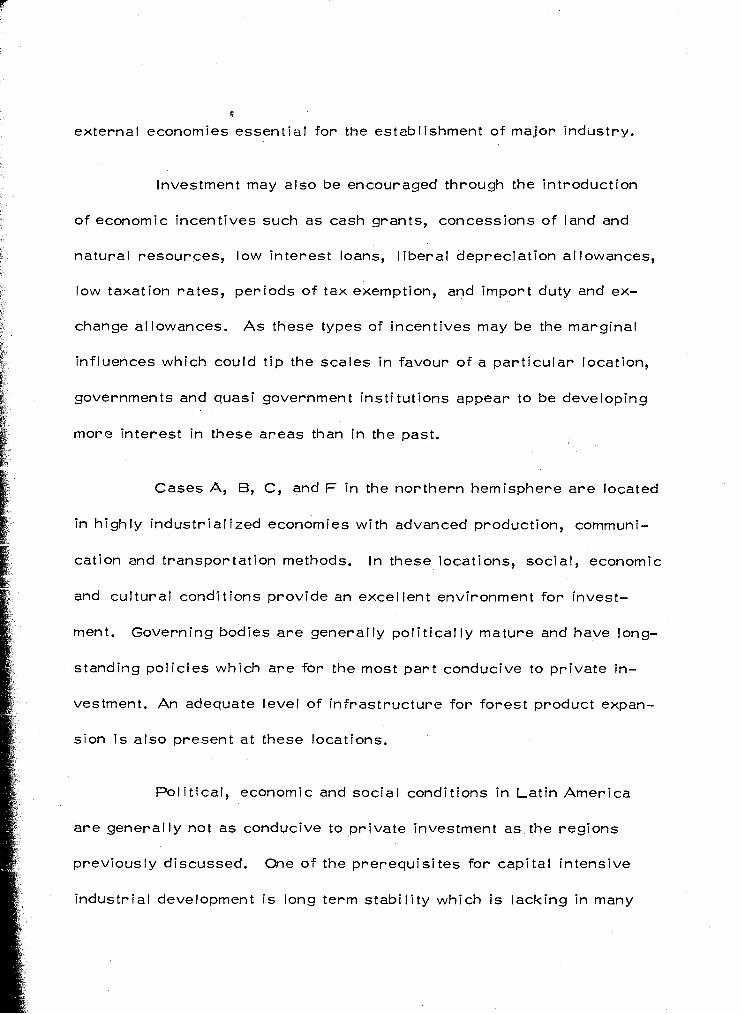
C
external economies essential for the establ ishment of major industry.
Investment may also be encouraged through the introduction
of economic incentives such as cash grants, concessions of land and
natural resources, low interest loans, l iberal depreciation allowances,
low taxation rates, periods of tax exemption, and import duty and ex-
change al lowances. A s these types of incentives may be the marginal
influences which could t ip the scales in favour of a part icular location,
governments and quasi government institutions appear to be developing
more interest in these areas than i n the past.
Cases A, B, C, and F in the northern hemisphere a re located
in highly industr ial ized economies with advanced production, communi-
cation and transportation methods. In these locations, social, economic
and cul tural conditions provide an excel lent environment for invest-
ment. Governing bodies are generally pol i t ica l ly mature and have long-
standing policies which are for the most part conducive to pr ivate in-
vestment. An adequate level of infrastructure for forest product expan-
sion i s also present at these locations.
Pol i t ical, economic and social conditions in Lat in America
are generally not as conducive to pr ivate investment as the regions
previously discussed. One o f the prerequisi tes for capital intensive
industrial development i s long term stabi l i ty which i s lacking in many

X
Lat in American countries. A climate of confidence i s di f f icul t to main-
tain when continuity of basic regulations and pol ic ies i s frequently
disrupted between administrations.
Industrial ization i n many La t in American countries has also
been hampered by a scarci ty of investment capital and managerial sk i l l s
required to attain basic development goals. Other obstacles include
chronic inflation which has made forward planning quite hazardous and
a low level of in f rastructure that has tended to impede production and
distribution.
Case E, however, i s located in B raz i l which i s one o f the
most advanced La t in American countries. B raz i l i s current ly in a
period of rap id economic growth with f ive straight years of gross
82 domestic product increases o f nine per cent o r more. Business confi-
dence i s at a high which has aided in stimulating large inflows of foreign
investment. In addition, considerable progress has been made in con-
t ro l l ing inflat ion despite the buoyant economy.
The pol i t ical climate in Braz i l i s re lat ively stable and the
present government i s actively encouraging pr ivate investment i n the
forest products industry through measures such as f iscal incentives and
import duty exemptions. Basic inf rastructure i s st i l I inadequate in
many areas; however, road, r a i l and port modernization programs are
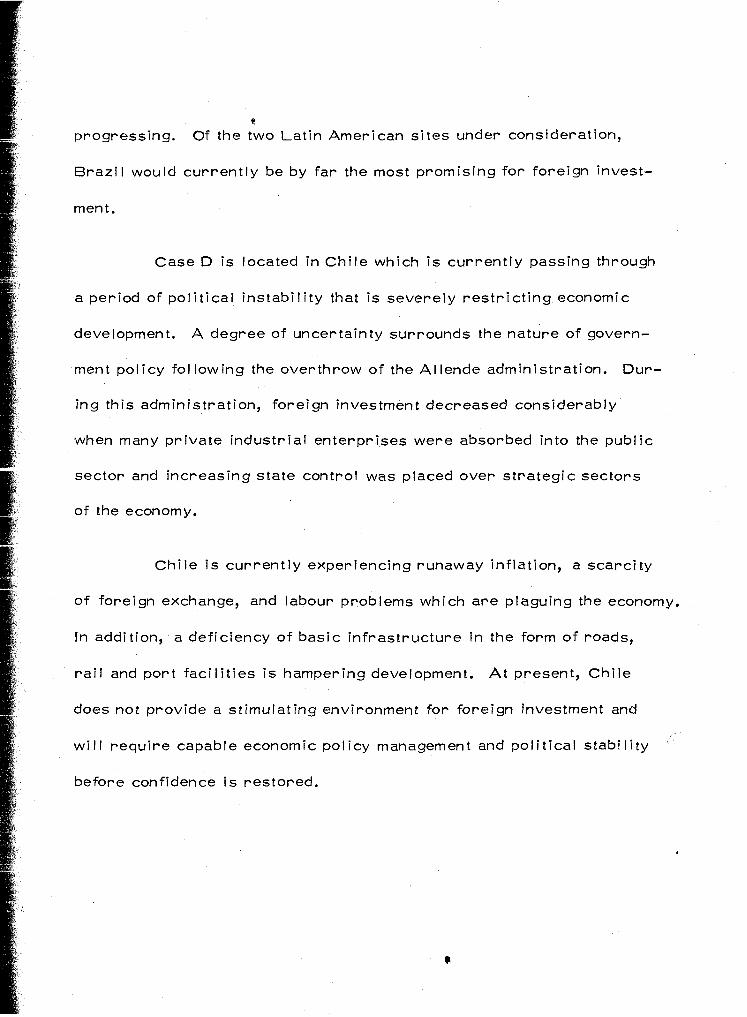
a progressing. Of the two Lat in American sites under consideration,
B raz i I would current ly be by far the most promising for foreign invest-
ment.
Case D is located in Chi le which i s current ly passing through
a period of pol i t ica l instabi l i ty that i s severely res t r i c t ing economic
development. A degree of uncertainty surrounds the nature of govern-
ment pol icy fol lowing the overthrow of the A1 lende administration. Dur-
ing this administration, foreign investment decreased considerably
when many pr ivate industr ial enterprises were absorbed into the public
sector and increasing state control was placed over strategic sectors
of the economy.
Chi le i s current ly experiencing runaway inflation, a scarci ty
o f foreign exchange, and labour problems which are plaguing the economy.
In addition, a deficiency of basic inf rastructure i n the form of roads,
r a i l and port fac i l i t ies i s hampering development. At present, Chi le
does not provide a stimu fat ing environment for foreign investment and
w i l l require capable economic pol icy management and pol i t ical stabil i ty
before confidence i s restored.

* vi
COMPARATIVE COST ANALYSIS
This chapter presents a geographic comparison of the eco-
nomics of pulp production. The hypothetical m i l l s a re ranked i n terms
of manufacturing and non-manufacturing costs and the re tu rn on invest-
ment i s calculated for each site.
6. 1 Cost Structure
A comparative analysis of the economics of pulp production at
each s i te i s shown in Table XX. Quantitative data examined i n the
prevlous chapter i s used as a basis for :his comparison. Additional
cost components such as f inishing materials, operating supplies, main-
tenance materials, sales, and administrative expenses that have not
been previously classif ied as basic locational factors due to their re l -
atively limited effect on the locational decision-making process are
also included in the analysis at this stage in order to present a com-
plete summary o f costs at each site.
6. 1. 1 Manufacturing Costs
A percentage breakdown of the manufacturing cost components
for each si te i s presented i n Chart 4. The wood cost component, which

Ta
ble
XX
Ge
og
rap
hic
Co
mp
ari
so
n o
f th
e E
co
no
mic
s o
f P
ulp
Pro
du
cti
on
fo
r th
e E
uro
pe
an
Ma
rke
t
Ma
nu
fac
turi
ng
an
d N
on
-Ma
nu
factu
rin
g C
os
ts
(u. S
. D
ol I
~~
S/A
DM
T
Ble
ac
he
d K
raft
pu
lp)
Ma
nu
fac
turi
ng
Co
sts
W
ood
Fu
el
Ele
ctr
ic P
ow
er
Ch
em
ica
ls
Wa
ge
s ?
3 S
ala
rie
s
Fin
ish
ing
Ma
teri
als
O
pe
rati
ng
Su
pp
lie
s
?3 M
ain
ten
an
ce
Ma
teri
als
M
i sc
el l
an
eo
us
I T
ota
l M
an
ufa
ctu
rin
g C
os
ts
No
n-M
an
ufa
ctu
r in
g C
os
ts
Sa
les
?3
Ad
min
istr
ati
ve
Exp
en
se
s
Fre
igh
t (l
n l a
nd ?
3 O
ce
an
)
I T
ota
l N
on
-Ma
nu
factu
r in
g C
os
ts
I To
tal
Co
sts
So
urc
e:
Ta
ble
s X
, X
I],
XV
I,
XV
lll
--- A
B
riti
sh
C
olu
mb
ia
---
42.
7
5.4
4
.2
17
.0
18.
5
2.0
10
.0
8.0
--
10
7.8
---
3.5
3
7.0
40.
5
--- 1
48
.3
E
D
Ch
ile
S
ou
the
rn
..-L


ranged from 59 per cent o f manufacturing costs i n Southern Sweden to
29 per cent i n B raz i I, was by far the major component o f manufacturing
costs. The next major manufacturing cost components were chemicals
and labour which averaged 16 per cent and 13 per cent respectively.
The remaining cost components averaged 27 per cent o f manufacturing
costs.
In terms of total manufacturing costs, the hypothetical m i l Is
were ranked in the fol lowing ascending order:
Table XXI
Manufacturing Costs Ranking by S i te
(u. S. DOI I ~ ~ S / A D M T Bleached K ra f t ~ u l p )
Case E - Braz i l
Case A - B r i t i sh Columbia
Case C - Georgia
Case D - Chi le
Case B - Quebec
Case F - Southern Sweden
Source: Table XX
The lowest manufacturing costs occurred at Case E in Braz i I
where extremely low wood costs tended to overshadow a l l other manu-
facturing cost components. I n this region, pulpwood was assumed to be

drawn from fast growing eucalyptus plantations which yield very low
cost pulpwood. The second lowest manufacturing costs occurred at
S i te D in B r i t i sh Columbia. Once again competitive advantage arose
from low wood costs but in this case a high percentage of low cost
residual wood chips were used in the f i b re supply.
Highest wood costs and hence highest manufacturing costs
were found in Quebec and Sweden. In these regions, wood costs per
ton o f product were approximately 185 per cent greater than in B raz i l
and 90 per cent higher than B r i t i sh Columbia.
6. 1.2 Non-Manufacturing Costs
Non-manufacturing expenses include the costs o f transport ing
the f inal product to market as wel l as sales and administrative ex-
penses. The si tes a re ranked , in terms o f ascending non-manufactur ing
costs as follows:
Table XXII
Non-Manufactur ing Costs Ranking by S i te
(u. S. Dol I ~ ~ S / A D M T Bleached K ra f t Pulp)
Case F - Southern Sweden 18.0
Case C - Georgia 35. 5
Case B - Quebec
Case E - Braz i l
Case A - B r i t i s h Columbia
Case D - Chi le
Source: Table XX

As transportat ion expenses form the major component of non-
manufacturing costs, Sweden exhibited by far the lowest costs due to
i t s close proximity to the market in Rotterdam. Conversely, the highest
non-manufacturing costs were found at si tes on the west coast of the
Americas where ocean transport costs averaged 17 dol lars per ton more
than the s i te in Sweden. Costs associated with sales and administration,
which accounted fo r approximately 1 1 per cent of non-manufacturing
costs, had l i t t l e influence on the ranking of sites.
6.1.3 Tota l Costs
A percentage breakdown of total cost components fo r each s i te
i s presented i n Chart 5 . The sites a re ranked in terms of ascending
total costs as follows:
Table XXIII
Total Manufacturing and Non-Manufactur ing Costs Ranking by S i t e
(U. S . Dol I ~ ~ S / A D M T Bleached K ra f t Pulp)
Case E - Braz i l
Case C - Georgia
Case A - B r i t i s h Columbia
Case D - Chi le
Case F - Southern Sweden
Case B - Quebec
Source: Table XX


The ranking of sites in o ~ d e r of total costs was sl ightl y di f-
ferent from the previous ranking on the basis of manufacturing costs.
The s i te i n B raz i l ranked lowest i n both manufacturing costs and total
costs. Although the hypothetical mi l l i n B r i t i s h Columbia possessed
the second lowest manufacturing costs, Georgia ranked second i n total
costs due to lower product transportation costs.
The hypothetical m i l l i n Sweden had the largest manufacturing
costs of a l l sites under consideration, however, i n terms of total costs
the m i l l inQuebec ranked highest. I n this case, high wood costs at
the m i l l i n Sweden were par t ia l l y offset by low transportat ion expenses
- due to i t s close proximity to the market vis-a-vis producers i n the
6.2 Return on Investment
I t was assumed that new e ~ p o r t ~ o r i e n t e d pulp mi l Is i n North
and South America would be developed by pr iva te investors rather than
government bodies. F rom the viewpoint of a pr iva te investor, the
major influence governing the prospect of each development i s i ts prof-
i tabi l i ty. The tradit ional c r i t e r i a of a pro ject 's eff iciency i s measured
by the net r e tu rn on capital employed on the assumption that capital Is
the l imit ing factor fo r which alternative pro jects must compete. Con-
sequently, i n this section, a comparison w i l l be made o f the returns on

investment fo r each m i l l i n order to determine the re lat ive attractive-
ness i n terms of prof i tabi l i ty .
In this study i t was assumed that a l l hypothetical m i l l s would
have the same l i fe span and nearly the same investment schedules.
Furthermore, p r i ce and cost levels were assumed to remain constant
over the l i fetime of the projects. F o r comparative purposes, Itsnap-
shotH prof i tabi l i ty calculations over a typical one year period were
1 considered to be of sufficient accuracy. These calculations were based
on the gross and net r e tu rn on total investment and the net re tu rn on
equity capital where:
Gross Return on Total Investment (GRTI)'
GRTl
S - net sales C - manufacturing and non-manufactur ing expenses I - total investment
Net Return on Total lnvestment
S - net sales D - manufacturing and non-manufactur ing expenses plus
depreciation, interest on loans, and corporat ion taxes I - total investment

Net Return on Equity Capital (NREC)
NREC = (S - D ) 100
E
S - net sales D - manufacturing and non-manufactur ing expenses plus
depreciation, interest on loans, and corporat ion taxes E - equity capital
Th is method of calculation does not take into account a l l mea-,
sures that must be brought to bear when determining the re la t ive
attractiveness o f a case, as no single methods do. However, i t does
provide a framework i n which major aspects of each case may be
evaluated i n a coordinated and systematic manner.
I n the cases under consideration, depreciation was calculated $
on a twenty year straight l ine basis. The amount of equity capital was
assumed to be one th i rd of the total investment at each site. Corpora-
t ion taxes were assumed to be 40 per cent at S i tes A and B i n Canada,
34 per cent at Case C i n Georgia, and 42 per cent at S i t e F i n Sweden.
I n La t i n American countries corporat ion taxes vary widely and in some
cases a new export pulp m i l l may be tax exempt over lengthy periods.
However, for the purpose of this study, corporat ion taxes at Cases D
and E i n B raz i l and Chi le were assumed to be 30 per cent.
are presented i n Table XXlV
ment i s shown i n the table be
The re turns on investment fo r the cases under consideration
. Ranking of sites by re turns on invest-
low.

Ta
ble
XX
lV
Ge
og
rap
hic
Co
mp
ari
so
n o
f th
e E
co
no
mic
s o
f P
ulp
Pro
du
cti
on
fo
r th
e E
uro
pe
an
Ma
rke
t N
et
Ea
rnin
qs
an
d R
etu
rn o
n l
nve
stm
en
t
(~h
ou
sa
nd
s of
U. S
. D
oll
ars
)
.Sa
les
Le
ss
Ca
sh
Dis
co
un
ts a
nd
Re
ba
tes
Ne
t S
ale
s
Le
ss
- M
an
ufa
ctu
rin
g C
os
ts
- N
on
-ma
nu
factu
rin
g C
os
ts
Gro
ss
Ea
rnin
gs
L
es
s - D
ep
rec
iati
on
-
Inte
res
t on L
oa
ns
-
Co
rpo
rati
on
Ta
xe
s
Ne
t E
arn
ing
s
To
tal
lnve
stm
en
t
Gro
ss
Re
turn
on
ln
ve
stm
en
t
Ne
t R
etu
rn o
n l
nve
stm
en
t
Ne
t R
etu
rn o
n E
qu
ity
Ca
pit
al
So
urc
e:
Ta
ble
s X
, X
IX,
XX
--- A
B
riti
sh
C
olu
mb
ia -
46
,00
0
69
0
45
,31
0
21,
56
0
8, 1
00
15
,65
0
3,4
50
4
,62
0
3,0
32
4,5
48
77
,00
0
20
.3
70
5.9
%
17
.7
%
---
B
Qu
eb
ec
47
,00
0
70
5
46
,29
5
27
,66
0
7,1
00
1 1
,53
5
3,6
00
4
,80
0
1,2
54
1,8
81
80
,00
0
14
.4 70
2.4
qr,
7
.0
%
C A
C
Ge
org
ia
44
,40
0
66
6
43
,73
4
22
,12
0
7,1
00
14,
51
4
3,5
00
4
,68
0
2,
15
4
4,1
80
78
,00
0
18.6
%
5.4
%
16.
1 %
E
D
Ch
ile
E
Bra
zil
42
,00
0
63
0
41
,37
0
19,
58
0
8, 1
00
13
,69
0
4,0
00
4,
500
1, 5
57
3,6
33
90
,00
0
15
.2
%
4.0
970
12
.1
%
F
So
uth
ern
S
we
de
n
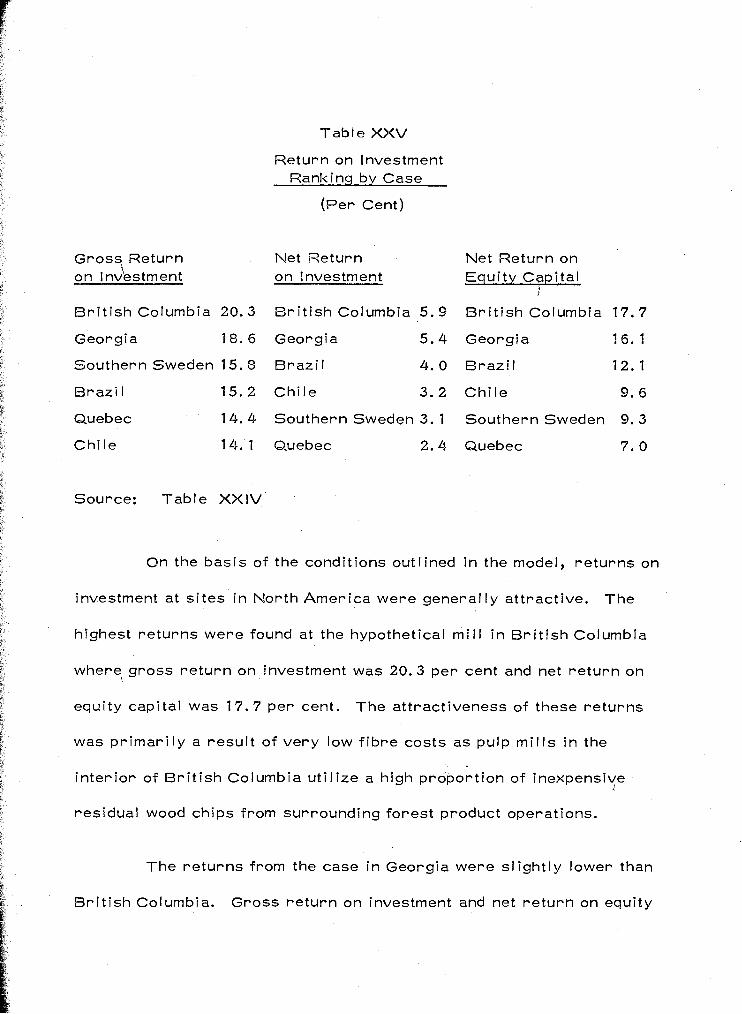
Tab l e X X V
Return on lnvestment Ranking by Case
(Per Cent)
Gross Return Net Return Net Return on on 1nJestment on Investment Equity Capital
1
B r i t i s h Columbia 20.3 B r i t i s h Columbia 5 . 9 B r i t i s h Columbia 17.7
Georgia 18. 6 Georgia 5.4 Georgia 16, 1
SouthernSweden 15.0 B raz i l 4. 0 Braz i l 12.1
B raz i l 15.2 Chi le 3.2 Chi le 9 . 6
Quebec 14.4 Southern Sweden 3.1 Southern Sweden 9.3
Chi le 14 .1 Quebec 2.4 Quebec 7 .0
Source: Table XX IV
On the basis of the conditions out1 ined i n the model, re turns on
investment at si tes i n Nor th America were generally attractive. The
highest re turns were found at the hypothetical m i l l i n B r i t i s h Columbia
where gross re tu rn on investment was 20.3 per cent and net r e tu rn on
equity capital was 17.7 per cent. The attractiveness of these re turns
was p r imar i l y a resul t of very low f ib re costs as pulp mi l Is i n the
in ter io r of B r i t i s h Columbia u t i l ize a high proport ion of inexpensive
residual wood chips from surrounding forest product operations.
The re turns from the case i n Georgia were s l ight ly lower than
B r i t i sh Columbia. Gross re tu rn on investment and net r e tu rn on equity

capi t al at this s i te w e r e 18. 6 per cen ~t and 16.1 per cent. The cornpei-
i t i ve advantage of t h i s s i t e also stemmed from relat ively low wood costs.
On the basis of these re tu rns , sites in B r i t i s h Columbia and Georgia
could be considered a t t rac t i ve i n terms of export pulp production for
the European market under p r i c e and cost levels i n mid 1973.
I n Quebec, g ross r e t u r n on investment was 14.4 per cent and
net re tu rn on equity capital was 7.0 per cent. These re turns were
among the lowest of the m i 1 I s under consideration and ref lect high wood t
costs i n eastern Canada. In this case, the European market would be
unattractive and product ion would general I y be l imited to North
American markets.
Returns at the hypothetical m i l l s i n B raz i l and Chi le were
lower than the cases in B r i t i s h Columbia and Georgia but higher than
~ u e b e c . Gross r e t u r n on iyestment was calculated at 15.2 per cent
i n B raz i l and 14.1 Per cent i n Chile. Net r e tu rn on equity capital i n
~ r a z i l and Chi le was 12. 1 and 9.6 per cent respectively. Low cost \
plantation wood at these si tes tended to buffer increased capital in-
vestment requirements; however, on the basis of re turns on capital
alone, these could only be considered as marginal sites.
The gross re tu rn on investment at the s i te i n Sweden was 15.8
per cent and the net re tu rn on equity capital was only 9.3 %. Despite

close proximity to the market I n Rotterdam which great ly reduced pulp
transport costs, re turns were lower than the major i ty of sites examined
i n North and South America. Th is can be attr ibuted to Swedish wood
costs which were signif icantly higher than a l l other cases under consid-
erat ion.
I n recent years, the pulp industry has been plagued by low
re turns on investment. Th is condition was brought about by a weaken-
ing of the pulp market due to a downturn i n the economies of most of the
industr ial ized nations. Consequently, excess pulp capacity and depressed i
pr ices occurred at a time of rapid ly r i s i ng costs.
A strong recovery i n demand i n late 1972 was ref lected i n
higher pulp pr ices. A s the worldwide supply demand balance fo r pulp
i s continuing to tighten, fur ther p r i ce increases above the level outlined
i n this study w i l l occur by the end of 1973. Th i s w i l l improve the
attractiveness of the re turns at a l l sites under consideration and tend
to further encourage expansion i n market pulp production.
6.3 Qual i tat ive Considerations
Inherent i n the approach i n the preceding section i s the assump-
t ion that prof i tabi l i ty i s the pr ime factor i n the analysis and, conse-
quently, projects w i l l be undertaken i f the re turns a re suff icient to
attrac: investmen: capital. t-i'owever, quai i ia i ive factors frequent! y
play an important r o l e i n locational decision making and must also be
taken into consideration when determining a location's prospects. F o r
instance, factors which a re qualitative i n nature such as the pol i t ical
and economic environment surrounding a proposed development often
exert a strong influence on the re lat ive attractiveness of a si te and may ,
completely r u l e out a project that i s attract ive i n terms of prof i tabi l i ty.
In this study, the cases i n B r i t i sh Columbia and Georgia,
which are the two most attract ive sites i n terms of prof i tabi l i ty, a re
located i n areas where economic, social, and pol i t ical conditions pro-
vide an excel lent environment for pr ivate investment. A strong forest
industry base i s we1 l established i n both areas and the degree of infra-
strclcture required for this type of development Is a!so present. These
positive factors are also present. at the si te i n Quebec, however, the
low re tu rn on investment for export pulp sales from this si te tends to
r u l e out development.
On the other hand, pol i t ical and economic conditions at the
cases i n Braz i l and Chi le are Subject to a much greater degree of un-
certainty. B raz i l i s cur rent ly i n a period of rap id economic growth
and i s experiencing re lat ively stabte pol i t ical conditions. However, a
h istory of long term stabi l i ty present at the sites i n North America

has not been experienced i n Bra21 i which would tend to reduce the
attractiveness of this si te re lat ive to those in Nor th America.
A climate conducive to pr ivate investment i s not present i n
Chi le as a period of pol i t ical instabil i l y has dampened economic devel-
opment. Fur ther development of the pulp industry by pr ivate investors
at present would l ike ly be ru led out unti l economic and pol i t ical condi-
tions stabilize. Of the t i ~ o Lat in American si tes under consideration,
B raz i 1 presents a much more attract ive environment fo r investment.
In conclusion, the locational decision must be a summation of
judgements taking into account both qualit i tative and quantitative factors.
From the viewpoint of the pr ivate investor wi th markets i n western
Europe, the cases i n B r i t i s h Columbia and Georgia are the most attrac-
t ive i n terms of pol i t ical , social and economic conditions as wel l as
pro f i tabi I i ty. A1 though an environment conducive for pr ivate investment
i s present i n Quebec, the low re turns at this si te ru le out development.
The case i n B raz i l i s marginal on the basis of prof i tabi l i ty
and would not be as attract ive as B r i t i sh Columbia o r Georgia i n terms
of pol i tical, social and economic conditions. Development at the case
i n Chi le must be ru led out at present due to pol i t ical and economic
instabil i ty.

VI I
CONCLUSIONS
European demand for forest products has increased rapid ly i n
recent years and i s expected to continue to r i s e at a strong ra te in the
future. The increase in industr ial wood requirements i s par t ia \ l y a
resul t of growing demand for paper and paperboard products which i s
reflected in a derived demand for wood pulp, the major component of .
paper and paperboard products.
S Although European forest resources current ly support the
majori ty of domestic demands, industrial wood removals are steadily
fal l ing behind domestic requirements., According to F A 0 forecasts,
one of the major def ic i ts i n European wood resources w i l l be in the
form o f long f ibred pulpwood. In order to supplement f ib re production,
Europe w i l l be faced with a permanent and growing dependency on pulp
imports from other f ib re producing areas of the wor ld such as North
and South America.
The forest resource in North America could current ly support
a major increase in domestic consumption and s t i l l possess an export-
able surplus. Large economical ly accessible reserves of v i rg in t im-
I k , ber in the northern coniferous forest belt and to a lesser extent stands I

of hardwood and conifers in the eastern and southern regions arve cap-
able of supporting a major increase i n export pulp production.
A strong base for forest industry expansion already exists i n
Nor th America which current ly supplies over one hal f of the wor ld ts
market pulp and close to one hal f o f the wor ld 's paper and paperboard.
In addition, the polit ical, social, and economic cl imate in Nor th
America provides an excellent environment for further development o f
the pulp industry. Considering the r i s ks and uncertainties involved i n
developing new pulp fac i l i t ies in many other areas o f the wor ld with
surplus f ib re reserves, Nor th America appears to have a high capacity
to satisfy a growing share of European wood pulp demands.
In order to assess the economics of export pulp production in
Nor th America, hypothetical bleached k ra f t mi l Is were examined at
si tes in the B r i t i s h Columbia Inter ior , central Quebec, and Georgia.
I t was assumed that a l l production would be placed on the European mar-
ket. The highest re turns were found i n B r i t i sh Columbia where the
gross re turn on total investment was 20.3 per cent and the net re tu rn
on equity capi tal was 17. 7 per cent. These attl
p r imar i ly a resu l t o f very low f ib re costs as pu
ut i l ize a high proport ion o f inexpensive residua 7 , .
rounding lumber operations.
active returns were
p m i l l s i n this region
wood chips from sur-

T h e r e t u n ' l s ai the hypotheticai m i i i i n Georgia weye sl ight iy
less than in B r i t i sh Columbia. Gross re tu rn on investment was 18.6
per cent and net re tu rn on equity capital was 16. 1 per cent. Based on
these returns, both cases would support export pulp production for the
European market at the level of pulp pr ices i n mid 1973.
A t the s i te in Quebec, gross re turn on investment and net r e -
turn on equity capital were 14.4 and 7.0 per cent. The low returns at
this si te were mainly a resul t o f high wood costs which were approxi-
mately 70 per cent greater than the s i te in B r i t i sh Columbia. On the
basis of these returns, the European market would be quite unattrac-
t ive and production would l ike ly be placed on markets closer to Quebec
unless pulp pr ices increased substantial ly i n the future.
Lat in America's potential for enter ing the international pulp
trade in a substantial way at present i s not promising. Despite vast
forest resources, the major i ty of the natural reserves in La t in America
are either classif ied as inaccessible o r contain a mix o f species which
are presently unsuitable for pulp production. Natural softwood forests
a re few and manmade plantations a re not large enough at present to
sustain both growing domestic and export pulp demands.
The potential fo r substantial export pulp trade in La t i n
America l ies in the future when fo;'bsts in the nor thern temperate zone
a r e more ful ly ut i l ized d r t d rnclrqindi pulpwood costs are h ~ g h e r due to
intensified s i lv icul ture and harvesting in less accessible areas. A t
that time, a large port ion of the f ibre supply for the Lat in American
pulp industry w i l I l ikely be drawn from strategical ly located plantation
complexes which have already become a major element in the Lat in
American forest resource base.
Due to favourable environmental conditions in many areas of
Lat in America, growth rates within plantations are f ive to ten times
the rates experienced in natural forests of the northern temperate zone
where the majori ty of pulp production i s current ly concentrated. With
a combination of high growth rates, re lat ively low labour rates, and
limited pressure on land, the cost of plantation wood i s presently quite
low in comparison to roundwood costs in many countries in the northern
temperate zone and w i l l l ike ly remain so i n the future. With advances
in pulping technology, f ib re supply from the vast tropical forests may
also play an important r o l e in the future development of the Lat in
American pulp industry.
Both o f the hypothetical m i l l s i n Lat in America were based on i'" .
plantations. A t the si te in Brazi l , gross re turn on investment was 15.2
per cent and net re tu rn on equity capital was 12.1 per cent. Returns
in Chi le were sl ightly lower with a gross re tu rn on investment of 14. 1

per cent and net re tu rn on equity capital o f 9.6 per cent. The comperl-
t ive advantage of these sites stemmed from the ut i l izat ion o f low cost
plantation wood. F o r instance, the wood cost on a per ton of product
basis in Braz i l was approximately one th i rd that o f Sweden. A s wood
costs in the pulp industry represent a major port ion o f manufacturing
costs, higher costs in South America for inputs such as chemicals, and
operating supplies as we1 l as increased capital costs were effectively
buffered.
In order to place the returns i n proper perspective, the r i s ks
and uncertainties inherent i n major investment programmes i n La t in
American countries must be taken into account. F o r instance, pol i t i -
cal, social and economic conditions are general ly not as conducive to \
pulp industry development by pr ivate capital i n La t i n America as i n the
more industrial ized areas of the northern hemisphere. Although
Braz i l i s cur rent ly i n a per iod of rap id economic growth which i s \
encouraging pr ivate investment, a h istory of long term stabi l i t y such
as found at the sites i n North America has not been experienced. A
rather perplexing investment climate prevai ls i n Chi le as the present
polit ical instabi l i ty has tended to dampen forest industry development.
' I"
A less stable investment climate tends to reduce the attrac-
tiveness of returns from the viewpoint of a pr ivate investor especially

v~hen large capital outlays are involved. However, the re turns on in-
vestment suggest that the cases i n La t i n America could compete on the
European market. Once domestic demands a re met and new plantations
are established, these areas w i l I l ike ly play a larger r o l e i n serving
the European pulp market.
I n summary, i t i s probable that Nor th America w i l l continue
to supply an increasing share of European requir,ements as wood
resources in Nor th America appear to be of suff icient quantity and
qua1 i ty to supply both export and domestic markets. With a major com-
petit ive advantage i n wood costs, the pulp i,ndustry in selected areas
of North America appears capable of successful l y competing wi th
Scandinavian countr ies i n European markets despiie additional trans-
por t costs.
A t present, growing domestic demands i n La t i n America w i l l
absorb a large percentage of new pulp capacity. I f plantation programs
succeed and the re la t ive advantage i n wood costs prevai ls i n the future
as predicted, the La t i n American pulp industry w i l l be i n a strong com-
pet i t ive posit ion to supply an expanding share of European pulp require- I
ments. r :
L!ST OF REFERENCES
CHAPTER I I
lndustr i ood includes sar eneer logs, logs for sle epers, pulpwood, pilprops, poles, piling, posts and other miscellaneous roundwood. I t excludes fuelwood used fo r the purposes of cook- ing, heating and production of power.
Food and Agr icu l ture Organization, United Nations Economic Commission for Europe, European Timber Trends and Prospects - 1950-1 930 A n Interim Review, Geneva, May 1969, Volume 1, p. 163.
Domestic demand i s also increasing for lumber, plywood, recon- stituted wood panels and other miscellaneous forest products. ( f e e Table I. )
On a worldwide basis, more than 70% of the f ibrous materials used to produce paper and paperboard consist of v i r g i n wood pulp. Of the remaining amount of f ibrous materials used, about 80% consists of recycled paper and paperboard.
Food and Agr icu l ture Organization, United Nations Economic Comni i:,sic>.l F C ) ~ Europe, European ----- -I- imber Trends and Prospects - 1950-1 980, /lil uy~t lb~-" f is - . - - - - r #.\ i f , :;rxneva, May 1969, Volume 1 , p. 91.
In this case, the European Economic Community includes the or iginal member countries of Belgium-Luxembourg, France, Italy, Netherlands, and Western Germany as we1 I as Ireland and Great Br i ta in, the most recent members. Denmark, another recent member, i s excluded as F A O forecasts for this country were aggregated i n the Northern European regional grouping.
Food and Agr icu l ture Organization,*- United Nations Economic Commission for Europe, k- 1950-7 980, A n Bnterim Review, Geneva, May 1969, Volume 4,

8. Non-integrated paper producers wi th no backwa.rd I inkages ex- . tending into pulp production and timber supply a re heavily de- pendent upon the volume of pulp placed on the open market.
9. Paper grade pulp includes mechanical, chemical and other pulp used i n the manufacture of paper and paperboard products. I t excludes dissolving pulp which i s a bleached chemical pulp of high alphacel lulose content suitable fo r conversion into rayon, cel lophane, lacquers and other special ized non-papermalt ing uses.
The fol lowing countr ies are included i n Western Europe:
Austr ia, Belgium-Luxembourg, Denmark, Federal Republic of Germany, Finland, France, Greece, Iceland, Ireland, Italy, Malta, Netherlands, Norway, Portugal, Spain, Sweden, Switzerland, United Mi ngdom .
Paper grade pulp consumption forecasts are drawn from the fol lowing source:
Food and Agr icu l tu re Organiz,ation, Out look fo r Pu lp and Pape,r Consumption, Product ion and Trade to 1 985, Advisory Comm i ttee on Puip and Paper, Rome, A p r i l 1972, p. 48.
CHAPTER I11
1. F o r e s t l a n d i n N o r t h A m e r i c a c o v e r s c l o s e t o 7 1 0 m i l l i o n h e c t - ares.
Food and Agr icu l tu re Organization of the United Nations, Supply of Wood Materials for Housing, Wor ld Consul tation on the Use of Wood i n Housing, Secretar iat Paper, Sect ion 2, 1971. , ci ted i n W.S. Department of Agr icul ture, The Outlook for Timber i n the United States, Forest Resource Report #20, Washington, Forest
, * Service, 1973, p. 133.

J. A. Zivnuska, "Socio-Economic Factors Shaping the Future of Fores t ry i n Nor th America, 11 Paper prepared for presentation at the Future of Fores t ry Symposium, Univers i ty of B r i t i s h
\
Columbia, 18 November 1971.
Loc. c i t .
L. Haas, l W o r l d Trendst t Pulp and Paper, Vol. 47 (30 June 1973), p. 109.
Food and Agr icu l tu re Organization, Yearbook of Forest Products 1969-70, Rome, 1971, p. 2.
American Paper Institute, Monthly Stat is t ica l Summary, Vol . 51 ( ~ u l y 1973), p. 12.
Canadian Pu lp and Paper Association, Reference Tables - 1973, Montreal, 1973, p. 10.
Canadian Pu lp and Paper Association, Reference Tables - 1973, Montreal, 1973, p. 28.
The total area under forest cover i s estimated to be approximately 900 m i ! l ion hectares.
Food and Agr icu l tu re Organization, IlThe Forests o t L. d t
America, Paper presented at the Seventh Wor ld Congress, Buenos A i res , October 1972.
7 . Streyf fer t , Wor ld Pulpwood - A Study i n the Competitive Posi t ion of Pulpwood in Dif ferent Forest Reqions, Stockholm, Almquist 0 Wiksel I, 1968, p. 65. \
The remaining S3 per cent of the timber harvest was ut i l ized pr imar i ly as fuelwood.
Food and Agr icu l tu re Organization, Yearbook o f Forest Product Stat ist ics, 1969-70, Rome 1971, p. 3.
D. W. Butts, " L A F T A t s Paper Economy - Progress, Problems and Potential, Pulp Paper and Board Quarter ly Report, U. S . Department of Commerce, July 1 6 ~ 0 , p.7.

d. A. Zivnuska, LI. S. Timber Resources in a Wor ld Ecoqorny, Resources f o r the Future lnc., Maryland, John Hopkins Press, 1967, p. 100.
According to J. E. Atchison, propert ies of pulp from various mixtures of tropical hardwoods have proven to be comparable to those of k ra f t pulps from temperate zone hardwoods.
J. E. Atchison, l lTropical Forests and Plantations - Key to Future F i b r e Shortages? Paper Trade Journal, Vol. 157 (15 January 1973), p. 34.
T. Streyf fer t , Wor ld Pulpwood - A Study i n the Competitive Posi t ion of Pulpwood i n Dif ferent Forest Regions, Stockholm, Almquist €3 Wiksel l , 1968, p. 167.
H. t-l. Kei I, "Lat in America Must Surmount Many Obstacles i n Pulp - Paper Growth, l1 Pulp and Paper, Vol . 44, (August 1 WO), p. 81.
Loc. c i t .
Loc. ci t .
The annual growth ra te of pulp production i n the United States over the same per iod was 5.2 per cent.
L. Haas, lVVorld Trends, 1 Pu lp and Paper, Vol. 47 (30 June 73) p. 11 0.
Food and Agr icu l tu re Organization, Outlook fo r Pu lp and Paper Consumption, Product ion and Trade to 1985, Advisory Committee on Pulp and Paper, Rome, A p r i l 1972, p. 48.
CHAPTER !V
1 . B y doubling the size of a kra!t pulp m i l l from 400 to 800 tons per day, the number of employees may increase from approximately 245 to 320.
Estimates by F. L.C. Reed and Associates Ltd., Consult ing Economists.

2. The physical differences among species a re often suff iciently great to affect the pulping, bleaching, and general papermaking qual i t ies of pulp. Southern pine species ut i l ized i n Case C have a higher basic density than the spruce-pine specie mixes used i n cases R and F. In general, basic density i s closely re lated to the cel l wal l thickness of the individual f ibres. A lower basic density i s associated wi th a thinner cel l wal l which great ly faci l i tates f i b re to f i b re bonding. Th i s bonding i s important fo r the development of good burst ing and tensile strength, folding endurance and other paper strength measures wi th the exception of tearing resistance. Hence pulp from cases A and F ut i l i z ing a low density specie mix may command a higher market p r i ce than pulp from Case C.
CHAPTER V
See Chart 4.
The shipment of wood chips over long distances by ocean trans- por t i s a re lat ive ly recent development. The volume of chips transported by this method has increased from 184 thousand cubic metres i n 1965 to near ly 5 mi l l ion cubic metres in 1971.
J. E. Atchison, HTropical Forests and Plantations - Key to Future F ibe r Shortages? Paper Trade Journal, Vol. 157, (January 15, 19731, p. 36.
Represents mature timber volumes (18 cm. C dbh, close ut i l iza- t ion standards, less decay).
Government of B r i t i s h Columbia, Forest Inventory Stat is t ics of E r i t i s h Columbia - 1970, Victor ia, Fores t Service, June 1972, p. 8 .
Government of B r i t i s h Columbia, Financial and Economic Review- 1971, Victor ia, July IW"i', p. 42.
A l lowable cut based on a 15.2 cm. top, dib.
Government of B r i t i sh Columbia, Selected Fores t lndustry Statiski&s of B r i t i s h Columbia, Victor ia, Department of Industry, Trade and Commerce, July 1972, p. 7.

7. - lbid., p. 1 I .
8. m. , p. 22.
9. The average wood density i s based on the fol lowing oven d r y den- s i t ies per cubic metre of green wood:
White spruce 350 kg/m3 Lodgepolepine 401 kg/m3
\,
Wood requirements for the production o f an a i r d r y met r ic ton o f bleached k ra f t pulp a re calculated as follows:
a) Average wood density
65% white spruce 350 x .65 = 228 kg/m3 35 % lodgepole pine 401 x .35 = 14.0 kg/m3
Average wood density = 368 kg/m5
b) Wood requirements
- average wood density - 368 kg/m 3
- bleached k ra f t pulp yield - 43% - one ton of a i r d r y pulp i s equivalent to
0.9 ton of oven d r y pulp
1,000 k g x .90 - - 5.70 cubic metres per a i r d r y 368 kg/m3 x .43 metr ic ton o f bleached k ra f t pulp
I n 1970 t h e B r i t i s h Columbia pulp and paper industry consumed 8.8 mi l l ion cubic metres of pulpwood and 10.4 m i l l ion cubic metres of wood residue.
Stat is t ics Canada, Pu lp and Paper Mi l l s 1970, Catalogue #36-204.
P. E. Lachance, {What do we know about the Forests of Quebec, I f
Canadian Pulp and paper Industry, Vol. 23 arch 1970), p. 36.
Ibid., p. 39. - L. Lussier , I1How Quebec Can Make Bet ter Use of Her Forest Resources, Canadian Pu lp and Paper Industry, Vol . 23 ( ~ a r c , h 1970), p. 34.

Stat is t ics Canada, Cznadiar? Fores t ry Statistics 1970, Catalogue #25-202.
Stat is t ics Canad,a, Pulp and Paper M i l l s 1970, Catalogue #36-204.
Loc. ci t .
L'dood requirements for the production of an a i r d r y metr ic ton of pulp are calculated as follows:
- average wood density - 400 kilograms/cubic metre - bleached l t raf t pulp y ie ld - 43 per cent - one ton of a i r d r y pulp i s equivalent to 0.9 tons of
oven d r y pulp
1,000 kq. x .90 - - 5.2 cubic metres per a i r d r y metr ic 400 kg/m3 x .43 ton of bleached k ra f t pulp
The Quebec pulp and paper industry consumed 17.7 mi l l ion cubic metres of pulpwood and 2.7 mi l l ion cubic metres of wood residues i n 1970.
Stat is t ics Canada, Pu lp and Paper M i l l s 1970, Catalogue iY-36-204.
The Southern States include the following:
Alabama Ok I ahom a Arkansas South Caro l ina F lo r i da Tennessee Georgia Texas Louisiana V i rg in ia Mississippi Nor th Carol ina
U. S. Department of Agr icul ture, Forest Stat is t ics fo r the United States by State and Region 1970, Forest Service, 1972, p. 1 .
L o c ci t .
Volume i n sound we1 l formed trees that a re of commercial species and a re larger than 12.7 centimetres i n diameter at breast height.
I-I. S . Sterni tzke and J. F. Christopher, "The South: Timber Growth, Trends, Outlook, Pulp and Paper, Vol. 73 ( ~ e b r u a r y 1973), p. 76. i
Ibid., p. 77.
Ibid., p. 77. - Ibid., p. 77.
The Southern Forest Resource Analys is Committee, The South's T h i r d Forest, 1969, p. 96.
K. E. Lowe, ItSouth: Nor th American P ro f i l e 1973,lt Pulp and Paper, Vol. 47 (30 June 1973), p. 31.
American Paper Institute, The Stat is t ics o f Paper - 1972, New York, June 1972.
Loc. c i t .
Wood requirements for the production of an a i r d r y metr ic ton bleached k ra f t pulp a re calculated as follows:
Average wood density - 450 kg/m3 Bleached k ra f t y ie ld - 43% One ton of air, d r y pulp i s equivalent to 0.9 tons of oven
d r y pulp
1,000kq x .90 - - 4.65 cubic metres per a i r d r y 450 kg/m3 x -4.3 metr ic ton of bleached k ra f t puip
A study by the Canadian Pu lp and Paper Associat ion indicated the average transportation distance for pulpwood i n the U. S. south i s approximately 60 miles i n comparison to 9d miles i n Western Canada and 156 i n Quebec.
0 f
that
The Council of Pu lp and Paper Producers of Quebec, ! T h e - Competitive Posi t ion of the Quebec Pulp and Paper Industry. 1 1
January, 1972, p. 11.
Growth i n Southern P ine stands normally averages 5 - 7.5 cords/ hectr;re/year compared to 0.8 c o r d / h e ~ t a r e / ~ e a r i n the Canadian boreal forests. ~ h e s k rap id growth rates allow a pulp m i l l to operate on 1/6 to 1/9 the area of forest land required fo r a Canadian mi l l .
M. F.:.Squires, '!Fast Growing T rees and Intensive Fo res t r y i n ~ewfoundland, Pulp and Paper Magazine o f Canada, Vol . 73 (September 1972), p. 124.

3 1 , ,. Southern f o r e s t Institute, Economic AnaIvsis of t h e South!s Pulp and Paper Industry, December 1971, p. 1.
32. R . F . Bi l l ings, E. H. Hosten, and R. I. Gara, I fForest Entomol- ogy i n Chile: A n Example of U. S. -Chilean Cooperation, 1'
Journal -_-(-L-YIY-.--- of Forest ry , Vol. 71 arch 1973), p. 164.
33. Food and Agr icu l tu re Organization, Pu lp and Paper Prospects i n La t in America, New York, 1955, p. 21 2.
34. 1. Strey f fer t , Wor ld Pulpwood - A Study i n the Competitive Posi t ion o f Pulpwood in Dif ferent Forest Regions, ~ tock l<o lm, Almqvist and Wiksel I, 1968, p. 83.
36. Food and Agr icu l tu re Organization, FAO1s Work i n the F ie l d of Pulp and Paper, Ro'me, FA8 Advisory Committee on Pulp and Paper, Eighth Session, May, 1967, p. 15.
37. In1972Chi leexpor ted98thousandmet r i c tonso fpu lpand42 thousand tons of paper and board.
Pulp and Paper International, 1973 Review Number, Vol. 15 (25 July 1973), p. 171.
38. American Paper Institute, Wood Pulp Stat ist ics, 36th Edit ion, New York, October 1972, p. 129.
23. Pulp and Paper International, 1973 Review Number, Vol. 15 : i
(25 July 1973), p. 171. ', 40. American Paper Institute, op. c i t . , p. 130.
41. The f i b re furn ish at cases 13 and F i n Quebec and Southern Sweden contains spruce which i s considered to be the most desirable softwood species used i n the production of pulp.

Wood requirements for t h e production of ar, a i r d ry metr ic ton of pulp are calculated as fol lows:
- Average wood density - 450 kg/m3 - Bleached k ra f t pulp yield - 43% - One ton of a i r d ry pulp i s equivalent to 0.9 ton of oven
d ry pulp
1,000kg x .90 - - 4.7 cubic metres per a i r d r y 450 kg/m3 x .43 metr ic ton of bleached k ra f t pulp
T. Streyf fer t , Wor ld Pulpwood - A Study i n the Competitive Posit ion of Pulpwood i n Dif ferent Forest Wegions, Stockholm, Almquist and VViksel I, 1968, p. 82.
Jaakko Poyry and Company, "An Appraisal of Newsprint Develop- ment Opportunities i n Lat in America, 11 Study prepared for the United Nations Economic Commission for La t in America, January l!X'O, Annex 1 1 , p. 22.
J. C. Wal lace, Ill-low La t in Americans Look at Wood, 11 Forest Industries, Vol. 99 ( ~ e b r u a r y 1972), p. 21.
T o encourage p l antat ion expansion the B raz i l ian government I
approves the use of 35 per cent of corporate income taxes fo r afforestation. Projects approved since 1966 have provided for the planting of a b i l l i on trees i n the southern regions of the country.
J. I-l. Treleaven, "Brazi I, 1 Canada Commerce, Vol. 136 (September 1972), p. 13.
Pulp and Paper International, 111 973 Review Number, 1' Vol. 15 \
(25 July 1973), p. 167.
Loc. ci t .
Wood requirements for the production of an a i r d r y metr ic ton of bleached k ra f t pulp a re calculated as fol lows:
- ~ v e r a g e wood density - 520 kg/m3 - Bleached k ra f t pulp yield - 46%
i? - One ton of a i r d r y pulp i s equivalent to 0.9 ton of oven
d ry pulp
1,000 kg x .90 - - 3.8 cubic metres per a i r d r y 520 kg/m3 x .46 metr ic ton of bleached k ra f t pulp

Officiat S ta t is t ics of Sweden, !!Statist ical Yearbook of F o r e s r r * y , cited i n American Paper institute, Wood Pulp Stat ist ics, 36th Edition, N ~ V J York, Pulp and Raw Materials Group, October, 1972.
T . Streyf fer t , Wor ld Pulpwood - A Study i n the Competitive Posi- t ion of Pulpwood i n Dif ferent Forest Regions, ~tockholm' , Almquist and SViksel I, 1968, p. 97.
K . K i lander, ItHow Best to Use Swedish Forests, 11 Pulp and Paper International, Vol. 14 ( J U I ~ 1972), p. 34.
Loc. cit.
Pulp and Paper International, " 1 973 Review Number, 11 Vol. 15 (25 July 1973), p. 7'0.
Loc. c i t .
T. Streyf fer t , Wor ld Pulpwood - A Study of the Competitive Posi t ion of Pulpwood i.n Dif ferent Forest Regions, Stockholm, Almquist and Wiksel I, '1968, p. 98.
/
'Wood requirements for the production of an a i r d r y metr ic ton of bleached k ra f t pulp are as follows:
- average wood density - 385 ki lograms per cubic metre - bleached k ra f t pulp yield - 43 per cent - one ton of a i r d r y pulp i s equivalent to 0.9 tons of oven
d r y pu 1 p
1,000kg x .90 - - 5.4 cubic metres per a i r d r y 385 kg/m3 x .43 metr ic ton o f bleached k ra f t pulp
K. K i lander, !!l-low Best to Use Swedish Forests, Pulp and Paper International, Vol. 14 (July 1 WZ), p. 34.
W. E. Haviland, N. S. Takacsy, E. M. Cape, Trade L ibera l iza- t ion and the Canadian Pulp and Paper Industry, Pr iva te Planning Association gf Canada, Univers i ty of Toronto Press, 1968, p. 1 1 . Based on the consumption of 42,900 gal Ions of water per a i r d r y ton of pulp.
J. W. Walter, "Water Qual i ty Needs i n the Pulp and Paper Indus- try, 1 ' Paper Trade Journal, Vol. 154 (6 July 1970), p. 38.
Estimate by H. A. Simons (internationail Ltd., Consult ing Engineers.
F o r instance, the establishment of new k ra f t pulp m i l l s i s banned i n cer ta in inland areas of Southern Sweden.
Water pol lut ion from the pulp industry consists p r imar i l y of de- barking and screening effluent, pulp par t ic les lost i n washing and other production stages and small amounts of chemicals which are not economical ly feasible to recover.
"Canadian industry Viewpoint on A i r and Water Pollution, Paper Trade Journal, Vol. 154 (6 July 1970), p.38.
Estimate by F. L. C. Reed and Associates Ltd. , Consult ing Economists
Estimates by F. L. C. Reed and Associates Ltd. , Consult ing Econom is t s
High pressure steam gknerated i n a power bo i le r would be re - duced to process pressure i n a steam turbine. E lec t r i c power would be obtained as a byproduct.
Estimate by H. A. Simons (international) Ltd., Consult ing Engi- neers.
Estimate by F. L. C. Reed and Associates Ltd. , Consult ing Economists.
Power generated from bark inealance A i s based on the assump- t ion that close to one half of the f i b re supply del ivered to the hypothetical m i l l i s i n the form of unbarked roundwood and the remainder i n the form of chips. I n Balance B i t i s assumed that 85 per cent of the m i l l ' s f i b re supply i s i n the form of unbarked roundwood and the remainder in chips.
Estimate by F. L. C. Reed and Associates Ltd. , Consult ing Economists. ,
Based on a natural gas heat value of 277 cal./ft . 3
Estimate by F. L. C. Reed and Associates Ltd. , Consult ing Economists.

74. Based on a fuel o i l heat value o f 1 .59 mm~a l / bb l .
75. E. Weinberg, Impact of Technological Change and Automotation
in, Pulp. P. Department of Labour Bul le t in # I 347, Washington, October 1962, p. 1 1 .
76. Estimate by F. L. C. Reed and Associates Ltd. , Consult ing Economists.
77. J.A. Datas Panero, Economic Aspects of the Pu lp and Paper Industry w i th Special Reference to Developing Countries, Economics Department Working Paper #5 1 , lnternat ional Deve l - opment Association, lnternat ional Bank fo r Reconstruction and Development, 1969, p. 34.
78. Based on confidential data obtained from three pulp m i l l feasibi l i ty studies i n Nor th America.
79. Investment costs were lower i n B raz i l than Chi le as a consider- able amount of pulp m i l l equipment i s manufactured i n Braz i l .
80. P r i c e Waterhouse 0 Company, Information Guide for Doing Business i n Braz i l , July 1972, p. 6.
81. Government of B r i t i s h Columbia, The B r i t i s h Columbia Forest Industry, I t s D i rec t and indirect Impact on the Economy, Depart- ment of Lands, Forests and Water Resources, 1973, p. 48.
82. Lindow, H.A., t tBraz i l , " Commerce Today, U. S . Department of Commerce, Vol. 3 (23 July 1973), p. 15.
CHAPTER V I
1 . I f detailed investment decisions were required, more sophisticated techniques would be used to indicate the present value of future revenue and expenditure flows.

Adam, D. G. Wh i le . It Canada Commerce, Department of Industry, Trade 15 Commerce, Vol. 137 ( ~ u l y 1973), pp. 9 - 10.
American Paper Institute. New York, Pulp & Raw
American Paper Institute. 1970 New York, Pulp -9
American Paper Institute. York, June 1972.
&Vood Pulp Stat ist ics. 36th Edit ion, Materials Group, 1972.
Trends i n Wor ld Pu lp Markets, 1937- and Raw Materials Group, 1972.
The Stat is t ics of Paper, 1972. New
Andree, R. C. ItWor ldwide Trends i n Production, Consumption of Fores t Products, Paper. 1 Pulp and Paper, Vol . 47 a arch 1973), pp. 123-127.
Atchison, J. E. 11-Tropica91 Forests and Plantations - Key to Future F ibe r Shortages?" Paper Trade Journal, Vol. 157 (15 January 1973), pp. 34-36.
Bachynski, N. "The Consult ing Engineer 's Role i n S i t e Select ion and Design. " American Paper Industry, Vol . 49 ( ~ e c e m b e r 1967), pp. 38-39.
\
Bergendahl, C. J. YSweden and the Common Market. 1 Svensk T ravaru och Pappersmassedt idninq, 15-1 970, pp. 783-786.
Bi l l ings, R. F. Hosten, E. H. and Gara, R. 1 . "Forest Entomology i n Chile: A n Example of U. 5. -Chilean Cooperation. 11 Journal of Forest ry , Vol. 71 a arch 1973), pp. 164- 165.
Bromley, W.S. "An Overview of Harvest ing and Handling of Pulp- wood: Presented at the TAPPI 24th Engineering Conference, San Francisco; September 1969.
Brown, S . P. "Feasibi l i ty Considerations for an Integrated Pulp and Paper M i l l Pro ject . It Presented at the TAPPI 22nd Engi- neering Conference, Atlanta, September 1967.
Butts, D. W. "Trade Trends i n Four Nordic Countries. Pulp, Paper and Board Quarter ly Report, U.S. Department of Commerce, January 1971, pp. 9 - 13.
Butts, D. W. " LAFTA1s Paper Economy - Progress, Problems, and Potential. Pulp, Paper and Board Quarter1 y Report, LI. S. Department of Commerce, July 1970, pp. 7 - 15.
Canadian Fores t Products lndustry - A Background Study of the lndustry i n a Wor ld Context. Toronto, W . A . Daly and Company, January 196%
Tanad ian lndustry Viewpoint on A i r and Water Pollution. 11 Paper Trade Journal, Vol. 154 (6 July 1970), p. 39.
Canadian Pulp and Paper Association. Reference Tables - 1971, 25th Edit ion, Montreal, August 1971.
Canadian Pulp and Paper Association. The Pulp & Paper lndustry Stat is t ica l Bul let in. Montreal, December 1972.
Carter , R. L. J. The Market fo r Woodpulp - A Global and Regional Study. New York, Prepared by the Economist intelligence Unit, Praeger Special Studies i n International Economics and Develop- ment, F. A. pr2eger Publishers, 1968.
Casasempere, A . "Lat in America - A Market fo r Canadian Forest Products - Potential and Prospects fo r Development. (unpub- l ished Master 's thesis) Univers i ty of B r i t i s h Columbia, Faculty of Forest ry , A p r i l 7 970.
Cauvin, D. M. I1Measurement of a Fores t ' s Contr ibut ion to the Economy of Alberta, 1' (unpublished Doctorate thesis) Univers i ty of Washington, 1972.
Chenoweth, I. B. "Marketing, Manufacturing and Operations. 11
Pulp and Paper Magazine of Canada, Vol. 71 (2 January 1970)~ pp. 25 - 2 6 .
Colpitts, R.R. IEnergy Supply and Ut i l izat ion - S u p p l y / ~ r i c e Relationships. 11 Pu lp and Paper Maqazine of Canada, Vol. 74 No. C a arch 1973), pp. 86 - 90.

Copeland, W- G. !!Can Industry Af ford to Bui Id New Board, Pulp and Paper, Vol . 47 ( ~ a n u a r y 1973), pp. 68 - 70.
Council of Pulp and Paper Producers of Quebec. The Competitive \
Posit ion of the Quebec Pulp and Paper Industry. January 1972.
Datas-Panero, J.A. Economic Aspects of the Pulp and Paper Industry wi th Special Reference to Developing Countries. Economics Department Working Paper #51\ lnternat ional Devel- opment Association, International Bank for Reconstruction and Development, October 1969.
Draeseke, G. L. I1Factors Affecting the Competitive Posit ion of the B. C. Forest Industry. If The Truck Logger, Vol . 28 ( ~ a ~ 1972), pp. 23-24.
Dyck, A. W. J. llFocus of Forest Management and Pulpwood Pro - curement. 1' American Pulp Industry, Vol. 52 ( ~ a n u a r y 1970), pp. 26-29.
Eklund, R. and Kirjasnierhi, M. I1Economic Planning of Forest Industries Integrates. " Paper presented to the U. S. and Canadian Paper M i l l s Executives Vis i t ing Finland, September 1969.
Esta l l , R. C. and Buchanan, R. 0. llndustrial Act iv i ty and Economic Geography. London, Hutchinson Wniversi ty L ib ra ry , 1961.
Food and Agr icu l ture Organization. Fast Growinq T r e e Species of Industr ial Plantations i n Developing Countries. Rome, January 1965.
Food and Agr icu l ture Organization. Notes on Trends i n Ocean Transport of Wood Chips for Pulping. Document Jb-7, Rome, Advisory Committee on Pulp and Paper, 8th Session, May 1967.
F o o d and Agr icu l ture Organization. B r i e f Note on Effluent Treat- ment and Disposal Fac i l i t ies i n the Pulp t3 Paper Industry, Document #5.2, F A 0 Advisory Committee on Pulp 0 Paper, 1968.
u ' ~ o o d and Agr icu l ture Organization. Obstacles Impeding the F low of P r i va te lnvestment to the Pulp and Paper lndustry i n Developing Countries. Document #6 , Rome, Advisory Committee on Pulp and Paper, Sevenih Session, October 1966.

Food and Agr icu ! ture Organization. The 12ole of the Forest Industries i n the Attack on Economic Development. Rome, 1962.
Food and Agr icu l ture Organization. Prospects for Expanding Forest Products Exports from Developing Countries. Prepared by the Fores t ry and Forest Products Div is ion i n cooperation wi th the Regional Economic Comission of the United Nations, February 1964.
Food and Agr icu l ture Organization. Yearbook of Forest Products -
Food and Agr icu l ture Organization. The State of Food and Ag r i - culture 1972. dome, 1972.
Food and Agr icu l ture Organization. F A O t s Work i n the F ie ld of Pulp and Paper. Rome, Advisory Committee on Pulp and Paper, May 1967.
Food and Agr icu l ture Organization. Wood: Wor ld Trends and Prospects. Basic Study #16, Rome, 1967.
Food and Agr icu l ture Organization. La t in American Timber Trends and Prospects. New York, Economic Commission fo r La t in America, 1963.
Food and Agr icu l ture Organization of the United Nations. Pulp and Paper Prospects i n La t in America. New York, 1963.
Food and Agr icu l ture Organization. ! T h e Forests of La t i n America. 11 Paper presented at the Seventh Wor ld Fores t ry Congress, Buenos A i res , October 1972.
Food and Agr icu l ture Organization, United Nations Economic Commission fo r Europe. European Timber Trends and Pros- pects - A New Appraisal 1950-1 975. New York, 1964.
Food and Agr icu l ture Organization, United Nations Economic Commission fo r Europe. European l i m b e r Trends and Pros- pects, 1950-1 980, A n Interim Review. Geneva, May 1969.
Food and Agr icu l ture Organization. The Present and Future Out- look for Chemical Paper Grade Market Pulp. Advisory Committee on Pulp and Paper, Rome, A p r i l 1972.
Food and Agr icu l tu re Organization. Outlook for Pu!p and Paper Consumption, Product ion and Trade to 1985. Advisory Committee on Pulp and Paper, Rome, A p r i l 1972.
Gi l l igan, G. 5. "I-lope and Despair fo r Canada's Industry. Pulp & Paper, Vol. 47 (Apr i l 1973), P a r t 1 , pp. 51 -55.
Government of B r i t i s h Columbia. The B r i t i s h Columbia Forest industry, I ts D i rec t and Indirect Impact on the Economy. Department of Lands, Forests and Qdater Resources, 1973.
Government of B r i t i s h Columbia. Forest Inventory Sta t is t ics of B r i t i s h Columbia - 1970, Victor ia, Forest Serv ice, June 1972.
Government of B r i t i s h Columbia. Financial and Economic Review - lW"i'. Victor ia, Department of Finance, July 1971.
Government of B r i t i s h Columbia. Selected Forest industry Stat is t ics of B r i t i s h Columbia. Victor ia, Department of Industry, Trade and Commerce, July 1972.
Government of B r i t i s h Columbia. The B r i t i s h Columbia Pulp and Paper Industry. Victor ia, Department of lndustr ia l Develop- ment, Trade and Commerce, October 1970.
Government of Canada. Report of the Canadian Pulp and Paper Trade Mission to La t in America. Ottawa, Department of Trade and Commerce, 1967.
Government of New Brunswick. Report of the Industr ial Enquiry commission on the Pulp and Paper lndustry i n New Brunswick. Fredericton, July 1972.
Government of Ontario. The Ontario Forest Industry - I ts D i rec t , and lndirect Contribution to the Economy. Department of Lands
and Forests, A p r i l 1969.
Greenhut, M. Plant Locat ion i n Theory and Pract ice. Chapel Hil I, Universi ty of Nor th Carolina, 1956.
Guthrie, J.A. The Economics of Pulp and Paper. Pullman, Washington State Univers i ty Press, 1950.

Guthrie, J. A. A n Economic Analysis of the Pulp and Paper Industry. Pu l lman, Washington State Cdniversi ty Press, 1972.
Grotterod, K . "Sweden - A formidable Competitor fo r Wor ld Markets. 1 ' Pu lp and Paper Magazine of Canada, Vol . 70 ( 1 7 October l969), pp. 38-40.
Haas, L. IWVorld Trends, Nor thAmer ica P ro f i l e 1973.11 Pulp and Paper, Vo1.,47 (30 June 1973), pp. 109-113.
Hair , D. and Phelps, R. B. The Demand and P r i c e Situat ion for Forest Products 1972-73. U. S. Department of Agr icul ture, Forest Service, Misc. Publication #I 239, July 1973.
Haviland, W. E., Takacsy, N. S. , Cape, E. M. Trade L ibe ra l iza- t ion and the Canadian Pulp and Paper Industry. P r i va te Plan- ning Associat ion of Canada, Univers i ty of Toronto Press, 1968.
Inter-American Development Bank. The Process of Industrial iza- t ion i n La t i n America. Guatemala, A p r i l 1969.
Inter-American Development Bank. Socio-Economic Progress i n La t in America. Washington, Social Progress T rus t Fund, Tenth Annual Report, i 971.
Julson, J.O. llEnvironmental Protect ion - Wow Much W i l l I t Cost Your M i l l ? It Pulp 0 Paper, Vol. 43 (Apr i l 1969), pp. 152-153,
/
, / ~ e i ~ , H. H. "Lat in America Must Surmount Many Obstacles i n Pulp and Paper Growth.
Leach, J. D. l lMechan iz ing Ch l lean Forest ry . l1 Forelqn Trade, ~ ~ 1 , 1 3 3 (13 June 1970), pp. 28 -29 . ,
Lindow, H.A. w B r a z i l . It Commerce Today, U.S. Department of Commerce, Vol. 3 (23 J u l y 1973), pp. 15 - 16.
Lussier, L. J. l lHow Quebec Can Make Bet ter Use of Forest Resources. f 1 C a n a d i a n P u l p and Paper Industry, Vol. 23 a arch 19701, pp. 33 - 36.
Marsh, R. IfShould Y o u r New M i l l Generate E lec t r j c Power? 1' Pulp and Paper, Vol. 43 ( ~ u n e l969), pp. 78 - 79. \
ttMaximum P r o d u c t i o n f r om L im i t ed Resources - Secret of Resource- ful Swedes. It P u l p and Paper Magazine of Canada, Vol. 70 (17 October 1969) pp. 46 - 48.
Michaud, R. W. T h e P a p e r lndustry - A Question of Liquidi ty. Paine, Webbe r , Jackson and C u r t i s lndustry Review, September 1970.
Mossberg, E. ! T h e F o r e s t lndustry Today and Tomorrow. l1 Sup- plement to Index, Svenska Handelsbankenls Economic Review #7, i 968.
Nicholson, G. W. E. l l P u l ~ m a k i n g Costs, 11 Pulp and Paper Interna- tional, Vo l . 7 ( ~ a n u a r y 1965), pp. 44-48.
Nicholas, J.E. It7-he EconomicAspectsofSi teSelect ionandPlant Layout. If P r e s e n t e d a t the TAPPl 24th Engineering Conference, San F r a n c i s c o , September 1969.
Organization f o r E c o n o m i c Co-operation and Development. Advanced Pol l ut i o n Abatement Technologv i n the Pulp and Paper Industry. Par is, Env i ronment Directorate, 1972.
P r i c e Waterhouse & Company. Information Guide fo r Doing Busi- ness i n B r a z i l . J u l y 1972.
Ritchie, J. L. l lDeve lopments in the Industry i n the F a r East and Thei r E f f e c t in N o r t h Amer ica. Paper Trade Journal, Vol. 154 (27 July 1970), pp. 44-47 .
i Ritchie, J. L. lfOverseas Developments i n Pulp and Paper. 1 1
Successful Marlceting at t?ome and Abroad, proceedings of the 7th Annual Forest Industries Marketing Conference, ed. S. LI. Rich, Univers i ty of Oregon,' 1970, pp. 74 - 84.
Robb, G.A. !Energy Supply and Ut i l izat ion - Cost Reduction, Conservation. Pulp and Paper Magazine of Canada, Vol. 74 No. C arch 1973), pp. 82 - 85.
Sartor ius, P. and Henle, H. Fores t ry and Economic Development, N ~ \ N York, Praeger Special Studies i n international Economics, F. A . Praeger Publishers, 1968.
Saukkonen, S. M. IIAnalysing Europe's Paper Industry, Future Direct ions and Trends. Pulp and Paper International, Vol . 14 (October 1972), pp. 47 - 49.
Scott, C. W. Pinus Radiata. Rome, Food and Agr icu l tu re Organi- zation, 1960.
Si lversides, C. R. !tL'Vood Costs are S t i l l Increasing S o Strong Support Must ' ~ e Given to Mechanization i n the 70's. 1 1 Pulp and Paper Magazine of Canada, Vol. 71 ( 2 January 1970), pp. 28 - 29.
Southern Forest Institute. Economic Analysis of the Southts Pulp and Paper Industry. Atlanta, December 1971.
Southern Forest.Resource Analysis Committee. The South's T h i r d Forest . 1969.
Sowers, L. W. !!Labour Costs Abroad. 1 1 Paper presented at the American Associat ion of Cost Engineers Annual Meeting, Los Angeles,. 1965.
Speir , Vd. B. !!Are You Su re You Picked the Right S i t e ? ! Southern Pulp and Paper Manufacturer, Vol. ( 1 0 September 1964), I
PP
Squires, M. F. "Fast Growing T rees and Intensive Fores t ry i n Newfound1 and. Pulp and Paper Magazine of Canada, Vol . 73 (~ep tember 1 WZ), pp. 124 - 126.
Sternitzke, H. S. and Christopher, J. F. !!The South: Timber Growth, Trends, Outlook. 1 1 Pulp and Paper, Vol. 73 ( ~ e b r u a r y 1973), pp. 75-78.
Streyf fer t , T . Wor ld Pulpwood - A Study i n the Competitive Posi- t ion of Pulpwood i n Dif ferent Forest Zegions. Stockholm, Almquist and 'JViksel I, 1968.
Sundel in, A. Pulp and Paper Prospects i n Western Europe. A Study by the FA0 Secretar iat, Munich, E L V Ver l agsgesel l schaft, 1963.
Svendsrud, A., ed. Readings i n Forest Economics. Oslo, Nordic Forest Economic Seminar, Universitetsforlaget, 1969.
Theberge, P. A. I1Brazi 1 . l1 Canada Commerce, Department of Industry, Trade and Commerce, Vol. 137 ( ~ u l y 1973), pp. 6 - 0.
Ticoulat, G. J. Fo res t r y investment from Industry 's Point of View. Madrid, Sexto Congress Forestal Mundial, June 1966.
Treleaven, J. H. I tBrazi l . 1' Canada Commerce, Vol. 136 (~ep tember 1 972), pp. 13 - 14.
United Nations. Manual o,n Economic Development Projects. New York, 1958.
Qni tec! Nations. Processes and Problems of Industrial izatior; In Under-Developed Countries. New York, Department of Economic and Social Af fa i rs , 1955.
United Nations. Chi le - Potential Pulp and Paper Exporter. Santiago, Pulp and Paper Advisory Group for La t i n America, 1957.
U.S. Department of Agr icul ture. The Outlook for Timber i n the United States. Forest Resource Report #20, Washington, Forest Service, 1973.
U. S. Department of Agr icul ture. Forest Stat is t ics for the United States by State and Reqion. Forest Service, 1972.
U. S . Department of Agr icul ture. Trends i n Pulpwood Pr i ces i n the Southeast, 1962-69, Forest Serv ice Research Note SE-137, Southeastern Forest Experiment Station, October, 1970.
Wallace, J. C. llSelf Sufficiency i n Pulp and Paper i s Aim of La t in American Nations. Pulp and Paper International, Vol. 14 (March 1972), pp. 44 - 45.

Wallace, J. C. "How La t in Arnericans Look at Wood. If Forest Industries, Vol. 99 ( ~ e b r u a r y 1972), p.21.
a l t e r . . Wdater Quality Needs i n the Pu lp and Paper Industry. Paper Trade Journal, Vol. 154 (6 July 1 WO), p. 38.
Weinberg, E. Impact of Technological Chancle and Automation i n the Pulp and Paper Industry. Washington, 14. S. Department of Labour Bu l le t in #1347, October 1962.
Westoby, J.C. tlWorld Forest Development: Markets, Men, and Methods. H. R. MacMi l Ian Lectureship Address, Universi ty of B r i t i sh Columbia, 1965.
l iamson, D. F. I1Site Evaluation and Selection. 11 presented at the TAPPI 22nd Engineering Conference, Atlanta, September 1 967.
son, A. W. l lPrices - Most U. S . Pulp Regains Permitted Levels. 11
Pulp and Paper, Vol. 47 ( ~ a n u a r y 1973), p. 13.
Wilson, W . B. l lElectr ic Power Generation - A Prof i table Invest- ment for the Pulp and Paper Industry. 1' presented at the 23rd TAPQ! Engineering Conference, November 1 968.
Wood, J.M. ~~ i la rdwood: I ts Effect on the Pulp Industry. 11 American Pulp Industry, Vol. 52 ( ~ a n u a r y 1970), pp. 30- 32.
Zivnuska, J. A. United States Timber Resources i n a Wor ld Economy. Maryland, Resources for the Future Inc., John Hopkins Press, 1967.
Zivnuska, J.A. "Socio-economic Factors Shaping the Future of Fores t ry i n North America. 11 Paper presented at the Future of Fores t ry Symposium, Universi ty of B r i t i s h Columbia, November, 1971.
Related Documents