A Closer Look at Topgolf’s Compelling Value Creation Potential November 2020 1

Welcome message from author
This document is posted to help you gain knowledge. Please leave a comment to let me know what you think about it! Share it to your friends and learn new things together.
Transcript

A Closer Look at Topgolf’s
Compelling Value Creation Potential
November 2020
1
Forward-Looking Statements
This communication contains forward-looking statements within the meaning of Section 27A of the Securities Act of 1933, as amended, and Section 21E of the Securities Exchange Act of 1934, as amended. The words “may,” “should,” “will,” “could,” “would,” “anticipate,” “plan,”
“believe,” “project,” “estimate,” “expect,” “strategy,” “future,” “likely,” and similar expressions, among others, generally identify forward-looking statements, which speak only as of the date the statements were made and are not guarantees of future performance. Such forward-
looking statements include, but are not limited to, statements about the benefits of the business combination transaction involving Callaway and Topgolf, including the anticipated operations, financial position, liquidity, performance, prospects or growth and scale opportunities of
Callaway, Topgolf or the combined company, the strategies, prospects, plans, expectations or objectives of management of Callaway or Topgolf for future operations of the combined company, any statements regarding the approval and closing of the merger, including the need
for stockholder approval and the satisfaction of closing conditions, and statements of belief and any statement of assumptions underlying any of the foregoing.
Forward-looking statements involve known and unknown risks, uncertainties and other factors that may cause our actual results, performance or achievements to be materially different from any future results, performance or achievements expressed or implied by the forward-
looking statements. These risks, uncertainties and other factors relate to, among others: risks and uncertainties related to our pending merger with Topgolf, including the failure to obtain, or delays in obtaining, required stockholder approval or regulatory approval, the risk that such
approval may result in the imposition of conditions that could adversely affect Callaway or the expected benefits of the proposed transaction, any termination fee that may be payable by Callaway pursuant to the terms of the merger agreement, or the failure to satisfy any of the
closing conditions to the proposed transaction on a timely basis or at all; costs, expenses or difficulties related to the merger with Topgolf, including the integration of the Topgolf business; failure to realize the expected benefits and synergies of the proposed transaction in the
expected timeframes or at all; the potential impact of the announcement, pendency or consummation of the proposed transaction on relationships with Callaway’s and/or Topgolf’s employees, customers, suppliers and other business partners; the risk of litigation or regulatory
actions to Callaway and/or Topgolf; inability to retain key personnel; changes in legislation or government regulations affecting Callaway and/or Topgolf; uncertainty of the duration, scope and impact of COVID-19; a further spread or worsening of COVID-19; any further regulatory
actions taken in response to COVID-19, including the future shutdown of or restrictions on Callaway’s or Topgolf’s retail locations, venues, distribution centers, manufacturing plants or other facilities; the effectiveness of Callaway’s or Topgolf’s protective gear, social distancing
guidelines, and other preventive or safety measures; disruptions to business operations of Callaway and Topgolf as a result of COVID-19, including disruptions to business operations from travel restrictions, government-mandated or voluntary shut-down orders or quarantines, or
voluntary “social distancing” that affects employees, customers and suppliers; continued growth, momentum and opportunities in the golf industry; production delays, closures of manufacturing facilities, retail locations, warehouses and supply and distribution chains; staffing
shortages as a result of remote working requirements or otherwise; uncertainty regarding global economic conditions, particularly the uncertainty related to the duration and impact of the COVID-19 pandemic, and related decreases in customer demand and spending; and
economic, financial, social or political conditions that could adversely affect Callaway, Topgolf or the proposed transaction.
The foregoing list is not exhaustive. For additional information concerning these and other risks and uncertainties that could affect these statements, the golf industry, and Callaway’s business, see Callaway’s Annual Report on Form 10-K for the year ended December 31, 2019 as
well as other risks and uncertainties detailed from time to time in Callaway’s reports on Forms 10-Q and 8-K subsequently filed with the SEC, including the proxy statement/prospectus/consent solicitation that will be included in the registration statement on Form S-4 that will be
filed with the SEC in connection with the proposed transaction. Readers are cautioned not to place undue reliance on these forward-looking statements, which speak only as of the date hereof. Callaway undertakes no obligation to republish revised forward-looking statements to
reflect events or circumstances after the date hereof or to reflect the occurrence of unanticipated events.
Regulation G
In addition, in order to assist you with period-over-period comparisons on a consistent and comparable basis, today’s presentation includes certain non-GAAP information. With respect to Callaway Golf Company, this information excludes certain non-cash amortization of
intangibles and other assets related to the Company’s acquisitions, non-recurring transaction and transition costs associated with the acquisition of Jack Wolfskin, including banker's fees, legal fees, consulting and travel expenses, audit fees and valuations services, as well as
non-cash charges related to the valuation of acquired inventory, in addition to other non-recurring advisory fees, and non-cash amortization of the debt discount related to the Company’s convertible notes. With respect to Topgolf International, Inc., this information excludes certain
venue closure costs, a regulatory settlement reserve, the remeasurement of a contingent earnout obligation, non-recurring consulting and legal expenses and the remeasurement of a stock-warrant liability. This non-GAAP information may include non-GAAP financial measures
within the meaning of Regulation G. These non-GAAP measures should not be considered as a substitute for any measure derived in accordance with GAAP. The non-GAAP information may also be inconsistent with the manner in which similar measures are derived or used by
other companies. Management uses such non-GAAP information for financial and operational decision-making purposes and as a means to evaluate period-over-period comparisons and in forecasting the Company’s business going forward. Management believes that the
presentation of such non-GAAP information, when considered in conjunction with the most directly comparable GAAP information, provides additional useful comparative information for investors in their assessment of the underlying performance of the Company’s business with
regard to these items. The Company has provided reconciliations of such non-GAAP financial measures to the most directly comparable financial measures prepared in accordance with GAAP. The reconciliations are included in this presentation, which is available on the Investor
Relations section of the Company’s website located at http://ir.callawaygolf.com/.
Additional Information and Where You Can Find It
Callaway Golf Company will file with the SEC a registration statement on Form S-4, which will include the proxy statement of Callaway Golf Company that also constitutes a prospectus of Callaway Golf Company and a consent solicitation statement of Topgolf International, Inc.
(the “proxy statement/prospectus/consent solicitation”). INVESTORS AND STOCKHOLDERS ARE URGED TO CAREFULLY READ THE PROXY STATEMENT/PROSPECTUS/ CONSENT SOLICITATION, AND OTHER RELEVANT DOCUMENTS TO BE FILED WITH THE SEC,
IN THEIR ENTIRETY WHEN THEY BECOME AVAILABLE BECAUSE THEY WILL CONTAIN IMPORTANT INFORMATION ABOUT CALLAWAY GOLF COMPANY, TOPGOLF INTERNATIONAL, INC., THE PROPOSED TRANSACTION AND RELATED MATTERS. Investors and
stockholders will be able to obtain free copies of the proxy statement/prospectus/consent solicitation and other documents filed with the SEC by the parties through the website maintained by the SEC at www.sec.gov. In addition, investors and stockholders will be able to obtain
free copies of the proxy statement/prospectus/consent solicitation and other documents filed with the SEC on Callaway’s website at https://www.callawaygolf.com (for documents filed with the SEC by Callaway).
No Offer or Solicitation
This communication is for information purposes only and is not intended to and does not constitute an offer to sell or the solicitation of an offer to subscribe for or buy or an invitation to purchase or subscribe for any securities or the solicitation of any vote in any jurisdiction
pursuant to the proposed transaction or otherwise, nor shall there be any sale, issuance or transfer of securities in any jurisdiction in contravention of applicable law. No offer of securities shall be made except by means of a prospectus meeting the requirements of Section 10 of
the Securities Act of 1933, as amended.
Participants in the Solicitation
Callaway, Topgolf, and their respective directors and executive officers may be deemed to be participants in the solicitation of proxies from the stockholders of Callaway in connection with the proposed transaction. Information regarding the persons who are, under the rules of the
SEC, participants in the solicitation of the stockholders of Callaway and Topgolf, respectively, in connection with the proposed transaction, including a description of their direct or indirect interests, by security holdings or otherwise, will be set forth in the proxy
statement/prospectus/consent solicitation when it is filed with the SEC. Information regarding Callaway’s directors and executive officers is contained in Callaway’s Annual Report on Form 10-K for the year ended December 31, 2019 and its Revised Definitive Proxy Statement on
Schedule 14A, dated March 27, 2020, which are filed with the SEC and can be obtained free of charge from the sources indicated above.
DISCLAIMER
2
TODAY’S AGENDA
3
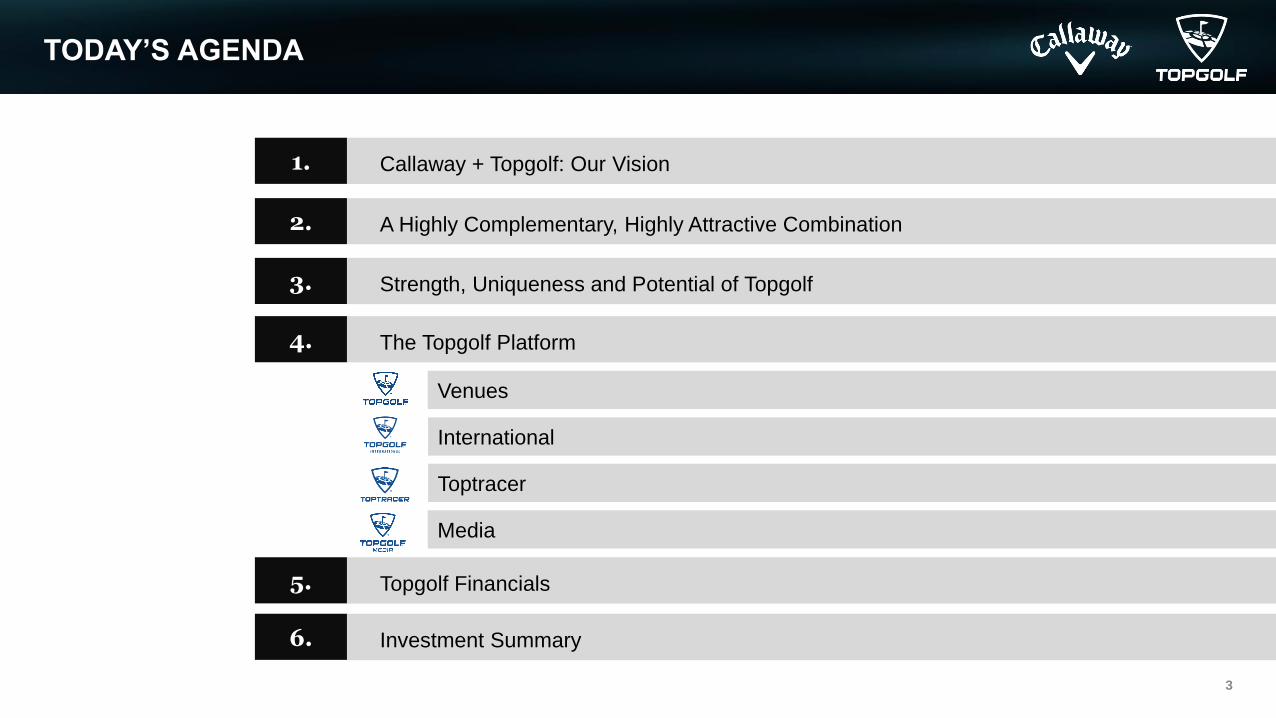
1. Callaway + Topgolf: Our Vision
2. A Highly Complementary, Highly Attractive Combination
3. Strength, Uniqueness and Potential of Topgolf
4. The Topgolf Platform
Venues
International
Toptracer
Media
5. Topgolf Financials
6. Investment Summary
TODAY’S PRESENTERS
4
WILLIAM DAVENPORT
Chief Financial Officer
CRAIG KESSLER
Chief Operating Officer
Venues
GENIFER GRAY
VP of Operations
DOLF BERLE
Chief Executive Officer
CHRIS CALLAWAY
Chief Development
Officer
BEN SHARPE
President Toptracer
CHIP BREWER
Chief Executive Officer
BRIAN LYNCH
EVP, Chief Financial
Officer
STEVE LANE
Vice-President
International Strategy
and Franchise
Management

CALLAWAY + TOPGOLF = A NEW TYPE OF GOLF COMPANY
5
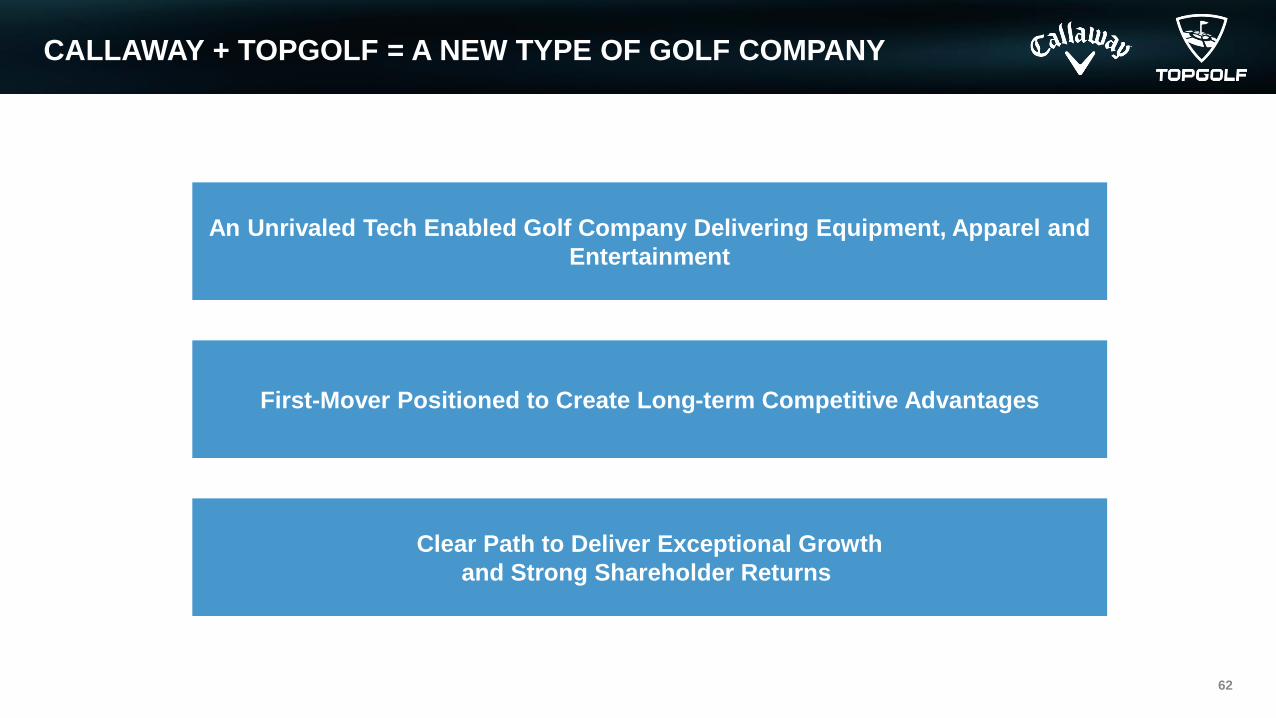
Clear Path to Deliver Exceptional Growth
and Strong Shareholder Returns
An Unrivaled Tech Enabled Golf Company Delivering Equipment, Apparel and
Entertainment
First-Mover Positioned to Create Long-term Competitive Advantages
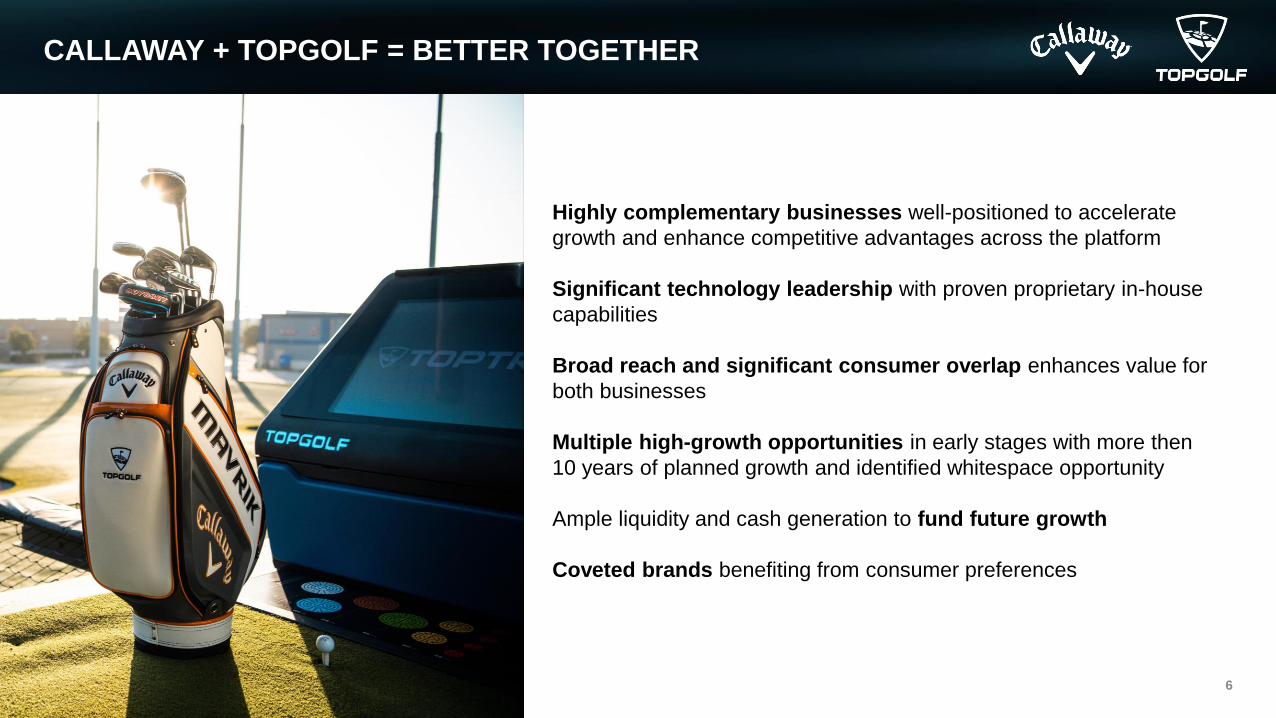
CALLAWAY + TOPGOLF = BETTER TOGETHER
6
Highly complementary businesses well-positioned to accelerate
growth and enhance competitive advantages across the platform
Significant technology leadership with proven proprietary in-house
capabilities
Broad reach and significant consumer overlap enhances value for
both businesses
Multiple high-growth opportunities in early stages with more then
10 years of planned growth and identified whitespace opportunity
Ample liquidity and cash generation to fund future growth
Coveted brands benefiting from consumer preferences
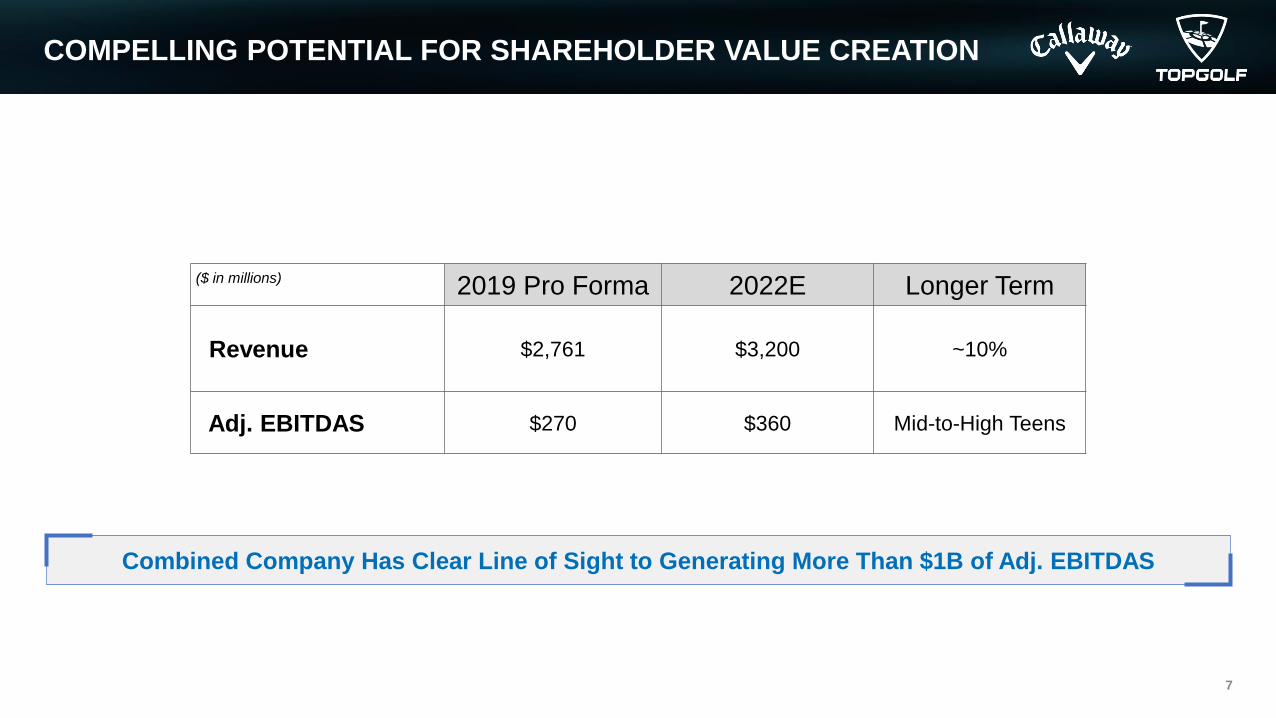
COMPELLING POTENTIAL FOR SHAREHOLDER VALUE CREATION
7
($ in millions) 2019 Pro Forma 2022E Longer Term
Revenue $2,761 $3,200 ~10%
Adj. EBITDAS $270 $360 Mid-to-High Teens
Combined Company Has Clear Line of Sight to Generating More Than $1B of Adj. EBITDAS
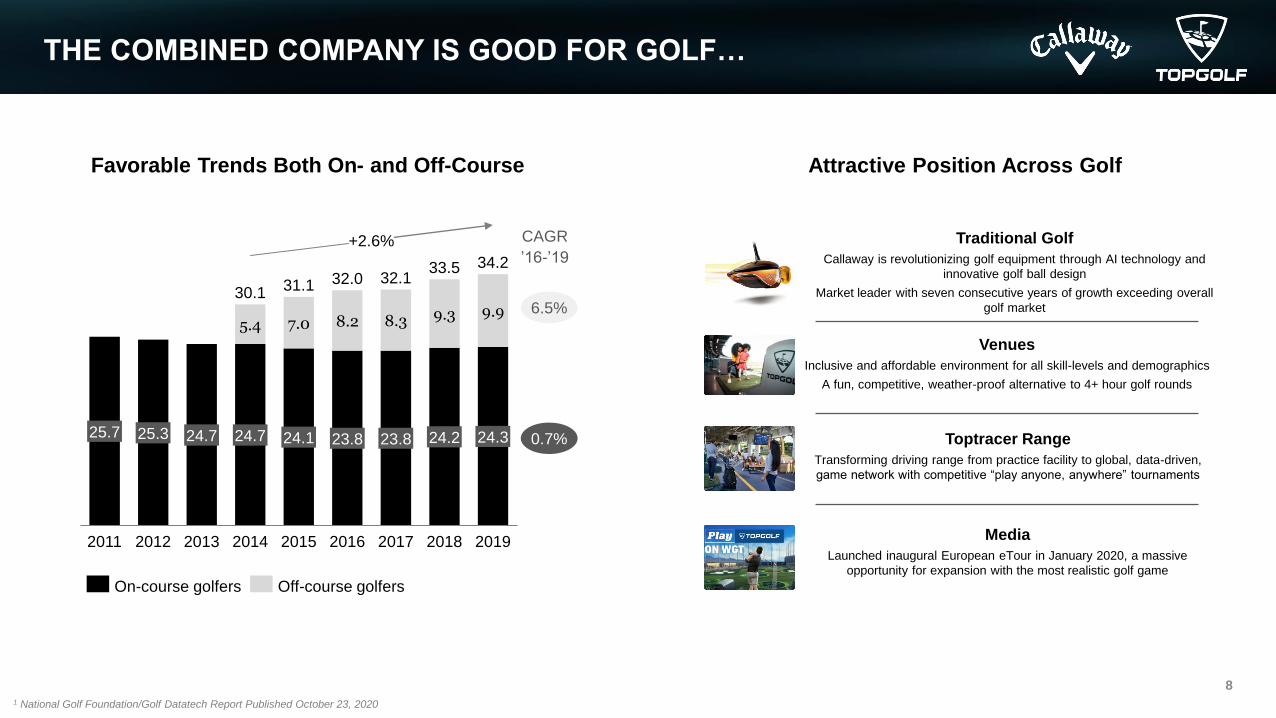
THE COMBINED COMPANY IS GOOD FOR GOLF…
8
5.4 7.0 8.2 8.3 9.3 9.9
20182017
24.7
2019
24.725.3 24.3
20122011 2013
25.7 24.2
2014
24.1
2016
23.8
2015
23.8
+2.6%
On-course golfers Off-course golfers
CAGR
’16-’19
6.5%
0.7%
30.132.0
34.2
31.1 32.133.5
Media
Launched inaugural European eTour in January 2020, a massive
opportunity for expansion with the most realistic golf game
Attractive Position Across Golf
Venues
Inclusive and affordable environment for all skill-levels and demographics
A fun, competitive, weather-proof alternative to 4+ hour golf rounds
Toptracer Range
Transforming driving range from practice facility to global, data-driven,
game network with competitive “play anyone, anywhere” tournaments
Traditional Golf
Callaway is revolutionizing golf equipment through AI technology and
innovative golf ball design
Market leader with seven consecutive years of growth exceeding overall
golf market
Favorable Trends Both On- and Off-Course
1 National Golf Foundation/Golf Datatech Report Published October 23, 2020
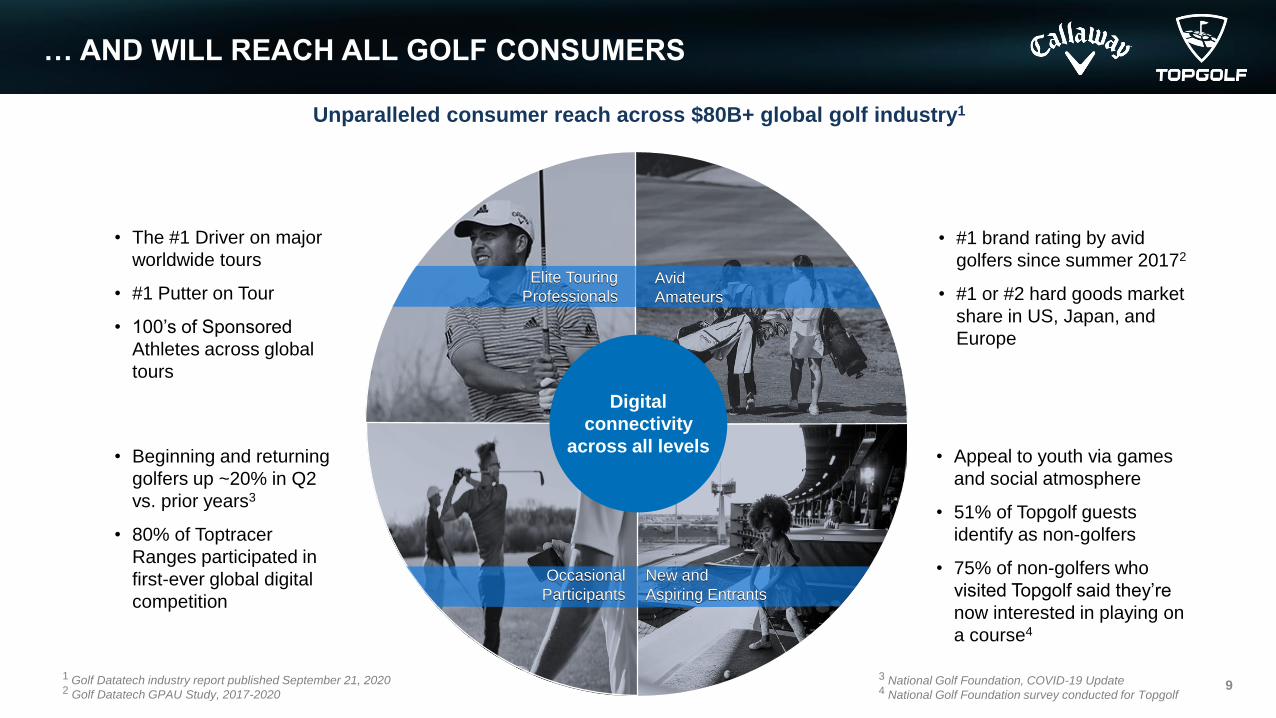
• Appeal to youth via games
and social atmosphere
• 51% of Topgolf guests
identify as non-golfers
• 75% of non-golfers who
visited Topgolf said they’re
now interested in playing on
a course4
… AND WILL REACH ALL GOLF CONSUMERS
9
• The #1 Driver on major
worldwide tours
• #1 Putter on Tour
• 100’s of Sponsored
Athletes across global
tours
• #1 brand rating by avid
golfers since summer 20172
• #1 or #2 hard goods market
share in US, Japan, and
Europe
1 Golf Datatech industry report published September 21, 20202 Golf Datatech GPAU Study, 2017-2020
• Beginning and returning
golfers up ~20% in Q2
vs. prior years3
• 80% of Toptracer
Ranges participated in
first-ever global digital
competition
Unparalleled consumer reach across $80B+ global golf industry1
Digital
connectivity
across all levels
Digital
connectivity
across all levels
Digital
connectivity
across all levels
New and
Aspiring Entrants
Elite Touring
ProfessionalsAvid
Amateurs
3 National Golf Foundation, COVID-19 Update4 National Golf Foundation survey conducted for Topgolf
Occasional
Participants
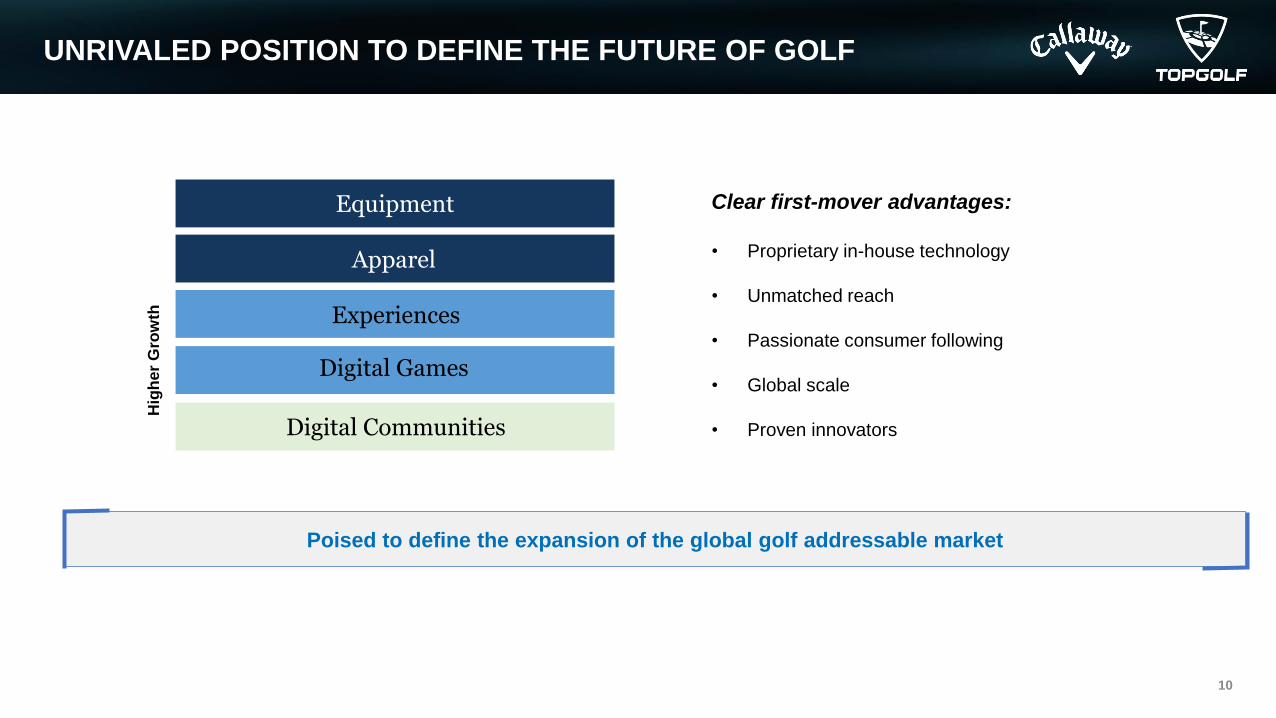
UNRIVALED POSITION TO DEFINE THE FUTURE OF GOLF
10
Poised to define the expansion of the global golf addressable market
Equipment
Apparel
Experiences
Digital Games
Digital Communities
Clear first-mover advantages:
• Proprietary in-house technology
• Unmatched reach
• Passionate consumer following
• Global scale
• Proven innovators
Hig
he
r G
row
th
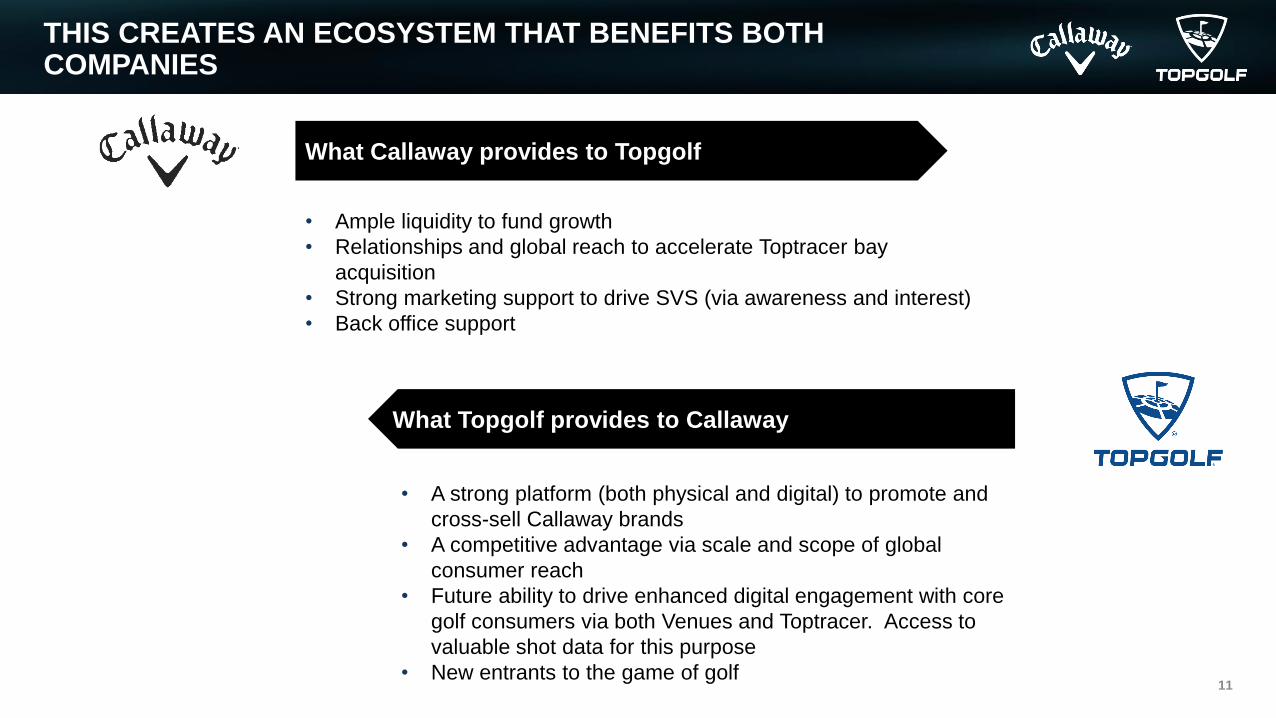
THIS CREATES AN ECOSYSTEM THAT BENEFITS BOTH COMPANIES
What Callaway provides to Topgolf
• Ample liquidity to fund growth
• Relationships and global reach to accelerate Toptracer bay
acquisition
• Strong marketing support to drive SVS (via awareness and interest)
• Back office support
What Topgolf provides to Callaway
• A strong platform (both physical and digital) to promote and
cross-sell Callaway brands
• A competitive advantage via scale and scope of global
consumer reach
• Future ability to drive enhanced digital engagement with core
golf consumers via both Venues and Toptracer. Access to
valuable shot data for this purpose
• New entrants to the game of golf11
IBDROOT\PROJECTS\IBD-NY\PUTPUT2019\638473_1\Presentations\2020\2020.11.6 - Peer Information\Pro Forma
Peers_v11.pptx
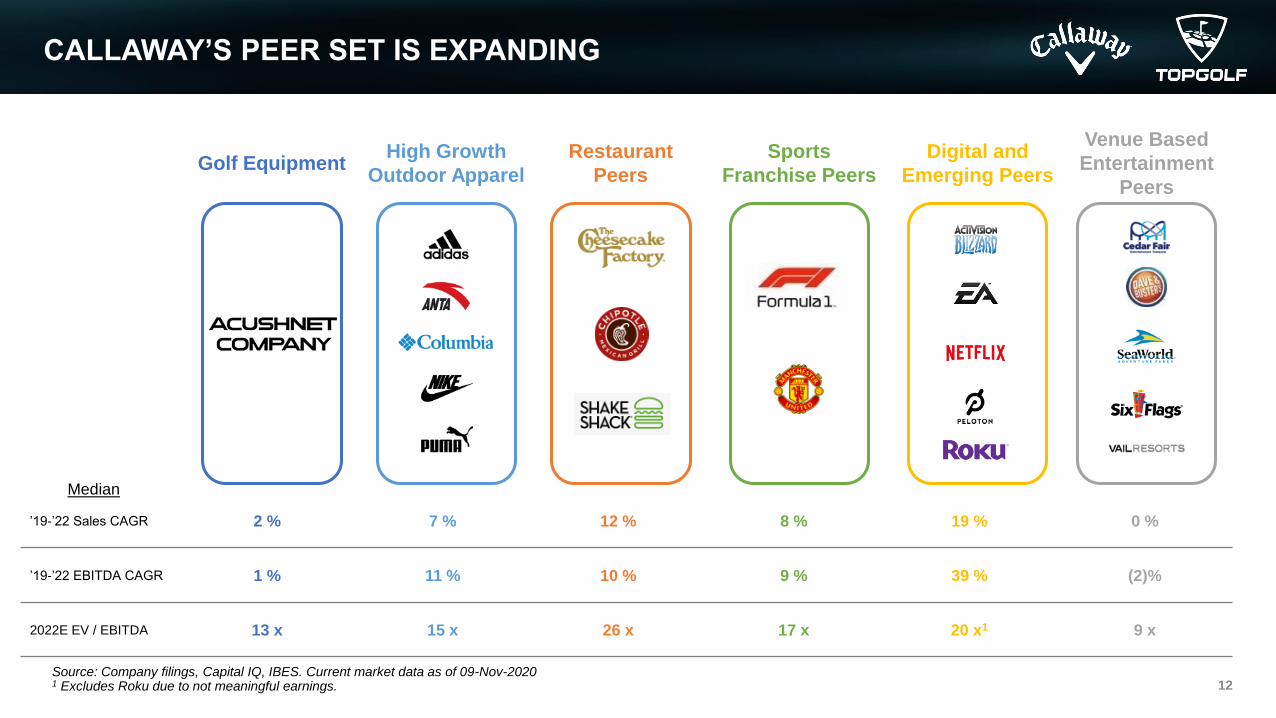
CALLAWAY’S PEER SET IS EXPANDING
12Source: Company filings, Capital IQ, IBES. Current market data as of 09-Nov-20201 Excludes Roku due to not meaningful earnings.
Restaurant
Peers
Sports
Franchise Peers
High Growth
Outdoor Apparel
Digital and
Emerging Peers
Venue Based
Entertainment
Peers
Golf Equipment
’19-’22 Sales CAGR 2 % 7 % 12 % 8 % 19 % 0 %
’19-’22 EBITDA CAGR 1 % 11 % 10 % 9 % 39 % (2)%
2022E EV / EBITDA 13 x 15 x 26 x 17 x 20 x1 9 x
Median

13
TEG Overview
DOLF BERLE
Chief Executive Officer
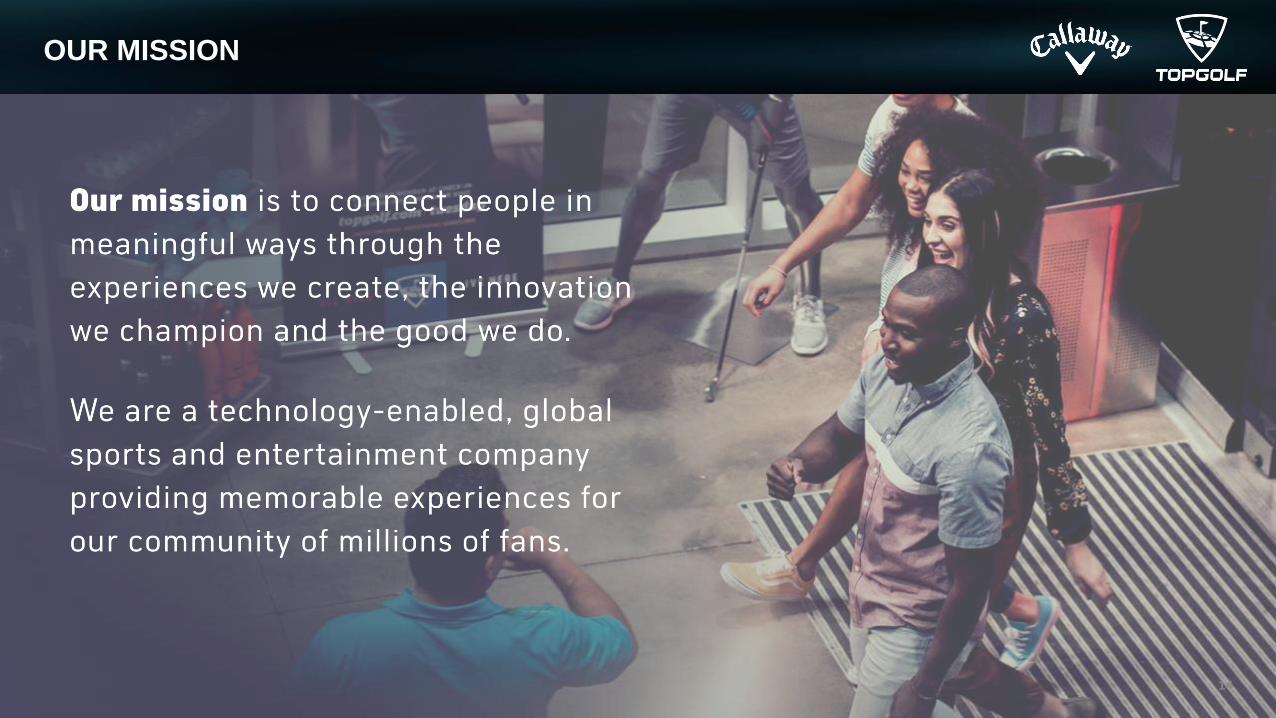
OUR MISSION
14
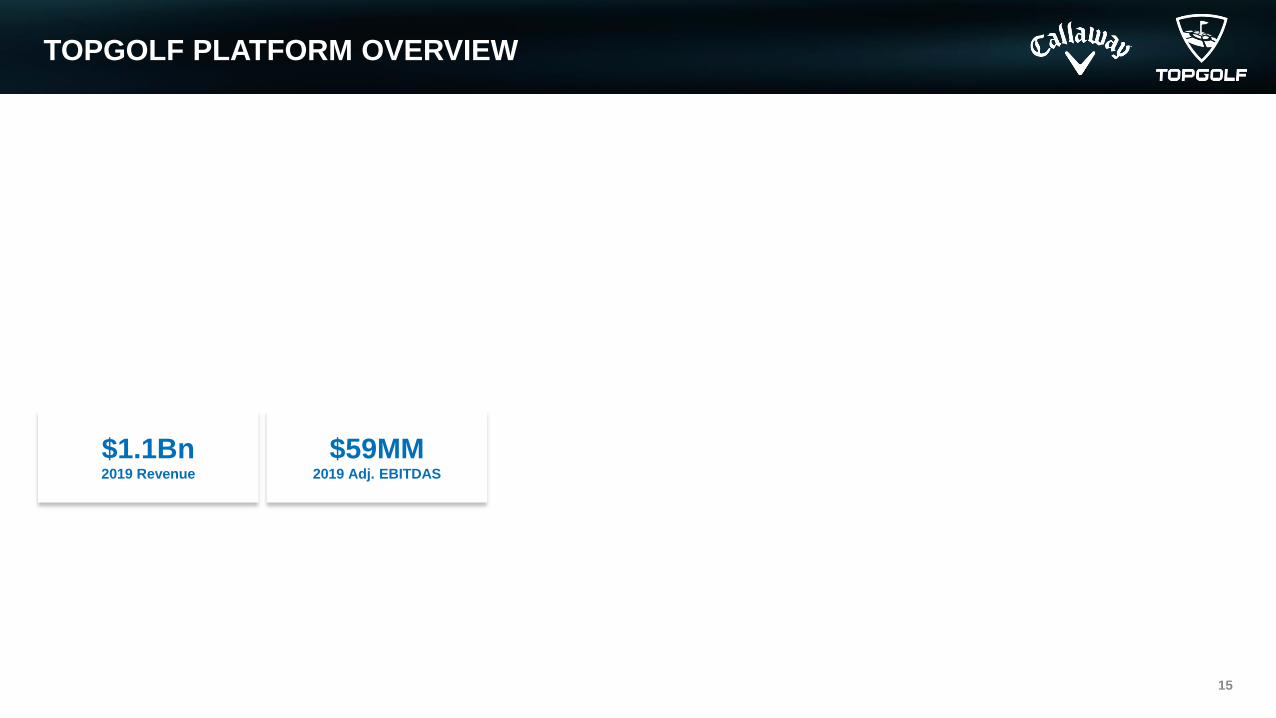
TOPGOLF PLATFORM OVERVIEW
15
$1.1Bn2019 Revenue
$59MM2019 Adj. EBITDAS
30%2017-2019 Revenue CAGR
$1Bn+Long-Term Business Unit
Adjusted EBITDAS
Opportunity
World Golf Tour with 30MM members as of today
In-house game development
Sponsorships with large global brands
58 US venues
21% annual growth in venues from 2017-2019
23MM total venue visits
200 venue total addressable market
7,500+ bays using our proprietary games technology
16x increase in bay count from 2017 to today
140 tournaments broadcasts reaching 500MM+ viewers
Broad global appeal outside the US
5 venues open (3 owned & operated, 2 franchised)
250 venue total addressable market internationally
VENUES
100MM+Fan Touchpoints
51%of Venue Guests are Non-
Golfers
94%of Guests Say
They are Likely or
Highly Likely to Return
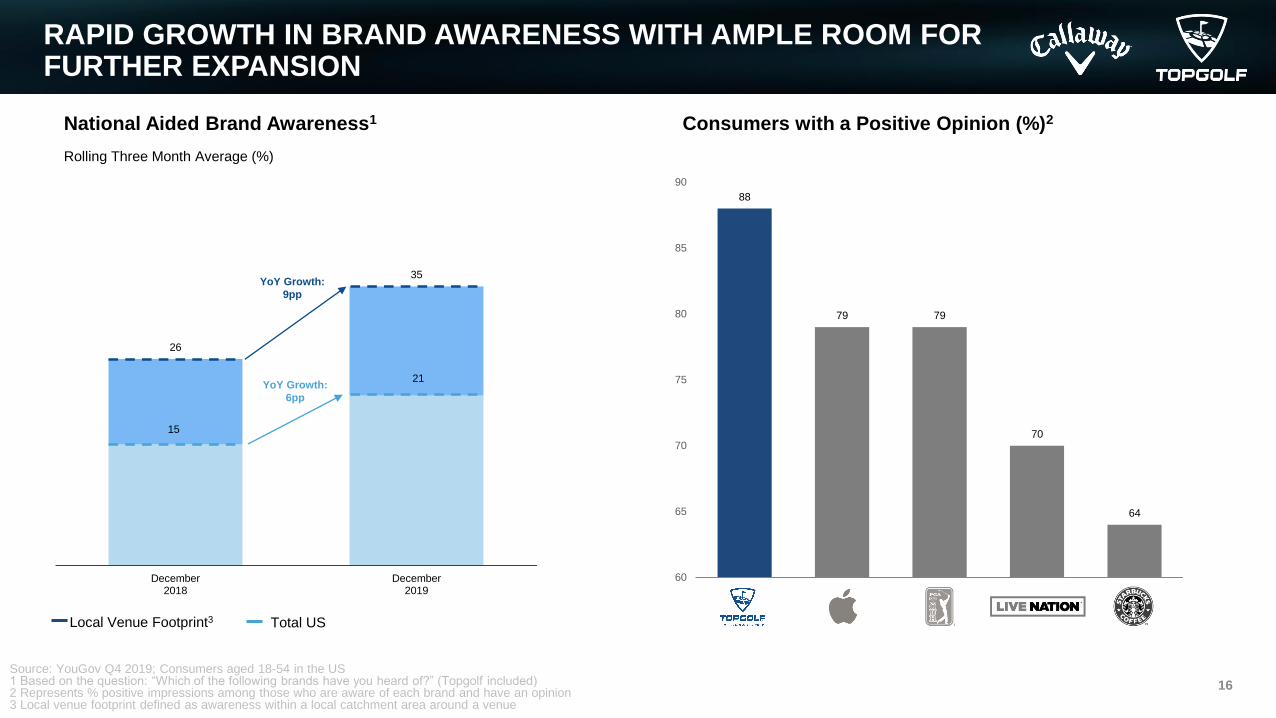
RAPID GROWTH IN BRAND AWARENESS WITH AMPLE ROOM FOR FURTHER EXPANSION
16
15
21
26
35
December2018
December2019
Local Venue Footprint3
National Aided Brand Awareness1
Rolling Three Month Average (%)
Total US
YoY Growth:
9pp
YoY Growth:
6pp
88
79 79
70
64
60
65
70
75
80
85
90
Consumers with a Positive Opinion (%)2
Source: YouGov Q4 2019; Consumers aged 18-54 in the US1 Based on the question: “Which of the following brands have you heard of?” (Topgolf included)2 Represents % positive impressions among those who are aware of each brand and have an opinion3 Local venue footprint defined as awareness within a local catchment area around a venue
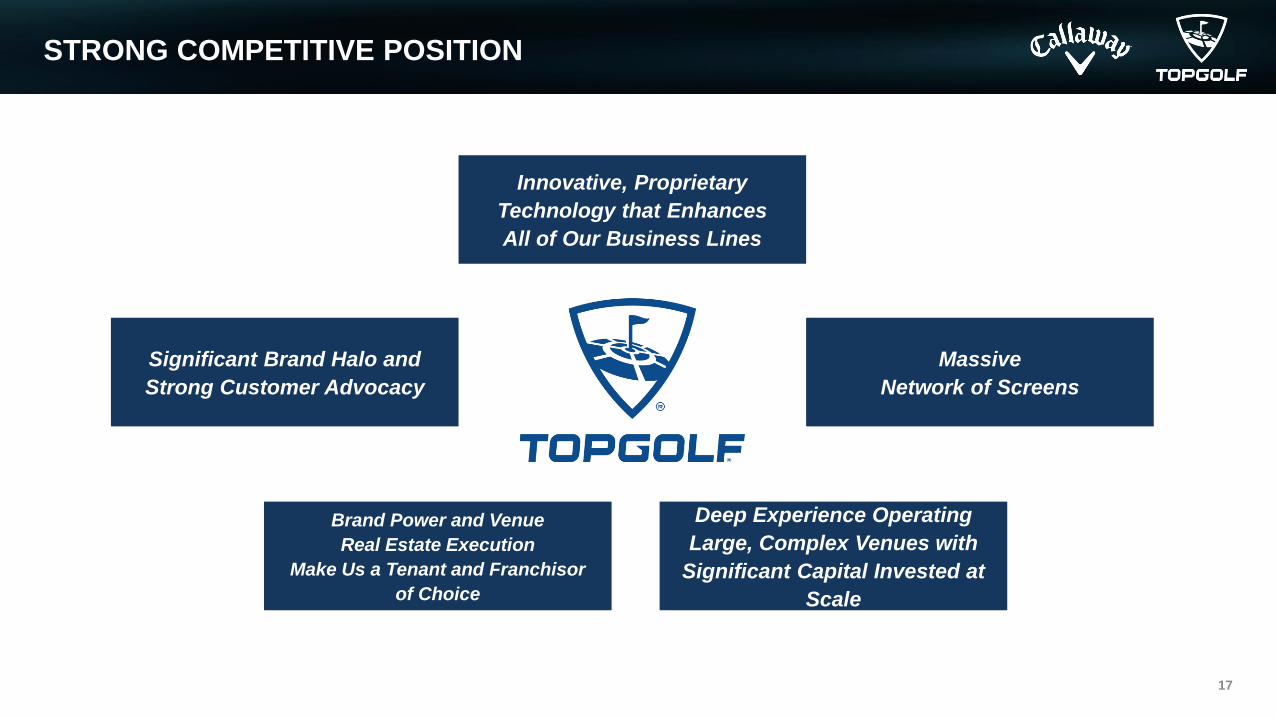
STRONG COMPETITIVE POSITION
17
Deep Experience Operating
Large, Complex Venues with
Significant Capital Invested at
Scale
Significant Brand Halo and
Strong Customer Advocacy
Innovative, Proprietary
Technology that Enhances
All of Our Business Lines
Brand Power and Venue
Real Estate Execution
Make Us a Tenant and Franchisor
of Choice
Massive
Network of Screens
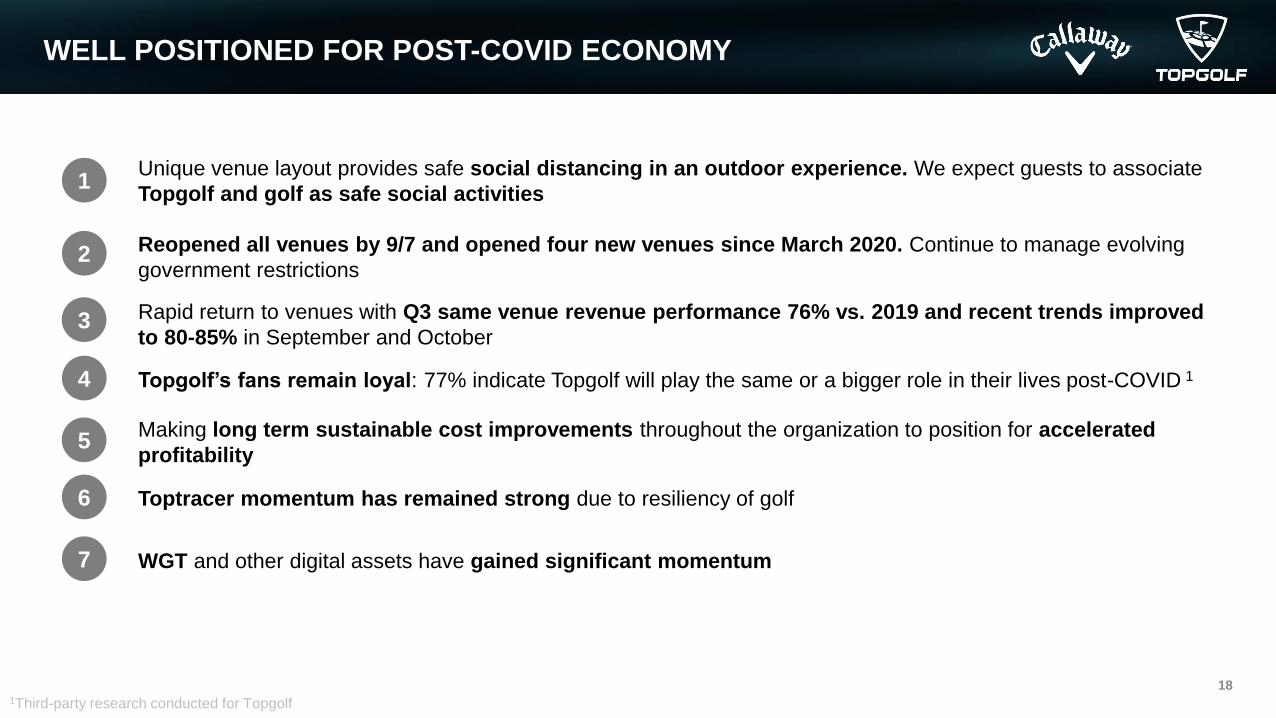
WELL POSITIONED FOR POST-COVID ECONOMY
18
1
2
3
4
5
7
6
Reopened all venues by 9/7 and opened four new venues since March 2020. Continue to manage evolving
government restrictions
Unique venue layout provides safe social distancing in an outdoor experience. We expect guests to associate
Topgolf and golf as safe social activities
Topgolf’s fans remain loyal: 77% indicate Topgolf will play the same or a bigger role in their lives post-COVID 1
Toptracer momentum has remained strong due to resiliency of golf
WGT and other digital assets have gained significant momentum
Making long term sustainable cost improvements throughout the organization to position for accelerated
profitability
Rapid return to venues with Q3 same venue revenue performance 76% vs. 2019 and recent trends improved
to 80-85% in September and October
1Third-party research conducted for Topgolf
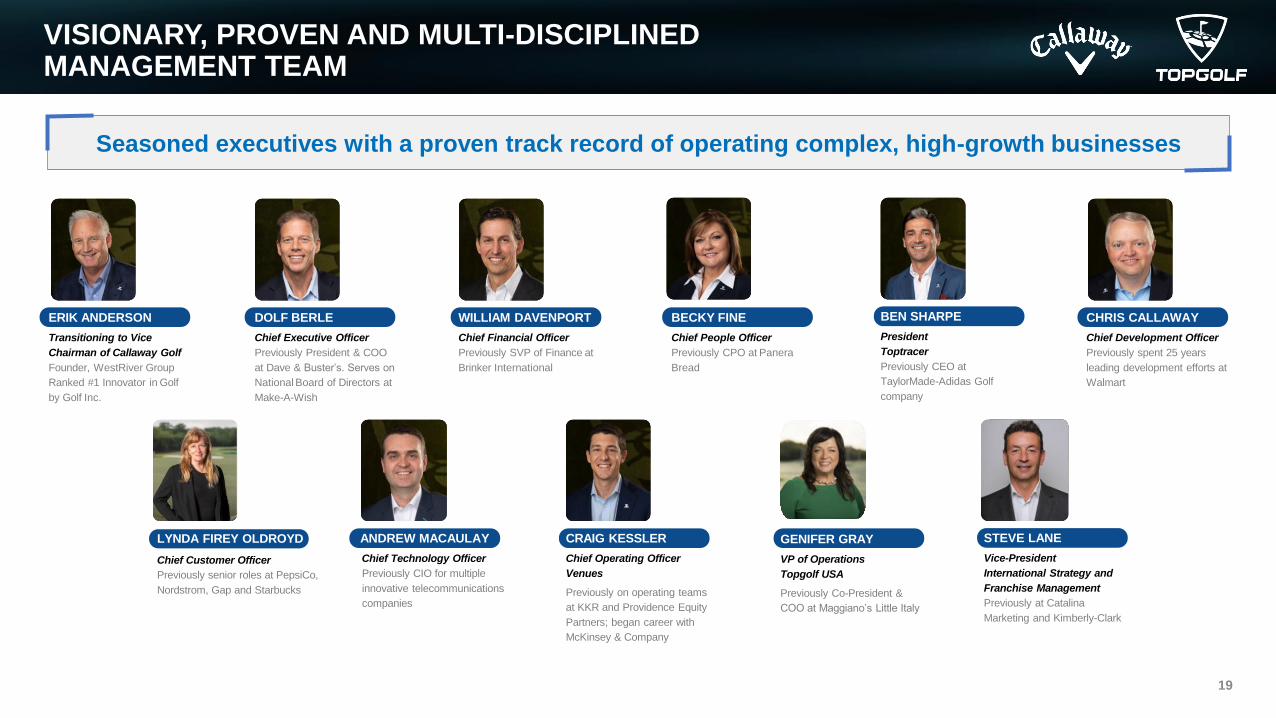
VISIONARY, PROVEN AND MULTI-DISCIPLINED MANAGEMENT TEAM
19
Seasoned executives with a proven track record of operating complex, high-growth businesses
GENIFER GRAY
VP of Operations
Topgolf USA
Previously Co-President &
COO at Maggiano’s Little Italy
CRAIG KESSLER
Chief Operating Officer
Venues
Previously on operating teams
at KKR and Providence Equity
Partners; began career with
McKinsey & Company
ANDREW MACAULAY
Chief Technology Officer
Previously CIO for multiple
innovative telecommunications
companies
BEN SHARPE
President
Toptracer
Previously CEO at
TaylorMade-Adidas Golf
company
BECKY FINE
Chief People Officer
Previously CPO at Panera
Bread
CHRIS CALLAWAY
ChiefDevelopment Officer
Previously spent 25 years
leading development efforts
at Walmart
CHRIS CALLAWAY
Chief Development Officer
Previously spent 25 years
leading development efforts at
Walmart
WILLIAM DAVENPORT
Chief Financial Officer
Previously SVP of Finance at
Brinker International
DOLF BERLE
Chief Executive Officer
Previously President & COO
at Dave & Buster’s. Serves on
National Board of Directors at
Make-A-Wish
ERIK ANDERSON
Transitioning to Vice
Chairman of Callaway Golf
Founder, WestRiver Group
Ranked #1 Innovator in Golf
by Golf Inc.
STEVE LANE
Vice-President
International Strategy and
Franchise Management
Previously at Catalina
Marketing and Kimberly-Clark
LYNDA FIREY OLDROYD
Chief Customer Officer
Previously senior roles at PepsiCo,
Nordstrom, Gap and Starbucks
20
Venues Overview
CRAIG KESSLER
Chief Operating Officer
Venues
GENIFER GRAY
VP of Operations
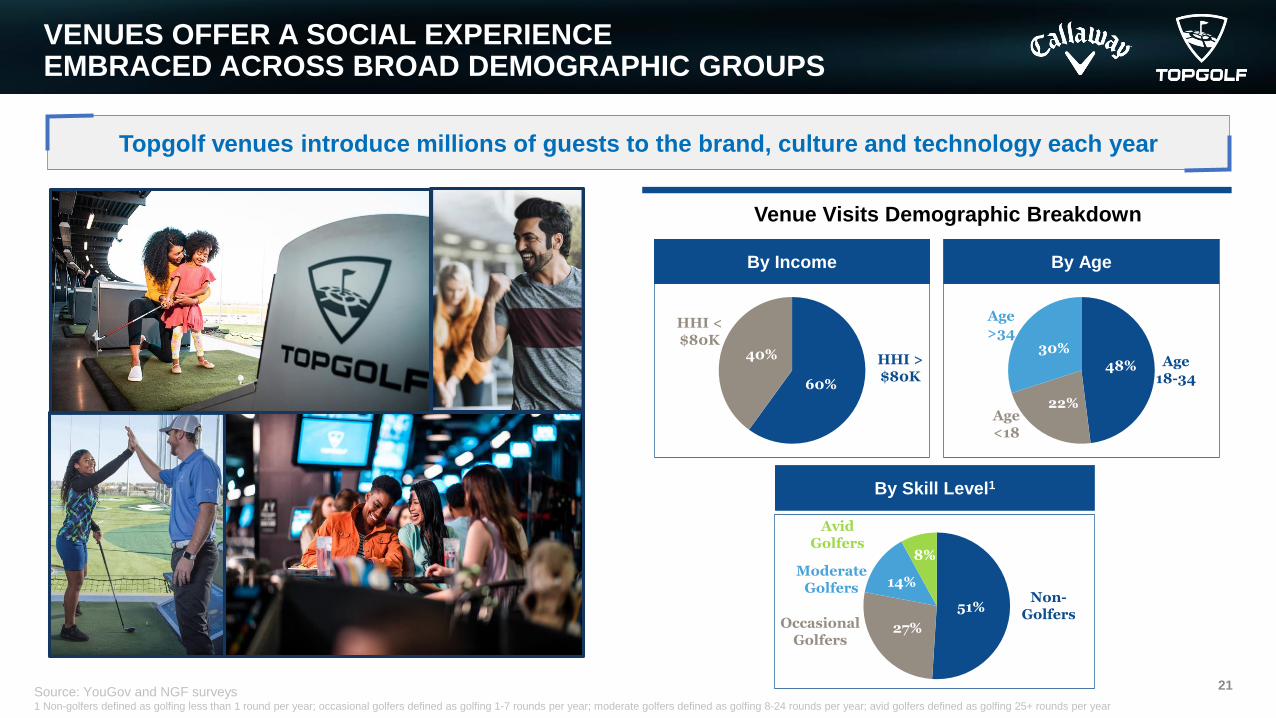
VENUES OFFER A SOCIAL EXPERIENCE EMBRACED ACROSS BROAD DEMOGRAPHIC GROUPS
21
51%
By Skill Level1
27%OccasionalGolfers
Non-Golfers
Venue Visits Demographic Breakdown
ModerateGolfers 14%
8%
Avid Golfers
60%
40%
HHI < $80K
HHI > $80K
By Age
48%
30%
Age<18
Age 18-34
Age>34
22%
By Income
Source: YouGov and NGF surveys1 Non-golfers defined as golfing less than 1 round per year; occasional golfers defined as golfing 1-7 rounds per year; moderate golfers defined as golfing 8-24 rounds per year; avid golfers defined as golfing 25+ rounds per year
Topgolf venues introduce millions of guests to the brand, culture and technology each year
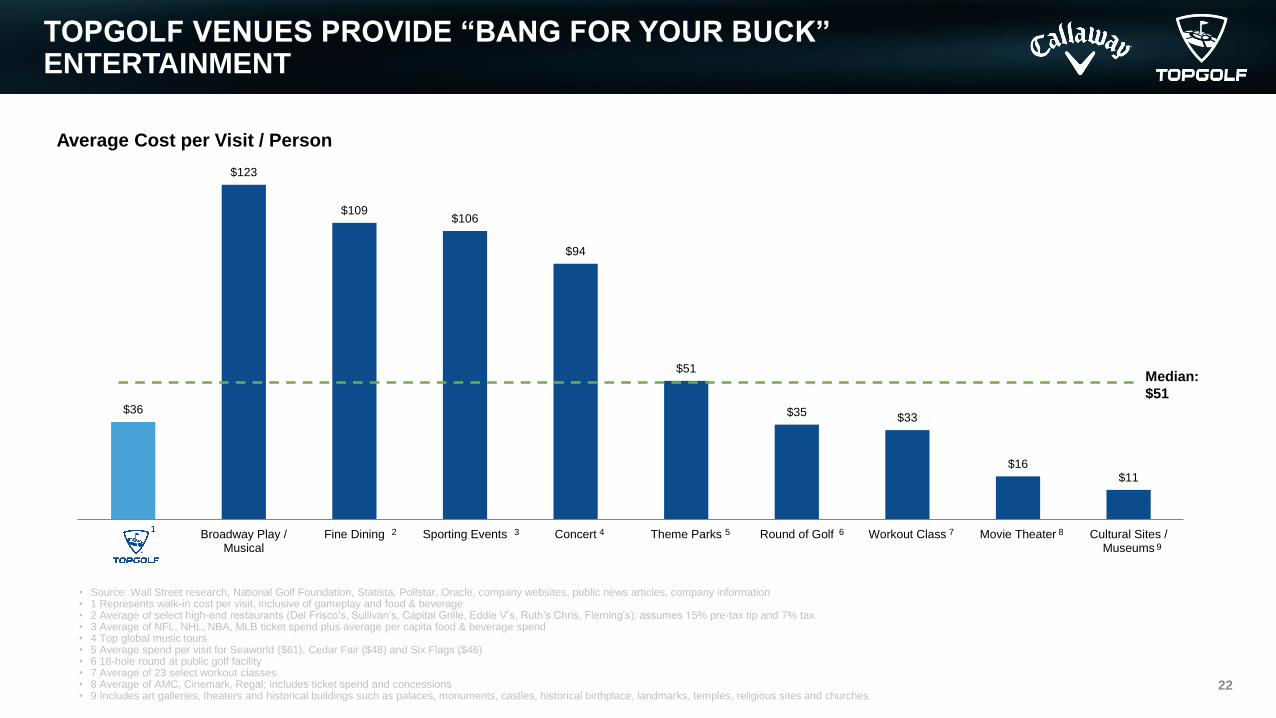
TOPGOLF VENUES PROVIDE “BANG FOR YOUR BUCK” ENTERTAINMENT
22
$36
$123
$109 $106
$94
$51
$35 $33
$16 $11
Broadway Play /Musical
Fine Dining Sporting Events Concert Theme Parks Round of Golf Workout Class Movie Theater Cultural Sites /Museums
Average Cost per Visit / Person
2 3 4 5 6 7 8
9
Median:
$51
1
• Source: Wall Street research, National Golf Foundation, Statista, Pollstar, Oracle, company websites, public news articles, company information• 1 Represents walk-in cost per visit, inclusive of gameplay and food & beverage• 2 Average of select high-end restaurants (Del Frisco’s, Sullivan’s, Capital Grille, Eddie V’s, Ruth’s Chris, Fleming’s); assumes 15% pre-tax tip and 7% tax• 3 Average of NFL, NHL, NBA, MLB ticket spend plus average per capita food & beverage spend• 4 Top global music tours• 5 Average spend per visit for Seaworld ($61), Cedar Fair ($48) and Six Flags ($46)• 6 18-hole round at public golf facility• 7 Average of 23 select workout classes• 8 Average of AMC, Cinemark, Regal; includes ticket spend and concessions• 9 Includes art galleries, theaters and historical buildings such as palaces, monuments, castles, historical birthplace, landmarks, temples, religious sites and churches
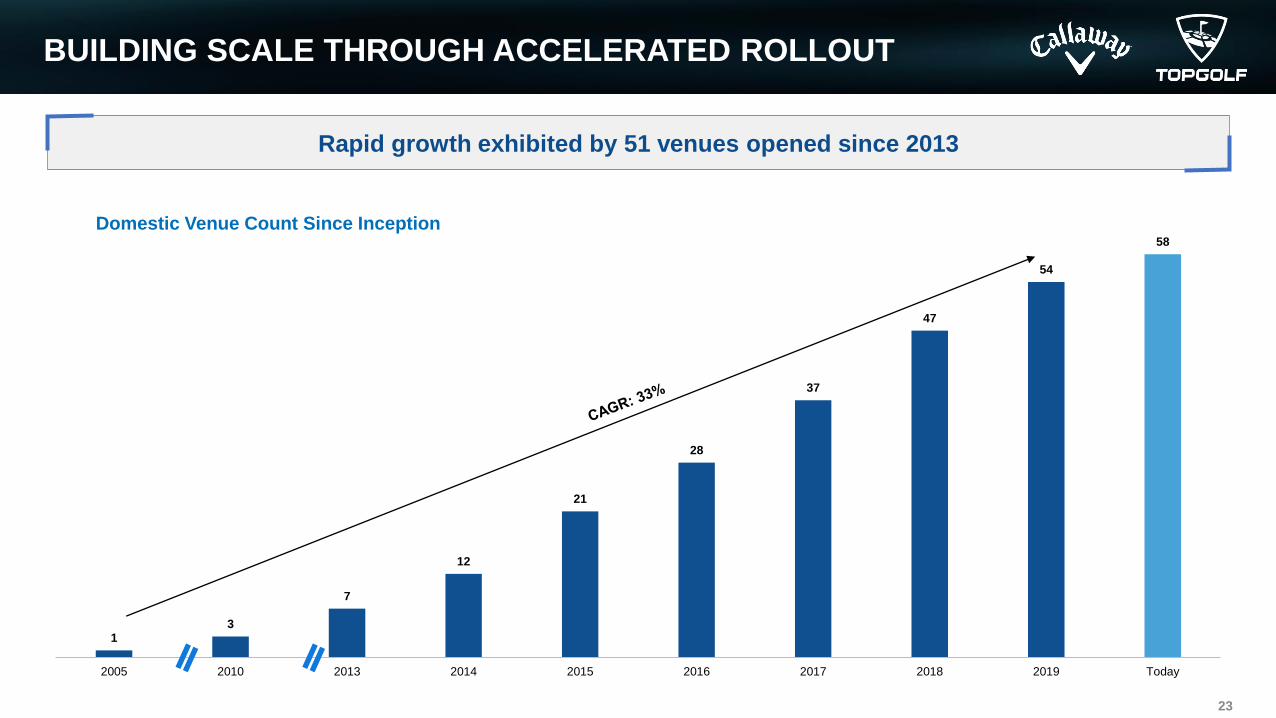
BUILDING SCALE THROUGH ACCELERATED ROLLOUT
23
Domestic Venue Count Since Inception
13
7
12
21
28
37
47
54
58
2005 2010 2013 2014 2015 2016 2017 2018 2019 Today
Rapid growth exhibited by 51 venues opened since 2013
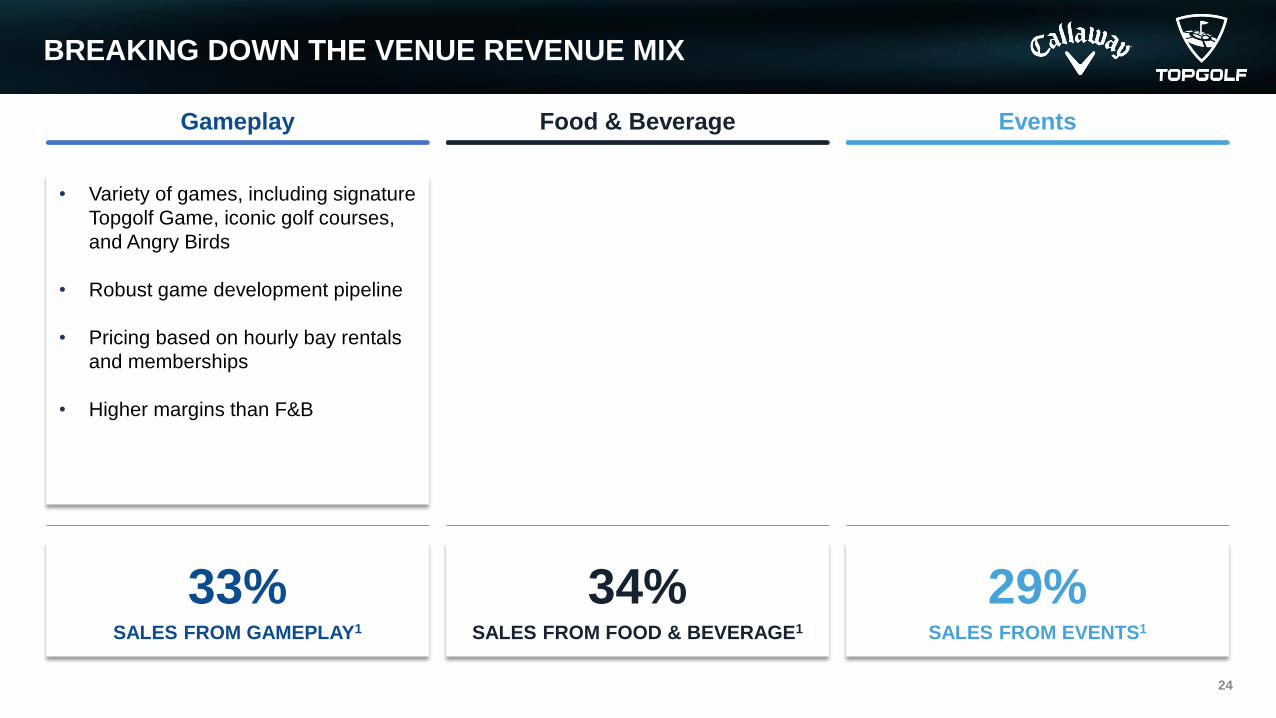
BREAKING DOWN THE VENUE REVENUE MIX
24
Gameplay
• Variety of games, including signature
Topgolf Game, iconic golf courses,
and Angry Birds
• Robust game development pipeline
• Pricing based on hourly bay rentals
and memberships
• Higher margins than F&B
Food & Beverage Events
33%SALES FROM GAMEPLAY1
34%SALES FROM FOOD & BEVERAGE1
29%SALES FROM EVENTS1
• High quality food & beverage
delivered at scale to walk in and event
guests
• Menu caters to a diverse range of
tastes and dietary restrictions
• Each venue has an Executive Chef
with a full kitchen that offers a wide
selection of creative food, from
brunch to late night snacks
• Tailored spaces are able to
accommodate events ranging from
corporate presentations, birthday
parties, charitable events and
wedding receptions
• Formal event rooms are adjacent to
tee line, providing a private space for
events and gameplay
• Events revenue mix is approximately
50% Food & Beverage and 50%
Gameplay
1 As of FYE 2019. Retail and other sales account for 4% of total revenue
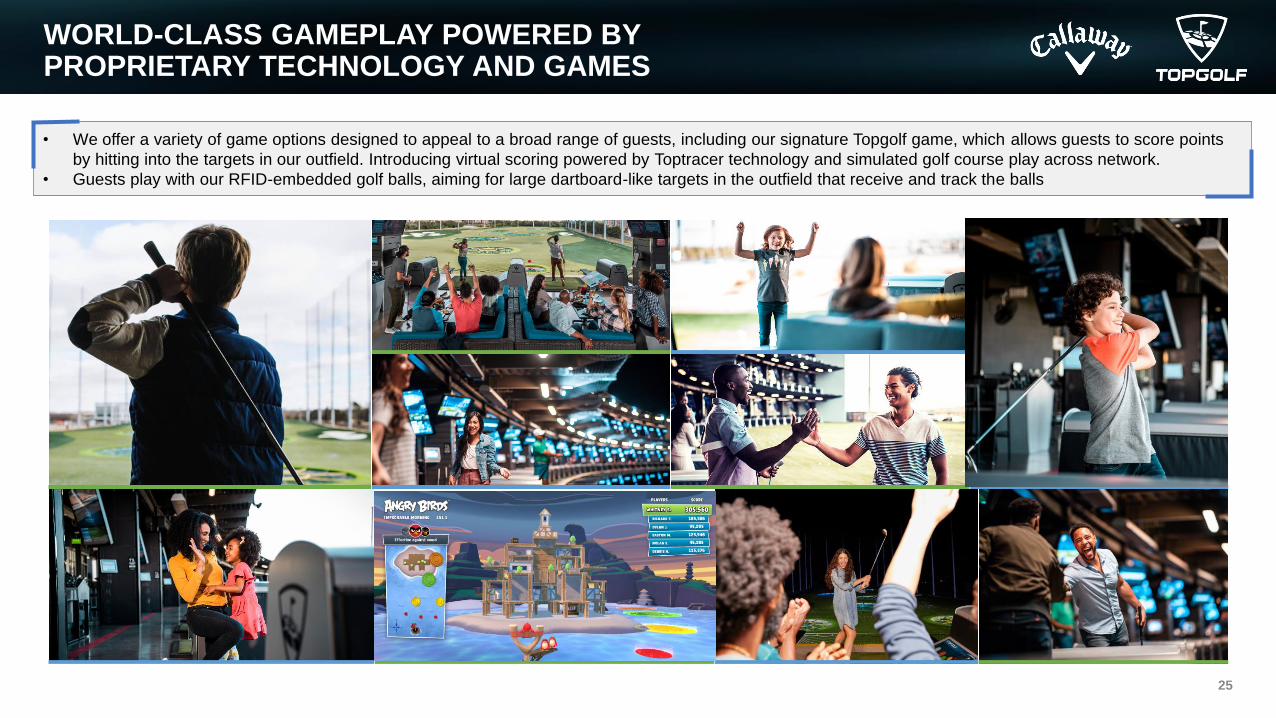
WORLD-CLASS GAMEPLAY POWERED BY PROPRIETARY TECHNOLOGY AND GAMES
25
• We offer a variety of game options designed to appeal to a broad range of guests, including our signature Topgolf game, which allows guests to score points
by hitting into the targets in our outfield. Introducing virtual scoring powered by Toptracer technology and simulated golf course play across network.
• Guests play with our RFID-embedded golf balls, aiming for large dartboard-like targets in the outfield that receive and track the balls
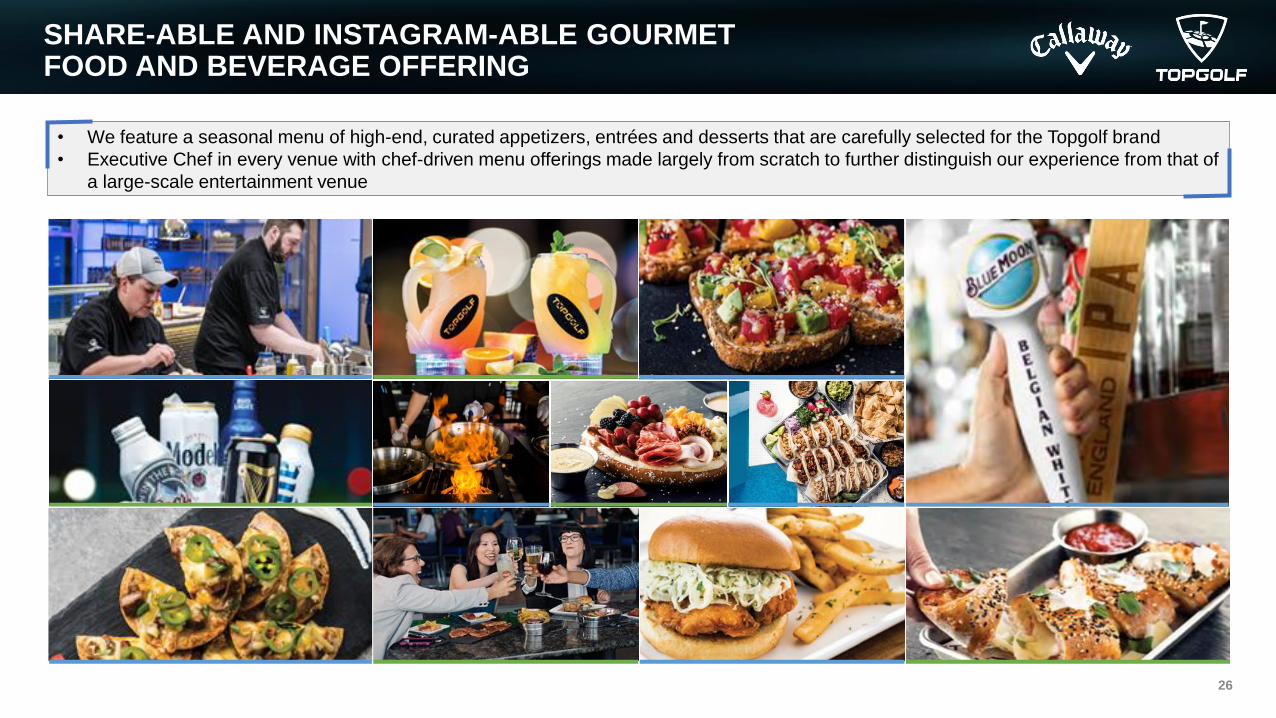
SHARE-ABLE AND INSTAGRAM-ABLE GOURMET FOOD AND BEVERAGE OFFERING
26
• We feature a seasonal menu of high-end, curated appetizers, entrées and desserts that are carefully selected for the Topgolf brand
• Executive Chef in every venue with chef-driven menu offerings made largely from scratch to further distinguish our experience from that of
a large-scale entertainment venue
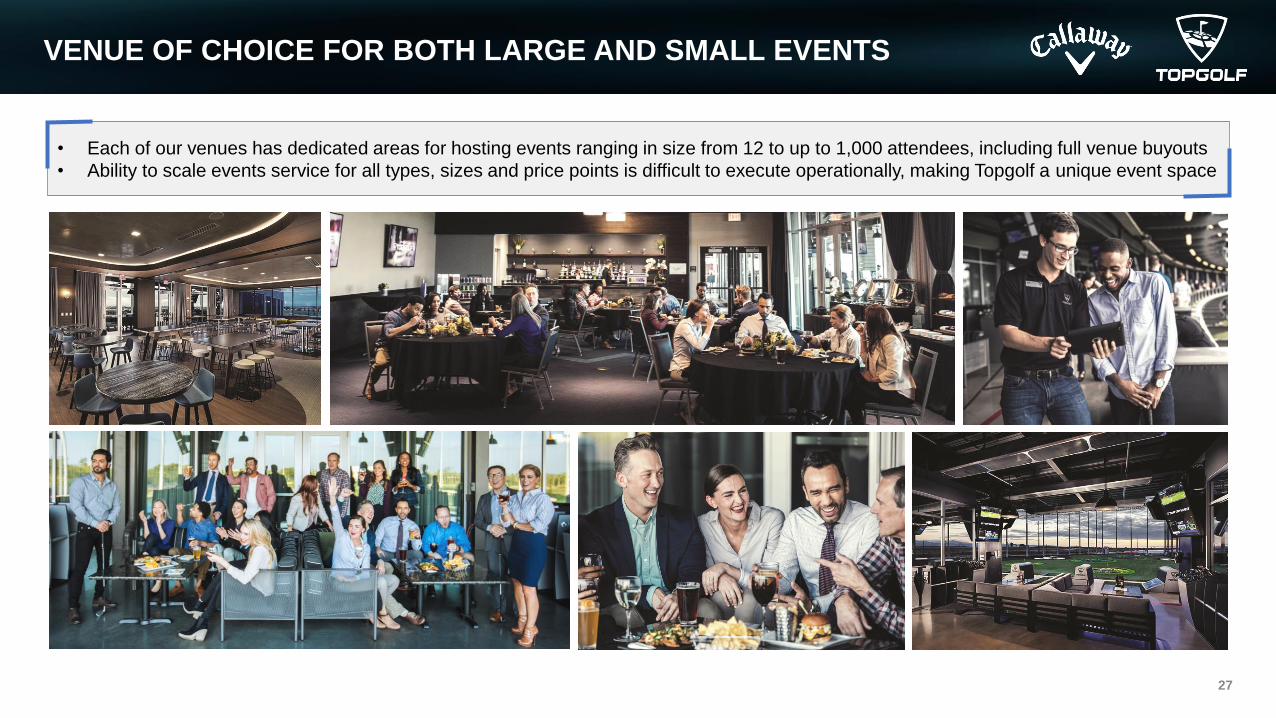
VENUE OF CHOICE FOR BOTH LARGE AND SMALL EVENTS
27
• Each of our venues has dedicated areas for hosting events ranging in size from 12 to up to 1,000 attendees, including full venue buyouts
• Ability to scale events service for all types, sizes and price points is difficult to execute operationally, making Topgolf a unique event space
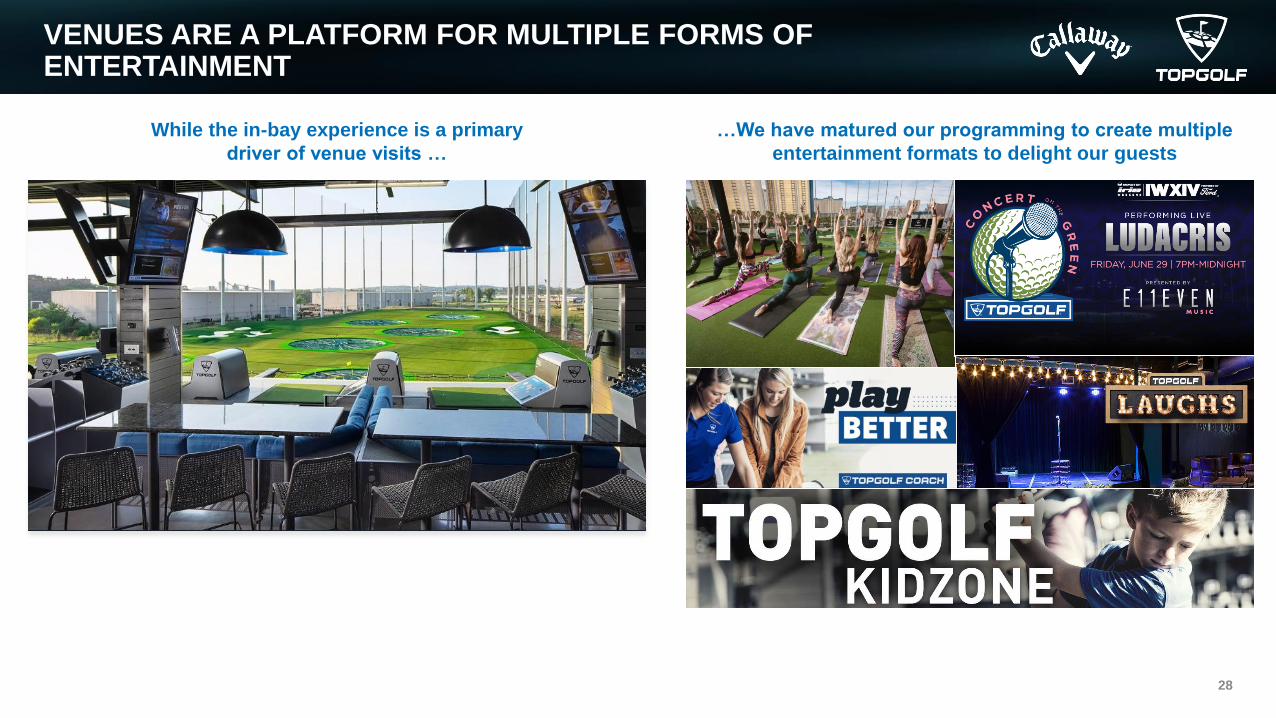
VENUES ARE A PLATFORM FOR MULTIPLE FORMS OF ENTERTAINMENT
28
While the in-bay experience is a primary
driver of venue visits …
…We have matured our programming to create multiple
entertainment formats to delight our guests
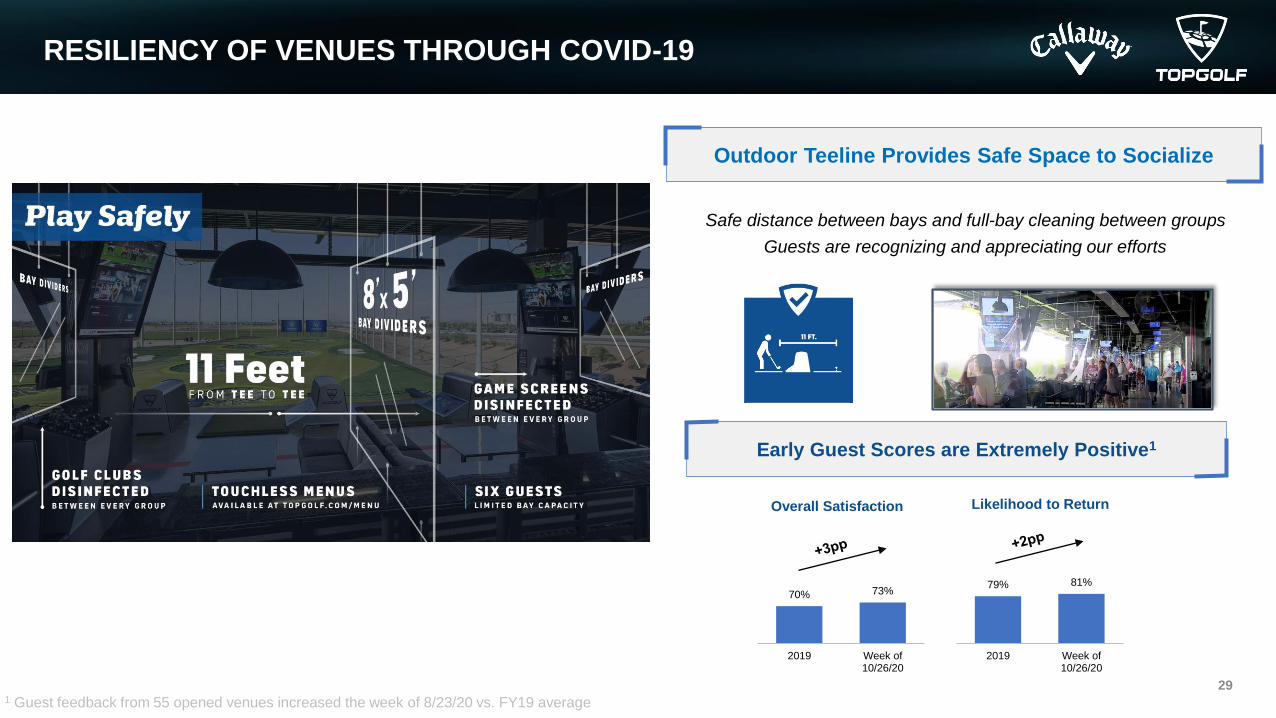
RESILIENCY OF VENUES THROUGH COVID-19
29
Outdoor Teeline Provides Safe Space to Socialize
Safe distance between bays and full-bay cleaning between groups
Guests are recognizing and appreciating our efforts
1 Guest feedback from 55 opened venues increased the week of 8/23/20 vs. FY19 average
Early Guest Scores are Extremely Positive1
70% 73%
2019 Week of10/26/20
Overall Satisfaction Likelihood to Return
79% 81%
2019 Week of10/26/20
30
Venue Development
CHRIS CALLAWAY
Chief Development
Officer
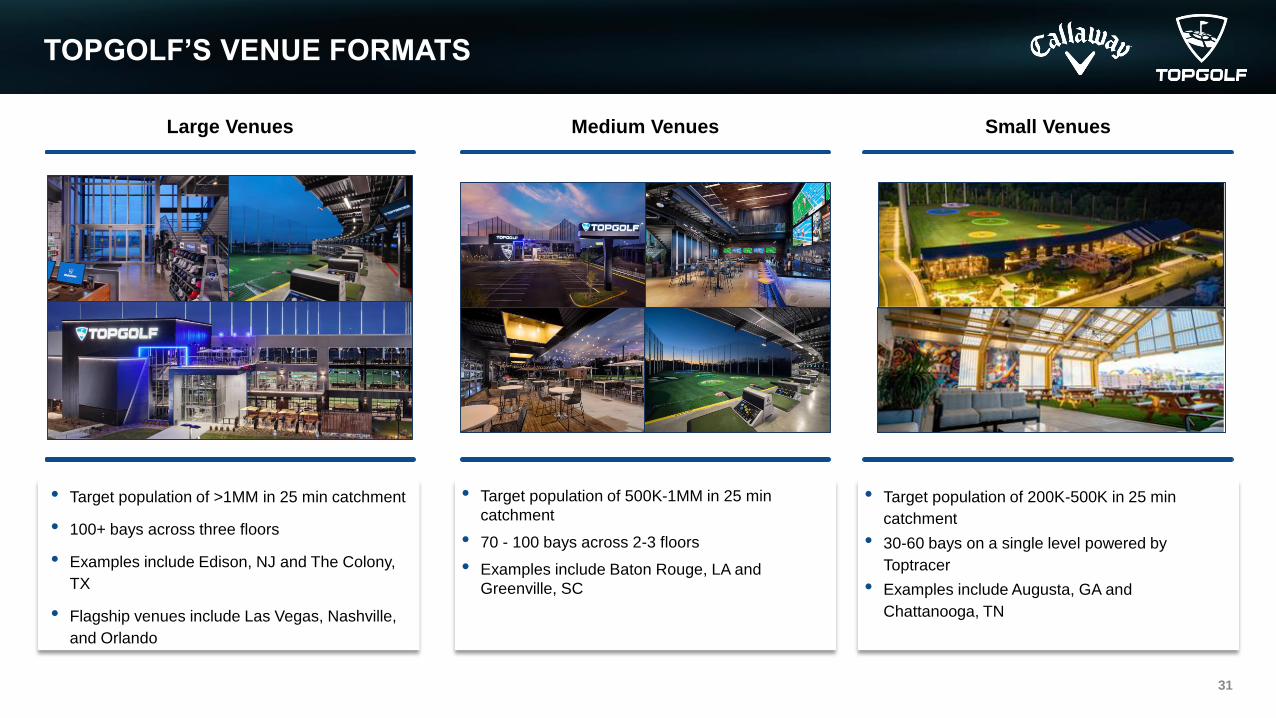
TOPGOLF’S VENUE FORMATS
31
Medium Venues Small VenuesLarge Venues
• Target population of >1MM in 25 min catchment
• 100+ bays across three floors
• Examples include Edison, NJ and The Colony,
TX
• Flagship venues include Las Vegas, Nashville,
and Orlando
• Target population of 500K-1MM in 25 min
catchment
• 70 - 100 bays across 2-3 floors
• Examples include Baton Rouge, LA and
Greenville, SC
• Target population of 200K-500K in 25 min
catchment
• 30-60 bays on a single level powered by
Toptracer
• Examples include Augusta, GA and
Chattanooga, TN
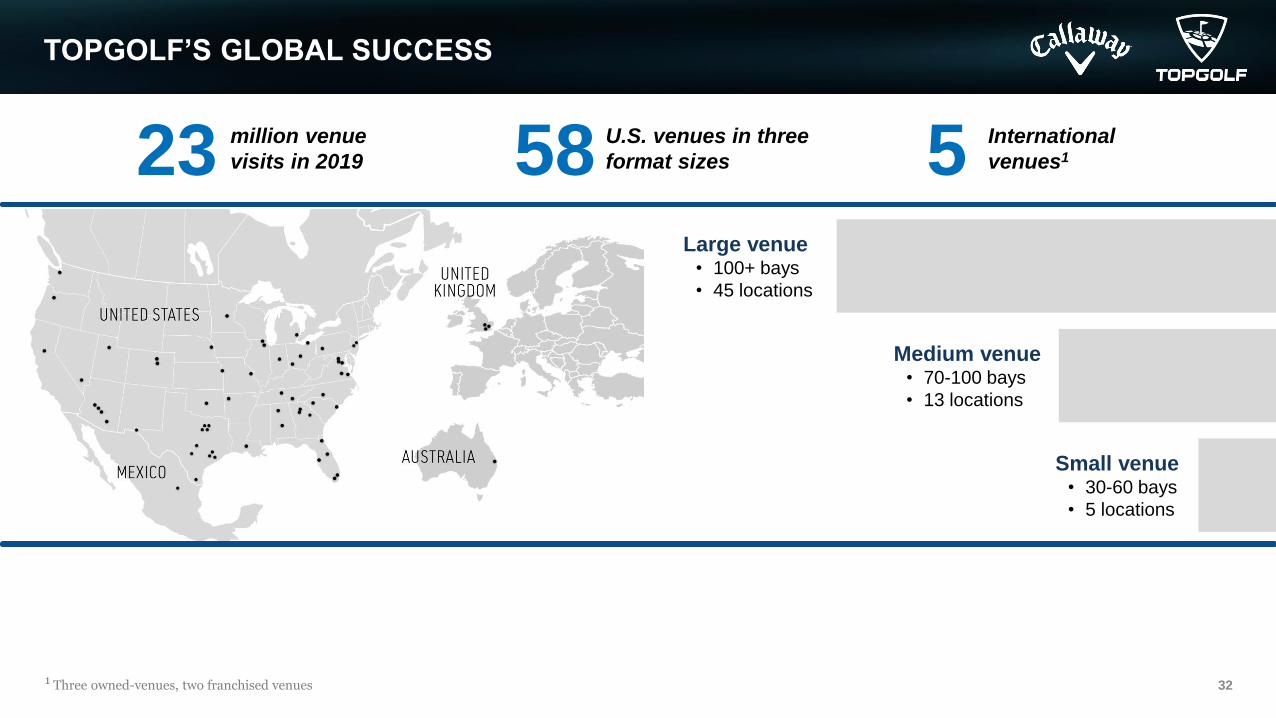
TOPGOLF’S GLOBAL SUCCESS
32
58 U.S. venues in three
format sizes23 million venue
visits in 2019 5 International
venues1
1 Three owned-venues, two franchised venues
Large venue• 100+ bays
• 45 locations
Medium venue• 70-100 bays
• 13 locations
Small venue• 30-60 bays
• 5 locations
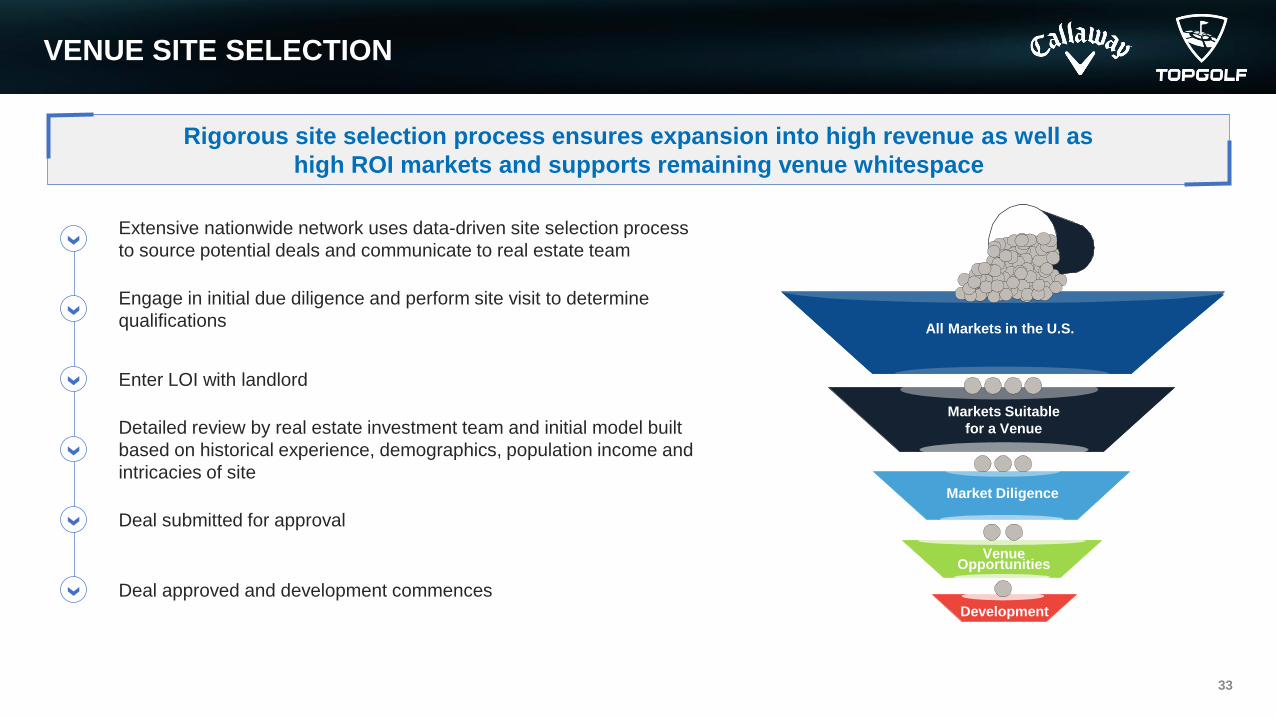
VENUE SITE SELECTION
33
[ ]
All Markets in the U.S.
Markets Suitable
for a Venue
VenueOpportunities
Market Diligence
Development
Extensive nationwide network uses data-driven site selection process
to source potential deals and communicate to real estate team
Engage in initial due diligence and perform site visit to determine
qualifications
Enter LOI with landlord
Detailed review by real estate investment team and initial model built
based on historical experience, demographics, population income and
intricacies of site
Deal submitted for approval
Deal approved and development commences
Rigorous site selection process ensures expansion into high revenue as well as
high ROI markets and supports remaining venue whitespace
VENUE CONSTRUCTION AND FINANCING
34
Construction Third-Party Financing
• Venues range in size from less than 20,000 to up to
105,000 sq. ft. with up to four floors (9 to 15 acre
sites)
• A typical venue takes between 10 and 12 months to
build
• Internal development team includes: architects,
designers, project managers and installation crews,
all led by our VP of Construction and Design
• Experienced internal real estate, development and
construction teams ensure project efficiency and
adherence to project timelines
• Topgolf partners with well-capitalized REIT partners,
who provide capital for the land acquisition and fund
up to ~75% of the development cost, with Topgolf
funding remaining development costs (primarily
technology costs and FF&E)
• Third party financing provides significant
additional growth capital
• Once construction is completed, we lease the venue
and underlying land back from the financing partner
• In cases where we are not able to finance venue
construction through one of our financing partners,
such as when the land we wish to develop is
available for ground lease but not for purchase, we
will fund 100% of venue development costs
We have built up processes and relationships over time that allow us to
construct and finance large, complex venues
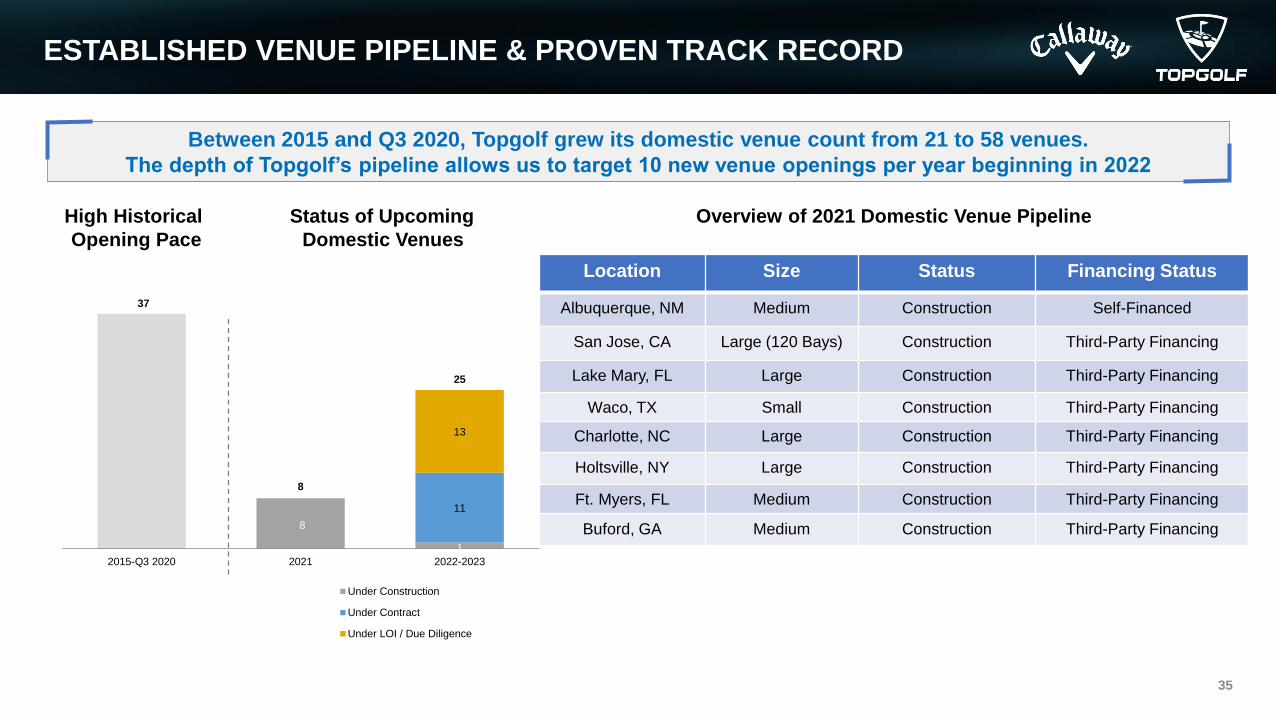
ESTABLISHED VENUE PIPELINE & PROVEN TRACK RECORD
35
Status of Upcoming
Domestic Venues
Overview of 2021 Domestic Venue Pipeline
Between 2015 and Q3 2020, Topgolf grew its domestic venue count from 21 to 58 venues.
The depth of Topgolf’s pipeline allows us to target 10 new venue openings per year beginning in 2022
High Historical
Opening Pace
Location Size Status Financing Status
Albuquerque, NM Medium Construction Self-Financed
San Jose, CA Large (120 Bays) Construction Third-Party Financing
Lake Mary, FL Large Construction Third-Party Financing
Waco, TX Small Construction Third-Party Financing
Charlotte, NC Large Construction Third-Party Financing
Holtsville, NY Large Construction Third-Party Financing
Ft. Myers, FL Medium Construction Third-Party Financing
Buford, GA Medium Construction Third-Party Financing1
11
8
13
37
8
25
2015-Q3 2020 2021 2022-2023
Under Construction
Under Contract
Under LOI / Due Diligence

36
Topgolf International
STEVE LANE
Vice-President
International Strategy
and Franchise
Management
RAPIDLY GROWING GLOBAL FOOTPRINT
37
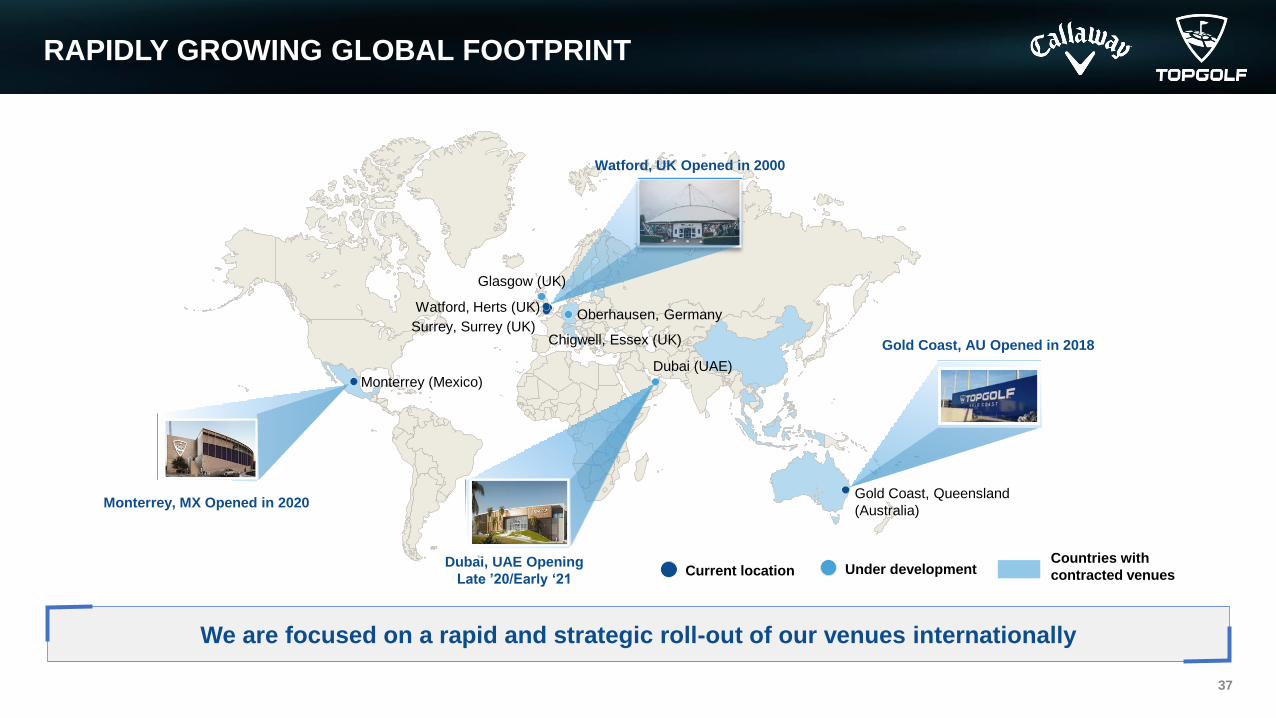
We are focused on a rapid and strategic roll-out of our venues internationally
Monterrey (Mexico)Dubai (UAE)
Gold Coast, Queensland
(Australia)
Chigwell, Essex (UK)Surrey, Surrey (UK)
Watford, UK Opened in 2000
Dubai, UAE Opening
Late ’20/Early ‘21
Gold Coast, AU Opened in 2018
Monterrey, MX Opened in 2020
Current location Under development
Glasgow (UK)
Countries with
contracted venues
Watford, Herts (UK)Oberhausen, Germany
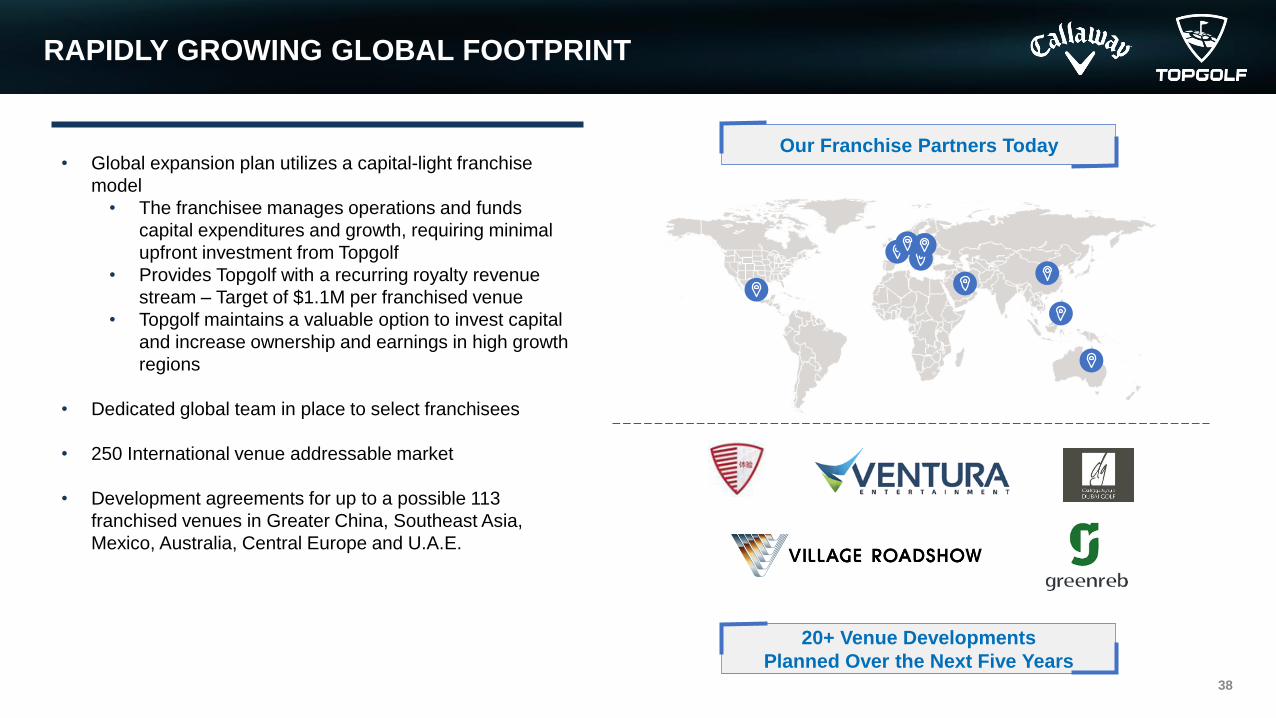
RAPIDLY GROWING GLOBAL FOOTPRINT
• Global expansion plan utilizes a capital-light franchise
model
• The franchisee manages operations and funds
capital expenditures and growth, requiring minimal
upfront investment from Topgolf
• Provides Topgolf with a recurring royalty revenue
stream – Target of $1.1M per franchised venue
• Topgolf maintains a valuable option to invest capital
and increase ownership and earnings in high growth
regions
• Dedicated global team in place to select franchisees
• 250 International venue addressable market
• Development agreements for up to a possible 113
franchised venues in Greater China, Southeast Asia,
Mexico, Australia, Central Europe and U.A.E.
Our Franchise Partners Today
20+ Venue Developments
Planned Over the Next Five Years38
39
Toptracer Platform
BEN SHARPE
President Toptracer
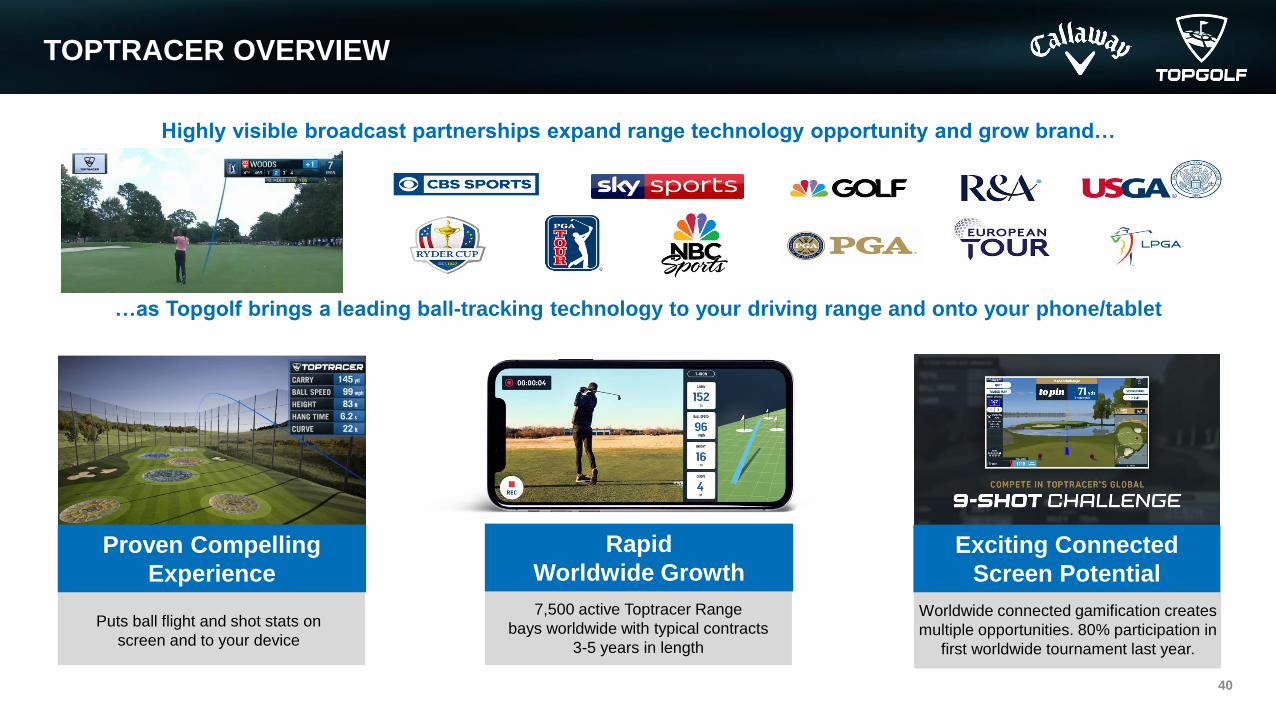
TOPTRACER OVERVIEW
40
Puts ball flight and shot stats on
screen and to your device
…as Topgolf brings a leading ball-tracking technology to your driving range and onto your phone/tablet
Highly visible broadcast partnerships expand range technology opportunity and grow brand…
7,500 active Toptracer Range
bays worldwide with typical contracts
3-5 years in length
Worldwide connected gamification creates
multiple opportunities. 80% participation in
first worldwide tournament last year.
Proven Compelling
Experience
Rapid
Worldwide GrowthExciting Connected
Screen Potential
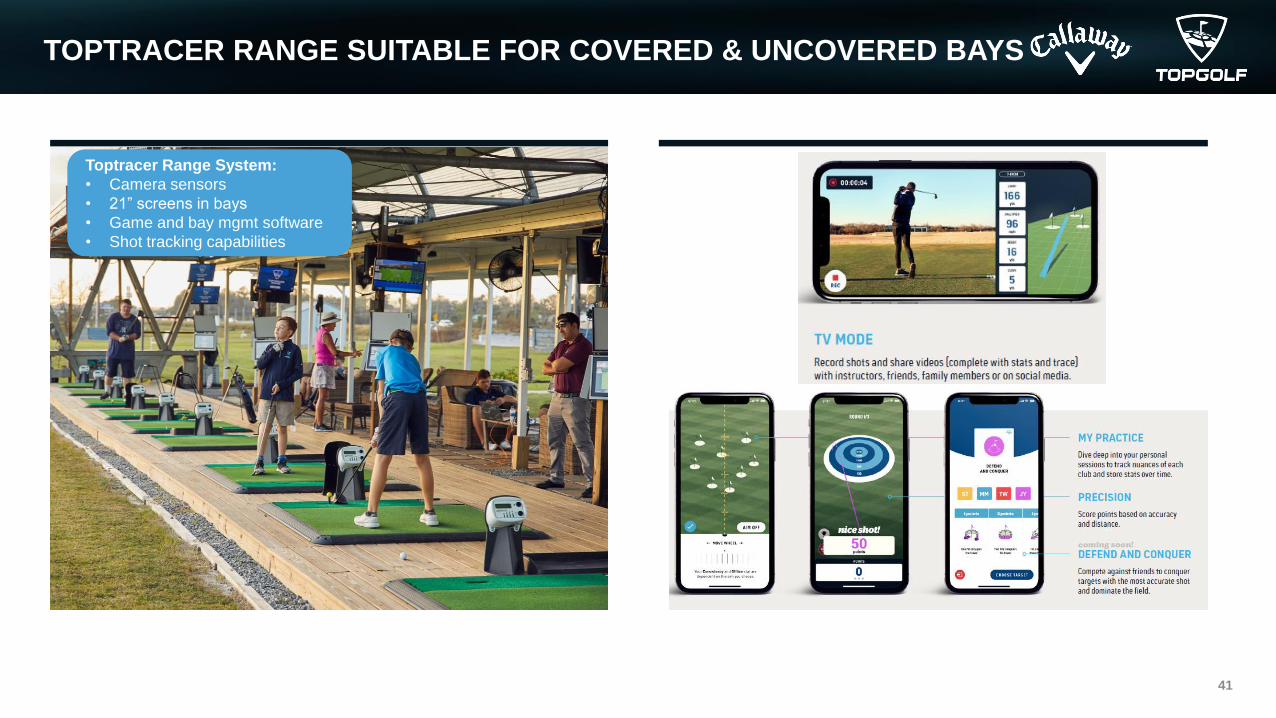
TOPTRACER RANGE SUITABLE FOR COVERED & UNCOVERED BAYS
41
Toptracer Range System:
• Camera sensors
• 21” screens in bays
• Game and bay mgmt software
• Shot tracking capabilities
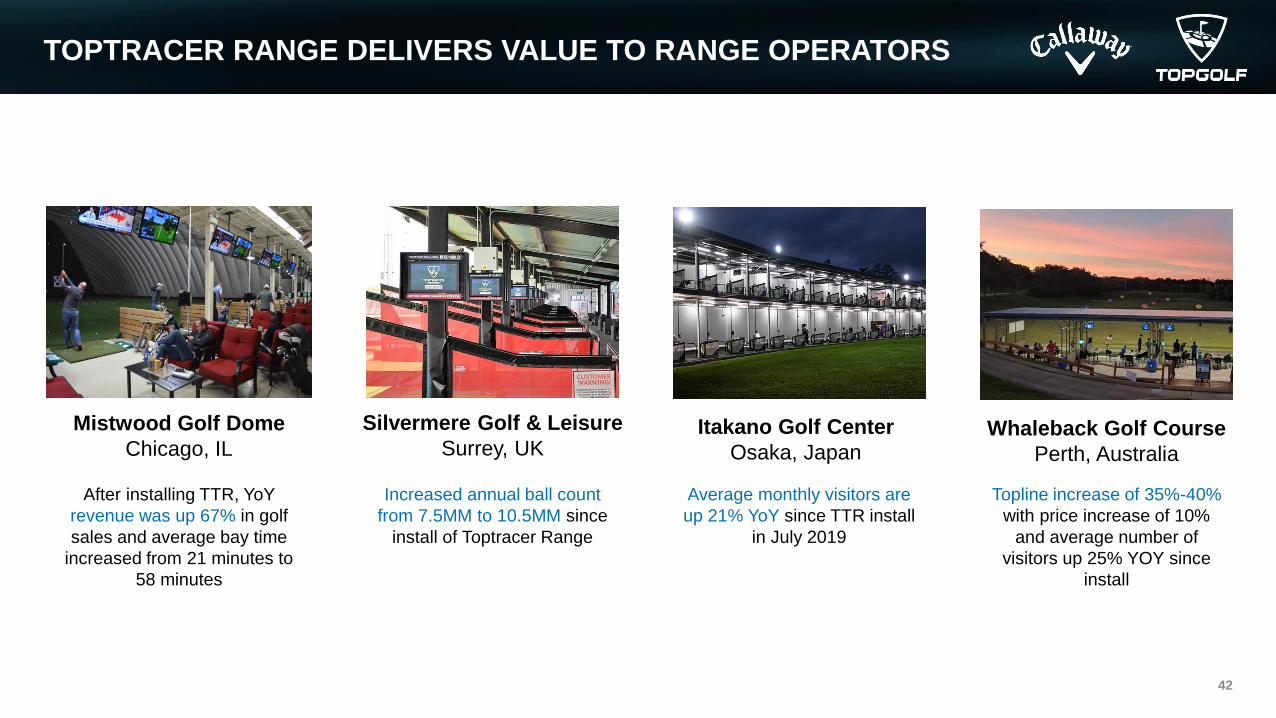
TOPTRACER RANGE DELIVERS VALUE TO RANGE OPERATORS
42
Silvermere Golf & Leisure
Surrey, UK
Increased annual ball count
from 7.5MM to 10.5MM since
install of Toptracer Range
Itakano Golf Center
Osaka, Japan
Average monthly visitors are
up 21% YoY since TTR install
in July 2019
Topline increase of 35%-40%
with price increase of 10%
and average number of
visitors up 25% YOY since
install
Mistwood Golf Dome
Chicago, IL
After installing TTR, YoY
revenue was up 67% in golf
sales and average bay time
increased from 21 minutes to
58 minutes
Whaleback Golf Course
Perth, Australia
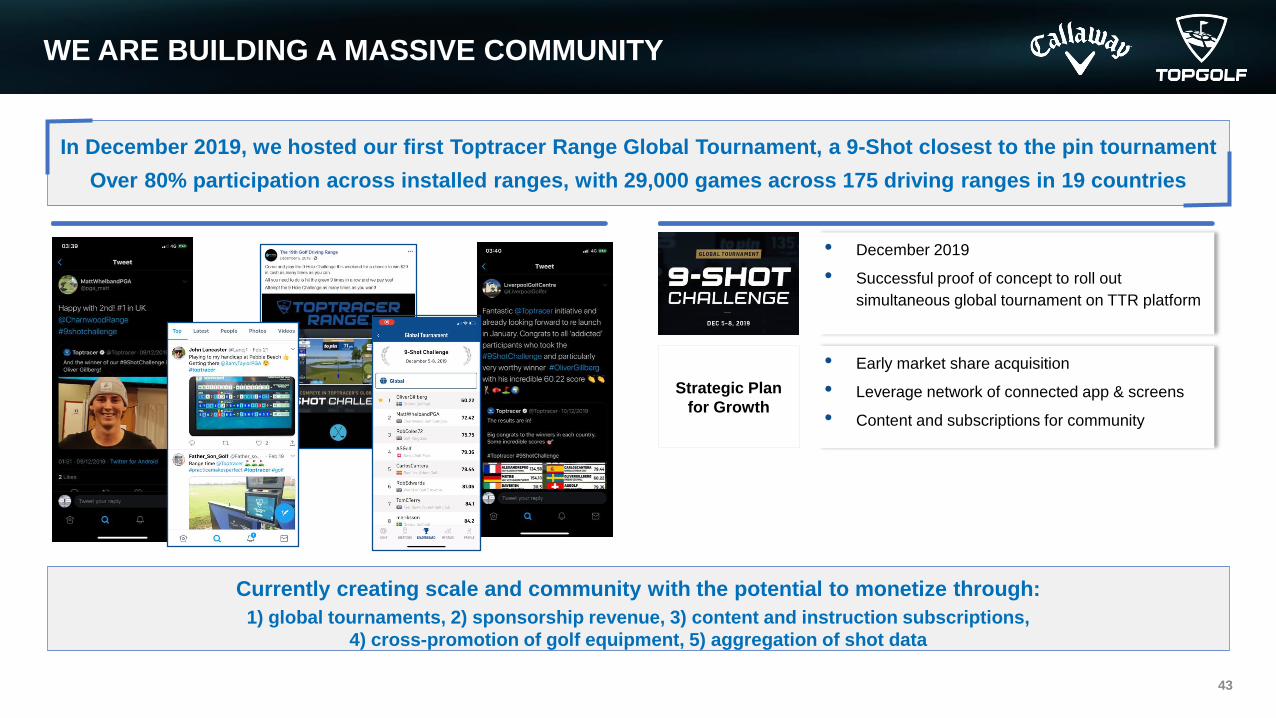
WE ARE BUILDING A MASSIVE COMMUNITY
43
In December 2019, we hosted our first Toptracer Range Global Tournament, a 9-Shot closest to the pin tournament
Over 80% participation across installed ranges, with 29,000 games across 175 driving ranges in 19 countries
Currently creating scale and community with the potential to monetize through:
1) global tournaments, 2) sponsorship revenue, 3) content and instruction subscriptions,
4) cross-promotion of golf equipment, 5) aggregation of shot data
• December 2019
• Successful proof of concept to roll out
simultaneous global tournament on TTR platform
• Early market share acquisition
• Leverage network of connected app & screens
• Content and subscriptions for community
Strategic Plan
for Growth
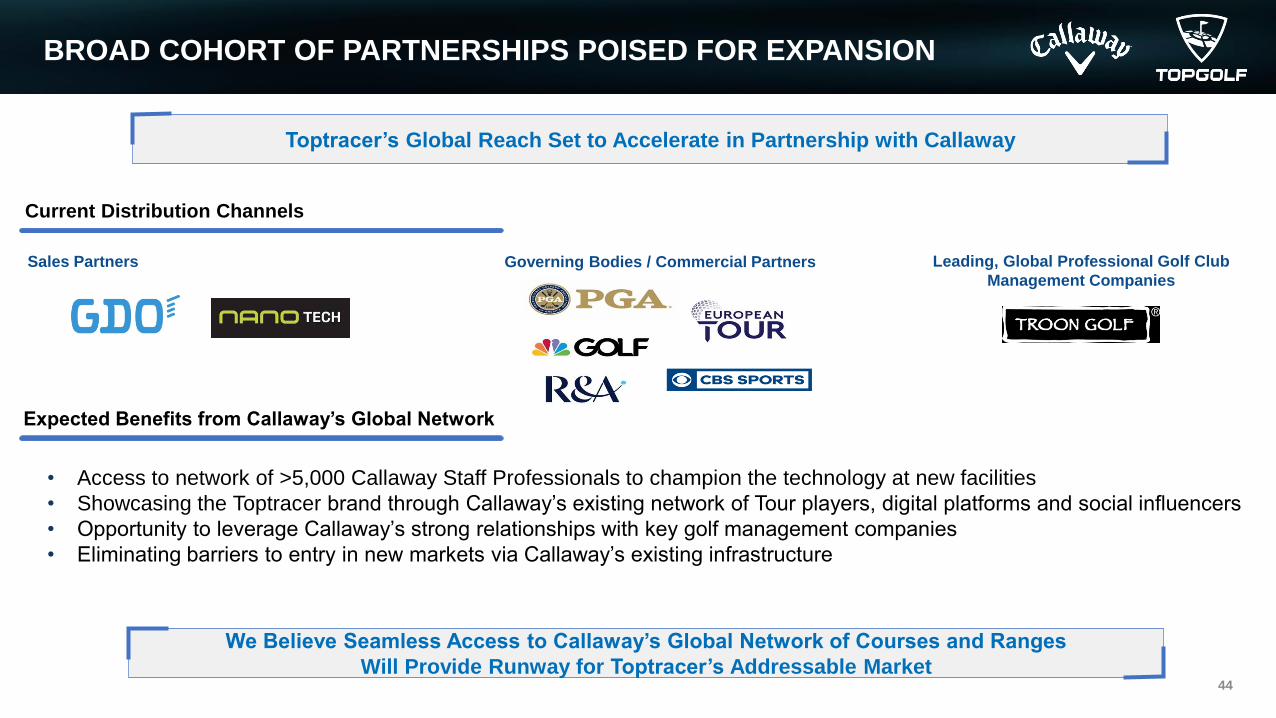
BROAD COHORT OF PARTNERSHIPS POISED FOR EXPANSION
44
We Believe Seamless Access to Callaway’s Global Network of Courses and Ranges
Will Provide Runway for Toptracer’s Addressable Market
Current Distribution Channels
Sales Partners Leading, Global Professional Golf Club
Management CompaniesGoverning Bodies / Commercial Partners
Expected Benefits from Callaway’s Global Network
Toptracer’s Global Reach Set to Accelerate in Partnership with Callaway
• Access to network of >5,000 Callaway Staff Professionals to champion the technology at new facilities
• Showcasing the Toptracer brand through Callaway’s existing network of Tour players, digital platforms and social influencers
• Opportunity to leverage Callaway’s strong relationships with key golf management companies
• Eliminating barriers to entry in new markets via Callaway’s existing infrastructure
45
Topgolf Media
DOLF BERLE
Chief Executive Officer
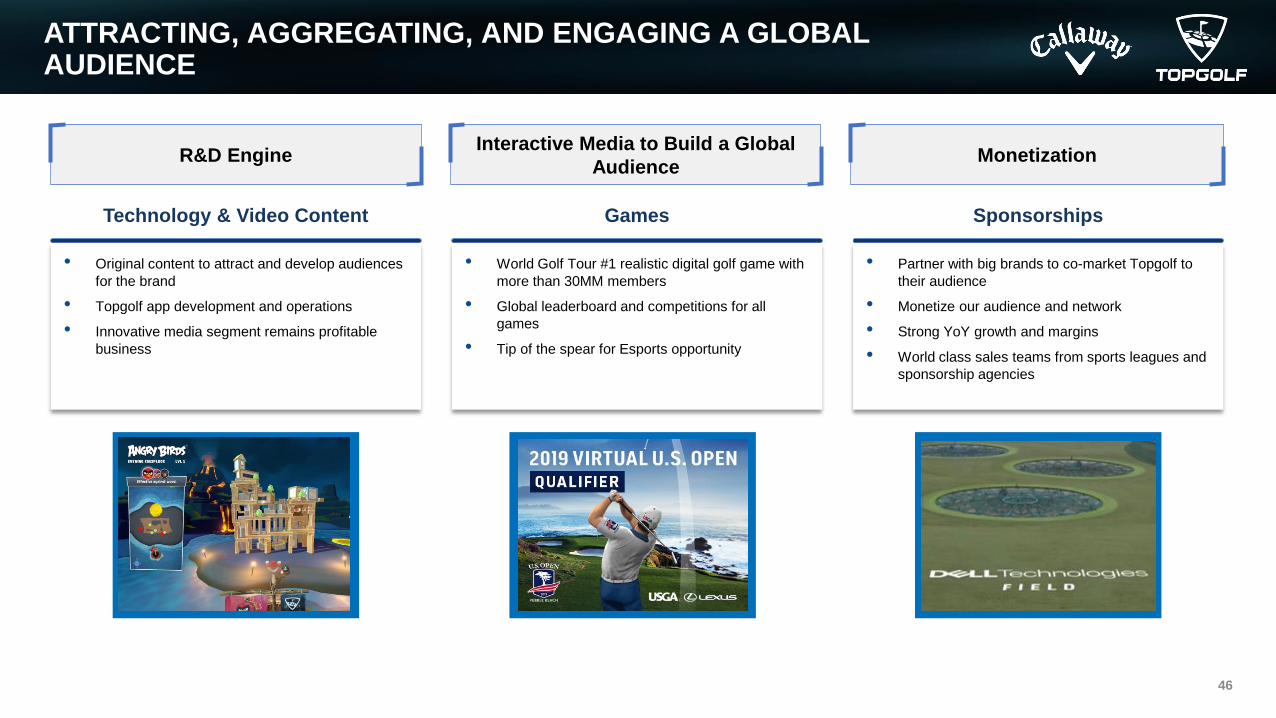
ATTRACTING, AGGREGATING, AND ENGAGING A GLOBAL AUDIENCE
46
Technology & Video Content
• Original content to attract and develop audiences
for the brand
• Topgolf app development and operations
• Innovative media segment remains profitable
business
Interactive Media to Build a Global
Audience
• World Golf Tour #1 realistic digital golf game with
more than 30MM members
• Global leaderboard and competitions for all
games
• Tip of the spear for Esports opportunity
Games
• Partner with big brands to co-market Topgolf to
their audience
• Monetize our audience and network
• Strong YoY growth and margins
• World class sales teams from sports leagues and
sponsorship agencies
Sponsorships
MonetizationR&D Engine

WORLD GOLF TOUR IS THE LEADING REALISTIC DIGITAL GOLF GAME
47
• Founded in 2005 and continues to be an enduring
game with continued growth and profitability 15
years after inception
• Topgolf aggregated WGT in 2016 for its engaged
community and talented game developers
• WGT is an online multiplayer virtual golf game that
utilizes our proprietary GPS and 3D technology,
allowing for a realistic virtual golfing experience
• Players golf on photorealistic recreations of nearly
25 world-famous golf courses
• Revenue is primarily derived from in-app
purchases as well as through game offers and
advertisements
48
Topgolf Financial Overview
WILLIAM DAVENPORT
Chief Financial Officer
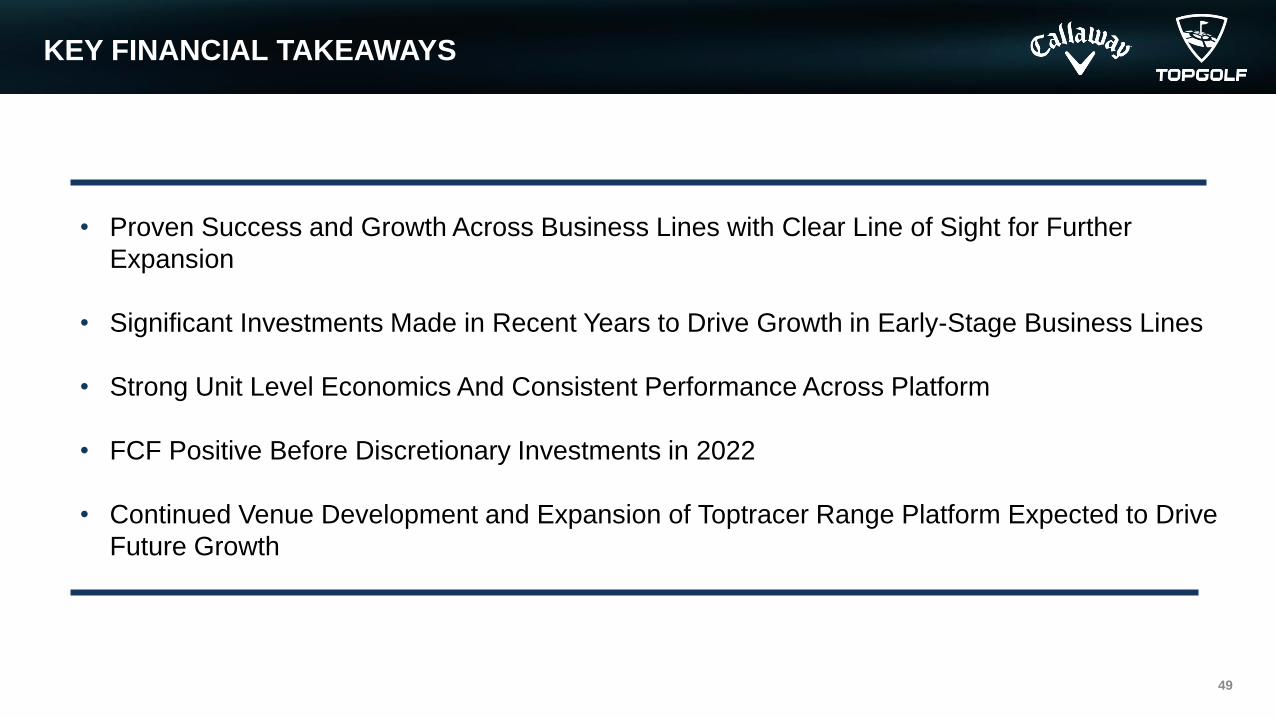
KEY FINANCIAL TAKEAWAYS
49
• Proven Success and Growth Across Business Lines with Clear Line of Sight for Further
Expansion
• Significant Investments Made in Recent Years to Drive Growth in Early-Stage Business Lines
• Strong Unit Level Economics And Consistent Performance Across Platform
• FCF Positive Before Discretionary Investments in 2022
• Continued Venue Development and Expansion of Toptracer Range Platform Expected to Drive
Future Growth
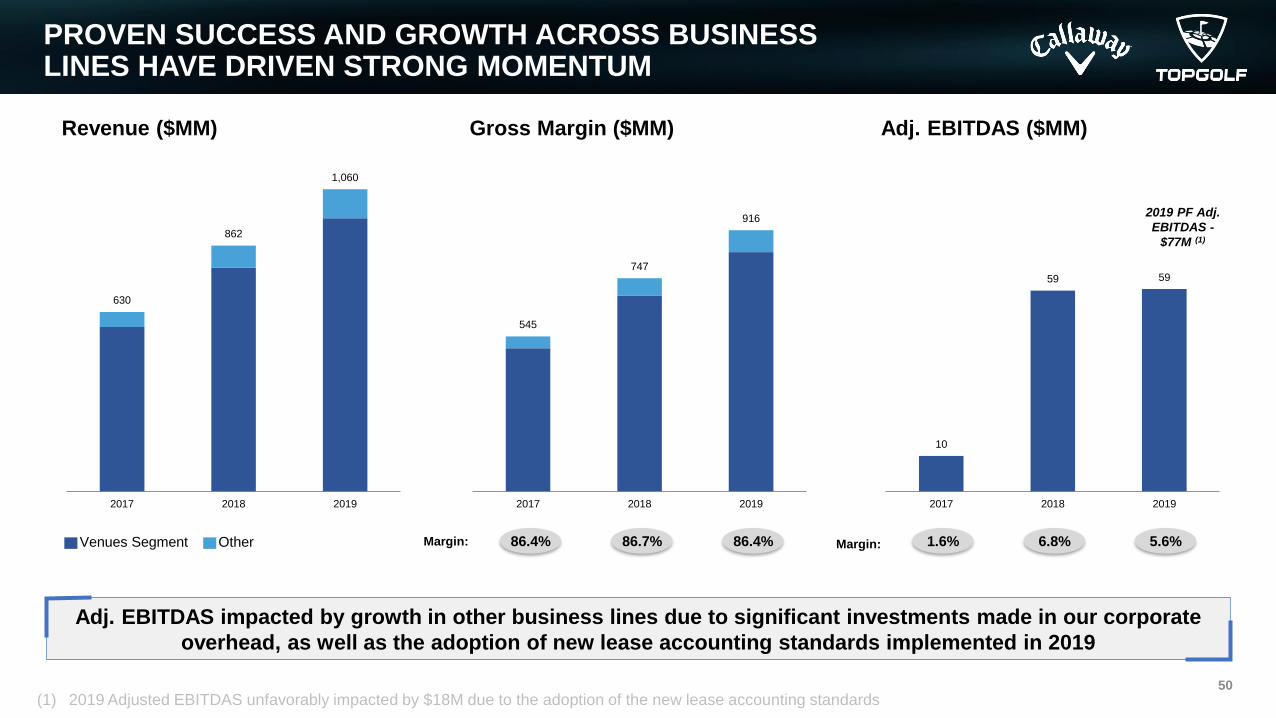
PROVEN SUCCESS AND GROWTH ACROSS BUSINESS LINES HAVE DRIVEN STRONG MOMENTUM
50
Revenue ($MM)
630
862
1,060
2017 2018 2019
Gross Margin ($MM)
545
747
916
2017 2018 2019
10
59 59
2017 2018 2019
Adj. EBITDAS ($MM)
Venues Segment Other 1.6% 6.8% 5.6%Margin:86.4% 86.7% 86.4%Margin:
(1) 2019 Adjusted EBITDAS unfavorably impacted by $18M due to the adoption of the new lease accounting standards
2019 PF Adj.
EBITDAS -
$77M (1)
Adj. EBITDAS impacted by growth in other business lines due to significant investments made in our corporate
overhead, as well as the adoption of new lease accounting standards implemented in 2019
3 4 4 5
2017 2018 2019 3Q20
481 1,574 4,065
7,541
2017 2018 2019 3Q20
37 47 54 58
2017 2018 2019 3Q20
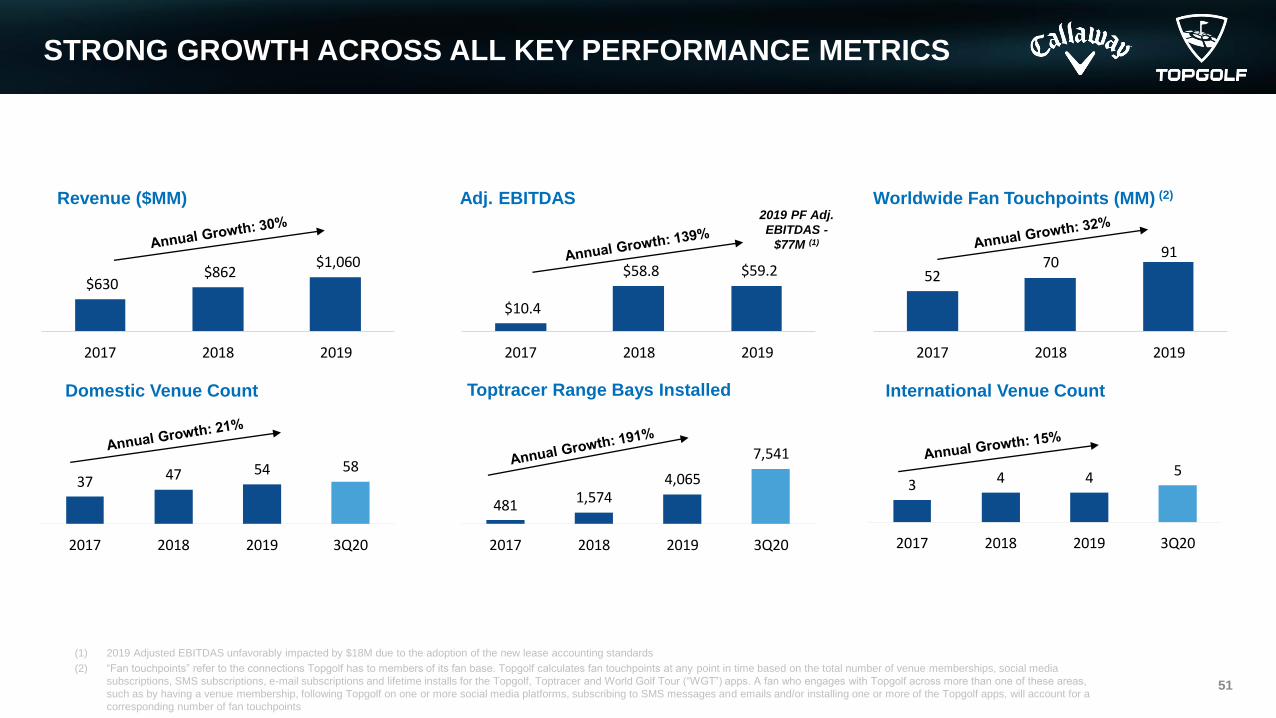
STRONG GROWTH ACROSS ALL KEY PERFORMANCE METRICS
51
(1) 2019 Adjusted EBITDAS unfavorably impacted by $18M due to the adoption of the new lease accounting standards
(2) “Fan touchpoints” refer to the connections Topgolf has to members of its fan base. Topgolf calculates fan touchpoints at any point in time based on the total number of venue memberships, social media
subscriptions, SMS subscriptions, e-mail subscriptions and lifetime installs for the Topgolf, Toptracer and World Golf Tour (“WGT”) apps. A fan who engages with Topgolf across more than one of these areas,
such as by having a venue membership, following Topgolf on one or more social media platforms, subscribing to SMS messages and emails and/or installing one or more of the Topgolf apps, will account for a
corresponding number of fan touchpoints
52 70
91
2017 2018 2019
$630 $862
$1,060
2017 2018 2019
Toptracer Range Bays Installed
Revenue ($MM)
Domestic Venue Count
Adj. EBITDAS Worldwide Fan Touchpoints (MM) (2)
International Venue Count
$10.4
$58.8 $59.2
2017 2018 2019
2019 PF Adj.
EBITDAS -
$77M (1)
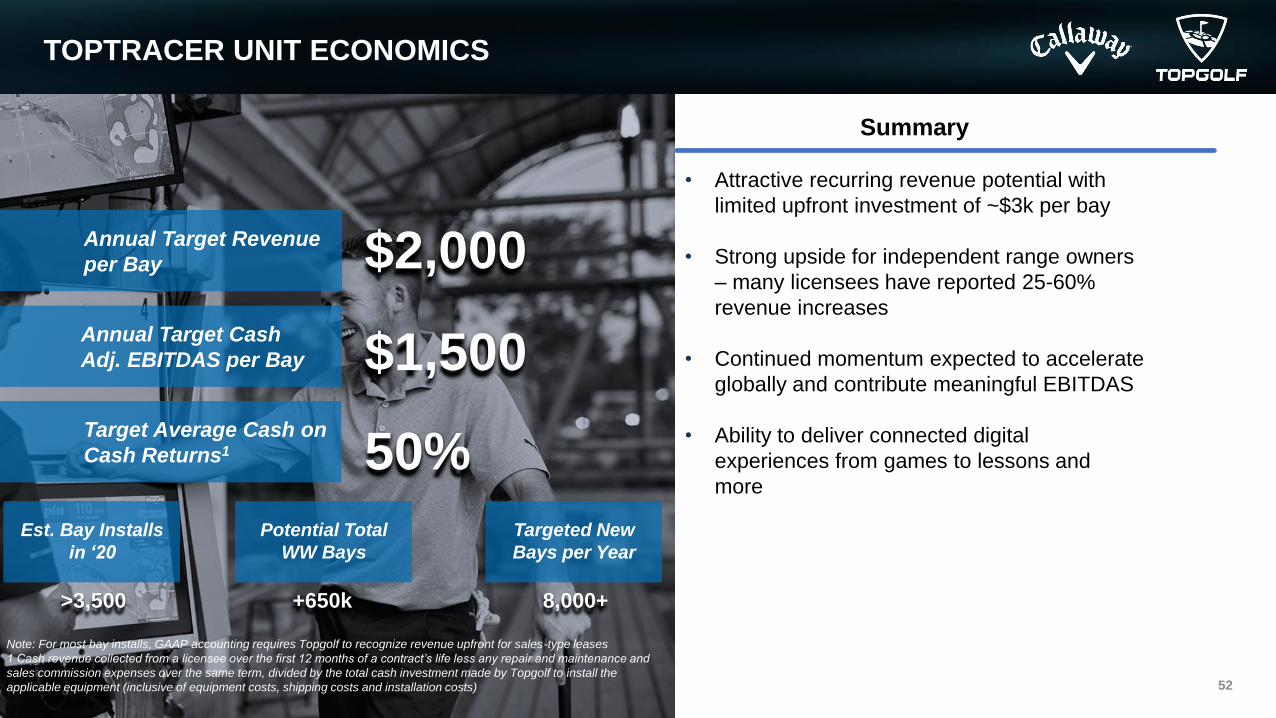
TOPTRACER UNIT ECONOMICS
52
Summary
• Attractive recurring revenue potential with
limited upfront investment of ~$3k per bay
• Strong upside for independent range owners
– many licensees have reported 25-60%
revenue increases
• Continued momentum expected to accelerate
globally and contribute meaningful EBITDAS
• Ability to deliver connected digital
experiences from games to lessons and
more
Note: For most bay installs, GAAP accounting requires Topgolf to recognize revenue upfront for sales-type leases
1 Cash revenue collected from a licensee over the first 12 months of a contract’s life less any repair and maintenance and
sales commission expenses over the same term, divided by the total cash investment made by Topgolf to install the
applicable equipment (inclusive of equipment costs, shipping costs and installation costs)
Annual Target Revenue
per Bay $2,000
Target Average Cash on
Cash Returns1 50%
Annual Target Cash
Adj. EBITDAS per Bay $1,500
Est. Bay Installs
in ‘20
>3,500
Potential Total
WW Bays
+650k
Targeted New
Bays per Year
8,000+
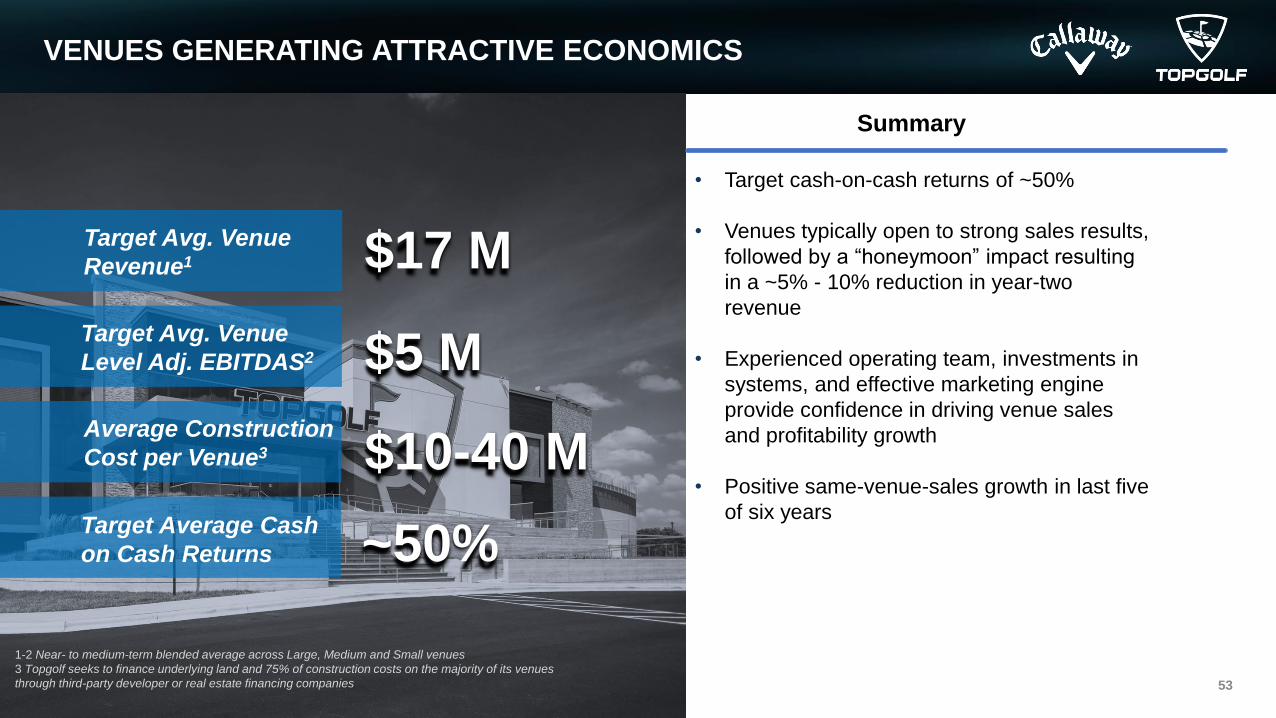
VENUES GENERATING ATTRACTIVE ECONOMICS
53
Target Avg. Venue
Revenue1 $17 M
Average Construction
Cost per Venue3 $10-40 M
1-2 Near- to medium-term blended average across Large, Medium and Small venues
3 Topgolf seeks to finance underlying land and 75% of construction costs on the majority of its venues
through third-party developer or real estate financing companies
Target Avg. Venue
Level Adj. EBITDAS2 $5 M
Target Average Cash
on Cash Returns ~50%
Summary
• Target cash-on-cash returns of ~50%
• Venues typically open to strong sales results,
followed by a “honeymoon” impact resulting
in a ~5% - 10% reduction in year-two
revenue
• Experienced operating team, investments in
systems, and effective marketing engine
provide confidence in driving venue sales
and profitability growth
• Positive same-venue-sales growth in last five
of six years
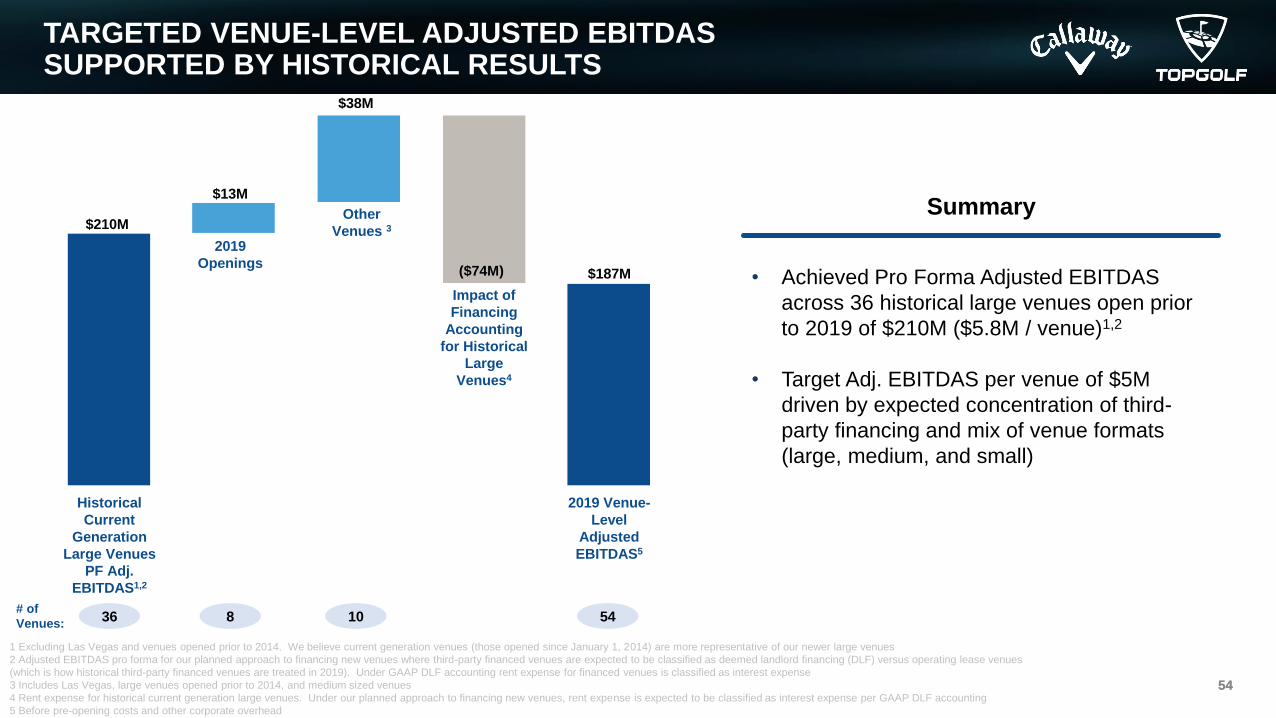
TARGETED VENUE-LEVEL ADJUSTED EBITDAS SUPPORTED BY HISTORICAL RESULTS
5454
Summary
• Achieved Pro Forma Adjusted EBITDAS
across 36 historical large venues open prior
to 2019 of $210M ($5.8M / venue)1,2
• Target Adj. EBITDAS per venue of $5M
driven by expected concentration of third-
party financing and mix of venue formats
(large, medium, and small)
1 Excluding Las Vegas and venues opened prior to 2014. We believe current generation venues (those opened since January 1, 2014) are more representative of our newer large venues
2 Adjusted EBITDAS pro forma for our planned approach to financing new venues where third-party financed venues are expected to be classified as deemed landlord financing (DLF) versus operating lease venues
(which is how historical third-party financed venues are treated in 2019). Under GAAP DLF accounting rent expense for financed venues is classified as interest expense
3 Includes Las Vegas, large venues opened prior to 2014, and medium sized venues
4 Rent expense for historical current generation large venues. Under our planned approach to financing new venues, rent expense is expected to be classified as interest expense per GAAP DLF accounting
5 Before pre-opening costs and other corporate overhead
Historical
Current
Generation
Large Venues
PF Adj.
EBITDAS1,2
Impact of
Financing
Accounting
for Historical
Large
Venues4
2019
Openings
Other
Venues 3
2019 Venue-
Level
Adjusted
EBITDAS5
$210M
($74M)
$13M
$38M
$187M
36# of
Venues:8 10 54
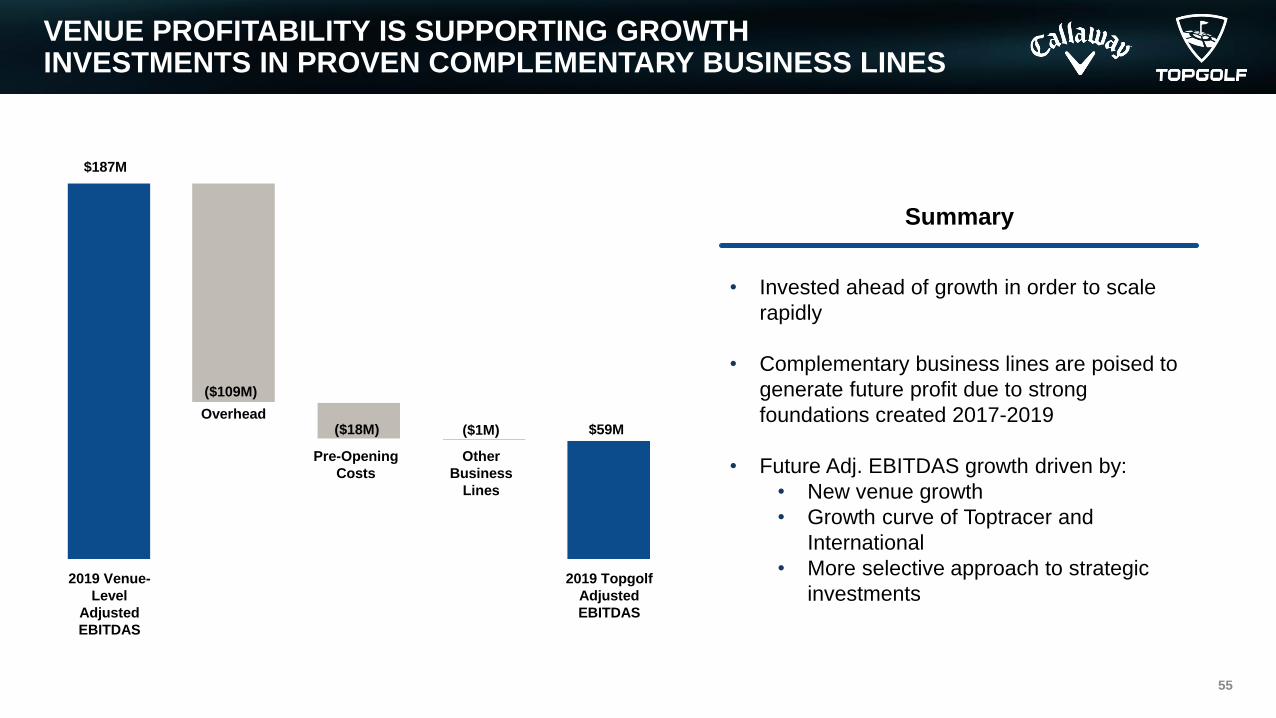
VENUE PROFITABILITY IS SUPPORTING GROWTH INVESTMENTS IN PROVEN COMPLEMENTARY BUSINESS LINES
55
2019 Venue-
Level
Adjusted
EBITDAS
Overhead
Pre-Opening
Costs
Other
Business
Lines
2019 Topgolf
Adjusted
EBITDAS
$187M
($109M)
($18M) ($1M) $59M
Summary
• Invested ahead of growth in order to scale
rapidly
• Complementary business lines are poised to
generate future profit due to strong
foundations created 2017-2019
• Future Adj. EBITDAS growth driven by:
• New venue growth
• Growth curve of Toptracer and
International
• More selective approach to strategic
investments
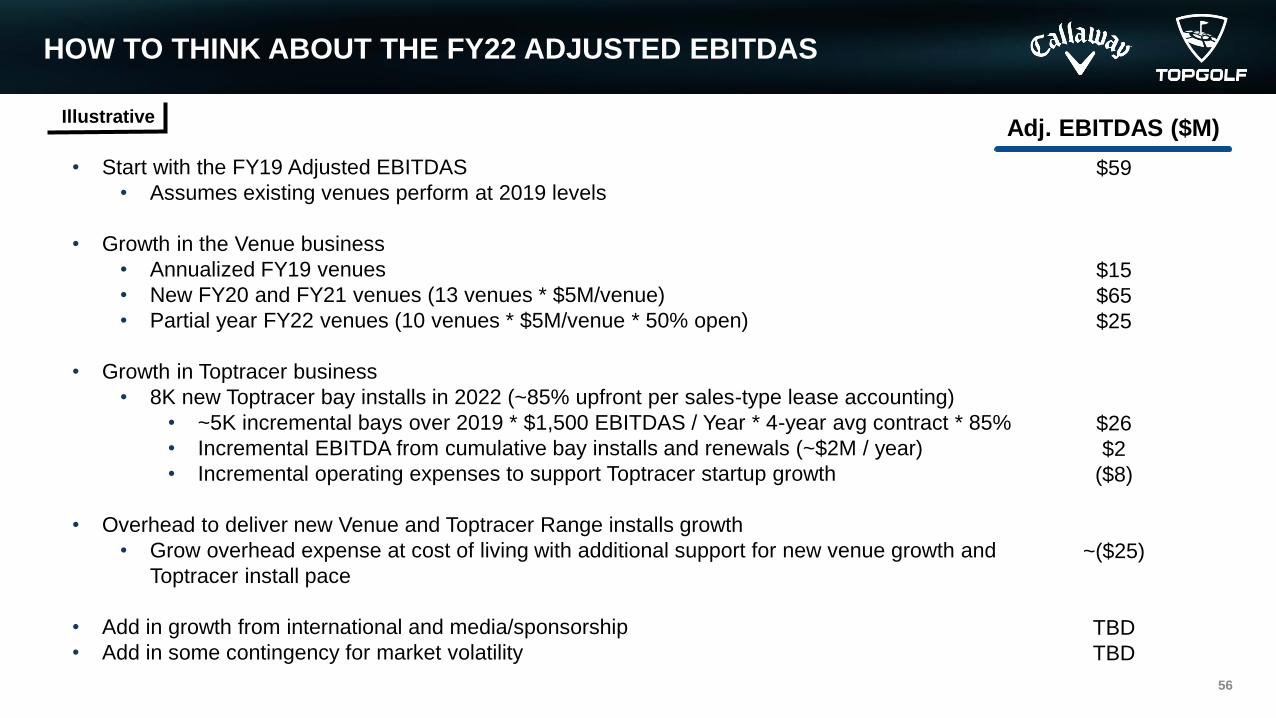
HOW TO THINK ABOUT THE FY22 ADJUSTED EBITDAS
56
IllustrativeAdj. EBITDAS ($M)
• Start with the FY19 Adjusted EBITDAS
• Assumes existing venues perform at 2019 levels
• Growth in the Venue business
• Annualized FY19 venues
• New FY20 and FY21 venues (13 venues * $5M/venue)
• Partial year FY22 venues (10 venues * $5M/venue * 50% open)
• Growth in Toptracer business
• 8K new Toptracer bay installs in 2022 (~85% upfront per sales-type lease accounting)
• ~5K incremental bays over 2019 * $1,500 EBITDAS / Year * 4-year avg contract * 85%
• Incremental EBITDA from cumulative bay installs and renewals (~$2M / year)
• Incremental operating expenses to support Toptracer startup growth
• Overhead to deliver new Venue and Toptracer Range installs growth
• Grow overhead expense at cost of living with additional support for new venue growth and
Toptracer install pace
• Add in growth from international and media/sponsorship
• Add in some contingency for market volatility
$59
$15
$65
$25
$26
$2
($8)
~($25)
TBD
TBD
TOPGOLF COVID UPDATE & OUTLOOK
57
COVID-19 Initial Response
• All venues closed by March 18, 2020
• Within two weeks of venue closure, Topgolf implemented significant cost reductions, negotiated rent deferrals and trade extensions
• Reduced venue and corporate associates to essential levels to navigate closure and reopening
• Suspended new venue development until venues reopened and sufficient liquidity demonstrated
• Reduced or suspended other discretionary capital expenditures including venue maintenance, venue initiative, technology projects, and other discretionary
capital expenditures
• Raised over $150M in equity (initial series H and conversion of note) from existing shareholders
• Successfully amended Topgolf’s Term Loan / Revolving Credit facility to provide covenant relief through Q2’22 while maintaining operational flexibility
COVID-19 Update
• Topgolf safely reopened all venues by September 7, 2020
• Continue to manage evolving government restrictions
• Rapid return to venues with Q3 same venue revenue performance 76% vs. 2019 and recent trends improved to 80-85% in September and October
58
Realizing the Full Potential of Topgolf
BRIAN LYNCH
EVP, Chief Financial
Officer
CHIP BREWER
Chief Executive Officer
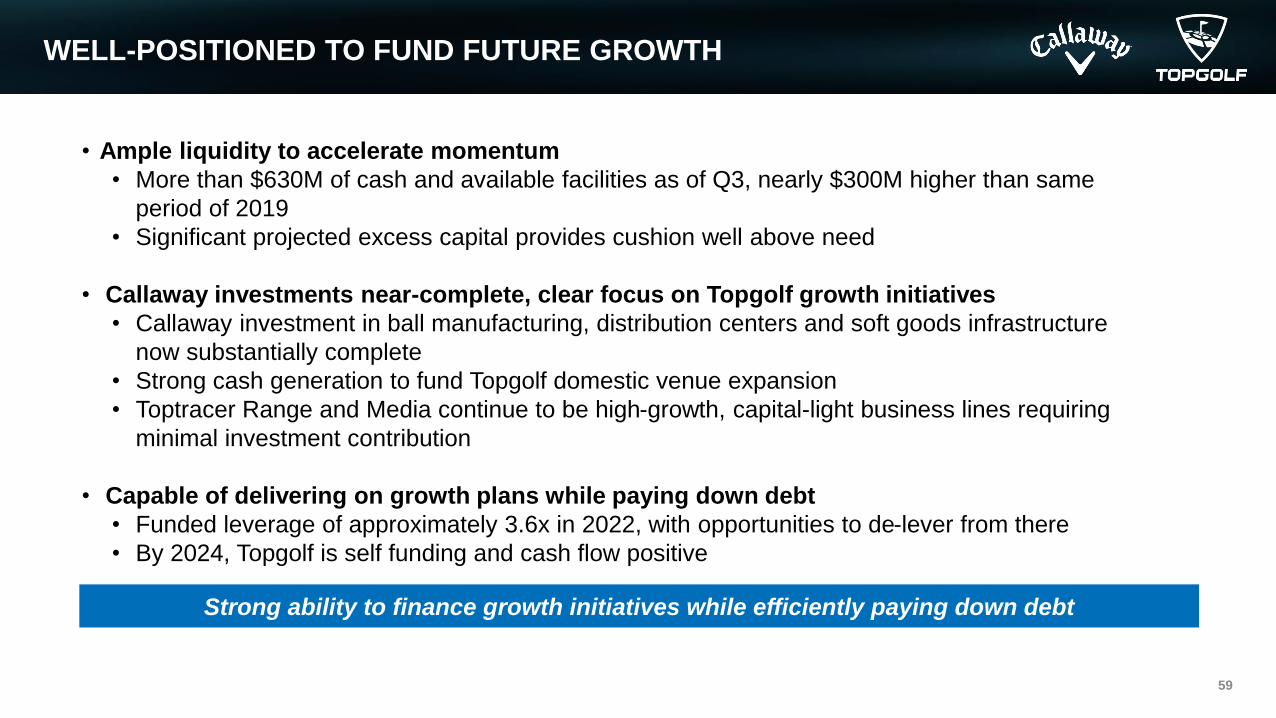
WELL-POSITIONED TO FUND FUTURE GROWTH
59
• Ample liquidity to accelerate momentum
• More than $630M of cash and available facilities as of Q3, nearly $300M higher than same
period of 2019
• Significant projected excess capital provides cushion well above need
• Callaway investments near-complete, clear focus on Topgolf growth initiatives
• Callaway investment in ball manufacturing, distribution centers and soft goods infrastructure
now substantially complete
• Strong cash generation to fund Topgolf domestic venue expansion
• Toptracer Range and Media continue to be high-growth, capital-light business lines requiring
minimal investment contribution
• Capable of delivering on growth plans while paying down debt
• Funded leverage of approximately 3.6x in 2022, with opportunities to de-lever from there
• By 2024, Topgolf is self funding and cash flow positive
Strong ability to finance growth initiatives while efficiently paying down debt
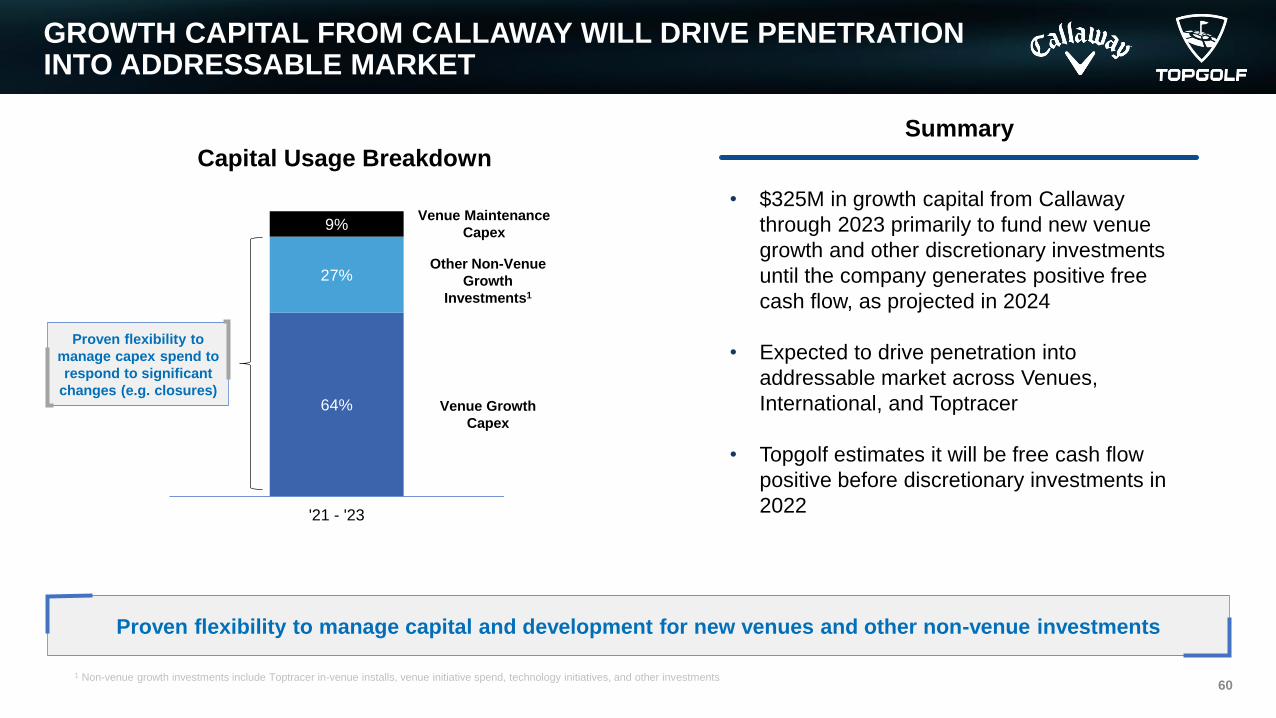
GROWTH CAPITAL FROM CALLAWAY WILL DRIVE PENETRATION INTO ADDRESSABLE MARKET
60
Summary
• $325M in growth capital from Callaway
through 2023 primarily to fund new venue
growth and other discretionary investments
until the company generates positive free
cash flow, as projected in 2024
• Expected to drive penetration into
addressable market across Venues,
International, and Toptracer
• Topgolf estimates it will be free cash flow
positive before discretionary investments in
2022
Proven flexibility to manage capital and development for new venues and other non-venue investments
Capital Usage Breakdown
64%
27%
9%
'21 - '23
Venue Growth
Capex
Venue Maintenance
Capex
Other Non-Venue
Growth
Investments1
Proven flexibility to
manage capex spend to
respond to significant
changes (e.g. closures)
1 Non-venue growth investments include Toptracer in-venue installs, venue initiative spend, technology initiatives, and other investments
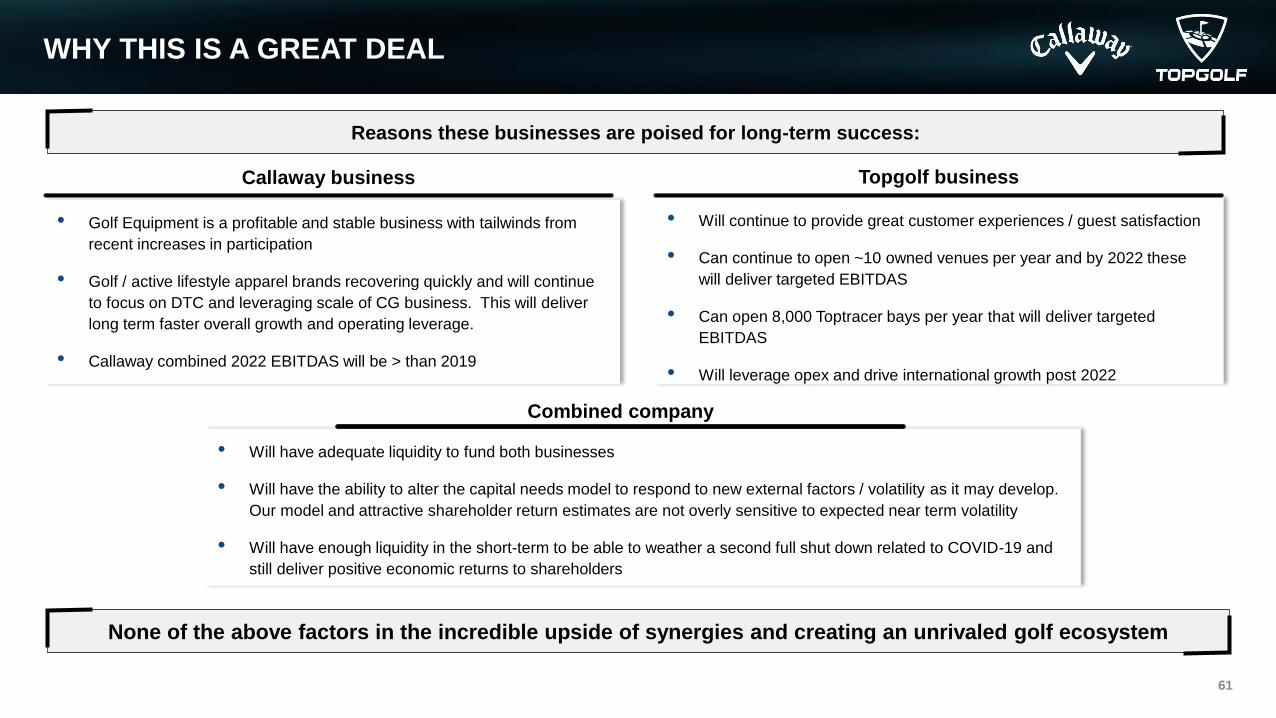
WHY THIS IS A GREAT DEAL
61
None of the above factors in the incredible upside of synergies and creating an unrivaled golf ecosystem
• Golf Equipment is a profitable and stable business with tailwinds from
recent increases in participation
• Golf / active lifestyle apparel brands recovering quickly and will continue
to focus on DTC and leveraging scale of CG business. This will deliver
long term faster overall growth and operating leverage.
• Callaway combined 2022 EBITDAS will be > than 2019
Callaway business
Reasons these businesses are poised for long-term success:
• Will continue to provide great customer experiences / guest satisfaction
• Can continue to open ~10 owned venues per year and by 2022 these
will deliver targeted EBITDAS
• Can open 8,000 Toptracer bays per year that will deliver targeted
EBITDAS
• Will leverage opex and drive international growth post 2022
Topgolf business
• Will have adequate liquidity to fund both businesses
• Will have the ability to alter the capital needs model to respond to new external factors / volatility as it may develop.
Our model and attractive shareholder return estimates are not overly sensitive to expected near term volatility
• Will have enough liquidity in the short-term to be able to weather a second full shut down related to COVID-19 and
still deliver positive economic returns to shareholders
Combined company
CALLAWAY + TOPGOLF = A NEW TYPE OF GOLF COMPANY
62
Clear Path to Deliver Exceptional Growth
and Strong Shareholder Returns
An Unrivaled Tech Enabled Golf Company Delivering Equipment, Apparel and
Entertainment
First-Mover Positioned to Create Long-term Competitive Advantages
63
Q&A

64
APPENDIX
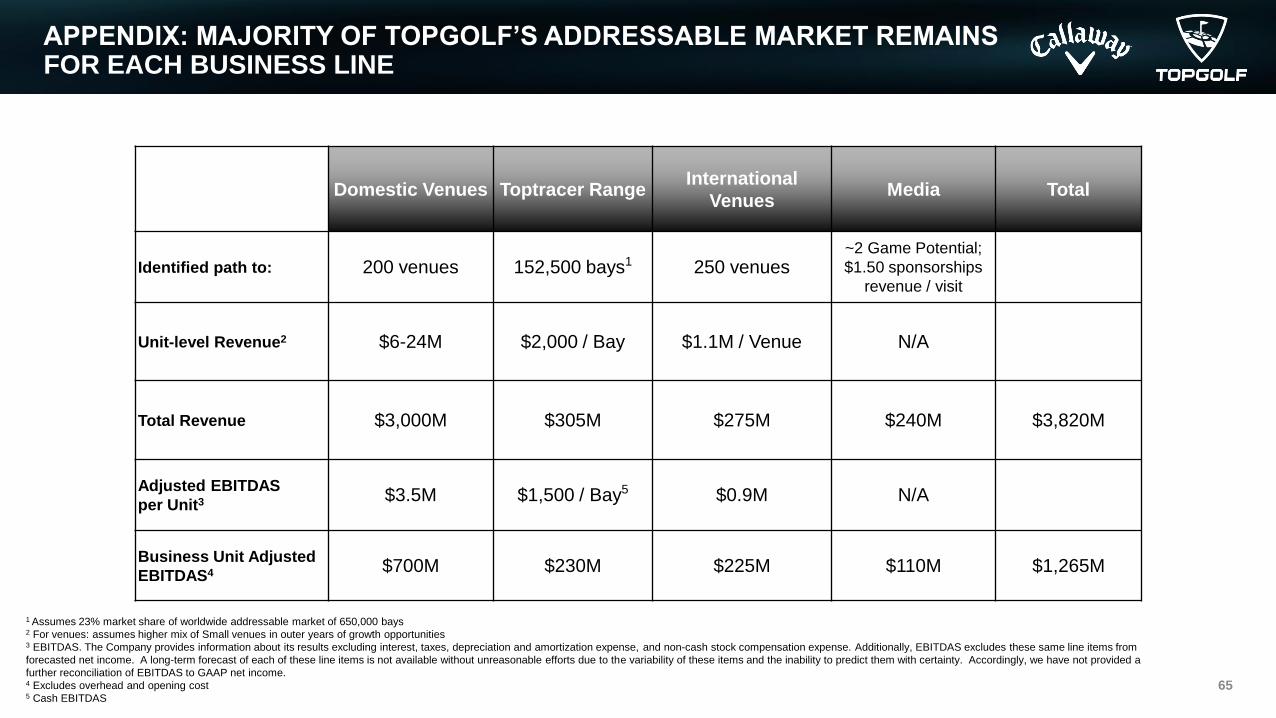
APPENDIX: MAJORITY OF TOPGOLF’S ADDRESSABLE MARKET REMAINS FOR EACH BUSINESS LINE
65
Domestic Venues Toptracer RangeInternational
VenuesMedia Total
Identified path to: 200 venues 152,500 bays1 250 venues~2 Game Potential;
$1.50 sponsorships
revenue / visit
Unit-level Revenue2 $6-24M $2,000 / Bay $1.1M / Venue N/A
Total Revenue $3,000M $305M $275M $240M $3,820M
Adjusted EBITDAS
per Unit3 $3.5M $1,500 / Bay5 $0.9M N/A
Business Unit Adjusted
EBITDAS4 $700M $230M $225M $110M $1,265M
1 Assumes 23% market share of worldwide addressable market of 650,000 bays2 For venues: assumes higher mix of Small venues in outer years of growth opportunities3 EBITDAS. The Company provides information about its results excluding interest, taxes, depreciation and amortization expense, and non-cash stock compensation expense. Additionally, EBITDAS excludes these same line items from
forecasted net income. A long-term forecast of each of these line items is not available without unreasonable efforts due to the variability of these items and the inability to predict them with certainty. Accordingly, we have not provided a
further reconciliation of EBITDAS to GAAP net income.4 Excludes overhead and opening cost5 Cash EBITDAS
APPENDIX: 2022 EBITDA SUPPLEMENT AND NON-GAAP RECONCILIATION
66
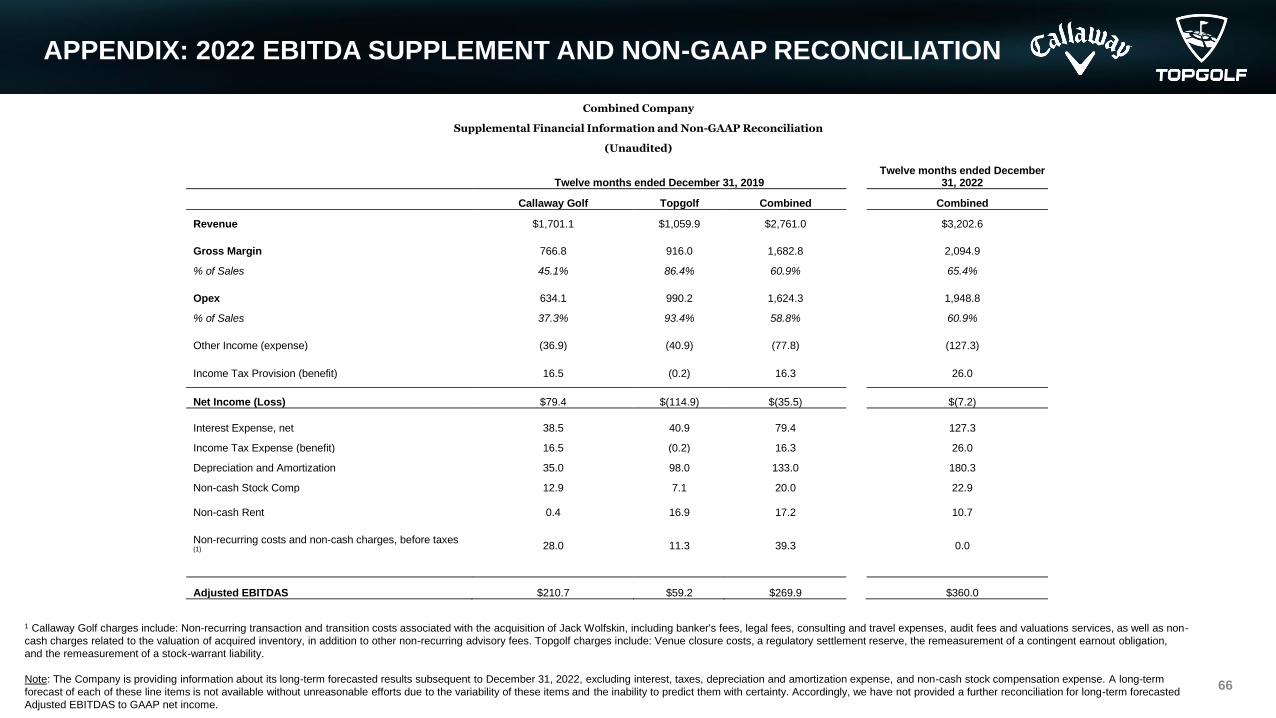
1 Callaway Golf charges include: Non-recurring transaction and transition costs associated with the acquisition of Jack Wolfskin, including banker's fees, legal fees, consulting and travel expenses, audit fees and valuations services, as well as non-
cash charges related to the valuation of acquired inventory, in addition to other non-recurring advisory fees. Topgolf charges include: Venue closure costs, a regulatory settlement reserve, the remeasurement of a contingent earnout obligation,
and the remeasurement of a stock-warrant liability.
Note: The Company is providing information about its long-term forecasted results subsequent to December 31, 2022, excluding interest, taxes, depreciation and amortization expense, and non-cash stock compensation expense. A long-term
forecast of each of these line items is not available without unreasonable efforts due to the variability of these items and the inability to predict them with certainty. Accordingly, we have not provided a further reconciliation for long-term forecasted
Adjusted EBITDAS to GAAP net income.
Combined Company
Supplemental Financial Information and Non-GAAP Reconciliation
(Unaudited)
Twelve months ended December 31, 2019
Twelve months ended December 31, 2022
Callaway Golf Topgolf Combined Combined
Revenue $1,701.1 $1,059.9 $2,761.0 $3,202.6
Gross Margin 766.8 916.0 1,682.8 2,094.9
% of Sales 45.1% 86.4% 60.9% 65.4%
Opex 634.1 990.2 1,624.3 1,948.8
% of Sales 37.3% 93.4% 58.8% 60.9%
Other Income (expense) (36.9) (40.9) (77.8) (127.3)
Income Tax Provision (benefit) 16.5 (0.2) 16.3 26.0
Net Income (Loss) $79.4 $(114.9) $(35.5) $(7.2)
Interest Expense, net 38.5 40.9 79.4 127.3
Income Tax Expense (benefit) 16.5 (0.2) 16.3 26.0
Depreciation and Amortization 35.0 98.0 133.0 180.3
Non-cash Stock Comp 12.9 7.1 20.0 22.9
Non-cash Rent 0.4 16.9 17.2 10.7
Non-recurring costs and non-cash charges, before taxes (1)
28.0 11.3 39.3 0.0
Adjusted EBITDAS $210.7 $59.2 $269.9 $360.0
Related Documents


