Copyright © The British Psychological Society Reproduction in any form (including the internet) is prohibited without prior permission from the Society A classification of handedness using the Annett Hand Preference Questionnaire Milan Dragovic 1,2 * and Geoff Hammond 3 1 Centre for Clinical Research in Neuropsychiatry, Graylands Hospital, Australia 2 School of Psychiatry and Clinical Neurosciences, University of Western Australia, Australia 3 School of Psychology, University of Western Australia, Australia The Annett Hand Preference Questionnaire (AHPQ) was administered to a sample of 352 randomly selected individuals from the general community to examine the reproducibility of its handedness classification and to evaluate its model-based reliability and convergent validity. Latent class analysis showed that the eight categories of hand preferences could not be justified on statistical grounds. Instead, three broad handedness classes adequately accommodated the variety of handedness patterns: ‘consistent right’ (66.0%), ‘consistent left’ (9.8%) and ‘inconsistent or mixed’ (24.2%). Confirmatory factor analysis not only showed that the AHPQ is reliable and has solid convergent validity, but also the measurement properties of the AHPQ could be further improved by eliminating a few items from the scale. The implications of these findings are discussed, and it is suggested that questionnaire requires modification, possibly by replacing obsolete items such as ‘sweeping’ and ‘shovelling’ with modern manual activities, such as ‘typing SMS messages’ and ‘using a remote control’. The current state of the measurement of handedness and the subsequent classification of hand preferences in humans is not satisfactory and has not taken advantage of advances in measurement, statistics and psychometrics. Measurement is mostly reliant on two instruments introduced in early 1970s, both with debatable psychometric quality and confined to measure a single aspect of handedness, hand preferences for various daily activities, rather than overall hand dominance which includes other aspects of handedness such as hand skill. The measures inform us more of the direction than the degree of hand preferences, despite giving an impression of continuity with a typical ‘J-shaped’ frequency distribution. The distribution of hand preferences obtained by these handedness questionnaires is usually bimodal in contrast to the nearly normal distribution of asymmetry of hand skill, shown for example in the measures obtained from a peg-moving task (Annett & Kilshaw, 1983), suggesting that hand preference * Correspondence should be addressed to Milan Dragovic, Private Mail Bag No. 1, Claremont 6910, Western Australia (e-mail: [email protected]). The British Psychological Society 375 British Journal of Psychology (2007), 98, 375–387 q 2007 The British Psychological Society www.bpsjournals.co.uk DOI:10.1348/000712606X146197

Welcome message from author
This document is posted to help you gain knowledge. Please leave a comment to let me know what you think about it! Share it to your friends and learn new things together.
Transcript
Copyright © The British Psychological SocietyReproduction in any form (including the internet) is prohibited without prior permission from the Society
A classification of handedness using the AnnettHand Preference Questionnaire
Milan Dragovic1,2* and Geoff Hammond3
1Centre for Clinical Research in Neuropsychiatry, Graylands Hospital, Australia2School of Psychiatry and Clinical Neurosciences, University of Western Australia,Australia
3School of Psychology, University of Western Australia, Australia
The Annett Hand Preference Questionnaire (AHPQ) was administered to a sample of352 randomly selected individuals from the general community to examine thereproducibility of its handedness classification and to evaluate its model-based reliabilityand convergent validity. Latent class analysis showed that the eight categories of handpreferences could not be justified on statistical grounds. Instead, three broadhandedness classes adequately accommodated the variety of handedness patterns:‘consistent right’ (66.0%), ‘consistent left’ (9.8%) and ‘inconsistent or mixed’ (24.2%).Confirmatory factor analysis not only showed that the AHPQ is reliable and has solidconvergent validity, but also the measurement properties of the AHPQ could be furtherimproved by eliminating a few items from the scale. The implications of these findingsare discussed, and it is suggested that questionnaire requires modification, possibly byreplacing obsolete items such as ‘sweeping’ and ‘shovelling’ with modern manualactivities, such as ‘typing SMS messages’ and ‘using a remote control’.
The current state of the measurement of handedness and the subsequent classification
of hand preferences in humans is not satisfactory and has not taken advantage of
advances in measurement, statistics and psychometrics. Measurement is mostly reliant
on two instruments introduced in early 1970s, both with debatable psychometric
quality and confined to measure a single aspect of handedness, hand preferences for
various daily activities, rather than overall hand dominance which includes otheraspects of handedness such as hand skill. The measures inform us more of the direction
than the degree of hand preferences, despite giving an impression of continuity with a
typical ‘J-shaped’ frequency distribution. The distribution of hand preferences obtained
by these handedness questionnaires is usually bimodal in contrast to the nearly normal
distribution of asymmetry of hand skill, shown for example in the measures obtained
from a peg-moving task (Annett & Kilshaw, 1983), suggesting that hand preference
* Correspondence should be addressed to Milan Dragovic, Private Mail Bag No. 1, Claremont 6910, Western Australia (e-mail:[email protected]).
TheBritishPsychologicalSociety
375
British Journal of Psychology (2007), 98, 375–387
q 2007 The British Psychological Society
www.bpsjournals.co.uk
DOI:10.1348/000712606X146197

Copyright © The British Psychological SocietyReproduction in any form (including the internet) is prohibited without prior permission from the Society
and relative motor asymmetry do not map perfectly on to each other. The Edinburgh
Handedness Inventory (EHI) was introduced in the early 1970s (Oldfield, 1971), and is
most widely used in laterality research. Several attempts (Dragovic, 2004a; McFarland &
Anderson, 1980; Williams, 1986) to improve its modest measurement properties have
largely failed, possibly because neuropsychological batteries frequently seem to
incorporate handedness assessment as an ad hoc secondary measure. Some authors(e.g. Bishop, 1996) have proposed a behavioural measure of handedness in place of
preference measures, but this proposal has not been adopted widely. The use of the
Annett Hand Preference Questionnaire (AHPQ) parallels that of the EHI. No researcher,
including its author (Annett, 1970), has evaluated its measurement properties or the
reliability of handedness classification since its introduction in 1970. Hand preference
measurements from either questionnaire are seldom described as continuous variables,
possibly because of an inability to statistically normalize their extreme and inherently
non-normal distribution. As a result, a categorical approach to handedness stilldominates present laterality research.
Although a categorical approach is widespread, little effort has been put into
identifying the number of handedness categories with biological correlates. For the EHI,
efforts to implement a standardized handedness classification have not been successful.
This is shown by the inconsistent use of cut-offs used to classify individuals into
handedness categories. Consequently, only rough comparisons of the results from
different studies are possible (see, for example, Byrne et al., 2004). In a previous study
(Dragovic, 2004b), a three-class latent structure was identified for the EHI on statisticalgrounds, indicating that further partitioning of handedness is statistically unjustifiable.
The superiority of this model of classification for the EHI raises the question of whether
it also applies to the AHPQ.
In contrast to the EHI, the AHPQ has several distinctive features. First, it introduces
weighting of manual activities into primary (writing, throwing, tennis racquet, striking a
match, hammering and using a toothbrush) and secondary activities (scissors, needle,
sweeping, shovelling, dealing cards and unscrewing the lid of a jar). The distinction
between primary and secondary activities is based on correlations between theactivities, which are high for primary activities and moderate for secondary activities.
Second, the AHPQ permits only three responses for each item, ‘Left’, ‘Right’ and ‘Either’,
in contrast to the EHI which uses effectively a 5-point scale for each item. Finally, the
AHPQ incorporates a built-in classification system of eight handedness categories that
avoids the problem of inconsistent classification schemes used by different researchers.
For the purpose of handedness classification, Annett ignored ‘Either’ responses for both
the primary and secondary activities. Thus, intermediate mixed- or ambiguous-
handedness classes were restricted to particular and definite combinations of right- andleft-hand preferences. However, in practice, the six intermediate-handedness categories
have often been pooled to create a single mixed-handedness category. The classification
scheme has been modified several times, with two major alterations: first, hammering
hand, an item which association analysis indicated as the most powerful discriminant
was replaced with writing hand, and second, category five, which was defined by right-
handed writing with at least one primary action done with the left-hand, was eliminated
from the classification scheme but later restored (Annett &Moran, 2005). Nonetheless, a
feature of this classification is that mixed-handedness categories are derived from abehavioural dichotomy (left and right), which is initially determined by writing hand.
Mixed-handed categories represent various mixtures of hand preferences which, when
combined, create one large category of mixed hand preferences.
376 Milan Dragovic and Geoff Hammond
Copyright © The British Psychological SocietyReproduction in any form (including the internet) is prohibited without prior permission from the Society
In this study we investigated whether, as has been established for the EHI, a
three-class model of handedness categorization is statistically the most parsimonious
classification system for the AHPQ. The number of latent handedness classes that
sufficiently and parsimoniously describes individual variations in hand preferences was
determined using latent class analysis (LCA). In addition, we examined model-based
reliability and convergent validity of the AHPQ by evaluating a congeneric measurementmodel.
Method
ParticipantsA total of 352 randomly selected participants from metropolitan Perth, Western
Australia, participated in this study, 40 or 11.4% of whom used their left hand for
writing. A previous Australian survey (Perelle & Ehrman, 1994) reported an incidence of
10.7% of left-hand writers. The sample consisted of 165 men (mean age 39.9) and 184
women (mean age 39.8). The Survey Research Centre at the University of Western
Australia collected the data. Out of 1,172 individuals contacted and who satisfied the
inclusion criteria (at least 18 years old and English language competency), 356 returned
the questionnaires. Due to incomplete data, four questionnaires were not useable. Theresponse rate (30.4%) was relatively high for this type of study. Written informed
consent was obtained from all participants.
MeasuresHandedness was assessed using the AHPQ, a 12-item self-report questionnaire. Subjects
were asked which hand they would use for the following activities: writing, throwing,
using a racket, striking a match, using scissors, threading a needle, sweeping, shovelling,
dealing cards, hammering, using a toothbrush and unscrewing the lid of a jar. Based on
the response pattern, each study participant was assigned to one of the eight
handedness classes (Annett, 1970, 1985, 2002).
Statistical analysesTwo sets of analyses were carried out: the first aimed to identify a statistically
parsimonious handedness classification and the second aimed to investigate the
measurement properties of the AHPQ by examining its construct reliability and
convergent validity.The latent structure of handedness was determined using LCA, which is commonly
used for determining the intrinsic structure of a set of categorical data. LCA is
considered as probability-based modelling and (in this sense) is sometimes described as
a categorical variant of factor analysis. The basic assumption of LCA is that a (presumably
heterogeneous) population of individuals is a mixture of distinct, but internally
homogeneous, subgroups. The Latent Gold programme (version 2.0.11; Vermunt &
Magidson, 2000) was used to determine the latent structure. This programme allows the
use of cases with missing values for some variables, preventing the loss of cases due tolistwise exclusion of cases with missing data.
The measurement properties of the AHPQ were examined using LISREL (version
8.53) and PRELIS. LISREL is commonly used for structural equation modelling and
PRELIS is a programme for multivariate data screening, data manipulation and basic
Handedness classification 377
Copyright © The British Psychological SocietyReproduction in any form (including the internet) is prohibited without prior permission from the Society
statistical analyses. Prior to LISREL analysis, the data were transformed so that each
participant’s hand preference for each item was recoded into a numeric scale (the
response ‘Left’ was recoded as 1, ‘Either’ as 2 and ‘Right’ as 3). This was followed by
calculating polychoric coefficients and an asymptotic covariance matrix using PRELIS.
Because of the relatively small sample size, maximum likelihood (ML) estimation was
used. A scaled chi-squared statistic (Satorra & Bentler, 1988) was used to assess the fit ofthe various measurement models to the data, as it corrects inflation of chi-squared values
due to non-normality. The measurement models were assessed using the following fit
indices: the root mean square error of approximation (RMSEA), the standardized root
mean-square residual (SRMR), the goodness-of-fit index (GFI), the adjusted goodness-of-
fit index (AGFI) and the comparative fit index (CFI). Model-based scale reliability was
assessed by estimating the construct reliability and the proportion of variance extracted
(Fornell & Larcker, 1981). Whereas construct validity indexes the degree to which
manifest measures ‘indicate’ the latent construct, the variance extracted estimateindicates the amount of shared variance in a set of measures. Convergent validity was
determined on the basis of the statistical significance of the factor loading scores
(Anderson & Gerbing, 1988) and defined as the magnitude of the structural relationship
between observed and latent variables; a loading greater than 0.70 is usually regarded as
satisfactory.
Results
Classification of handednessModels of handedness classification, from one to eight classes, were evaluated in five
analyses in which the treatment of ‘Either’ responses was varied. In the first analysis,
‘Either’ responses were considered as informative; in the second, they were treated as
missing values and excluded from analysis; in the third, respondents who made ‘Either’
responses were completely excluded from the analysis, reducing the sample size to208; in the fourth, ‘Either’ responses were reclassified as ‘Right’ responses; and in the
fifth, ‘Either’ responses were reclassified as ‘Left’ responses. The reclassification of
‘Either’ responses in the last two analyses was done to address the possibility that
‘Either’ responses might indicate a response style rather than a genuine hand
preference, and that this response style might be associated more strongly with left than
with right-handedness, since left-handers, due to environmental constraints, more
frequently use non-dominant hand than right-handers.
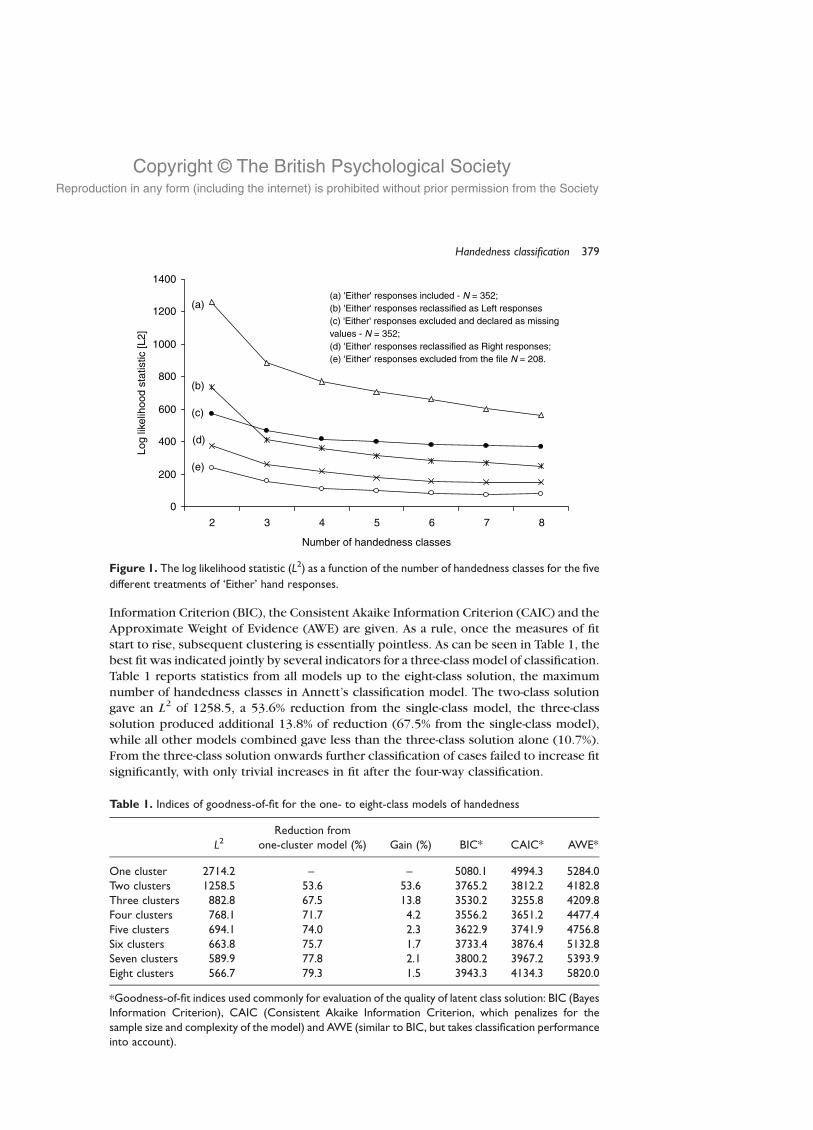
Figure 1 shows changes in the log likelihood chi-squared statistics for each of the fiveanalyses. The log likelihood statistic (L2) indicates the strength of the relationship
between variables and is, with others, a commonmeasure of classification model fit. The
changes in the L2 statistic in this figure are interpreted similarly to a scree plot from
exploratory factor analysis, where a discrete ‘break’ in the plot helps to determine the
optimal number of latent classes. Irrespective of how ‘Either’ responses were treated,
the changes in the L2 statistic suggest that the three-class solution was associated with
best-fit indices. This confirmed that the three-class solution was statistically the most
parsimonious. In addition to the L2 statistic, we report other indices of goodness-of-fit
only for the analysis in which ‘Either’ responses were treated as legitimate together with
‘Left’ and ‘Right’ responses. Table 1 provides a summary of the first set of latent class
analyses, showing again that a three-class solution was superior to further clustering of
hand preferences. Along with the L2 statistic, other measures of fit, the Bayesian
378 Milan Dragovic and Geoff Hammond
Copyright © The British Psychological SocietyReproduction in any form (including the internet) is prohibited without prior permission from the Society
Information Criterion (BIC), the Consistent Akaike Information Criterion (CAIC) and the
Approximate Weight of Evidence (AWE) are given. As a rule, once the measures of fit
start to rise, subsequent clustering is essentially pointless. As can be seen in Table 1, thebest fit was indicated jointly by several indicators for a three-class model of classification.
Table 1 reports statistics from all models up to the eight-class solution, the maximum
number of handedness classes in Annett’s classification model. The two-class solution
gave an L2 of 1258.5, a 53.6% reduction from the single-class model, the three-class
solution produced additional 13.8% of reduction (67.5% from the single-class model),
while all other models combined gave less than the three-class solution alone (10.7%).
From the three-class solution onwards further classification of cases failed to increase fit
significantly, with only trivial increases in fit after the four-way classification.
Figure 1. The log likelihood statistic (L2) as a function of the number of handedness classes for the five
different treatments of ‘Either’ hand responses.
Table 1. Indices of goodness-of-fit for the one- to eight-class models of handedness
L2Reduction from
one-cluster model (%) Gain (%) BIC* CAIC* AWE*
One cluster 2714.2 – – 5080.1 4994.3 5284.0Two clusters 1258.5 53.6 53.6 3765.2 3812.2 4182.8Three clusters 882.8 67.5 13.8 3530.2 3255.8 4209.8Four clusters 768.1 71.7 4.2 3556.2 3651.2 4477.4Five clusters 694.1 74.0 2.3 3622.9 3741.9 4756.8Six clusters 663.8 75.7 1.7 3733.4 3876.4 5132.8Seven clusters 589.9 77.8 2.1 3800.2 3967.2 5393.9Eight clusters 566.7 79.3 1.5 3943.3 4134.3 5820.0
*Goodness-of-fit indices used commonly for evaluation of the quality of latent class solution: BIC (BayesInformation Criterion), CAIC (Consistent Akaike Information Criterion, which penalizes for thesample size and complexity of the model) and AWE (similar to BIC, but takes classification performanceinto account).
Handedness classification 379
Copyright © The British Psychological SocietyReproduction in any form (including the internet) is prohibited without prior permission from the Society
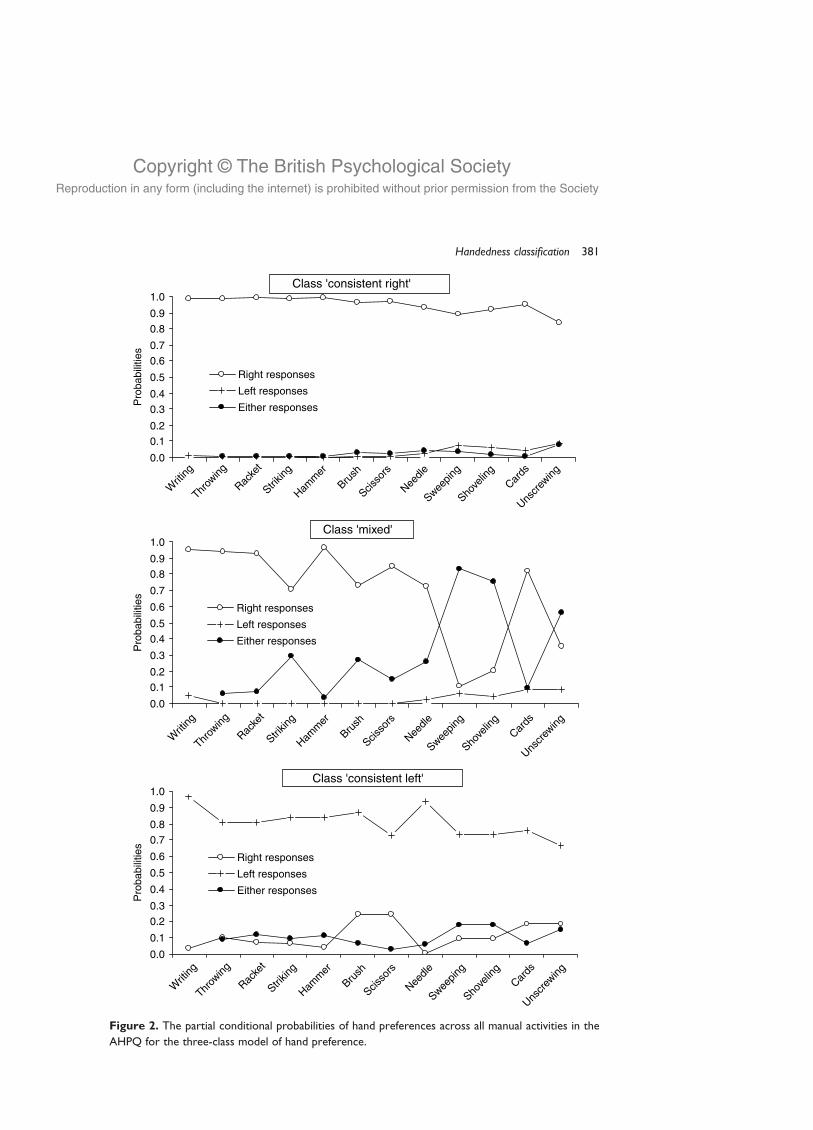
The three handedness classes identified were: (a) ‘consistent right’, with 66% of
the study sample assigned to this class whose members displayed a consistent use of the
right hand for the 12 motor activities; (b) ‘consistent left’, with 9.8% assigned to this
class whose members displayed a consistent use of the left hand for the 12 motor
activities and (c) ‘mixed’ or inconsistently lateralized preferences, with 24.2% assigned
to this class. These classes of hand preferences are further characterized in Figure 2,which shows partial conditional probabilities for the three-class model and indicates
how hand preferences for each item were related to the latent handedness classes.
Whereas the ‘consistent right’ class was associated with very high probabilities of
‘Right’ responses and very low probabilities of ‘Either’ and ‘Left’ responses, the
‘consistent left’ class was not homogeneous. In this class, the probabilities of ‘Left’
responses were around 0.8 and of ‘Right’ and ‘Either’ around 0.1–0.2. As expected, the
greatest variability was found in the ‘mixed’ class in which the conditional probabilities
of ‘Right’ responses were high for all activities except for bimanual activities, such assweeping, shovelling and unscrewing the lid of a jar. In contrast, the conditional
probabilities of ‘Either’ responses were relatively low for unimanual activities but high
for bimanual activities. In this class, the conditional probabilities of ‘Left’ responses were
low for bimanual activities (e.g. dealing cards and unscrewing the lid of a jar) and near
zero for the most of unimanual activities.
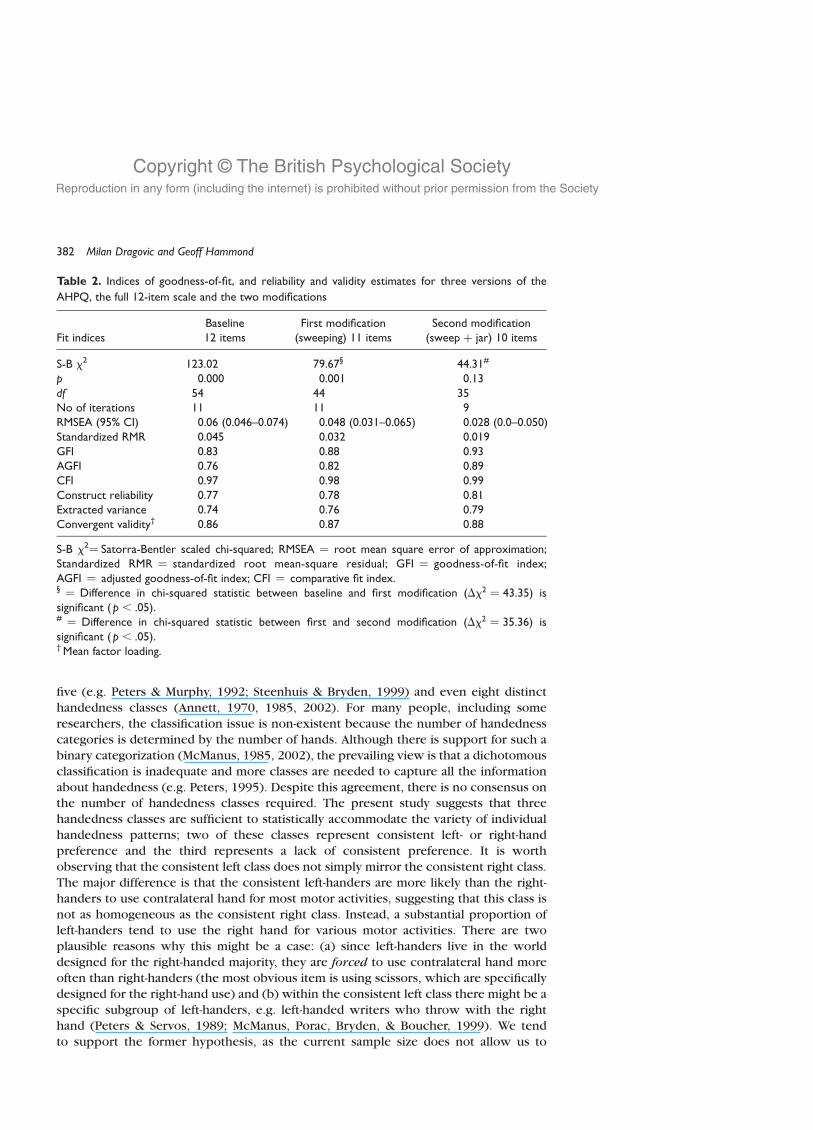
Measurement properties of the AHPQThe preferences for manual activities were considered as ordinal variables to investigate
the measurement properties of the AHPQ. All responses were recoded so that 1 point
was given for a ‘Left’ response, 2 points for an ‘Either’ response and 3 points for a ‘Right’
response. The evaluation of a measurement model usually starts by inspecting the
contribution of each item to the latent structure. The item with the lowest squared
standardized loading on the latent construct is then eliminated from the model to assess
whether its elimination improves the latent structure. The measurement model is againassessed by examining whether there are other items that contribute poorly to the latent
construct. This trimming commonly stops when each observed indicator of the latent
construct has a squared multiple correlation greater than .50, that is, there is more
measurement than error variance. At that point most indices of goodness-of-fit are
greater than 0.90. Table 2 shows goodness-of-fit indices for three scales, the 12-item
scale and two shortened scales, an 11-item scale (in which the ‘sweeping’ item was
removed) and a 10-item scale (in which the ‘unscrewing the lid of a jar’ item) was
removed as well. The fit of all subsequent modifications was assessed with five differentfit indices. As shown in Table 2, Goodness-of-Fit index (GFI) and Comparative fit index
(CFI) were greater than 0.90 indicating a good fit, whereas the Adjusted Goodness-of-Fit
index (AGFI) was just below 0.90.
Discussion
Despite decades of handedness research, the classification of hand preferences
remains unresolved. Previous research on handedness classification has proposed
several schemata, ranging from the most common dichotomy of ‘left-handed’ and
‘right-handed’, to another dichotomy of ‘right-handed’ and ‘non-right-handed’ (based on
the work of Geschwind & Galaburda, 1985), to three (e.g. Satz & Green, 1999),
380 Milan Dragovic and Geoff Hammond
Copyright © The British Psychological SocietyReproduction in any form (including the internet) is prohibited without prior permission from the Society
0.0
0.1
0.2
0.3
0.4
0.5
0.6
0.7
0.8
0.9
1.0
Writ
ing
Throw
ing
Racke
t
Strikin
g
Hamm
er
Brush
Scisso
rs
Needle
Sweepin
g
Shove
ling
Cards
Unscr
ewing
Pro
babi
litie
s
Right responses
Left responses
Either responses
Class 'consistent right'
0.0
0.1
0.2
0.3
0.4
0.5
0.6
0.7
0.8
0.9
1.0
Writ
ing
Throw
ing
Racke
t
Strikin
g
Hamm
er
Brush
Scisso
rs
Needle
Sweepin
g
Shove
ling
Cards
Unscr
ewing
Pro
babi
litie
s
Right responses
Left responses
Either responses
Class 'mixed'
0.0
0.1
0.2
0.3
0.4
0.5
0.6
0.7
0.8
0.9
1.0
Writ
ing
Throw
ing
Racke
t
Strikin
g
Hamm
er
Brush
Scisso
rs
Needle
Sweepin
g
Shove
ling
Cards
Unscr
ewing
Pro
babi
litie
s
Right responses
Left responses
Either responses
Class 'consistent left'
Figure 2. The partial conditional probabilities of hand preferences across all manual activities in the
AHPQ for the three-class model of hand preference.
Handedness classification 381
Copyright © The British Psychological SocietyReproduction in any form (including the internet) is prohibited without prior permission from the Society
five (e.g. Peters & Murphy, 1992; Steenhuis & Bryden, 1999) and even eight distinct
handedness classes (Annett, 1970, 1985, 2002). For many people, including some
researchers, the classification issue is non-existent because the number of handedness
categories is determined by the number of hands. Although there is support for such a
binary categorization (McManus, 1985, 2002), the prevailing view is that a dichotomous
classification is inadequate and more classes are needed to capture all the information
about handedness (e.g. Peters, 1995). Despite this agreement, there is no consensus onthe number of handedness classes required. The present study suggests that three
handedness classes are sufficient to statistically accommodate the variety of individual
handedness patterns; two of these classes represent consistent left- or right-hand
preference and the third represents a lack of consistent preference. It is worth
observing that the consistent left class does not simply mirror the consistent right class.
The major difference is that the consistent left-handers are more likely than the right-
handers to use contralateral hand for most motor activities, suggesting that this class is
not as homogeneous as the consistent right class. Instead, a substantial proportion ofleft-handers tend to use the right hand for various motor activities. There are two
plausible reasons why this might be a case: (a) since left-handers live in the world
designed for the right-handed majority, they are forced to use contralateral hand more
often than right-handers (the most obvious item is using scissors, which are specifically
designed for the right-hand use) and (b) within the consistent left class there might be a
specific subgroup of left-handers, e.g. left-handed writers who throw with the right
hand (Peters & Servos, 1989; McManus, Porac, Bryden, & Boucher, 1999). We tend
to support the former hypothesis, as the current sample size does not allow us to
Table 2. Indices of goodness-of-fit, and reliability and validity estimates for three versions of the
AHPQ, the full 12-item scale and the two modifications
Fit indicesBaseline12 items
First modification(sweeping) 11 items
Second modification(sweep þ jar) 10 items
S-B x2 123.02 79.67§ 44.31#
p 0.000 0.001 0.13df 54 44 35No of iterations 11 11 9RMSEA (95% CI) 0.06 (0.046–0.074) 0.048 (0.031–0.065) 0.028 (0.0–0.050)Standardized RMR 0.045 0.032 0.019GFI 0.83 0.88 0.93AGFI 0.76 0.82 0.89CFI 0.97 0.98 0.99Construct reliability 0.77 0.78 0.81Extracted variance 0.74 0.76 0.79Convergent validity† 0.86 0.87 0.88
S-B x2¼ Satorra-Bentler scaled chi-squared; RMSEA ¼ root mean square error of approximation;Standardized RMR ¼ standardized root mean-square residual; GFI ¼ goodness-of-fit index;AGFI ¼ adjusted goodness-of-fit index; CFI ¼ comparative fit index.§ ¼ Difference in chi-squared statistic between baseline and first modification (Dx2 ¼ 43:35) issignificant ( p , .05).# ¼ Difference in chi-squared statistic between first and second modification (Dx2 ¼ 35:36) issignificant ( p , .05).† Mean factor loading.
382 Milan Dragovic and Geoff Hammond

Copyright © The British Psychological SocietyReproduction in any form (including the internet) is prohibited without prior permission from the Society
explore second hypothesis in great detail. The lack of consistent preferences here is
the unreliable use of the dominant hand for the different manual activities, and not an
inconsistent use of the dominant hand for a particular activity at different times.
However, a lack of consistency of hand use at different times might represent a specific
mixed-handedness subtype (Satz & Green, 1999; Soper et al., 1986). The three-class
solution was stable and survived different data manipulations. This solution wasstatistically parsimonious when only ‘Left’ and ‘Right’ responses were used, when
‘Either’ responses were considered as valid behavioural preferences, and when ‘Either’
responses were pooled with either ‘Left’ or ‘Right’ responses.
The use of more than three handedness categories has caused some confusion in
laterality research by leading to a disproportionately large number of cases assigned to
mixed categories. The classification of hand preferences with the highest number of
handedness classes is that of Annett (1985), in which there are two pure lateralized
categories and six mixed categories. Having two ‘purely’ lateralized classes and many‘mixed’ categories in Annett’s classification has led many researchers to pool the
intermediate categories into a single large mixed-handedness category, or, by combining
the pure left and mixed subtypes, into a broad, non-right-handed category, resulting in a
high number of people classified as ‘mixed’ or ‘non-right-handed’. As examples, one
study (Fleminger, Dalton, & Standage, 1977) reported 42% of mixed-handed healthy
controls, whereas another (Chaugule & Master, 1981) reported 51% of control subjects
and 68% of patients with schizophrenia as non-right-handed. Although pooling ‘mixed-
handed’ categories into a single category creates a three-category classification, poolingdecreases the proportion of those classified as having consistent left- or right-hand
preference and results in a disproportionately large ‘mixed-handed’ category.
Although an optimal number of latent classes can be determined on statistical
criteria, the number of ‘real-handedness’ categories that better corresponds to the
biology of handedness might be different. A four-class categorization, with two fully
lateralized classes, and a weakly lateralized variant of each fully lateralized class, is
tempting. This is partially congruent with the five-class classification proposed by
Steenhuis and Bryden (1999) and their suggestion that left- and right-handedness mightcomprise strong and weak consistency of hand preferences in addition to a mixed-
handed category. We believe that the ‘true’ number of handedness classes cannot be
validated on the basis of clustering algorithms but instead on their correspondence to
the biological structure of handedness. Several lines of evidence appear to support a
three-class taxonomy. First, direct investigations of cerebral lateralization of language
and handedness suggest that cerebral dominance for language covaries with hand
dominance (Knecht et al., 2000). Moreover, it appears that mixed-handed individuals
are more variable in cerebral lateralization of language than left- and right-handedindividuals. Using repetitive transcranial magnetic stimulation, Khedr et al. (2002) found
evidence for bilateral cerebral representation of language in 57% of mixed-handed
individuals in contrast to 8% in right-handed and 16% in left-handed individuals. Second,
support for a three-way classification of handedness comes from a large body of
evidence that links various pathological conditions with mixed-handedness. It has been
reported that mixed-handedness is more prevalent in schizophrenia (Dragovic &
Hammond, 2005), autism (Hauck & Dewey, 2001; Soper et al., 1986), dyslexia
(Eglinton & Annett, 1994; Richardson, 1994), epilepsy (Knake et al., 2003; Springeret al., 1999), premature birth (O’Callaghan, Burn, Mohay, Rogers, & Tudehope, 1993a,
1993b), Attention Deficit and Hyperactivity Disorder (Reid & Norvilitis, 2000) and many
other conditions (see Bryden, Bruyn, & Fletcher, 2005). Altogether, it appears that a lack
Handedness classification 383

Copyright © The British Psychological SocietyReproduction in any form (including the internet) is prohibited without prior permission from the Society
of clear behavioural lateralization is more strongly associated with various conditions
than clear lateralization. Third, it has been suggested that mixed-handers may have a
larger corpus callosum (Habib et al., 1991; Witelson, 1980, 1995) than left- and right-
handers, suggesting superior interhemispheric integration (Niebauer, Aselage, &
Schutte, 2002; Propper, Christman, & Phaneuf, 2005). Although additional research is
required, it seems, at present, that a three-way classification of handedness shows a solidcorrespondence to the biological underpinning.
Several additional points should also be discussed. First, elimination of ‘Either’
responses from the clustering algorithm ignored legitimate and valid inconsistency of
hand preference. Certainly, anybody should be suspicious when participants indicate
that either hand is used for writing, as this preference is seldom, if ever, observed in daily
life. However, an ‘Either’ response should not be considered as illegitimate for other
manual activities, which do not require such a finely developed and well-practiced
manual skill. Despite the observation that ‘Either’ responses had the highest overallconditional probabilities in the ‘mixed’ class only (for bimanual actions in particular),
the other two lateralized responses significantly contributed to this handedness class.
Figure 1 clearly shows that this class features high probabilities of a ‘Right’ response for
unimanual, but not bimanual, activities, and consistently low probabilities of a ‘Left’
response across all manual actions. Low probabilities of left-hand responses in the
‘Mixed’ class might suggest that this class is essentially made of right-handers who tend
to use either hand for many motor activities, and therefore support a concept of a
taxonic rather than dimensional structure of handedness. However, this cannot be easilyinferred unless a sample with balanced proportions of left- and right-handers is
submitted to analysis. A sample featuring a 10-fold prevalence of right-handedness
would expectedly yield a ‘mixed’ class whose members are likely to be ‘recruited’ from
a larger population. The question whether handedness is a continuous or discrete trait
appears central to our understanding of behavioural lateralization. Intriguingly, two
most influential genetic models of handedness (Annett, 1985; McManus, 1985) are
grounded on opposing premises of the true nature of handedness. We believe that LCA
is not an appropriate statistical tool to address this fundamental issue. Furthermore,neither our sample size nor, in particular, the proportion of left-handed individuals in
our sample allow us to investigate this important question. Second, the composition of
‘pure’ left- and right-handed categories is dependent on the number and nature of the
test items. It can be easily demonstrated that the proportion of individuals who have
‘pure’ left- or right-hand preferences is a function of the number of items. Increasing the
number of items, or including uncommon motor activities, will inevitably lead to a
smaller proportion of individuals with ‘pure’ hand preferences as fewer and fewer
individuals respond ‘left’ or ‘right’ to all items. Thus the concept of ‘pure’ left- or right-handedness is determined in part by the method of measurement. Third, although the
AHPQ has good psychometric properties it could be improved with modification, most
simply by eliminating two items from the scale. A 10-item scale showed a statistically
stronger latent handedness construct than 11-item scale or the full 12-item scale, with all
fit indices showing improvement. However, it should be noted that trimming the AHPQ
scale did not lead to as marked an improvement in measurement properties as a similar
modification of the Edinburgh inventory (Dragovic, 2004b). The psychometric
properties of the AHPQ were improved by eliminating two items that specifiedbimanual actions.
To conclude, current practices of measurement and classification of hand preference
are not satisfactory and require more work. A three-class handedness classification
384 Milan Dragovic and Geoff Hammond
Copyright © The British Psychological SocietyReproduction in any form (including the internet) is prohibited without prior permission from the Society
provides a parsimonious fit to the observed data and is compatible with previous
research on language lateralization, hemispheric integration and psychopathology.
Moreover, the statistical fitness of a three-way classification of hand preference has
previously been found using the EHI. At present, it appears that the AHPQ is
psychometrically a somewhat better tool for the assessment of hand preferences than
the EHI. An additional advantage of the AHPQ is that it allows weighting various motoractivities as primary or secondary. However, both instruments include outdated items
that are not part of everyday activities in the modern world. Howmany kids use a broom
or shovel nowadays? They more commonly use remote controls, type SMS text messages
and use a computer mouse. Unfortunately, occasional proposals (e.g. Peters, 1995)
urging development of an advanced handedness questionnaire remain ignored, whilst
the use of few iconic but somewhat obsolete questionnaires prevail in laterality
research. The accumulation of papers using these instruments has also given a false
impression that nothing needs to be changed and has created a premise that it is almostobligatory to proceed with the original scales for the sake of maintaining the
comparability between studies. However, this frequently self-imposed demand does not
warrant protection from questioning their validity.
Acknowledgements
We thank reviewers for their thoughtful and constructive comments on the manuscript.
References
Anderson, J. C., & Gerbing, D. W. (1988). Structural equation modelling in practice: A review and
recommended two-step approach. Psychological Bulletin, 103(3), 411–423.
Annett, M. (1970). A classification of hand preference by association analysis. British Journal of
Psychology, (61), 303–321.
Annett, M. (1985). Left, right, hand and brain: The right shift theory. Hillsdale, NJ: Erlbaum.
Annett, M. (2002).Handedness and brain asymmetry: The right shift theory (1st ed.). New York:
Taylor & Francis.
Annett, M., & Kilshaw, D. (1983). Right- and left-hand skill II: Estimating the parameters of the
distribution of L-R differences in males and females. British Journal of Psychology, 74,
269–283.
Annett, A., & Moran, P. (2005). Schizotypy is increased in mixed-handers, especially right-handed
writers who use the left hand for primary actions. Schizophrenia Research, 81(2–3), 239–246.
Bishop, D. V. M. (1996). The measurement of hand preference: A validation study comparing three
groups of right-handers. British Journal of Psychology, 87, 269–285.
Bryden, P. J., Bruyn, J., & Fletcher, P. (2005). Handedness and health: An examination of the
association between different handedness classifications and health disorders. Laterality,
10(5), 429–440.
Byrne, M., Clafferty, R. A., Cosway, R., Grant, E., Hodges, A., Lawrie, S. M., et al. (2004).
Measurement of lateral preferences and schizophrenia: Results of the Edinburgh high-risk
study and methodological issues. Psychiatry Research, 125(3), 205–217.
Chaugule, V. B., & Master, R. S. (1981). Impaired cerebral dominance and schizophrenia. British
Journal of Psychiatry, (139), 23–24.
Dragovic, M. (2004a). Towards an improved measure of the Edinburgh handedness inventory:
A one-factor congeneric measurement model using confirmatory factor analysis. Laterality,
9(4), 411–419.
Dragovic, M. (2004b). Categorisation and validation of handedness using Latent class analysis.
Acta Neuropsychiatrica, 16(4), 212–218.
Handedness classification 385

Copyright © The British Psychological SocietyReproduction in any form (including the internet) is prohibited without prior permission from the Society
Dragovic, M., & Hammond, G. (2005). Handedness in schizophrenia: A quantitative review of
evidence. Acta Psychiatrica Scandinavica, 111(6), 1–10.
Eglinton, E., & Annett, M. (1994). Handedness and dyslexia: A meta-analysis. Perceptual and
Motor Skills, 79, 1611–1616.
Fleminger, J. J., Dalton, R., & Standage, F. K. (1977). Handedness in psychiatric patients. British
Journal of Psychiatry, (131), 448–452.
Fornell, C., & Larcker, D. F. (1981). Evaluating structural equation models with observable
variables and measurement error. Journal of Marketing Research, 18(1), 39–50.
Geschwind, N., & Galaburda, M. A. (1985). Cerebral lateralisation: Biological mechanisms,
associations, and pathology: I. A hypothesis and a program for research. Archives of
Neurology, 42, 428–459.
Habib, M., Gayraud, D., Oliva, A., Regis, J., Salamon, G., & Khalil, R. (1991). Effects of handedness
and sex on the morphology of the corpus callosum: A study with brain magnetic resonance
imaging. Brain and Cognition, 16, 41–61.
Hauck, J. A., & Dewey, D. (2001). Hand preference and motor functioning in children with autism.
Journal of Autism and Developmental Disorders, 31(3), 265–277.
Khedr, E. M., Hamed, E., Said, A., & Basahi, J. (2002). Handedness and language cerebral
lateralization. European Journal of Applied Physiology, 87(4–5), 469–473.
Knake, S., Haag, A., Hamer, H. M., Dittmer, C., Bien, S., Oertel, W. H., & Rosenow, F. (2003).
Language lateralisation in patients with temporal lobe epilepsy: A comparison of functional
transcranial Doppler sonography and the Wada test. Neuroimage, 19(3), 1228–1232.
Knecht, S., Drager, B., Deppe, M., Bobe, L., Lohmann, H., Floel, A., et al. (2000). Handedness and
hemispheric language dominance in healthy humans. Brain, 123, 2512–2518.
McFarland, K., & Anderson, J. (1980). Factor stability of the Edinburgh handedness inventory as a
function of test-retest performance, age, and sex. British Journal of Psychology, 71(1),
135–142.
McManus, I. C. (1985). Right- and left-hand skill: Failure of the right shift model. British Journal of
Psychology, 76, 1–16.
McManus, I. C. (2002). Right hand, left hand: The origins of asymmetry in brains, bodies, atoms
and cultures. Cambridge, MA: Harvard University Press.
McManus, I. C., Porac, C., Bryden, M. P., & Boucher, R. (1999). Eye-dominance, writing hand, and
throwing hand. Laterality, 4(2), 173–192.
Niebauer, C. L., Aselage, J., & Schutte, C. (2002). Interhemispheric interaction and consciousness:
Degree of handedness predicts the intensity of a sensory illusion. Laterality, 7(1), 85–96.
O’Callaghan, M. J., Burn, Y. R., Mohay, H. A., Rogers, Y., & Tudehope, D. I. (1993a). The prevalence
and origins of left hand preference in high risk infants, and its implications for intellectual,
motor and behavioural performance at four and six years. Cortex, 29(4), 617–627.
O’Callaghan, M. J., Burn, Y. R., Mohay, H. A., Rogers, Y., & Tudehope, D. I. (1993b). Handedness in
extremely low birth weight infants: Aetiology and relationship to intellectual abilities, motor
performance and behaviour at four and six years. Cortex, 29(4), 629–637.
Oldfield, R. C. (1971). The assessment and analysis of handedness: The Edinburgh inventory.
Neuropsychologia, 9, 97–113.
Perelle, I. B., & Ehrman, L. (1994). An international study of human handedness: The data.
Behavior Genetics, 24(3), 217–227.
Peters, M. (1995). Handedness and its relation to other indices of cerebral lateralisation.
In R. J. Davidson & K. Hughdal (Eds.), Brain asymmetry (pp. 183–214). Cambridge, MA:
MIT Press.
Peters, M., & Murphy, K. (1992). Cluster analysis reveals at least three, and possibly five distinct
handedness groups. Neuropsychologia, 30, 373–380.
Peters, M., & Servos, P. (1989). Performance of subgroup of left-handers and right-handers.
Canadian Journal of Psychology, 43, 341–358.
386 Milan Dragovic and Geoff Hammond

Copyright © The British Psychological SocietyReproduction in any form (including the internet) is prohibited without prior permission from the Society
Propper, R. E., Christman, S. D., & Phaneuf, K. A. (2005). A mixed-handed advantage in episodic
memory; A possible role of interhemispheric interaction. Memory and Cognition, 33(4),
751–757.
Reid, M. H., & Norvilitis, J. M. (2000). Evidence for anomalous lateralization across domain in
ADHD children as well as adults identified with the Wender Utah rating scale. Journal of
Psychiatric Research, 34(4–5), 311–316.
Richardson, A. J. (1994). Dyslexia, handedness and syndromes of psychosis-proneness.
International Journal of Psychophysiology, 18(3), 251–263.
Satorra, A. & Bentler, P. M. (1988). Scaling corrections for chi-square statistics in covariance
structure analyses. Proceedings of the Business and Economic Sections. Alexandria, VA:
American Statistical Association.
Satz, P., & Green, M. F. (1999). Atypical handedness in shchizophrenia: Some methodological and
theoretical issues. Schizophrenia Bulletin, 25(1), 63–78.
Soper, H. V., Satz, P., Orsini, D. L., Henry, R. R., Zvi, J. C., & Schulman, M. (1986). Handedness
patterns in autism suggest subtypes. Journal of Autism and Developmental Disorders, 16(2),
155–167.
Springer, J. A., Binder, J. R., Hammeke, T. A., Swanson, S. J., Frost, J. A., Bellgowan, P. S., et al.
(1999). Language dominance in neurologically normal and epilepsy subjects: A functional MRI
study. Brain, 122, 2033–2045.
Steenhuis, R. E., & Bryden, M. P. (1999). The relation between hand preference and hand
performance: What you get depends on what you measure. Laterality, 4(1), 3–26.
Vermunt, J. K., & Magidson, J. (2000). Latent class cluster analysis. In J. A. Hagenaars & A. L.
McCutcheon (Eds.), Applied latent class analysis. Cambridge, UK: Cambridge University
Press.
Williams, M. S. (1986). Factor analysis of the Edinburgh handedness inventory. Cortex, 22(2),
325–326.
Witelson, S. F. (1980). Neuroanatomical asymmetry in left-handres: A review and implications for
functional asymmetry. In J. Herron (Ed.), Neuropsychology of left-handedness (pp. 79–113).
New York: Academic Press.
Witelson, F. S. (1995). Neuroanatomical bases of hemispheric functional specialisation in the
human brain: Possible developmental factors. In L. K. Frederick (Ed.), Hemispheric
communication: Mechanisms and models. Hillsdale, NJ: Erlbaum.
Received 12 February 2006; revised version received 13 June 2006
Handedness classification 387
Related Documents