A CFD model for thermal conversion of thermally thick biomass particles Ramin Mehrabian a, b, ⁎, Selma Zahirovic a, b, c , Robert Scharler a, b, c , Ingwald Obernberger a, b, c , Stefan Kleditzsch d , Siegmar Wirtz e , Viktor Scherer e , Hong Lu f , Larry L. Baxter f a BIOENERGY 2020+ GmbH, Inffeldgasse 21b, 8010 Graz, Austria b Institute for Process and Particle Engineering, Graz University of Technology, Inffeldgasse 21b, 8010 Graz, Austria c BIOS BIOENERGIESYSTEME GmbH, Inffeldgasse 21b, 8010 Graz, Austria d ANSYS Germany GmbH, Birkenweg 14a, 64295 Darmstadt, Germany e Department of Energy Plant Technology, Ruhr-Universität Bochum, Universitätstrasse 150, D-44780 Bochum, Germany f Department of Chemical Engineering, Brigham Young University, 350 CB, Provo, UT 84602, USA abstract article info Article history: Received 12 August 2011 Received in revised form 24 November 2011 Accepted 25 November 2011 Available online 24 December 2011 Keywords: Biomass Thermal conversion Thermally thick Modelling CFD A one-dimensional model for the thermal conversion of thermally thick biomass particles is developed for the simulation of the fuel bed of biomass grate furnaces. The model can be applied for cylindrical and spherical par- ticles. The particle is divided into four layers corresponding to the main stages of biomass thermal conversion. The energy and mass conservation equations are solved for each layer. The reactions are assigned to the bound- aries. The model can predict the intra-particle temperature gradient, the particle mass loss rate as well as the time-dependent variations of particle size and density, as the most essential features of particle thermal conver- sion. When simulating the fuel bed of a biomass grate furnace, the particle model has to be numerically efficient. By reducing the number of variables and considering the lowest possible number of grid points inside the parti- cle, a reasonable calculation time of less than 1 min for each particle is achieved. Comparisons between the re- sults predicted by the model and by the measurements have been performed for different particle sizes, shapes and moisture contents during the pyrolysis and combustion in a single-particle reactor. The results of the model are in good agreement with experimental data which implies that the simplifications do not impair the model accuracy. © 2011 Elsevier B.V. All rights reserved. 1. Introduction During the last two decades, the share of energy production by bio- mass combustion/gasification plants gradually increased, because bio- mass is a CO 2 neutral source of energy in a sustainable agriculture/ forestry. Biomass grate furnaces are the most relevant biomass combus- tion technology for small- and medium-scale applications. The thermal conversion of biomass in grate furnaces occurs in a packed bed and the combustible volatiles burn in the combustion chamber. The optimisa- tion of biomass grate furnaces is ongoing to improve the efficiency and further reduce emissions. In this respect it is very important to gain detailed information about the combustion process in the furnace and on the grate. Computational fluid dynamics (CFD) are an efficient tool for the de- sign and optimisation of biomass grate furnaces. They proved to be valuable to predict the flow field as well as the gas phase combustion. At present, however, simulating the packed bed combustion with rea- sonable accuracy and computational costs is difficult. Moreover, the existing bed models resolve the packed bed combustion separately from the gas phase above it and produce heat and mass release profiles which serve as boundary conditions for gas phase simulation by a CFD code. Therefore, developing an appropriate particle model which can be coupled with available CFD tools is necessary in order to directly link the bed model with the gas phase combustion models and to simul- taneously perform the simulation of the entire biomass grate furnace. A combination of several sub-processes such as heat-up, drying, pyrol- ysis and char burnout represents the global process of thermo-chemical conversion of solid biomass particles. Depending on the size and physical properties of biomass particles, temperature and species gradients may develop inside the particles causing intra-particle transport processes. The group of particles with distinct gradient development and simulta- neous progress of different conversion stages is called thermally thick. On the contrary, in case of thermally thin particles no gradients are pre- sent inside the particle and the conversion stages take place sequentially. Several studies have been performed to describe the thermal con- version of a thermally thick biomass particle. Peters [1] and Bruch et al. [2] resolved the temperature and gas species inside the particle by solving a set of one-dimensional transient conservation equations for energy and mass of gaseous and solid phases inside the particle. They assumed the particle as sphere and neglected the char gasifica- tion reactions. Experimental mass loss profiles were utilised to vali- date the single particle model. Wurzenberger et al. [3] proposed Fuel Processing Technology 95 (2012) 96–108 ⁎ Corresponding author. Tel.: + 43 316 8739232; fax: + 43 316 8739202. E-mail address: [email protected] (R. Mehrabian). 0378-3820/$ – see front matter © 2011 Elsevier B.V. All rights reserved. doi:10.1016/j.fuproc.2011.11.021 Contents lists available at SciVerse ScienceDirect Fuel Processing Technology journal homepage: www.elsevier.com/locate/fuproc

Welcome message from author
This document is posted to help you gain knowledge. Please leave a comment to let me know what you think about it! Share it to your friends and learn new things together.
Transcript

Fuel Processing Technology 95 (2012) 96–108
Contents lists available at SciVerse ScienceDirect
Fuel Processing Technology
j ourna l homepage: www.e lsev ie r .com/ locate / fuproc
A CFD model for thermal conversion of thermally thick biomass particles
Ramin Mehrabian a,b,⁎, Selma Zahirovic a,b,c, Robert Scharler a,b,c, Ingwald Obernberger a,b,c,Stefan Kleditzsch d, Siegmar Wirtz e, Viktor Scherer e, Hong Lu f, Larry L. Baxter f
a BIOENERGY 2020+ GmbH, Inffeldgasse 21b, 8010 Graz, Austriab Institute for Process and Particle Engineering, Graz University of Technology, Inffeldgasse 21b, 8010 Graz, Austriac BIOS BIOENERGIESYSTEME GmbH, Inffeldgasse 21b, 8010 Graz, Austriad ANSYS Germany GmbH, Birkenweg 14a, 64295 Darmstadt, Germanye Department of Energy Plant Technology, Ruhr-Universität Bochum, Universitätstrasse 150, D-44780 Bochum, Germanyf Department of Chemical Engineering, Brigham Young University, 350 CB, Provo, UT 84602, USA
⁎ Corresponding author. Tel.: +43 316 8739232; fax:E-mail address: [email protected]
0378-3820/$ – see front matter © 2011 Elsevier B.V. Alldoi:10.1016/j.fuproc.2011.11.021
a b s t r a c t
a r t i c l e i n f oArticle history:Received 12 August 2011Received in revised form 24 November 2011Accepted 25 November 2011Available online 24 December 2011
Keywords:BiomassThermal conversionThermally thickModellingCFD
A one-dimensional model for the thermal conversion of thermally thick biomass particles is developed for thesimulation of the fuel bed of biomass grate furnaces. The model can be applied for cylindrical and spherical par-ticles. The particle is divided into four layers corresponding to the main stages of biomass thermal conversion.The energy and mass conservation equations are solved for each layer. The reactions are assigned to the bound-aries. The model can predict the intra-particle temperature gradient, the particle mass loss rate as well as thetime-dependent variations of particle size and density, as themost essential features of particle thermal conver-sion. When simulating the fuel bed of a biomass grate furnace, the particle model has to be numerically efficient.By reducing the number of variables and considering the lowest possible number of grid points inside the parti-cle, a reasonable calculation time of less than 1 min for each particle is achieved. Comparisons between the re-sults predicted by the model and by the measurements have been performed for different particle sizes,shapes and moisture contents during the pyrolysis and combustion in a single-particle reactor. The results ofthe model are in good agreement with experimental data which implies that the simplifications do not impairthe model accuracy.
© 2011 Elsevier B.V. All rights reserved.
1. Introduction
During the last two decades, the share of energy production by bio-mass combustion/gasification plants gradually increased, because bio-mass is a CO2 neutral source of energy in a sustainable agriculture/forestry. Biomass grate furnaces are themost relevant biomass combus-tion technology for small- and medium-scale applications. The thermalconversion of biomass in grate furnaces occurs in a packed bed and thecombustible volatiles burn in the combustion chamber. The optimisa-tion of biomass grate furnaces is ongoing to improve the efficiencyand further reduce emissions. In this respect it is very important togain detailed information about the combustion process in the furnaceand on the grate.
Computational fluid dynamics (CFD) are an efficient tool for the de-sign and optimisation of biomass grate furnaces. They proved to bevaluable to predict the flow field as well as the gas phase combustion.At present, however, simulating the packed bed combustion with rea-sonable accuracy and computational costs is difficult. Moreover, theexisting bed models resolve the packed bed combustion separately
+43 316 8739202.(R. Mehrabian).
rights reserved.
from the gas phase above it and produce heat and mass release profileswhich serve as boundary conditions for gas phase simulation by a CFDcode. Therefore, developing an appropriate particle model which canbe coupled with available CFD tools is necessary in order to directlylink the bedmodelwith the gas phase combustionmodels and to simul-taneously perform the simulation of the entire biomass grate furnace.
A combination of several sub-processes such as heat-up, drying, pyrol-ysis and char burnout represents the global process of thermo-chemicalconversion of solid biomass particles. Depending on the size and physicalproperties of biomass particles, temperature and species gradients maydevelop inside the particles causing intra-particle transport processes.The group of particles with distinct gradient development and simulta-neous progress of different conversion stages is called thermally thick.On the contrary, in case of thermally thin particles no gradients are pre-sent inside the particle and the conversion stages take place sequentially.
Several studies have been performed to describe the thermal con-version of a thermally thick biomass particle. Peters [1] and Bruch etal. [2] resolved the temperature and gas species inside the particleby solving a set of one-dimensional transient conservation equationsfor energy and mass of gaseous and solid phases inside the particle.They assumed the particle as sphere and neglected the char gasifica-tion reactions. Experimental mass loss profiles were utilised to vali-date the single particle model. Wurzenberger et al. [3] proposed

Fig. 1. Discretisation scheme for spherical and cylindrical particles with length (L) lon-ger and shorter than the diameter (D).
97R. Mehrabian et al. / Fuel Processing Technology 95 (2012) 96–108
another one-dimensional model for spherical particles. They solvedthe continuity equations of the gas phase in the particle pores, pres-sure change, species conservation equations and the energy balancein the radial direction. They applied the particle model to simulatean entire biomass packed bed with a 1-D bed model. The bed is as-sumed as a porous media and only the gradients in the primary airflow direction were considered. Experiments with single particleswere used to evaluate the single particle model. They concludedthat for a good agreement with experimental data, 20 grid pointsare needed for discretisation of a particle. This number of grids andsolving several equations increased the computation time to severalminutes for the simulation of a single particle. A simple approachhas been proposed by Thunman et al. [4]. They resolved the temper-ature gradients inside a thermally thick particle by discretising theparticle into four computational cells. Each cell corresponds to astage of the biomass conversion process. They calculated the drying,pyrolysis, and combustion rates by a simple model for each subpro-cess. Additionally, Porteiro et al. [5,6] attempted to describe the ther-mal degradation of biomass particles. They used the Thunmandiscretisation scheme to treat a cylindrical particle with a one-dimensional model. However, they had to increase the number ofgrid points to achieve acceptable resolutions. The model validationwas performed by using the reported experimental data in literatures,but they did not report the validity of the model regarding tempera-ture predictions under combustion conditions. Recently, a compre-hensive model that provides descriptions of particle mass andtemperature changes for a single particle during combustion hasbeen proposed by Lu et al. [7,8]. They investigated the influence ofparticle shape and size on biomass degradation [9]. They solved aset of one-dimensional equations, including the mass conservationequation for each species, 12 species, the momentum equation forthe gas phase within the particle pores and the total energy equation.The particles can be geometrically represented as an infinite plate, aninfinite cylinder or a sphere.
The aim of this work is to develop a model for the thermal conver-sion of thermally thick particles which can be used for the simulationof biomass grate furnaces. It means that it has to be numerically effi-cient with reasonable accuracy. Additionally, it has to be implemen-ted in a CFD environment, in order to directly integrate the packedbed modelling into the available CFD tools for the simulations of tur-bulent reactive flow in combustion chambers of furnaces. For thesepurposes, the model uses a comparably small number of governingequations to describe the most essential characteristics of the thermalconversion of thermally thick biomass particles. The concept of layersis applied to discretise the biomass particle with the lowest possiblenumber of layers (four) to fasten the numerical calculations. The par-ticle model is programed in C/C++ and coupled to ANSYS FLUENT tosimultaneously resolve the thermal conversion of the particles andthe surrounding gases. The comparisons with experimental datahave been performed under varying conditions and particle geome-tries. They indicate that despite the simplifications of the model, theresults are in good agreement with the measurements. Additionally,a feasible calculation time has been achieved – less than 1 min for asingle particle simulation – in order to make the application of themodel in biomass grate furnace simulations possible.
2. Layer model
The layer model is proposed to account for intra-particle transportprocesses and simultaneous sub-processes of the thermal conversionof thermally thick solid biomass particles. The layer model treats thetypical particle shapes (sphere and finite cylinders) of biomass inone dimension. The description of the particle thermal conversionwith one-dimensional models is a usual simplification assumptionto reduce the model complexities and calculation time [1–9]. The va-lidity of this assumption was already addressed by Ha and Choi [10].
In order to apply the one-dimensional governing equations for the fi-nite cylinder geometry, the Thunman approach [4] was selected todiscretise the particles. This approach assumes that the particleboundary conditions are homogeneous and every point at a certainaxial or radial distance from the particle surface has the same temper-ature and conversion state, see Fig. 1.
In the layer model the particle is divided into four layers, whichcorrespond to the fuel conversion stages: wet fuel, dry fuel, char,and ash. Consequently, the boundaries between the layers are relatedto the conversion sub-processes drying, pyrolysis, and char burnoutfronts, as illustrated in Fig. 1. The thickness of each layer is deter-mined by the amount of wet fuel, dry fuel, char and ash in eachtime step and assuming a constant density for each layer. As the con-version proceeds the mass of each layer changes and boundariesmove towards the particle centre. Therefore, the particle size anddensity vary during the thermal conversion.
The conservation equation of thermal energy is [11]:
∂∂t ρH ¼ −∇ � ρvH−∇⋅q ð1Þ
where the left hand side of the equation is the accumulation rate ofenthalpy per unit volume, the first term on the right hand side isthe rate of enthalpy change by advection per unit volume and the sec-ond term represents the contribution of the conductive heat transferper unit volume. The advection term in this equation can be inter-preted as the energy transfer in/from each layer when the boundariesmove towards the centre of the particle.
The internal energy equation is discretised into four layers by set-ting a temperature for every boundary and layer. In order to simplifythe equation, the thermal energy per unit volume is replaced by thethermal energy of each layer, therefore the thermal energy balanceof layer i is:
∂∂t∑c
mc;LiHc;Li
¼ ∑c¼in
_mc;B i−1ð ÞHc;B i−1ð Þ− ∑c¼out
_mc;BiHc;Bi
þ kLiΔx0;Li TB i−1ð Þ−TLi
� �−kLiΔx1;Li TLi
−TBi
� �ð2Þ
where ∑c is the summation over all components (solid and gas) ofthe layer, ∑
c¼inrepresents the summation over all components which
enter the layer from the previous boundary and∑c¼out
is the summation
over all components which leave the layer to the next boundary. mc,Li

98 R. Mehrabian et al. / Fuel Processing Technology 95 (2012) 96–108
and Hc,Li are the mass and specific enthalpy of each component pre-sent in the layer Li, respectively. _mc;Bi
and Hc,Biare the mass flow
rate and specific enthalpy of each component at the boundary Bi, re-spectively. KLi is the thermal conductivity of the layer Li. Δx0,Li is theratio of the area of the boundary Bi−1 to half of the layer Li thickness.Δx1,Li is the ratio of the area of the boundary Bi to half of the layer Lithickness. Additionally, TLi and TBi
are the temperature at the centreof the layer Li and the temperature of the boundary Bi, respectively.
The conservation of mass of each layer reads:
∂∂t∑c
mc;Li¼ ∑
c¼in_mc;Bi−1
− ∑c¼out
_mc;Bið3Þ
substituting Eq. (3) and dH=cpdT into Eq. (2):
∑c mc;Li; cp;c
� �dTLi
dt¼ ∑
c¼in_mc;B i−1ð Þ Hc;B i−1ð Þ−Hc;Li
� �h i−∑
c¼out_mc;Bi
Hc;Li−Hc;Bi
� �h iþkLiΔx0;Li TB i−1ð Þ−TLi
� �−kLiΔx1;Li TLi
−TBi
� �:
ð4Þ
The enthalpy of each component at every layer or boundary is cal-culated by:
Hc Tð Þ ¼ ΔH∘f ;c þ ∫T
Trefcp;cdT : ð5Þ
The boundary temperatures are calculated by writing the energybalance for each boundary:
kLiΔ x1;Li TLi−TBi
� �−kL iþ1ð Þx0;L iþ1ð Þ TBi
−TL iþ1ð Þ
� �¼ ∑
c¼in_mc;Bi
Hc;Bi
− ∑c¼out
_mc;BiHc;Bi
:
ð6Þ
Since the reactions are assigned to the boundaries, the compo-nents which enter a certain boundary might be different from thecomponents which leave that boundary. Hence, the right hand sideof Eq. (6) represents the enthalpy difference between products andreactants of the reactions, i.e. the enthalpies of reactions. The reactionrates, _mr , and stoichiometric coefficients of reactions, ηr, determinethe mass flow rate of each component from one layer over the bound-ary into the next layer, which implicitly determines the velocity ofeach boundary towards the particle centre:
_mc;Bi¼ ∑
r_mrηr;c ð7Þ
where ∑r
is the summation over all reactions of boundary i.
2.1. Drying model
There are different models in literature available to calculate theevaporation rate during fast drying. They can be sorted into threegroups: thermal models, equilibrium models and kinetic rate models.The kinetic rate models consider the drying as a heterogeneous reac-tion and use an Arrhenius equation to calculate its rate [4,12–14]. Thepre-exponential factor and activation energy are set so that the dry-ing rate has a large increase at 373.15 K. This model shows the advan-tages of easy implementation and numerical stability. However, it isdifficult to apply the given kinetic data to conditions different fromthose for which the data have been derived. The equilibrium modelsare based on the hypothesis that the liquid water and the water va-pour in the gas phase are in thermodynamic equilibrium. Thus, thedrying rate is proportional to the difference of the equilibrium con-centration and the current vapour concentration in the gas phase.The equilibrium assumption is usual in low-temperature dryingmodels [15], therefore the mass transfer coefficient, which is highly
depending on the particle permeability, needs to be adjusted with ex-perimental data gained under fast drying conditions [3,16]. The ther-mal models are the most often used ones in literature [2,5,6,17–25].This model is based on the assumption that drying occurs at a fixedboiling temperature (373.15 K). Therefore, any amount of heat flowabove this temperature is consumed by the drying process. Indeed,drying acts as a heat sink.
In this paper the thermal model which was adapted to the layermodel structure is used. The drying zone is reduced to an infinitely thinmoving front which forms the boundary between the wet fuel and thedry fuel layers (see Fig. 1). The front separates the centre of the particlewhich retains its initial moisture and the outside regionwhere themois-ture content is zero. Such a steep drying front for the fast drying of bio-mass is reported almost by all drying models [26]. However, aninfinitely thin drying front may not be acceptable for small particles,where the width of the drying zone is not negligible compared to theparticle size. This does not affect the presented model, because thelayer model is developed to apply for thermally thick particles.
In the layer model it is also presumed that there is no intra-particle flow resistance. Therefore the water vapour instantaneouslyleaves the particle. However, the enthalpy change of each layer by ad-vection of gaseous species is considered (the first and second termson the right hand side of Eq. (2)). The drying rate is then completelycontrolled by the heat transfer. In accordance to the model assump-tions, if the temperature of boundary zero, TB0
, is equal or biggerthan the boiling temperature, the time derivative term in the energyequation is set to zero and the total heat flux which reaches theboundary is used to raise the temperature of the moist wood fromTL0 to TB0
and to evaporate the water:
kL1Δx0;L1 TL1−TB0
� �¼ Rdr Hwv;B0
−Hwl;L0
� �þ αRdr Hdf ;B0
−Hdf ;L0
� �ð8Þ
where Rdr is the drying rate. Hwv,B0and Hwl,L0 are the specific enthalpy
of water vapour at the boundary B0 and of liquid water at the layer L0.Hdf,B0
and Hdf,L0 are the specific enthalpy of dry fuel at the boundary B0and at the layer L0, respectively. Additionally,
α ¼ 1−MCMC
ð9Þ
where MC is the moisture content related to wet base.The size of woody biomass changes as it gains or loses moisture. It
shrinks when losing the bound water from solid structure and swellswhen gaining moisture in the solid structure. The free water has a neg-ligible effect on the dimension, it only changes density. Since particleshrinkage during drying is much lower compared to the shrinkage oc-curring during pyrolysis and charcoal combustion [27], it is postulatedthat during drying, the size of the particle remains constant and its den-sity decreases. However, during pyrolysis and char burnout, bothshrinkage and change of density are considered in the layer model.
2.2. Pyrolysis model
Extensive surveys of pyrolysis models are available in literature[28–31]. The studies dealt with particle modelling, generally, usethe one-component mechanism, proposed by Shafizadeh and Chin[32]. This model is based on three parallel reactions for the formationof gas, tar and char. The kinetic constants have to be determined ex-perimentally and usually empirical data obtained by Chan et al. [12],Thurner andMann [33], andWagenaar et al. [34] are used. The advan-tage of implementing a one-component pyrolysis mechanism intoparticle conversion models is that both product yield and decomposi-tion rate can be predicted. However, simplifying biomass fuels as one-component, produces inaccuracies in the results. The dependency ofthe product yields on temperature, specially the char yield, is notwell predicted in this model [28,35]. Moreover, the one-component
99R. Mehrabian et al. / Fuel Processing Technology 95 (2012) 96–108
mechanism fails to describe thermogravimetric curves of biomasspyrolysis, at least regarding the correct prediction of conversiontime and the maximum pyrolysis rate [36].
In the present work, biomass pyrolysis is described in terms of de-composition of its three major components: hemicellulose, cellulose,and lignin. This model implicitly assumes the hypothesis of an inde-pendent decomposition of these three constituents. An Arrheniusequation is used to describe the pyrolysis of each major component.The kinetic parameters are determined by fitting to experimental re-sults (e.g. TGA) concerning the mass loss rate versus temperature.The analysis of experimental data shows that the decomposition ofhemicellulose and cellulose are associated with the shoulder andthe peak of the mass loss curves, respectively. Lignin decomposesslowly over a broad range of temperature and forms the tail of themass loss curves in the high temperature region.
In addition to kinetic constants, themass shares of these componentsin a specific biomass fuel have to be determined in the three-componentmodel. They also estimated like the kinetic parameters by fitting to ex-perimental results. Assuming first-order reactions in respect to massfraction for the decomposition of eachmajor component leads to the fol-lowing equations for the mass loss of a particle during pyrolysis:
dmdf
dt¼ −
X3i¼1
Ri ð10Þ
Ri ¼ Aiexp−EiRT
� �aimdf : ð11Þ
Thismodelwas subject to extensive experimental validation and thepredictions from this model comply with the experimental thermogra-vimetric curves during the pyrolysis of several biomass fuels [37–43].
Several studies investigated the effect of heating rates on the charac-teristics of thermogravimetric curves, for example see [31,36–38]. Theyindicated that by increasing the heating rate the pyrolysis reactions takeplace at higher temperatures. Moreover, the hemicellulose shoulderand lignin tail become less visible, therefore the overlap between thepyrolysis of the three major biomass components increases. Thismeans that the kinetic parameters and themass fractions of the compo-nents obtained by the slow heating rate experiments (i.e. typicallybelow 50 K/min) are not valid for fast heating rate conditions. Hence,a database for the empirical constants needed in the pyrolysis modelwas prepared from the fast heating rate experiments reported in litera-ture. Itwas linked to the layermodel and depending on the fuel type ap-plied, the layer model chooses the proper values.
The three-component mechanism describes the pyrolysis rate, butthe product yields cannot be predicted. As already mentioned, theone-component mechanism also cannot correctly predict the productyields, especially for large particles, because the final yield dependson temperature and there are great temperature differences occur-ring inside a large particle. Therefore, the final char yield should bedefined according to measurements performed (if possible) or usingavailable empirical correlations such as the one proposed by Saasta-moinen and Richard [24]. Since the empirical correlations have beenobtained under specified conditions, here, the result of the biomassproximate analysis is used to determine the product yields.
The volatile yield from pyrolysis includes a complex mixture andseveral hydrocarbons have been found in it [44,45]. Numerous factorsaffect the pyrolysis product distribution. Temperature, heating rate,residence time, reactor geometry, and pressure as well as chemicaland physical properties of biomass are the chief parameters. Thiscomplex mixture mainly consists of CO, CO2, H2O, H2, light hydrocar-bons and heavy hydrocarbons (tar) [46]. To simplify the combustionbehaviour of the volatiles, the light and heavy hydrocarbons arelumped together and the chemical and physical properties of meth-ane are assigned to this lumped hydrocarbon. The mass fraction of
each species, following the work of Thunman [46], is determined byclosure of the elemental and energy balances. Since the residencetime of the volatiles inside the particle is too short, the homogeneousreactions of the volatile components in the particle pores areneglected. The homogeneous reactions of the volatiles around theparticle are considered as it is explained in Section 3. Therefore, thereaction enthalpies of the homogeneous reactions implicitly raisethe particle temperature by radiation and convection. The heteroge-neous reactions of CO2, H2O, and H2, while they are crossing thechar layer, are considered as explained in the next section.
2.3. Char conversion model
Char conversion models are more complicated than biomass pyroly-sis models, as they are heterogeneous reactions for which both intrinsickinetic and transport phenomena are important. As the char conversionproceeds, depending on the char type and operating conditions, the den-sity and/or size of the char particle decreases due to the mass loss. Theclassical uniform char conversion model assumes that the reaction oc-curs uniformly throughout the entire particle and temperature and spe-cies fields inside the particle are flat. The reaction rate in this model canbe evaluated by the char intrinsic reactivity, this model is applicable forlow temperature or low rate reactions [47].
Apart from the classical model, the char models based on reactionplace can be classified into surface reaction models and zone reactionmodels. In the surface reaction models the reaction is fast and it occursat a surface, as soon as the reactant gas reaches the reaction surface. Asthe reactions proceed, the reaction surface moves towards the centre ofthe particle. In this case the reaction rates are correlated to the area ofthe reaction surface. In the zone reaction models, the reactions takeplace in a region inside the particle which grows and travels inwardsthe particle during the conversion [47–49]. Therefore the reaction ratesare a function of available contact area in the reaction zone.
Additionally, based on the ash behaviour, two different char con-version models can be distinguished. The ash remaining from thechar conversion may leave the particle as soon as it is produced orit can build up an additional layer surrounding the char particle. Theformer case is called shrinking particle and the later shrinking core.In the shrinking particle models, the particle size change is propor-tional to the conversion rate. However, in the shrinking core models,the particle size is related to the char conversion and also ash densityand porosity. Furthermore, in the shrinking core models, the ash layerincreases the resistance to mass and heat transfer.
It has been experimentally verified that the char combustion issuch a rapid reaction that it occurs in a very thin layer [48]. Addition-ally, since the surface reaction models are more compatible with thestructure of the layer model, the char conversion reactions are as-sumed to occur at the interface between char and ash layer. Thechar oxidation with O2 and gasification with CO2, H2O and H2 are con-sidered as the char conversion reactions:
ΩC þ O2→2ðΩ−1ÞCOþ ð2−ΩÞCO2 ðR1Þ
C þ CO2→2CO ðR2Þ
C þ H2O→COþ H2 ðR3Þ
C þ 2H2→CH4: ðR4Þ
The reaction of char with oxygen is much faster than char gasifica-tions with carbon dioxide, water vapour and hydrogen for most of thepractical applications [48,50]. Hence, where the oxygen is depleted,these gasification reactions become important. The fundamental kineticanalysis of carbonaceous solid conversion can be found in [50,51].

100 R. Mehrabian et al. / Fuel Processing Technology 95 (2012) 96–108
Apart from kinetics of the reactions, they always involve a masstransport rate because the process of a heterogeneous reaction maybe divided into the following steps:
i. transport of oxidising/gasifying agent to the particle surfaceii. diffusion through the ash layeriii. adsorption on the reaction surfaceiv. chemical reactionv. desorption of products from the surfacevi. diffusion of products through the ash layervii. transport of products from the particle surface back to the
ambient.
Except the chemical reaction, the remaining are mass transportsteps. Hence, two main regimes can be introduced in char conversion[50]: the kinetic controlled regime for low temperatures and so smallchar particles that the mass transport rate is much faster than thechemical reaction, and the transport controlled regime for high tem-peratures and bigger particles, where the intra-particle and/or exter-nal mass transfer rates become lower than the kinetic rate of thechemical reaction, leading to a limited penetration of gas speciesinto the char particle.
In this work, the rate of char conversion reactions is a function ofboth kinetic rate at the reaction surface and mass transfer rate to/from the reaction surface. Assuming a global reaction rate of orderone with respect to the concentration of oxidising/gasifying agent,leads to the char conversion rate as:
dmch
dt¼ −
X4i¼1
ΩiMc1
kc;iAB2þ 1
hmAB3þ 1
De∫rB3rB2
drA rð Þ
X∞;i ð12Þ
where i=1 to 4 corresponds to reactions R1–R4, respectively. Ωi isthe stoichiometric ratio of moles of carbon per mole of oxidising/gas-ifying agent in the corresponding reaction. Mc, A, kc,i, hm and X∞,i arethe carbon molecular weight, the surface area, the constant rate of re-action i, the mass transfer coefficient and the molar concentration ofoxidising/gasifying agent of reaction i at the bulk flow, respectively.The reaction rate constants of reactions R1–R4, kc,i, are listed inTable 1. De is the effective diffusivity of the ash layer, which dependson the ash porosity, �, the tortuosity, τ, and the molecular diffusivityof the penetrating gaseous component, Da:
De ¼�
τDa: ð13Þ
The tortuosity can be replaced by the inverse of the porosity,which is often a reasonable approximation [47,53]:
De ¼ �2Da: ð14Þ
The molecular diffusivity of the reactive agent in the ash layerpores can be written as [8,47]:
1Da
¼ 1Dab
þ 1DKa
: ð15Þ
The binary diffusivity,Dab, is calculated by the Chapman–Enskog ki-netic theory [11]. For simplicity, the mixture in the ash layer pores is
Table 1Heterogeneous reaction rate constants (R1–R4).
kc,R1=1.715a×TB2exp(−9000b/TB2
) [52]kc,R2=kc,R3=3.42a×TB2
exp(−15600b/TB2) [52]
kc,R4=3.42e−3 a×TB2exp(−15600b/TB2
) [52]
a[m.s−1.K−1].b[K].
assumed to be air and the binary diffusivity of the oxidising/gasifyingagent in air is calculated. The Knudsen diffusivity is given by:
DKa ¼23dpore
ffiffiffiffiffiffiffiffiffiffiffi2πRTMa
sð16Þ
whereMa is themolecularweight of the diffusing species and dpore is thepore diameter. This equation was derived assuming random collisionsof the gas molecules with the walls, which is reasonable when thepore size is larger than the molecular dimensions and much smaller incomparison with the mean free path [47].
The mass transfer coefficient of reactant species in the boundarylayer around the particle, hm in Eq. (12), is obtained by the Sherwoodnumber:
Sh ¼ hmdpDab
: ð17Þ
There are several experimental and theoretical investigations to de-termine the Sherwood number for a reacting particle. Scala [54] inves-tigated many of empirical/theoretical correlations available forSherwood. He showed that almost all the theoretical correlations failedto predict a Sherwood number comparable to his experimental data of afreelymoving active particle in the dense phase of a fluidised bed. How-ever, a semi-empirical correlation proposed by Hayhurst and Parmar[55] among several empirical correlations excellently fits his experi-mental data. Hayhurst and Parmar measured the temperature of freelymoving single graphite spheres and coal char particles during theircombustion in a fluidised bed aswell as outlet gas concentrations to cal-culate the burning rate. By estimating the CO/CO2 ratio as combustionproducts, they suggested a Frössling-type expression:
Sh ¼ 2�bed þ 0:69 Re=�bedÞ1=2Sc1=3�
ð18Þ
where �bed is the bed voidage.It should be mentioned that this correlation for Sh holds for the
case of equimolar counter diffusion, albeit in reactions R1–R4 thediffusion of reactants towards the reaction surface and of productsaway from it are not equimolar and even for the oxidation reaction,the molar flux of products is temperature dependent. Hayhurst [56],Paterson and Hayhurst [57] and Scala [58] proved that assumingCO as the only product of reaction R1, which represents the biggestdeviation from equimolar counter diffusion condition, leads to anerror less than 10%. If CO and CO2 are considered as products, theerror is even less. Therefore this error can be neglected in comparisonto other uncertainties such as the determination of De, and experi-mental errors during the calculation of the Sherwood number [59].
The CO/CO2 product ratio in reaction R1 has been the subject ofmany experimental and modelling studies, since it has a great effecton the particle temperature aswell as the char oxidation rate. Accordingto the work of Tognotti et al. [60] there is almost no doubt that both COand CO2 are primary products of char oxidation. They heated single charparticles by laser irradiation and avoided COoxidation to CO2 in the par-ticle boundary layer by maintaining the surrounding gas at room tem-perature. Their results clearly indicate that at high temperatures bothCO and CO2 are primary products of char oxidation.
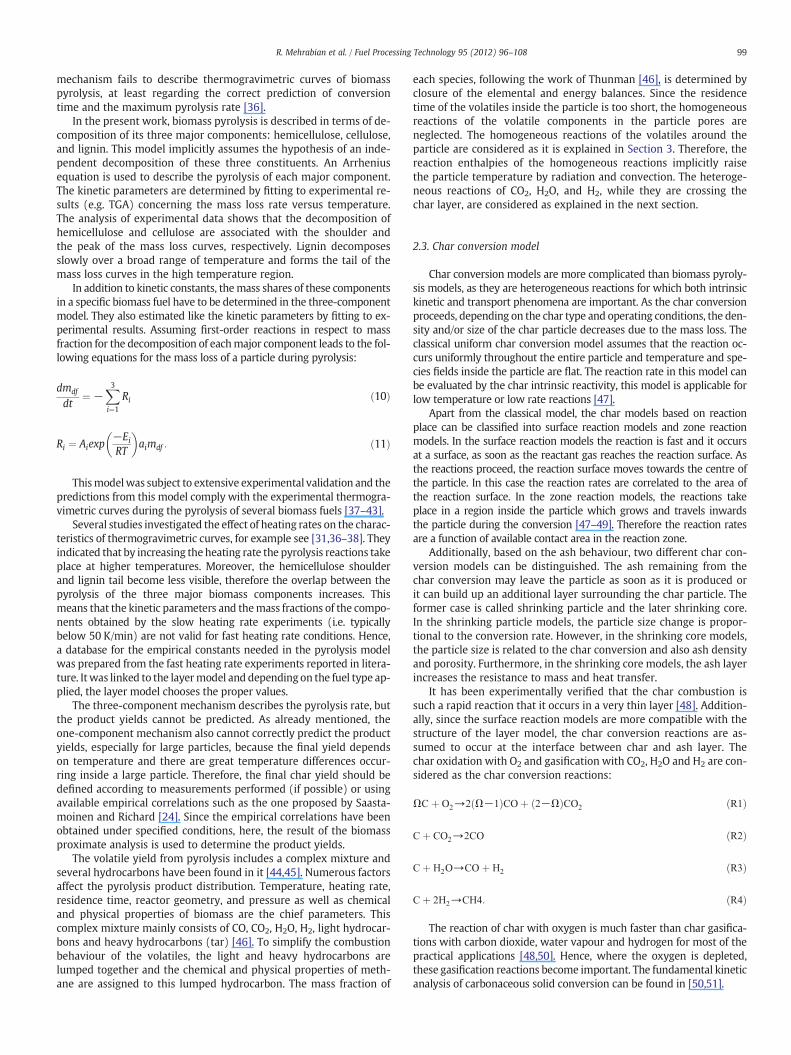
Table 2 summarises empirical correlations for CO/CO2 product ra-tios available in the literature so far. Measurement data have beencorrelated in all of them using an Arrhenius relation and the productratio increases by temperature. Only Linjewile and Agarwal [67,68]reported a decrease in the product ratio at particle temperatures be-tween 970 K and 1220 K. The product ratio has a local maximum of0.5 at 970 K and decreases to 0.2 at 1220 K, at higher temperaturesit increases again. The CO/CO2 ratios obtained by correlations inTable 2 have little agreement. This is probably due to different types
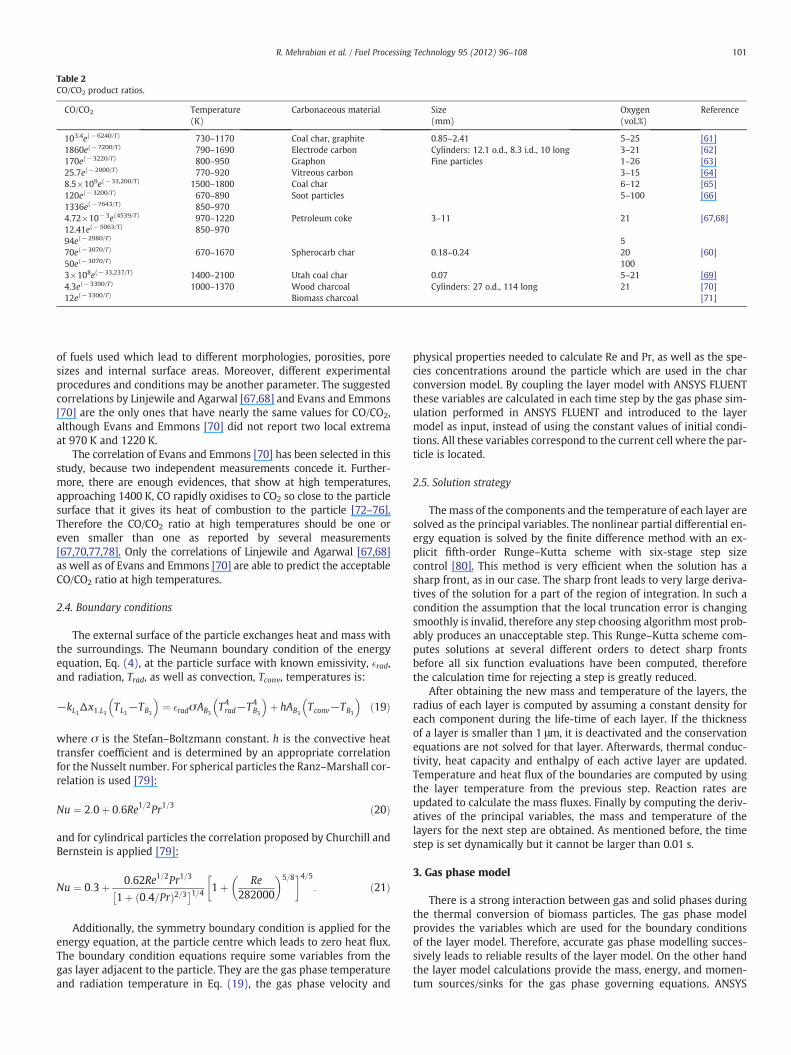
Table 2CO/CO2 product ratios.
CO/CO2 Temperature(K)
Carbonaceous material Size(mm)
Oxygen(vol.%)
Reference
103.4e(−6240/T) 730–1170 Coal char, graphite 0.85–2.41 5–25 [61]1860e(−7200/T) 790–1690 Electrode carbon Cylinders: 12.1 o.d., 8.3 i.d., 10 long 3–21 [62]170e(−3220/T) 800–950 Graphon Fine particles 1–26 [63]25.7e(−2000/T) 770–920 Vitreous carbon 3–15 [64]8.5×10⁹e(−33,200/T) 1500–1800 Coal char 6–12 [65]120e(−3200/T) 670–890 Soot particles 5–100 [66]1336e(−7643/T) 850–9704.72×10−3e(4539/T) 970–1220 Petroleum coke 3–11 21 [67,68]12.41e(−5063/T) 850–97094e(−2980/T) 570e(−3070/T) 670–1670 Spherocarb char 0.18–0.24 20 [60]50e(−3070/T) 1003×108e(−33,237/T) 1400–2100 Utah coal char 0.07 5–21 [69]4.3e(−3390/T) 1000–1370 Wood charcoal Cylinders: 27 o.d., 114 long 21 [70]12e(−3300/T) Biomass charcoal [71]
101R. Mehrabian et al. / Fuel Processing Technology 95 (2012) 96–108
of fuels used which lead to different morphologies, porosities, poresizes and internal surface areas. Moreover, different experimentalprocedures and conditions may be another parameter. The suggestedcorrelations by Linjewile and Agarwal [67,68] and Evans and Emmons[70] are the only ones that have nearly the same values for CO/CO2,although Evans and Emmons [70] did not report two local extremaat 970 K and 1220 K.
The correlation of Evans and Emmons [70] has been selected in thisstudy, because two independent measurements concede it. Further-more, there are enough evidences, that show at high temperatures,approaching 1400 K, CO rapidly oxidises to CO2 so close to the particlesurface that it gives its heat of combustion to the particle [72–76].Therefore the CO/CO2 ratio at high temperatures should be one oreven smaller than one as reported by several measurements[67,70,77,78]. Only the correlations of Linjewile and Agarwal [67,68]as well as of Evans and Emmons [70] are able to predict the acceptableCO/CO2 ratio at high temperatures.
2.4. Boundary conditions
The external surface of the particle exchanges heat and mass withthe surroundings. The Neumann boundary condition of the energyequation, Eq. (4), at the particle surface with known emissivity, �rad,and radiation, Trad, as well as convection, Tconv, temperatures is:
−kL3Δx1;L3 TL3−TB3
� �¼ �radσAB3
T4rad−T4
B3
� �þ hAB3
Tconv−TB3
� �ð19Þ
where σ is the Stefan–Boltzmann constant. h is the convective heattransfer coefficient and is determined by an appropriate correlationfor the Nusselt number. For spherical particles the Ranz–Marshall cor-relation is used [79]:
Nu ¼ 2:0þ 0:6Re1=2Pr1=3 ð20Þ
and for cylindrical particles the correlation proposed by Churchill andBernstein is applied [79]:
Nu ¼ 0:3þ 0:62Re1=2Pr1=3
1þ 0:4=Prð Þ2=3� �1=4 1þ Re282000
� �5=8 4=5: ð21Þ
Additionally, the symmetry boundary condition is applied for theenergy equation, at the particle centre which leads to zero heat flux.The boundary condition equations require some variables from thegas layer adjacent to the particle. They are the gas phase temperatureand radiation temperature in Eq. (19), the gas phase velocity and
physical properties needed to calculate Re and Pr, as well as the spe-cies concentrations around the particle which are used in the charconversion model. By coupling the layer model with ANSYS FLUENTthese variables are calculated in each time step by the gas phase sim-ulation performed in ANSYS FLUENT and introduced to the layermodel as input, instead of using the constant values of initial condi-tions. All these variables correspond to the current cell where the par-ticle is located.
2.5. Solution strategy
Themass of the components and the temperature of each layer aresolved as the principal variables. The nonlinear partial differential en-ergy equation is solved by the finite difference method with an ex-plicit fifth-order Runge–Kutta scheme with six-stage step sizecontrol [80]. This method is very efficient when the solution has asharp front, as in our case. The sharp front leads to very large deriva-tives of the solution for a part of the region of integration. In such acondition the assumption that the local truncation error is changingsmoothly is invalid, therefore any step choosing algorithmmost prob-ably produces an unacceptable step. This Runge–Kutta scheme com-putes solutions at several different orders to detect sharp frontsbefore all six function evaluations have been computed, thereforethe calculation time for rejecting a step is greatly reduced.
After obtaining the new mass and temperature of the layers, theradius of each layer is computed by assuming a constant density foreach component during the life-time of each layer. If the thicknessof a layer is smaller than 1 μm, it is deactivated and the conservationequations are not solved for that layer. Afterwards, thermal conduc-tivity, heat capacity and enthalpy of each active layer are updated.Temperature and heat flux of the boundaries are computed by usingthe layer temperature from the previous step. Reaction rates areupdated to calculate the mass fluxes. Finally by computing the deriv-atives of the principal variables, the mass and temperature of thelayers for the next step are obtained. As mentioned before, the timestep is set dynamically but it cannot be larger than 0.01 s.
3. Gas phase model
There is a strong interaction between gas and solid phases duringthe thermal conversion of biomass particles. The gas phase modelprovides the variables which are used for the boundary conditionsof the layer model. Therefore, accurate gas phase modelling succes-sively leads to reliable results of the layer model. On the other handthe layer model calculations provide the mass, energy, and momen-tum sources/sinks for the gas phase governing equations. ANSYS

102 R. Mehrabian et al. / Fuel Processing Technology 95 (2012) 96–108
FLUENT is utilised to resolve the flow field, temperature distributionand species concentrations in the gas phase. The layer model iscoupled with ANSYS FLUENT as a user defined function (UDF) andthe trajectories of particles are calculated by the discrete phasemodel (DPM). The realizable k–e model describes the turbulentflow. An eddy-break-up approach is used to represent the combus-tion of the turbulent reactive flow. It takes the time scales of reactionkinetic rates and species mixing by turbulence into consideration.Thus, the reaction rate is limited by the slowest of these processes.The species conservation equations for the volatiles CH4, CO, CO2,H2, H2O and O2 are solved. A global 4-step mechanism consideringall the species describes the gas phase combustion [81,82]. The radia-tion which is an important part in combustion simulations is calculat-ed by the Discrete Ordinates Model.
4. Model validation
To validate the layer model, the experimental data of the work ofLu et al. [7,8] have been utilised. They used a single-particle reactor tomeasure particle surface temperature, centre temperature and massloss during thermal conversion of cylindrical particles under non-oxidising and oxidising conditions. Fig. 2 schematically illustratesthe experimental setup. The reactor has an inner diameter (ID) of0.15 m and a height of 0.5 m. Four heating elements heat both the re-actor and the particle. Air or nitrogen is heated in the pre-heater be-fore it enters the reactor from the bottom and exits from the top. Atype K thermocouple monitors the centre gas temperature. The actualgas temperature was corrected for radiative and other losses from thethermocouple bead based on the wall temperature, bulk gas velocity,and the thermocouple bead size. This resulted in a gas temperature of1050 K. The reactor wall temperature is not uniform in the axial di-rection due to reactor configurations, so an average wall temperaturemeasured by an imaging pyrometer (1276 K) is used for modelling.
They performed several test runs for various particle sizes andmoisture contents. In this study, each test run is simulated by usingthe layer model coupled to ANSYS FLUENT in order to compare themeasurements and model predictions. Table 3 summarises the phys-ical and chemical properties used in the simulations of the single par-ticle reactor.
Fig. 2. Schematic diagram of the
4.1. Results and discussions
In Fig. 3 the contours of gas temperature andH2O, CO, and CO2molarconcentrations along a vertical cross section of the single-particle reactorare presented. These results are related to the combustion of a cylindricalparticle with dp=9.5 mm, lp=9.5 mm andMC=40% w.b. The compar-ison between the predicted andmeasured data during the combustion ofthis cylindrical particle is presented in Fig. 4.
The measured particle surface and centre temperatures in Fig. 4are well predicted by the model. There is a small discrepancy at theend of the char burnout between the simulated and measured centretemperatures. The model predicted higher temperatures which mightbe attributed to the physical properties of the ash layer in the simula-tion. A small thermal conductivity or the prediction of a larger thick-ness of the ash layer leads to higher resistance against the heattransfer and thus increases the particle centre temperature. As it isshown in Fig. 4, the predicted particle mass loss is in consistencewith the measurements.
Both experimental data and model predictions show that duringthe char combustion stage the particle temperature rises graduallyand declines sharply after the peak value is reached. This supportstheoretical descriptions of combustion mechanisms of large particles.The oxidiser diffusion rate primarily controls the char combustionrate. The char burning rate slows down as the available surface areadecreases with decreasing particle size, as it can be seen in Eq. (12).However, the decrease of the particle mass compensates it and theparticle temperature increases slowly. Once the char is completelyconsumed, the particle, i.e. ash, cools rapidly towards the convectivegas temperature, depending on the radiative environment.
The gas temperature around the particle in Fig. 3, slightly decreases atthe beginning. It is due to particle heat-up and the endothermic evapora-tion. When volatile components start to release, the exothermic homo-geneous reactions around the particle sharply rise the gas temperature.By approaching the end of pyrolysis, the rate of pyrolysis slows downwhich decreases the gas phase temperature gradually. At the end of py-rolysis the flame surrounding the particle disappears. During char burn-out the particle surface temperature increases andheats up the gas phaseby convective heat transfer. Additionally, the oxidation of CO (a productof the char burnout) increases the gas phase temperature to about 150 Kabove the gas inlet temperature during char conversion.
single-particle reactor [7].

Table 3Parameters used in the single-particle reactor simulations.
Proximate analysis
C 48.1 wt.%d.b.H 5.77 wt.%d.b.O 45.53 wt.%d.b.N 0.1 wt.%d.b.
Ultimate analysis
Water 6 and 40 wt.% w.b.Volatiles 90 wt.%d.b.Char 9.5 wt.%d.b.Ash 0.5 wt.%d.b.
Density
Dry wood 545 kg.m−3 [7]Char 200 kg.m−3 [83]Ash 300 kg/m−3
Heat capacity
Dry wood 1500+T J.kg−1.K−1 [42]Char 420+2.09 T+6.85×10⁻⁴ T2 J.kg−1.K−1 [42]Ash 420+2.09 T+6.85×10⁻⁴ T2 J.kg−1.K−1 [42]
Thermal conductivity
Dry wood 0.056+2.6×10⁻⁴ T W.m−1.K−1 [7]Char 0.071 W.m−1.K−1 [7]Ash 1.2 W.m−1.K−1 [7]
Particle emissivity �=0.85 –
Pyrolysis modelA=2.527×10¹¹ s−1 [36]
Hemicellulose E=147 kJ.mol−1 [36]a=0.26 – [36]A=1.379×10¹⁴ s−1 [36]
Cellulose E=193 kJ.mol−1 [36]a=0.64 – [36]A=2.202×10¹² s−1 [36]
Lignin E=181 kJ.mol−1 [36]a=0.10 – [36]
Char conversion modelPore diameter 100 μm [14]Porosity of ash layer 0.9
103R. Mehrabian et al. / Fuel Processing Technology 95 (2012) 96–108
Thewater vapour release is quick at the beginning and declines closeto the end of the drying phase. However, there is a small fraction ofwater around the particle during pyrolysis which is due to the combus-tion of volatiles and the assumption that the volatile species includewater vapour. The concentration of CO2 around the particle is higherthan CO which might be due to the oxidation of CO and CH4 close tothe particle surface. Additionally, the CO/CO2 product ratio of char oxi-dation implies that the amount of CO produced is less than CO2.
The gas and solid phase calculations are strongly coupled. The layermodel calculates the energy andmass sourceswhich are used in the gasphase governing equations. The gas phase calculations obtain severalparameters which are used as boundary conditions for the layermodel. These parameters are temperature, species concentrations andvelocity of the gas layer adjacent to the particle surface, as well as theradiation temperature. As it can be seen the temperature and speciesconcentrations around the particle are time dependent. In particular,they are significantly different from the inlet conditions and are strong-ly affected by the mass sources generated from the solid conversion.Therefore, using the constant initial values of these parameters in theboundary conditions of the particlemodel leads to some inconsistenciesas the gas temperature influences the particle heating rate and the het-erogeneous reactions R1–R4 are affected by the species concentrations.
Fig. 5 compares the predicted centre temperature during combus-tion of a cylindrical particle with dp=6.35 mm, lp=21.44 mm andMC=6% w.b. with the experimental data. It is extremely hard to
determine surface temperature with thermocouples correctly, becauseduring devolatilisation volatiles burn around the particle, which affectsthe thermocouple reading. Additionally, during char oxidation the par-ticle starts to shrink and the thermocouplewire cannot track the shrink-ing surface, hence the bead becomes exposed to the surrounding flame.The measured surface temperature in this experiment was not reliableto be reported. The predicted centre temperatures are in good qualita-tive agreement with the measured ones. The rapid temperature in-crease of the measured centre temperature in the beginning might bedue to the conduction through the thermocouple wire. Themass profilecovers well the measured values (see Fig. 5).
To evaluate the layer model under non-oxidising conditions, themeasured surface and centre temperatures as well as the normalisedparticle mass of four different experiments are compared with thesimulation results.
The results of an experiment with a cylindrical particle ofdp=9.5 mm, lp=9.5 mm and MC=6% w.b. during pyrolysis in nitro-gen are illustrated in Fig. 6. The particle surface and centre tempera-ture predictions generally agree with experimental data. Measuredcentre temperature increases faster at the beginning which mightbe caused by the thermal conduction effects through the wire. Boththe simulated and experimental results show a distinct difference be-tween particle surface and centre temperatures which confirms theneed for consideration of intra-particle gradients in biomass thermalconversion modelling.
During the simulation the boundary of each layer approaches tothe particle centre, until it disappears once its thickness becomesless than 1 μm. When the most inner layer disappears, the tempera-ture of the next layer is assigned as the particle centre temperature.Due to the coarse discretisation of each particle into four layers, thedisappearance of the layers might lead to some discontinuities inthe centre temperature curves. The discontinuity at the end of thedrying process, e.g. disappearance of the drying layer, is more visiblebecause the assumption of constant temperature, TB0
=373.15, duringthe drying process magnifies the effect of the layer disappearance. Asan example, in Fig. 6 two discontinuities are seen in the predictedcentre temperature curve, when the wet layer and dry layer disap-pear at the end of the drying and pyrolysis process, respectively.They can be smoothened by increasing the number of layers, howev-er, it costs computational time.
The particle mass predicted by the model decreases faster than themeasured one at the beginning. This discrepancy is believed to be dueto coarse spatial discretisation and the empirical constants used in thepyrolysis model. The coarse spatial discretisation might lead to anoverprediction of the temperature of the boundary between dry fueland char layers, where the pyrolysis is assumed to occur. Consequent-ly, the pyrolysis rate model which is an exponential function of tem-perature, overvalues the particle mass loss rate. Furthermore, theempirical constants of the pyrolysis model are obtained under certainconditions. Therefore, any changes in these conditions, might impactthe validity of the pyrolysis empirical constants.
In Fig. 7 the measurements and simulated results of the same par-ticle with higher moisture content,MC=40% w.b., during pyrolysis innitrogen are compared. Both the measured data and the model pre-diction show that the particle centre temperature rises to the waterboiling point and then stays constant until the particle dries, then itrises again. The effect of vaporisation on the centre temperature ismore pronounced in comparison to Fig. 6 due to higher moisture con-tent and it appears as a temperature plateau. The model predictionsfor particle centre and surface temperature as well as the particlemass loss profile agree well with experiments.
Temperature and normalised mass profiles during pyrolysis oflonger cylindrical particles, lp=38 mm, with two different moisturecontents, 6% and 40% w.b., are illustrated in Figs. 8 and 9. All the pre-dicted surface and centre temperatures as well as the particle masshistory are in good agreement with experimental data, except the
Fig. 3. Contours of gas phase temperature and H2O, CO as well as CO2 mole fractions at a vertical cross section of the single-particle reactor during combustion of a cylindrical poplarwood particle; dp=9.5 mm, lp=9.5 mm, MC=40% w.b.; time is given in seconds.
104 R. Mehrabian et al. / Fuel Processing Technology 95 (2012) 96–108

Fig. 4. Comparison between simulated and measured temperatures and normalised mass profiles during combustion of a cylindrical poplar wood particle; dp=9.5 mm,lp=9.5 mm, MC=40% w.b.
Fig. 5. Comparison between simulated and measured temperatures and normalised mass profiles during combustion of a cylindrical poplar wood particle; dp=6.35 mm,lp=21.44 mm, MC=6% w.b.
Fig. 6. Comparison between simulated and measured temperatures and normalised mass profiles during pyrolysis of a cylindrical poplar wood particle; dp=9.5 mm, lp=9.5 mm,MC=6% w.b.
105R. Mehrabian et al. / Fuel Processing Technology 95 (2012) 96–108
normalised mass profile of the particle with MC=6% w.b., Fig. 8. Thediscrepancy is most probably attributed to the empirical constantsused in the hemicellulose pyrolysis rate model because the predictedmass loss rate is faster than measurements at the beginning of the py-rolysis process and it is known that the hemicellulose pyrolysis takesplace sooner than the other biomass components.
In all the simulated and measured results under pyrolysis condi-tions, the centre temperature rises faster at the end of the pyrolysisprocess and during heating up of the remaining char. This is due to
a considerable decrease of particle mass and also particle shrinkageduring pyrolysis. As it can be seen in Eq. (4), the variation of the par-ticle temperature is a function of particle mass and size.
The particle shape has a significant influence on the thermal conver-sion of biomass particles. Among the particles with the same mass butdifferent shapes, the particle with the higher sphericity has the lowestmass loss rate, because the higher sphericity means a smaller surfacearea tomass ratio. Since heat andmass transfer are scaled with the sur-face area, it leads to lower heat and mass transfer rates to/from the

Fig. 7. Comparison between simulated and measured temperatures and normalised mass profiles during pyrolysis of a cylindrical poplar wood particle; dp=9.5 mm, lp=9.5 mm,MC=40% w.b.
Fig. 8. Comparison between simulated and measured temperatures and normalised mass profiles during pyrolysis of a cylindrical poplar wood particle; dp=9.5 mm, lp=38 mm,MC=6% w.b.
Fig. 9. Comparison between simulated and measured temperatures and normalised mass profiles during pyrolysis of a cylindrical poplar wood particle; dp=9.5 mm, lp=38 mm,MC=40% w.b.
106 R. Mehrabian et al. / Fuel Processing Technology 95 (2012) 96–108
particle. Therefore, assuming spherical shape for non-spherical particleswould lead to a substantial error in the prediction of their combustionbehaviour [9]. In the layer model a shape factor, which is the area ofthe control surface at each boundary, is used to describe different shapes.This shape factor appears asΔx in Eq. (2). SinceΔx is directly proportion-al to the surface area, it increases with the particle aspect ratio. It conse-quently leads to faster heat transfer and reaction rates. The results of thevalidation simulations for different particle geometries indicate that theeffect of the particle shape is correctly considered in the layer model.
The layer model can be directly compared with the sophisticatedmodel of Lu et al. [7,8], because the variations of the particle massand temperature were simulated in the same experiments as in thisstudy. In some cases the model of Lu et al. predicts the measureddata better (Figs. 6 and 8) and in some other cases the layer modeldoes (Figs. 4, 7 and 9). At this point it should be mentioned that inthe model of Lu et al. a set of fourteen governing equations is solved,while the layer model contains only an energy equation. Additionally,in the layer model the lowest possible number of grid points is
107R. Mehrabian et al. / Fuel Processing Technology 95 (2012) 96–108
considered to discretise biomass particles. Therefore, the layer modelis considerably faster than the model of Lu et al. and as it is mentionedbefore they have the same level of accuracy. Furthermore, the layermodel is coupled to ANSYS FLUENT, which is of a great advantagefor its further application in grate furnace simulations [84].
5. Summary and conclusions
A one-dimensional single particle model was developed to simulatethe thermal conversion of thermally thick particles by consideringintra-particle gradients. The particle is divided into four layers:wet (vir-gin) fuel, dry fuel, char residue and ash which correspond to the fourmain stages of biomass thermal conversion. The sub-processes of ther-mal biomass conversion are treated by separate sub-models. Moistureevaporation is assumed to occur at a constant temperature, while bio-mass pyrolysis is modelled through three competing decomposition re-actions. Char oxidation is kinetically and/or diffusionally controlled. Themodel can be applied for the packed bed simulations. Therefore, thenumber of governing equations and grid points inside the particlewere reduced to fasten the numerical calculations, without impairingthe model accuracy. The model was programmed in C/C++ and linkedwithANSYS FLUENT to simultaneously resolve themass and energy bal-ance equations for the particle and its surrounding gas phase during itsthermal conversion. The validation simulations were performed withdifferent particle sizes, shapes, and moisture contents under pyrolysisand combustion conditions. The model results are in good agreementwith experimental data, which indicates that the model accuracy wasnot affected by the simplifications of the model. Moreover, the modelperforms the particle simulations rather quickly, in a minute. The levelof information, accuracy and numerical efforts of the layer model arefound to be sufficient to apply it in the next step for biomass grate fur-nace simulations. There each particle in the packed-bed will be treatedby the layer model, whereas the gas phase combustion in the voids aswell as above the fuel bedwill be calculated by existing gas phase com-bustionmodels. Moreover, a model to describe the influence of the par-ticle–particle interactions on the particle movements on the grateshould also be considered. In this way an overall simulation model forfixed bed biomass combustion applications will be achieved.
NomenclatureA area [m−2]A pre-exponential factor [s−1]a mass fraction of each biomass component [−]cp specific heat capacity [J.kg−1.K−1]Da ordinary gas molecular diffusivity [m2.s−1]Dab binary diffusivity [m2.s−1]De effective diffusivity [m2.s−1]DKa Knudsen diffusivity [m2.s−1]d diameter [m]E activation energy [kJ.mol−1]H specific enthalpy [J.kg−1]ΔHf
° standard enthalpy of formation [J.kg−1]h convective heat transfer coefficient [W.m−2.K−1]hm mass transfer coefficient [m.s−1]k thermal conductivity [W.m−1.K−1]kc reaction rate constants [m.s−1]l length [m]m mass [kg]MC moisture content, wet based [kgwater/kgwetfuel]Mc carbon molecular weight [kg.kmol−1]_m mass flow rate [kg.s−1]Nu Nusselt number [−]Pr Prandtl number [−]q heat flux [W.m−2]R reaction rate [kg.s−1]R universal gas constant [kJ.mol−1.K−1]
Re Reynolds number [−]Sc Schmidt number [−]Sh Sherwood number [−]T temperature [K]t time [s]v velocity [m.s−1]X molar concentration of gas species [mol.m−3]Δx0 ratio between area of a layer left boundary to the half of the
layer thickness [m]Δx1 ratio between area of a layer right boundary to the half of
the layer thickness [m]
Greek symbols� porosity [−]ϵ emissivity [−]η stoichiometric coefficient of reactions [−]ρ density [kg.m−3]σ Stefan–Boltzmann constant [W.m−2.K−4]τ tortuosity [−]Ω stoichiometric ratio of moles of carbon per mole of oxidis-
ing/gasifying agent in corresponding reaction [−]
SubscriptsB boundaryc component (solid and gas)ch chardr dryingdf dry fuelLi layer (L0: wet fuel layer, L1: dry fuel layer, L2: char layer, L3:
ash layer)p particler reactionrad radiativewl water liquidwv water vapour∞ ambient condition
References
[1] B. Peters, Measurements and application of a discrete particle model (DPM) tosimulate combustion of a packed bed of individual fuel particles, Combustionand Flame 131 (2002) 132–146.
[2] C. Bruch, B. Peters, T. Nussbaumer, Modelling wood combustion under fixed bedconditions, Fuel 82 (2003) 729–738.
[3] J.C. Wurzenberger, S. Wallner, H. Raupenstrauch, J.G. Khinast, Thermal conversionof biomass: comprehensive reactor and particle modeling, AICHE Journal 48(2002) 2398–2410.
[4] H. Thunman, B. Leckner, F. Niklasson, F. Johnsson, Combustion of wood particles—aparticle model for Eulerian calculations, Combustion and Flame 129 (2002) 30–46.
[5] J. Porteiro, J.L. Miguez, E. Granada, J.C. Moran, Mathematical modelling of thecombustion of a single wood particle, Fuel Processing Technology 87 (2006)169–175.
[6] J. Porteiro, E. Granada, J. Collazo, D. Patiño, J.C. Morán, A model for the combustionof large particles of densified wood, Energy & Fuels 21 (2007) 3151–3159.
[7] H. Lu, Experimental and modelling investigation of biomass particle combustion,PhD thesis, Brigham Young University, 2006.
[8] H. Lu, W. Robert, G. Peirce, B. Ripa, L.L. Baxter, Comprehensive study of biomassparticle combustion, Energy & Fuels 22 (2008) 2826–2839.
[9] H. Lu, E. Ip, J. Scott, P. Foster, M. Vickers, L.L. Baxter, Effects of particle shape andsize on devolatilization of biomass particle, Fuel 89 (2010) 1156–1168.
[10] M.Y. Ha, B.R. Choi, A numerical study on the combustion of a single carbon parti-cle entrained in a steady flow, Combustion and Flame 97 (1994) 1–16.
[11] R.B. Bird, W.E. Stewart, E.N. Lightfoot, Transport Phenomena, second ed. JohnWiley & Sons, New York, 2002.
[12] W.C.R. Chan, M. Kelbon, B.B. Krieger, Modelling and experimental verification ofphysical and chemical processes during pyrolysis of a large biomass particle,Fuel 64 (1985) 1505–1513.
[13] K.M. Bryden, M.J. Hagge, Modeling the combined impact of moisture and charshrinkage on the pyrolysis of a biomass particle, Fuel 82 (2003) 1633–1644.

108 R. Mehrabian et al. / Fuel Processing Technology 95 (2012) 96–108
[14] M. Sreekanth, D.R. Sudhakar, B.V.S.S.S. Prasad, A.K. Kolar, B. Leckner, Modellingand experimental investigation of devolatilizing wood in a fluidized bed combus-tor, Fuel 87 (2008) 2698–2712.
[15] N. Ouelhazi, G. Arnaud, J.P. Fohr, A two-dimensional study of wood plank drying.The effect of gaseous pressure below boiling point, Transport in Porous Media 7(1992) 39–91.
[16] N. Zobel, The representative particle model, PhD thesis, Technischen UniversitätBerlin, 2007.
[17] A. Galgano, C. Di Blasi, Modeling the propagation of drying and decompositionfronts in wood, Combustion and Flame 39 (2004) 16–27.
[18] B. Peters, E. Schröder, C. Bruch, Measurements and particle resolved modelling ofthe thermo- and fluid dynamics of a packed bed, Journal of Analytical and AppliedPyrolysis 70 (2003) 211–231.
[19] B. Peters, Thermal Conversion of Solid Fuels, WIT Press, Southampton, 2003.[20] Y.B. Yang, V.N. Sharifi, J. Swithenbank, L. Ma, L.I. Darvell, J.M. Jones, M. Pourkashanian,
A. Williams, Combustion of a single particle of biomass, Energy & Fuels 22 (2008)306–316.
[21] H. Thunman, K. Davidsson, B. Leckner, Separation of drying and devolatilizationduring conversion of solid fuels, Combustion and Flame 137 (2004) 242–250.
[22] A. Bharadwaj, L.L. Baxter, A.L. Robinson, Effects of intraparticle heat and masstransfer on biomass devolatilization: experimental results and model predictions,Energy & Fuels 18 (2004) 1021–1031.
[23] J.J. Saastamoinen, Simplified model for calculation of devolatilization in fluidizedbeds, Fuel 85 (2006) 2388–2395.
[24] J. Saastamoinen, J.R. Richard, Simultaneous drying and pyrolysis of solid fuel par-ticles, Combustion and Flame 106 (1996) 288–300.
[25] R. Bilbao, J.F. Mastral, J.A. Lana, J. Ceamanos, M.E. Aldea, M. Betrán, A model for theprediction of the thermal degradation and ignition of wood under constant andvariable heat flux, Journal of Analytical and Applied Pyrolysis 62 (2002) 63–82.
[26] C. Di Blasi, Multi-phase moisture transfer in the high-temperature drying of woodparticles, Chemical Engineering Science 53 (1998) 353–366.
[27] R.R. Kumar, A.K. Kolar, B. Leckner, Shrinkage characteristics of Casuarina woodduring devolatilization in a fluidized bed combustor, Biomass and Bioenergy 30(2006) 153–165.
[28] C. Di Blasi, Modeling chemical and physical processes of wood and biomass pyrol-ysis, Progress in Energy and Combustion Science 34 (2008) 47–90.
[29] B. Moghtaderi, The state-of-the-art in pyrolysis modelling of lignocellulosic solidfuels, Fire and Materials 30 (2006) 1–34.
[30] S.R.A. Kersten, X. Wang, W. Prins, W.P.M. Van Swaaij, Biomass pyrolysis in a flu-idized bed reactor. Part 1: literature review and model simulations, Industrialand Engineering Chemistry Research 44 (2005) 8773–8785.
[31] M.J. Antal, G. Várhegyi, Cellulose pyrolysis kinetics: the current state of knowl-edge, Industrial and Engineering Chemistry Research 34 (1995) 703–717.
[32] F. Shafizadeh, P.P.S. Chin, Thermal deterioration of wood, ACS Symposium Series43 (1977) 57–81.
[33] F. Thurner, U. Mann, Kinetic investigation of wood pyrolysis, Industrial and Engi-neering Chemistry Process Design and Development 20 (1981) 482–488.
[34] B.M. Wagenaar, W. Prins, W.P.M. Van Swaaij, Flash pyrolysis kinetics of pinewood, Fuel Processing Technology 36 (1994) 291–302.
[35] R.S. Miller, J. Bellan, A generalized biomass pyrolysis model based on superim-posed cellulose, hemicellulose and lignin kinetics, Combustion Science and Tech-nology 126 (1996) 97–137.
[36] C. Branca, A. Albano, C. Di Blasi, Critical evaluation of wood devolatilization mech-anisms, Thermochimica Acta 429 (2005) 133–141.
[37] G. Várhegyi, M.J. Antal, E. Jakab, P. Szabo, Kinetic modeling of biomass pyrolysis,Journal of Analytical and Applied Pyrolysis 42 (1996) 73–78.
[38] H. Teng, Y.C. Wei, Thermogravimetric studies on the kinetics of rice hull pyrolysisand the influence of water treatment, Industrial and Engineering Chemistry Re-search 37 (1998) 3806–3811.
[39] H.J.M. Belderok, Experimental investigation and modeling of the pyrolysis of bio-mass, MSc thesis, Eindhoven University of Technology, 2007.
[40] R. Miranda, C. Sosa-Blanco, D. Bustos-Martínez, C. Vasile, Pyrolysis of textilewastes I. Kinetics and yields, Journal of Analytical and Applied Pyrolysis 80(2007) 489–495.
[41] J.J.M. Orfao, F.J.A. Antunes, J.L. Figueiredo, Pyrolysis kinetics of lignocellulosicmaterialss — three independent reactions model, Fuel 78 (1999) 349–358.
[42] M.G. Grønli, A theoretical and experimental study of the thermal degredation ofbiomass, PhD thesis, The Norwegian University of Science and Technology, 1996.
[43] M.G. Grønli, G. Várhegyi, C. Di Blasi, Thermogravimetric analysis and devolatiliza-tion kinetics of wood, Industrial and Engineering Chemistry Research 41 (2002)4201–4208.
[44] R. Zanzi, K. Sjostrom, E. Bjornbom, Rapid high-temperature pyrolysis of biomassin a free-fall reactor, Fuel 75 (1996) 545–550.
[45] C. Di Blasi, C. Branca, A. Santoro, E.G. Hernandez, Pyrolytic behavior and productsof some wood varieties, Combustion and Flame 124 (2001) 165–177.
[46] H. Thunman, F. Niklasson, F. Johnsson, B. Leckner, Composition of volatile gasesand thermochemical properties of wood for modeling of fixed or fluidized beds,Energy & Fuels 15 (2001) 1488–1497.
[47] G.F. Froment, K.B. Bischoff, Chemical Reactor Analysis and Design, John Wiley &Sons, New York, 1990.
[48] A. Gómez-Barea, B. Leckner, Modelling of biomass gasification in fluidized bed,Progress in Energy and Combustion Science 36 (2010) 444–509.
[49] M.L. de Souza-Santos, Solid Fuels Combustion and Gasification, second ed. CRCPress, 2010.
[50] C. Di Blasi, Combustion and gasification rates of lignocellulosic chars, Progress inEnergy and Combustion Science 35 (2009) 121–140.
[51] I.M. Bews, A.N.Hayhurst, S.M. Richardson, S.G. Taylor, The order, Arrheniusparameters,andmechanismof the reaction betweengaseousoxygen and solid carbon, Combustionand Flame 124 (2001) 231–245.
[52] R. Johansson, H. Thunman, B. Leckner, Influence of intraparticle gradients inmodeling of fixed bed combustion, Combustion and Flame 149 (2007) 49–62.
[53] F. Patisson, M.G. Francois, D. Ablitzer, A non-isothermal, non-equimolar transient ki-netic model for gas–solid reactions, Chemical Engineering Science 53 (1998) 97–708.
[54] F. Scala,Mass transfer around freelymovingactive particles in thedense phase of a gasfluidized bed of inert particles, Chemical Engineering Science 62 (2007) 4159–4176.
[55] A.N. Hayhurst, M.S. Parmar, Measurement of the mass transfer coefficient andSherwood number for carbon spheres burning in a bubbling fluidized bed, Com-bustion and Flame 130 (2002) 361–375.
[56] A.N. Hayhurst, The mass transfer coefficient for oxygen reacting with a carbonparticle in a fluidized or packed bed, Combustion and Flame 121 (2000) 679–688.
[57] W.R. Paterson, A.N. Hayhurst, Mass or heat transfer from a sphere to a flowingfluid, Chemical Engineering Science 55 (2000) 1925–1927.
[58] F. Scala, Calculation of the mass transfer coefficient for the combustion of a carbonparticle, Combustion and Flame 157 (2010) 137–142.
[59] J.S. Dennis, A.N. Hayhurst, S.A. Hayhurst, The combustion of large particles of charin bubbling fluidized beds: the dependence of Sherwood number and the rate ofburning on particle diameter, Combustion and Flame 147 (2006) 185–194.
[60] L. Tognotti, J.P. Longwell, A.F. Sarofim, The products of the high temperature oxi-dation of a single char particle in an electrodynamic balance, Proceedings of theCombustion Institute 23 (1990) 1207–1213.
[61] J.A. Arthur, Reactions between carbon and oxygen, Transactions of the FaradaySociety 47 (1951) 164–178.
[62] M. Rossberg, Experimentelle Ergebnisse über die Primärreaktionen bei der Koh-lenstoffverbrennung, Zeitscrift für Elektrochemie 60 (1956) 952–956.
[63] P.L. Walker, F. Rusinko, L.G. Austin, Gas reactions of carbon, Advanced Catalysis 11(1959) 133–221.
[64] M. Otterbein, L. Bonnetain, Combustion d'un carbone vitreux sous basses press-ions d'oxygene, Carbon 6 (1968) 877–885.
[65] R.E. Mitchell, R.J. Kee, P. Glarborg, M.E. Coltrin, The effect of CO conversion in theboundary layers surrounding pulverized-coal char particles, Proceedings of theCombustion Institute 23 (1990) 1169–1176.
[66] Z.Y. Du, A.F. Sarofim, J.P. Longwell, C.A. Mires, Kinetic measurement and modelingof carbon oxidation, Energy & Fuels 5 (1991) 214–221.
[67] T.M. Linjewile, P.K. Agarwal, The product CO/CO2 ratio from petroleum cokespheres in fluidized bed combustion, Fuel 74 (1995) 5–11.
[68] T.M. Linjewile, P.K. Agarwal, The product CO/CO2 ratio from petroleum cokespheres in fluidized bed combustion, Fuel 74 (1995) 12–16.
[69] C.R. Monson, G.J. Germane, A.U. Blackham, L.D. Smoot, Char oxidation at elevatedpressures, Combustion and Flame 100 (1995) 669–683.
[70] D.D. Evans, H.W. Emmons, Combustion of wood charcoal, Fire Safety Journal 1(1977) 57–66.
[71] K. Pedersen, The product ratio of CO/CO2 in the oxidation of biomass char, MScthesis, Technical University of Denmark, 2003.
[72] A.N. Hayhurst, M.S. Parmar, Does solid carbon burn in oxygen to give the gaseousintermediate CO or produce CO2 directly? Some experiments in a hot bed of sandfluidized by air, Chemical Engineering Science 53 (1998) 427–438.
[73] S. Kulasekaran, T.M. Linjewile, P.K. Agarwal, M.J. Biggs, Combustion of a porouschar particle in an incipiently fluidized bed, Fuel 77 (1998) 1549–1560.
[74] T.M. Linjewile, V.S. Gururajan, P.K. Agarwal, The CO/CO2 product ratio from thecombustion of single petroleum coke spheres in an incipiently fluidized bed,Chemical Engineering Science 50 (1995) 1881–1888.
[75] M.J. Biggs, P.K. Agarwal, The CO/CO2 product ratio for a porous char particle with-in an incipiently fluidized bed: a numerical study, Chemical Engineering Science52 (1997) 941–952.
[76] F.Y. Wang, S.K. Bhatia, A generalised dynamic model for char particle gasificationwith structure evolution and peripheral fragmentation, Chemical EngineeringScience 56 (2001) 3683–3697.
[77] P. Basu, J. Broughton, D.E. Elliot, Proc. Fluidized Combust, Inst. Fuel Symp. Ser.,London, 1, 1975, pp. A3.1–A3.10.
[78] W. Prins, Fluidised bed combustion of a single carbon particle, PhD thesis, Universityof Twente, 1987.
[79] F.P. Incropera, D.P. De Witt, Introduction to Heat Transfer, second ed. John Wiley& Sons, New York, 1990.
[80] J.R. Cash, A.H. Krap, A variable order Runge–Kutta method for initial value prob-lems with rapidly varying right-hand sides, ACM Transactions on MathematicalSoftware 16 (1990) 201–222.
[81] R. Scharler, T. Fleckl, I. Obernberger,Modification of aMagnussen constant of the eddydissipationmodel for biomass grate furnaces bymeans of hot gas in-situ FT-IR absorp-tion spectroscopy, Progress in Computational Fluid Dynamics 3 (2003) 102–111.
[82] R. Scharler, I. Obernberger, Numerical optimisations of biomass grate furnaces,Proc. 5th INFUB, Portugal, 2000.
[83] D. Bergström, S. Israelsson, M. Öhman, S. Dahlqvist, R. Gref, C. Boman, I. Wästerlund,Effects of raw material particle size distribution on the characteristics of Scots pinesawdust fuel pellets, Fuel Processing Technology 89 (2008) 1324–1329.
[84] R. Mehrabian, S. Stangl, R. Scharler, I. Obernberger, CFD simulation of biomassgrate furnaces with a comprehensive 3D packed bed model, Proc. 25th GermanFlame Day, Germany, 2011.
Related Documents