A survey of Schools in Juba Report by David Longfield & James Tooley Data collection directed by Kennedy Galla and Jack Ngalamu Data management and analysis by James Tooley, David Longfield and Ian Schagen EG WEST CENTRE, NEWCASTLE UNIVERSITY, AND NILE INSTITUTE ©2013 E G West Centre. All rights reserved. November 2013

Welcome message from author
This document is posted to help you gain knowledge. Please leave a comment to let me know what you think about it! Share it to your friends and learn new things together.
Transcript
A survey of Schools in Juba
Report by David Longfield & James Tooley
Data collection directed by Kennedy Galla and Jack Ngalamu
Data management and analysis by James Tooley,
David Longfield and Ian Schagen
EG WEST CENTRE, NEWCASTLE UNIVERSITY,
AND NILE INSTITUTE
©2013 E G West Centre. All rights reserved.
November 2013
i A Survey of Schools in Juba
November 2013
Executive Summary
Chapter 1: Introduction and background
1. What is the role played by private
education in South Sudan, specifically
in urban and peri-urban Juba? Are
there differences between different
types of private school? The study
investigated the quantity of private
schools, and their academic quality,
relative to government schools and amongst different types of private schools.
2. The focus was on all schools serving pre-primary, primary and secondary level children
in the three payams (districts) of Juba City Council, and the peri-urban areas of Juba
which lie in the payams of Northern Bari and Rajaf. The research was a collaboration
between Newcastle University and the Nile Institute. Funded by the John Templeton
Foundation, the research was part of a larger project also investigating private
education in Sierra Leone and Liberia. (This report focuses only on South Sudan).
3. Phase 1 (reported in Chapters 2 to 15) featured a census of schools, contrasting school
features within different management types. Phase 2 (reported in Chapters 16 to 21)
tested children sampled across the school types in key subjects in order to elicit quality
comparisons and gathered background information from their parents.
Chapter 2: Schools and pupils
4. The systematic mapping of the five payams making up Juba found 199 schools, with
88,820 students enrolled at nursery, primary and secondary level. Of the schools, 73.9
percent (147 schools) was private, while 26.1 percent (52 schools) was government.
Government schools were typically larger than private, enrolling 37.4 percent of
children, compared to 62.6 percent in private schools.
5. We distinguished six types of private schools, those owned by private proprietors, non-
government organisations (NGOs), communities, churches, mosques and Teachers’
Trade Unions (TTUs – an unusual type of fee-paying school set up on the initiative of a
government teacher).
6. The largest proportion of schools is provided by private proprietors (28.1 percent),
followed by government (26.1 percent) and churches (25.1 percent).
7. The largest proportion of pupils, however, is found in schools run by government (37.4
percent), followed by churches (25.6 percent) and private proprietors (19.3 percent).
ii A Survey of Schools in Juba
November 2013
Chapter 3: For profit and non-profit
8. We can classify the private schools as for profit and non-profit. TTUs may be hard to
classify; as their numbers are small, these are excluded from this discussion. With this
slightly smaller number of schools, private non-profit make up 42.6 percent, followed by
29.8 percent for profit and 27.7 percent government.
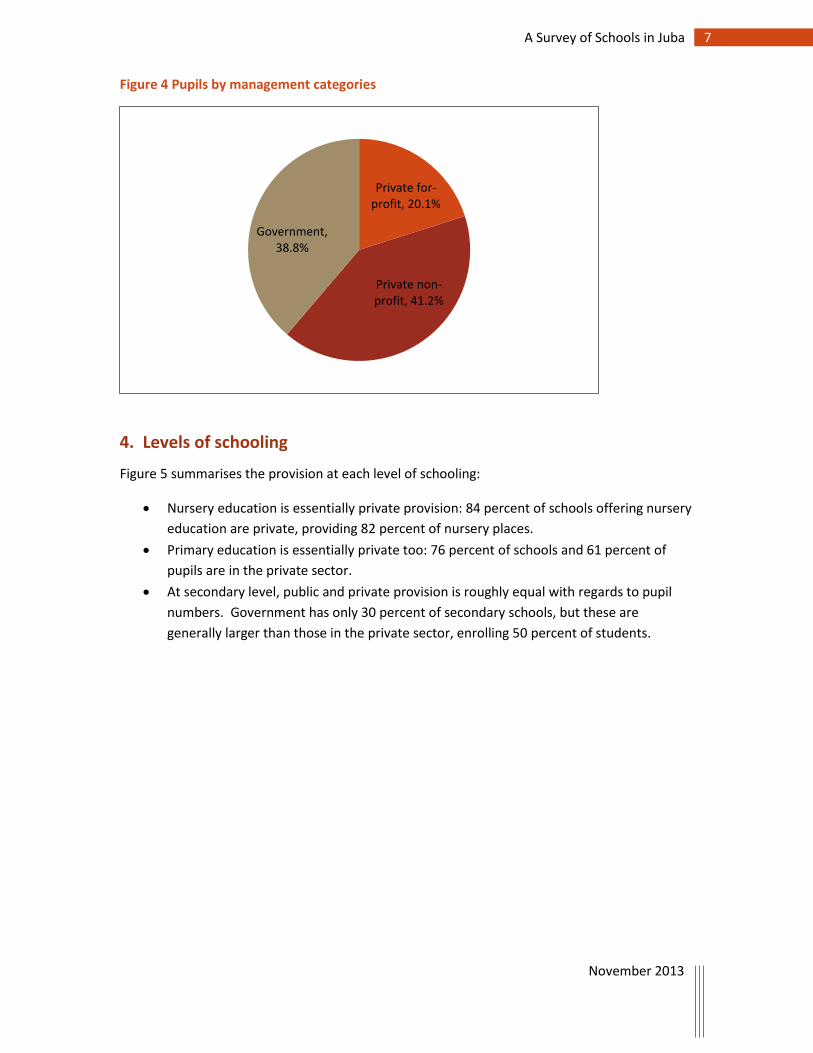
9. Around one fifth (20.1 percent) of students are in for profit private schools, and about
two fifths in each of non-profit private and government (41.2 percent and 38.8 percent
respectively).
Chapter 4: Levels of Schooling
10. Nursery education is primarily private – 84 percent of schools and 82 percent of children
enrolled are in the private sector. The largest proportion of both schools and pupils at
this level (36.4 and 34.4 percent respectively) is served by private proprietors (for
profit).
11. Primary education is also essentially private, providing 76 percent of schools and serving
60 percent of pupils. The largest proportion of schools is equally provided by churches
and private proprietors (28.1 percent each); however, 26.2 percent of pupils are in
church schools compared to 17.7 percent in private proprietor schools at this level.
12. Secondary level is roughly equally divided between public and private in terms of
enrolment, although government provides 30 percent of schools serving secondary
school students – a proportion equal to that provided by private proprietors.
Chapter 5: Assisted schools?
13. None of the private schools reported receiving any government financial assistance – we
were told that the practice of government providing salaries for teachers and other
support is no longer functioning.
14. About one-fifth of schools reported that they received other external support from a
range of donors, including Unicef, BRAC, church agencies and Islamic relief
organisations. This varied considerably by management type of school: 26.1 percent of
government schools received such support compared to only 1.8 percent of private
proprietor schools.
iii A Survey of Schools in Juba
November 2013
Chapter 6: Invisible Schools 1: Payam data
15. Payams have the responsibility of keeping records of all primary schools. While officially
the Ministry of Education claims that their data account for 96.8 percent of primary
places, our study suggested that the government is missing nearly 50 percent of the
schools offering primary classes and nearly 30 percent of the children in primary school.
(These figures are of course lower-bounds, given that we don’t know that we found all
schools in the payams).
16. “Invisible schools” varied by management type: 100 percent of NGO primary schools,
55.8 percent of private proprietor and 44.2 percent of church schools were not on the
payam lists.
17. The proportion of “invisible schools” varied by payam, with higher percentages in the
more “remote” areas of Juba – a majority of private primary schools was invisible in
Northern Bari (76.7 percent) and Rajaf (57.9 percent), while less than a third were
invisible in Kator and Juba (31.3 percent and 31.6 percent respectively).
18. This has serious implications for how well South Sudan is meeting its Millennium
Development Goals – our figures suggest greater progress towards these than official
data might suggest.
Chapter 7: Invisible Schools 2: EMIS data
19. The Government of South Sudan website reports EMIS (Education Management
Information Systems) data. Comparing latest data from 2010 for Juba County (with 16
payams including more than the five payams covered in our research) reveals further
discrepancies.
20. At nursery level, EMIS references at most only 36 percent of the total children in nursery
schools, presumably much lower if there are nursery schools in the 11 payams not
covered by our research.
21. At primary level, our research reports more than twice as many private schools as found
by EMIS. At most government is aware of three-quarters (75.7 percent) of enrolment in
primary school, but presumably the figure is much lower than this, given that are likely
to be many more private schools in the additional 11 payams of the EMIS data not
covered in our research.
22. Similarly at secondary level, government appears aware of at most only half (52.9
percent) of senior students in school.
23. Again, this has serious implications for the Millennium Development Goals – our figures
suggest greater progress towards these than official data might suggest.
Chapter 8: Gender
24. There are roughly equal numbers of girls and boys in nursery and primary school, but
fewer girls in secondary school. At nursery level there are 50 percent girls, while at
primary there are 49 percent girls. At secondary level, there are 42 percent girls.
iv A Survey of Schools in Juba
November 2013
25. Gender enrolment differs very slightly by management type. For instance, in
government primary schools, 48 percent of pupils are girls, compared to 50 percent in
private proprietor schools.
26. Looking at individual class levels, there are roughly equal numbers of boys and girls in
each nursery level class (N1 to N3). In primary level, there are more girls in P1 to P3,
while boys take the lead in P4 to P7. Interestingly there are more girls than boys in P8. In
secondary school, the difference between boys’ and girls’ enrolment is smallest in S1.
Chapter 9: Serving children in out of the way places
27. Government schools are primarily in the city centre payams (Juba and Kator), while
community schools and private proprietor schools are largely in payams away from the
city centre, (Munuki, Northern Bari and Rajaf).
Chapter 10: Teachers and pupil-teacher ratios
28. The private sector is an important employer, employing 65 percent of all teachers. The
largest proportion is employed in church and private proprietor schools (24 and 21
percent of total teachers respectively).
29. Estimates for pupil-teacher ratios suggest highest rates in community and government
schools (47.3:1 and 40.0:1 respectively). Church and private proprietor schools both
have rates of 34.0:1, while the lowest rates are in NGO and Mosque schools (both
around 27:1).
Chapter 11: Fees
30. Total annual fees or levies were computed for all schools, including termly fees,
registration fees, development or building levies, sports fees, PTA fees, exam fees,
report card fees and graduation levies.
31. The highest average (median) annual fees are found in church and private proprietor
schools ($127.05 and $125.40 respectively), while the lowest are found in NGO,
government and mosque schools ($14.85, $16.50 and $16.50 respectively).
Chapter 12: Affordability
32. How affordable are private schools? Using the suggestion that poor families should not
be spending more than 10 percent of their total income on schooling fees for all their
children, we define schools in the following way:
a. “ultra-low cost” schools are affordable by families on 39 SDG per month, the
average consumption figure for those families below the 72.9 SDG per month (2009)
poverty line.
b. “very low cost” schools are defined as those schools affordable by families from 39
SDG to the 72.9 SDG per month (2009) poverty line
v A Survey of Schools in Juba
November 2013
c. “low cost” are those schools affordable by families earning up to the $2.00 (PPP)
per person per day poverty line
d. “medium cost” are those affordable to families up to the middle class $4.00 per
person per day.
e. “high cost” private schools are those affordable only by families of above middle
class incomes.
33. The vast majority (92 percent) of schools found is low cost or below, with only seven
percent medium cost and two percent high cost.
34. All government schools are very low cost or below.
35. Around one fifth of for profit private schools are ultra-low cost, two fifths very low cost,
and one fifth low cost – that is, over 80 percent of for profit private schools are low cost
or below.
36. The non-profit private schools have a similar percentage (84 percent) that are low cost
or below, although even more of these are ultra-low and very low cost (32 percent and
52 percent respectively).
37. The proportion of private proprietor and church schools that are ultra-low cost is
roughly the same (19.4 percent and 18.2 percent respectively), although a higher
proportion of church than private proprietor schools are very low cost (64 percent
compared to 42 percent).
Chapter 13: An educational peace dividend?
38. There has been a significant peace dividend in the education sector. Of the 198 schools
for which we have date of establishment, only 82 (41.4 percent) were in existence in
2005, the date of the Comprehensive Peace Agreement (CPA). Indeed, 107 schools (54
percent) have been established in the last five years.
39. The most dramatic recent growth has been by private proprietor schools. Private
proprietor schools have grown from two schools in 2000 to 56 today, or by 700 percent
in the seven years since CPA (an average growth of 35 percent per annum). This should
be compared to the growth of government schools (at 4 percent per annum since CPA).
Community schools have also seen dramatic growth of 27 percent per annum.
40. The newly developed payams of Munuki and Northern Bari (where many of the private
proprietor and community schools are found) are showing the highest rates of growth.
In 2000, Munuki only had eight schools compared to Juba’s 39. But 12 years later, both
payams have roughly the same number of schools.
Chapter 14: Registration and attendance
41. To check the proportions of children in different school management types, we
physically counted all children present in each school on the day of the research visit.
42. Looking at the primary level (other levels gave similar results), there were 150 and 153
schools for which we obtained attendance and registration data respectively. Comparing
the percentage of pupils attending with those enrolled gives more or less identical
vi A Survey of Schools in Juba
November 2013
results. For instance, 17.8 percent of total pupils were reported enrolled in private
proprietor schools, while 17.9 percent of pupils we counted were attending the same
school type.
43. We can therefore be fairly confident that the enrolment percentages reported in
Chapter 2 roughly reflect the reality on the ground: to put it another way, no
management type appears to be exaggerating its enrolment more than any other type,
if at all.
44. There is no significant problem with girls’ attendance at primary level. Girls’ attendance
rates are slightly higher in private schools (both for profit and non-profit) than
government schools.
Chapter 15: School inputs
45. Teachers were mostly present when they should have been in the Grade 1 and 2
classrooms. For instance, government and private proprietor schools both had around
90 percent teacher attendance.
46. Government, TTU and NGO schools had the highest percentage of playgrounds (around
70 percent), while community schools were the least well-equipped (27 percent).
Around 40 percent of private proprietor schools had playgrounds.
47. A higher proportion of private proprietor schools supplied drinking water than
government schools (75 percent compared to 62 percent). The provision of toilets is also
higher in private proprietor than government schools (88 percent compared to 76
percent).
Chapter 16: Seven steps to comparison
48. The second phase of the research focused on children in primary 4, and tested these
children in English, using individual reading and group spelling tests developed by GL
Assessment, and in mathematics using a GMADE test (excluding questions involving
language).
49. Questionnaires were given to pupils, their families and teachers to elicit background
variables. A team of 40 researchers spent six days in schools; data were entered in Juba
and analysed in Newcastle.
Chapter 17: The sample
50. A total of 97 schools was selected, being all those in the sample which had primary 4
children within them. In the three management categories, there were 32 for profit, 36
non-profit and 29 government schools. Roughly one third of children were in each
management category.
vii A Survey of Schools in Juba
November 2013
Chapter 18: Creating a statistical model
51. The outcome variables are children’s achievement scores in English (reading), English
(spelling) and mathematics, which were standardised with a mean of 100 and standard
deviation of 15. Background variables were collected through the questionnaires to
pupils, teachers, parents and the school. Using factor analysis the number of variables
was reduced to make the analysis manageable.
52. The model used multilevel modelling in order to overcome the problem that children
were clustered into schools rather than randomly selected from the population at large.
The final models include school-based, pupil-based and interaction terms.
Chapter 19: Comparisons of achievement in public and private schools
53. Concerning all subjects - reading, mathematics, and spelling – boys tend to outperform
girls.
54. For-profit schools have a significantly higher reading mean than non-profit schools,
which have a higher mean than government schools.
55. Multilevel models were created. Again for reading, looking only at schools which are in
the low, very low or ultra-low cost categories (i.e., all government, but excluding
medium and higher cost private schools), for profit schools make a significant difference
in girls’ reading scores and to higher IQ pupils’ reading scores: that is, girls in for profit
schools on average do significantly better than equivalent girls in government schools,
while for profit schools enable those pupils with higher IQ to read more than equivalent
IQ pupils in government schools.
56. The model predicts that, while girls are on average behind boys in reading in all school
categories, more able girls in for profit schools will outperform more able boys in
government schools.
57. Using multilevel modelling for mathematics and focusing only on schools which are in
the low, very low or ultra-low cost categories, gives no evidence that for profit schools
will do better (or worse) than government schools.
58. Regarding spelling, there was again insufficient evidence to decide if any of the
management categories would be predicted to perform better when the multilevel
model was constructed.
Chapter 20: Value for money
59. The most significant element of school resourcing, teacher salaries was investigated.
Taking all school types and cost levels, on average, teachers in government schools are
most highly paid, with mean monthly salaries of SSP 671 compared to SSP 508 in for
profit and SSP 489 in non-profit private schools. Disaggregating by fee level shows that
only teachers in medium or higher cost private schools get paid as much as teachers in
government schools.
viii A Survey of Schools in Juba
November 2013
60. Looking only at low, very low and ultra-low cost schools (i.e., all government but
excluding some higher cost private schools), the salary difference is even more
noticeable: compared to the mean monthly salaries of SSP 671 in government schools,
mean salaries in for-profit schools were SSP 412 and non-profit SSP 481.
61. A crude estimate of cost-effectiveness can be made for reading. Calculating ‘cost per
reading percent’ gives an estimate that for profit private schools are around twice as
cost-effective as government schools (2.2 times for girls, 1.8 for boys), while non-profit
schools may be around 1.5 times more cost-effective.
Chapter 21: Variation between schools
62. One of the reasons why the analysis in Chapter 18 was not able to produce statistically
significant results concerning difference between school management types in spelling
and mathematics (although it did in reading) is because of the wide variation in scores
achieved by pupils in schools of the same management type. This large variation was
found in each of the categories of for profit, non-profit and government schools.
Chapter 22: Reasons for school choice
63. Parents were asked to highlight one or more reasons for their choice of school. While
equal percentages of parents chose each school management category because of their
proximity to home, parents chose non-profit schools more for their Christian basis, for
profit schools for their level of English and both types of private school for their
academic standards; government schools were chosen more on costs.
64. Parents were largely satisfied with their teachers’ ability, punctuality and attendance,
and with school discipline. Greater dissatisfaction was expressed about school buildings
and facilities, with larger proportions of parents in government schools very dissatisfied
with facilities in particular. Government parents were also more dissatisfied about class
size and levels of English than their private counterparts.
ix A Survey of Schools in Juba
November 2013
Contents
Executive Summary ...................................................................................................... i
1. Introduction and background ............................................................................... 1
2. Schools and pupils ................................................................................................ 2
3. For profit and non-profit ...................................................................................... 5
4. Levels of schooling ............................................................................................... 7
Nursery ..............................................................................................................................8
Primary ..............................................................................................................................8
Secondary ..........................................................................................................................9
5. Assisted schools? .................................................................................................. 9
6. Invisible Schools at the Payam level .................................................................... 11
Management types .......................................................................................................... 11
Invisible schools by payam ............................................................................................... 13
7. Invisible schools 2: EMIS data ............................................................................. 14
Nursery level .................................................................................................................... 14
Primary level .................................................................................................................... 15
Secondary ........................................................................................................................ 15
8. Gender ............................................................................................................... 16
Gender by level of schooling ............................................................................................. 16
Gender by classes ............................................................................................................. 19
9. Serving children in out of the way places ............................................................ 20
School locations ............................................................................................................... 21
10. Teachers and pupil-teacher ratios ................................................................... 23
11. Fees ................................................................................................................ 23
12. Affordability ................................................................................................... 26
Defining “Low-cost” private schools .................................................................................. 27
Affordability and school management type ....................................................................... 30
x A Survey of Schools in Juba
November 2013
13. An Educational Peace Dividend? ..................................................................... 32
14. Registration and Attendance .......................................................................... 35
Checking enrolment proportions ...................................................................................... 36
Gender and attendance .................................................................................................... 36
15. School Inputs .................................................................................................. 37
16. Seven steps to comparison .............................................................................. 41
17. The sample ..................................................................................................... 43
18. Creating a statistical model ............................................................................ 44
19. Comparisons between achievement in public and private schools .................... 48
Reading ............................................................................................................................ 48
Initial comparisons ............................................................................................................................... 48
Multi-level modelling ........................................................................................................................... 51
Mathematics .................................................................................................................... 55
Initial comparisons ............................................................................................................................... 55
Multi-level modelling ........................................................................................................................... 57
Spelling ............................................................................................................................ 60
Basic analysis ....................................................................................................................................... 60
Multi-level modelling ........................................................................................................................... 61
20. Value for money ............................................................................................. 63
Teacher salaries ............................................................................................................... 64
Calculating cost-effectiveness ........................................................................................... 66
21. Variation between schools .............................................................................. 68
22. Reasons for school choice ............................................................................... 72
Parental satisfaction ......................................................................................................... 73
Conclusion ................................................................................................................ 80
References ................................................................................................................ 83
xi A Survey of Schools in Juba
November 2013
Tables of Figures
Figure 1 Schools by management type ........................................................................................................... 4
Figure 2 Pupils by management type ............................................................................................................. 5
Figure 3 Schools by management categories ................................................................................................. 6
Figure 4 Pupils by management categories .................................................................................................... 7
Figure 5 Private and government provision, by level of schooling ................................................................. 8
Figure 6 External donors to schools .............................................................................................................. 11
Figure 7 Number of schools on Payam lists, by Payam and management category .................................... 14
Figure 8 Classes by gender ........................................................................................................................... 18
Figure 9 Number of schools offering different classes .................................................................................. 20
Figure 10 Map of Juba schools ..................................................................................................................... 22
Figure 11 Private Proprietor Fees ................................................................................................................. 25
Figure 12 Median Fees across the Classes arranged by management type ................................................. 26
Figure 13. Cumulative number of Schools, by Date of Establishment, since 2000 ...................................... 33
Figure 14 Growth in Number of Schools over time by management type .................................................... 34
Figure 15 The Peace Dividend, by Payam ..................................................................................................... 35
Figure 16 Reading scores predicted by interaction model for low, very low and ultra-low cost schools ..... 54
Figure 17 Mean teacher’s salary, low, very low and ultralow cost schools .................................................. 65
Figure 18 Mean teacher’s salary for very low and ultra-low cost schools .................................................... 66
Figure 19 Lowest cost for profit schools: variation in reading outcomes ..................................................... 68
Figure 20 A small sample of 7 very low cost private schools ........................................................................ 69
Figure 21 Government school reading score variation. ................................................................................ 70
Figure 22 Non-profit reading score variation for very low cost schools ....................................................... 71
Figure 23 Satisfaction (teacher ability) ......................................................................................................... 74
Figure 24 Satisfaction (teacher punctuality) ................................................................................................. 74
Figure 25 Satisfaction (teacher attendance) ................................................................................................ 75
Figure 26 Satisfaction (school discipline) ...................................................................................................... 75
Figure 27 Satisfaction (school buildings) ...................................................................................................... 76
Figure 28 Satisfaction (school facilities) ....................................................................................................... 76
Figure 29 Satisfaction (class size) ................................................................................................................. 77
Figure 30 Satisfaction (level of English) ........................................................................................................ 77
xii A Survey of Schools in Juba
November 2013
Table of Tables
Table 1 Schools and pupils, Juba .................................................................................................................... 3
Table 2 Schools and pupils by management type ........................................................................................... 4
Table 3 Schools and pupils, by management category, excluding TTUs......................................................... 6
Table 4 Nursery Provision by management type ............................................................................................ 8
Table 5 Primary Provision by management type ............................................................................................ 9
Table 6 Secondary Provision by management type ........................................................................................ 9
Table 7 External donor funding, by management type ................................................................................ 10
Table 8 Invisble private primary schools ....................................................................................................... 12
Table 9 Invisible private primary schools, by management type .................................................................. 12
Table 10 Invisible primary schools, by management category ..................................................................... 13
Table 11 Invisible schools, by Payam ............................................................................................................ 13
Table 12 Pre-Primary Provision (EMIS data and Survey data) ...................................................................... 15
Table 13 Primary Provision (EMIS data and Survey data) ............................................................................ 15
Table 14 Secondary Provision (EMIS and Survey data) ................................................................................. 16
Table 15 Registered Nursery Pupils, by Gender ............................................................................................ 17
Table 16 Registered Primary Pupils by Gender ............................................................................................. 17
Table 17 Registered Secondary Pupils by Gender ......................................................................................... 18
Table 18 Serving children in out of the way places, by management types ................................................. 21
Table 19 Pupil-teacher ratios, by management type.................................................................................... 23
Table 20 Total Yearly Fees for Primary 4 ...................................................................................................... 24
Table 21 Fee levels and the poverty lines on which they are based ............................................................. 29
Table 22 Calculations for low-cost private schools ....................................................................................... 30
Table 23 Fee levels of Juba schools ............................................................................................................... 31
Table 24 Fee levels by management categories ........................................................................................... 31
Table 25 Fee levels, by management type .................................................................................................... 32
Table 26 The peace dividend: Growth in schools .......................................................................................... 34
Table 27 Enrolled and attending pupils, by management type .................................................................... 36
Table 28 Registration and attendance at primary school level, by gender .................................................. 37
Table 29 Activity of P1 and P2 Teachers ....................................................................................................... 38
Table 30 Availability of a School Playground ................................................................................................ 39
Table 31 Availability of Drinking Water ........................................................................................................ 39
Table 32 Availability of toilets for pupils ...................................................................................................... 40
Table 33 Availability of toilets for staff ......................................................................................................... 41
Table 34 Schools and pupils in component 2 ................................................................................................ 44
Table 35 Variables used in multilevel modelling........................................................................................... 47
Table 36 Schools in Component 2 by fee category and management type .................................................. 48
Table 37 Reading scores ............................................................................................................................... 49
Table 38 Reading gender differences ........................................................................................................... 49
Table 39 ANOVA for reading scores for different management types ......................................................... 50
Table 40 ANOVA of Reading scores for different fee categories .................................................................. 51
Table 41 Multi-level model: Reading, schools with low, very low or ultra-low fees only ............................. 53
Table 42 Predicted standardised reading scores for low, very low and ultra-low cost schools .................... 55
Table 43 Predicted raw reading scores, low, very low and ultra-low cost schools only ............................... 55
xiii A Survey of Schools in Juba
November 2013
Table 44 Mathematics scores out of a possible 24 ....................................................................................... 56
Table 45 Mean mathematics scores by fee level .......................................................................................... 56
Table 46 Mathematics scores by fee level, management type and gender ................................................. 57
Table 47 Multilevel model: mathematics, low, very low and ultra-low cost schools only ............................ 60
Table 48 Spelling scores for boys and girls across fee levels and management categories ......................... 61
Table 49 Multi-level spelling model for low, very low and ultra-low fee schools ......................................... 63
Table 50 Teacher salary, by management categories; all fee levels ............................................................ 64
Table 51 Teacher salary, by management type; all fee levels ...................................................................... 64
Table 52 Teacher salaries, by management category; low, very low and ultra-low cost schools only ........ 65
Table 53 Teacher salaries, by management type; low, very low and ultra-low cost schools only ................ 65
Table 54 Teacher salaries, by management types; very low and ultra-low cost schools only ...................... 66
Table 55 Value for money, by management category, gender; low, very low and ultra-low cost schools... 67
Table 56 Standardised reading scores as predicted by regression equation compared to actual scores. .... 70
Table 57 Reasons for school choice .............................................................................................................. 72
Table 58 Choices by management category ................................................................................................. 73
Table 59 Average satisfaction by fee level ................................................................................................... 79
1. Introduction and background
The aim of the research was to explore the role that private providers are playing with respect
to education in South Sudan, specifically urban and peri-urban Juba. We were interested in both
quantity of private provision, as well as its quality relative to government schools, and also
comparing different types of private school.
The context is the current interest in the private sector as a potential partner in meeting the
Millennium Development Goal education targets. Research has highlighted the way private
schools are playing a role in meeting the educational needs of citizens, including the poor,
across various countries in sub-Saharan Africa. For instance, to take three recent examples:
In Nairobi, Kenya, large numbers of poor pupils are enrolled in low-cost private schools,
even after the introduction of free primary education in government schools (Oketch et
al, 2010). Private school usage was found to be highest amongst the poorest families: a
higher proportion (43%) of families from the poorest quintile living in the slums sent
their children to private schools than the proportion (35%) from the richest quintile not
living in the slums (p. 28).
In rural Ghana, researchers note the ubiquity of low-cost private schools and suggest
that their growth “requires policies that bring them under the umbrella of strategies to
improve access for all” (Akaguri and Akyeamapong, 2010, p. 4). In particular, they
suggest that the poorest parents could be helped to attend low-cost private schools,
often preferred over the government alternative, through “direct public assistance” (p.
4).
In Lagos State, Nigeria, the Education Sector Support Programme (ESSPIN) conducted a
comprehensive survey of private schools across the whole of Lagos State (Härmä
2011a). It found 12,098 private schools catering to around 60 percent of total
enrolment, although ‘if anything this figure is on the conservative side’, possibly missing
out smaller schools (Härmä 2011c, footnote 2, p. 2). Just over half of enrolment in the
private schools was girls. Around three quarters of the private schools are unapproved,
which probably indicates the number of low-cost private schools. In general, in terms of
quality indicators, ‘private schools are ahead of the public sector in terms of provision of
water and sanitation facilities’, and have a superior pupil-teacher ratio over government
schools.’ (pp. 21-2).
How does South Sudan fit into this picture? The current study, funded by the John Templeton
Foundation, investigated the role of private schools in meeting educational needs of people,
including the poor, in the capital cities and adjoining peri-urban and rural areas of three post-
conflict countries, Sierra Leone, Liberia and South Sudan. This paper reports on South Sudan
only.
Specifically, we investigated the three payams [districts] of Juba City Council and the peri-urban
areas of Juba which lie in the payams of Northern Bari and Rajaf. We were concerned with two
major research questions:
2 A Survey of Schools in Juba
November 2013
What proportion of children is in private education, compared to that in government
schools? We were especially interested in distinguishing between different types of
private provider here, especially what might be termed ‘for profit’ and ‘non-profit’
providers.
How does academic achievement compare in the different types of private schools and
government schools? Our focus here was on achievement in language and mathematics,
and we were also interested in comparisons of cost effectiveness.
Exploring the first research question was the first phase of the research, the second question
made up the second phase. The current research project was a collaboration between
Newcastle University’s E.G. West Centre, directed by Professor James Tooley and David
Longfield, and the Nile Institute based in Juba, under the directorship of Kennedy Galla. A team
of 60 researchers and five supervisors was recruited for the first phase of the project. Grouped
in pairs, each was equipped with maps and questionnaires. They carried out a systematic
mapping of the localities assigned to them, searching in every street, alleyway and pathway for
schools, whether or not these were registered or on government lists. Our aim was to find all
schools across the whole of the designated payams. The researchers worked during a one-week
period in June 2012. In all, 199 schools were located. In each of these schools, the researchers
conducted an interview with the school manager or headteacher, and visited all classrooms to
count children, to have a physical check on enrolment figures given by school management and
to make observations about school facilities.
The second question required probing in further detail a sample of these schools. More details
are given about the sampling method in Chapter 17 below. In brief, a team of 40 researchers,
again in pairs, aimed to visit all schools that had a Primary 4 class, during a week in October
2012, with the aim of testing up to 30 pupils from each school. In the event a small number of
schools did not allow access and we were restricted to 99 of the 106 schools we aimed to visit.
In all, 2485 children were tested, in mathematics, language and cognitive ability, and
questionnaires were given to children, their families and teachers in order to elicit relevant
background variables.
What did the researchers find? This report is divided into two parts, reflecting the two major
research questions. The first part (chapters 2 to 7) outlines the major findings on numbers of
schools and pupils in each management type, and explores issues concerning gender, and the
growth in private schools. The second part (chapters 8 to 13) introduces findings concerning
relative academic achievement in the different school types, outlining the statistical model used
to find these results. Chapter 23 offers brief conclusions.
2. Schools and pupils
In the systematic mapping of the five payams making up Juba, we found a total of 199 schools,
with 88,820 students enrolled at nursery, primary and secondary level.
3 A Survey of Schools in Juba
November 2013
We can look at this total number of schools usefully in four different ways, focusing on whether
schools are privately or publicly managed, what particular types of management are featured,
including distinguishing between “for profit” and “non-profit” private schools, and finally
whether or not schools receive outside, including government financial assistance.
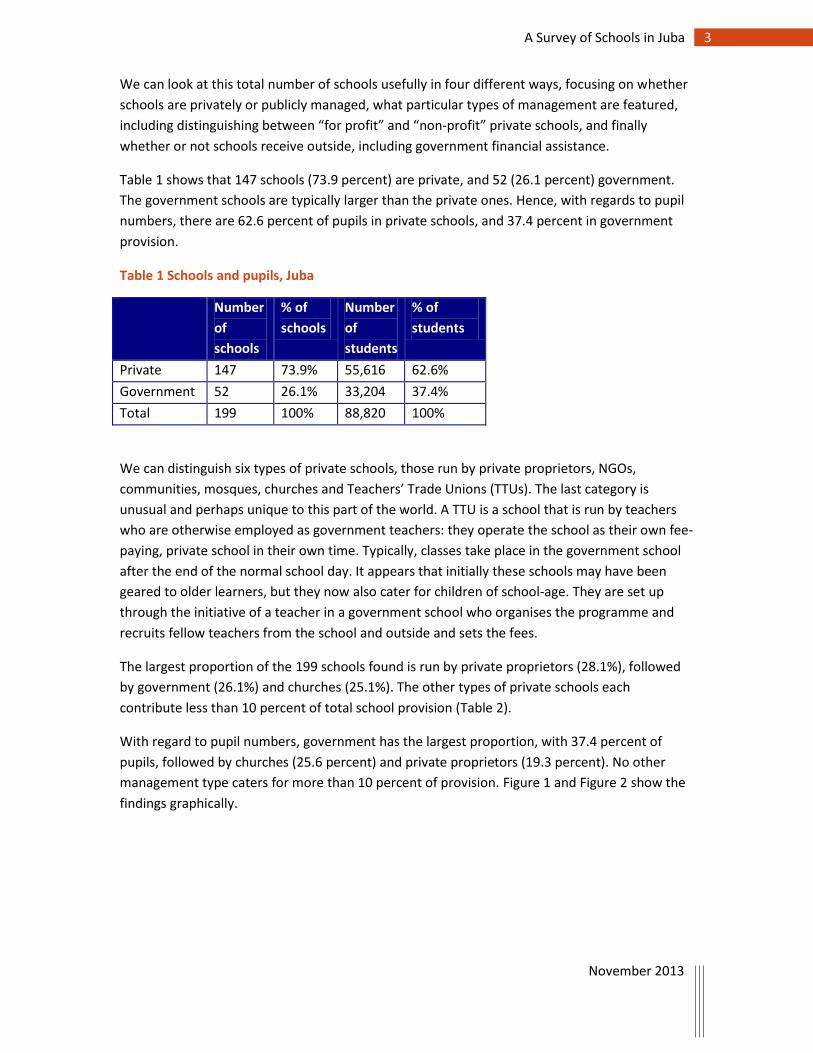
Table 1 shows that 147 schools (73.9 percent) are private, and 52 (26.1 percent) government.
The government schools are typically larger than the private ones. Hence, with regards to pupil
numbers, there are 62.6 percent of pupils in private schools, and 37.4 percent in government
provision.
Table 1 Schools and pupils, Juba
Number
of
schools
% of
schools
Number
of
students
% of
students
Private 147 73.9% 55,616 62.6%
Government 52 26.1% 33,204 37.4%
Total 199 100% 88,820 100%
We can distinguish six types of private schools, those run by private proprietors, NGOs,
communities, mosques, churches and Teachers’ Trade Unions (TTUs). The last category is
unusual and perhaps unique to this part of the world. A TTU is a school that is run by teachers
who are otherwise employed as government teachers: they operate the school as their own fee-
paying, private school in their own time. Typically, classes take place in the government school
after the end of the normal school day. It appears that initially these schools may have been
geared to older learners, but they now also cater for children of school-age. They are set up
through the initiative of a teacher in a government school who organises the programme and
recruits fellow teachers from the school and outside and sets the fees.
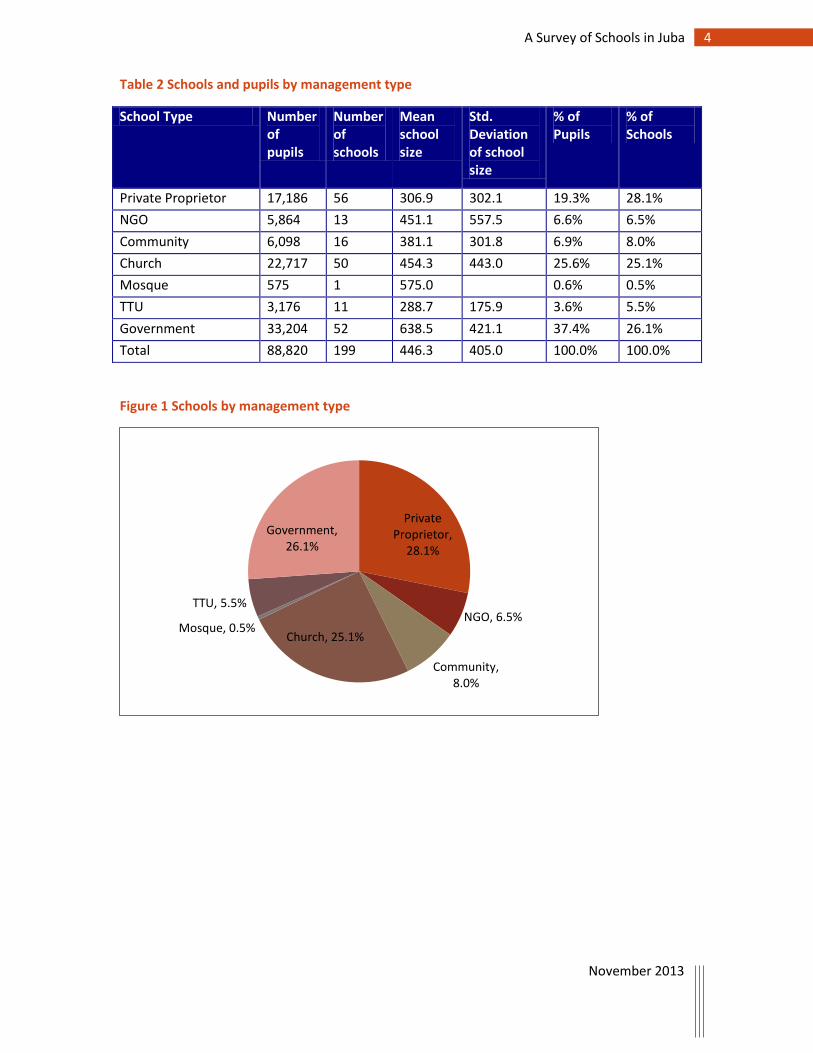
The largest proportion of the 199 schools found is run by private proprietors (28.1%), followed
by government (26.1%) and churches (25.1%). The other types of private schools each
contribute less than 10 percent of total school provision (Table 2).
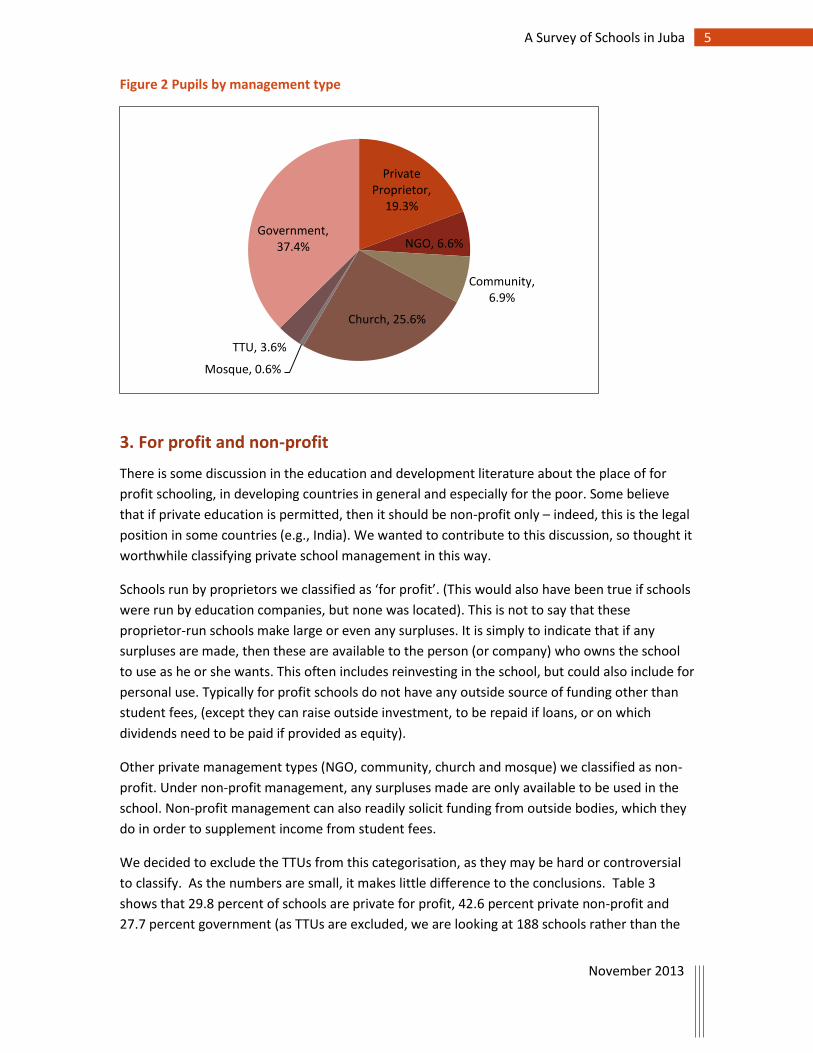
With regard to pupil numbers, government has the largest proportion, with 37.4 percent of
pupils, followed by churches (25.6 percent) and private proprietors (19.3 percent). No other
management type caters for more than 10 percent of provision. Figure 1 and Figure 2 show the
findings graphically.
4 A Survey of Schools in Juba
November 2013
Table 2 Schools and pupils by management type
School Type Number of pupils
Number of schools
Mean school size
Std. Deviation of school size
% of Pupils
% of Schools
Private Proprietor 17,186 56 306.9 302.1 19.3% 28.1%
NGO 5,864 13 451.1 557.5 6.6% 6.5%
Community 6,098 16 381.1 301.8 6.9% 8.0%
Church 22,717 50 454.3 443.0 25.6% 25.1%
Mosque 575 1 575.0 0.6% 0.5%
TTU 3,176 11 288.7 175.9 3.6% 5.5%
Government 33,204 52 638.5 421.1 37.4% 26.1%
Total 88,820 199 446.3 405.0 100.0% 100.0%
Figure 1 Schools by management type
Private Proprietor,
28.1%
NGO, 6.5%
Community, 8.0%
Church, 25.1% Mosque, 0.5%
TTU, 5.5%
Government, 26.1%
5 A Survey of Schools in Juba
November 2013
Figure 2 Pupils by management type
3. For profit and non-profit
There is some discussion in the education and development literature about the place of for
profit schooling, in developing countries in general and especially for the poor. Some believe
that if private education is permitted, then it should be non-profit only – indeed, this is the legal
position in some countries (e.g., India). We wanted to contribute to this discussion, so thought it
worthwhile classifying private school management in this way.
Schools run by proprietors we classified as ‘for profit’. (This would also have been true if schools
were run by education companies, but none was located). This is not to say that these
proprietor-run schools make large or even any surpluses. It is simply to indicate that if any
surpluses are made, then these are available to the person (or company) who owns the school
to use as he or she wants. This often includes reinvesting in the school, but could also include for
personal use. Typically for profit schools do not have any outside source of funding other than
student fees, (except they can raise outside investment, to be repaid if loans, or on which
dividends need to be paid if provided as equity).
Other private management types (NGO, community, church and mosque) we classified as non-
profit. Under non-profit management, any surpluses made are only available to be used in the
school. Non-profit management can also readily solicit funding from outside bodies, which they
do in order to supplement income from student fees.
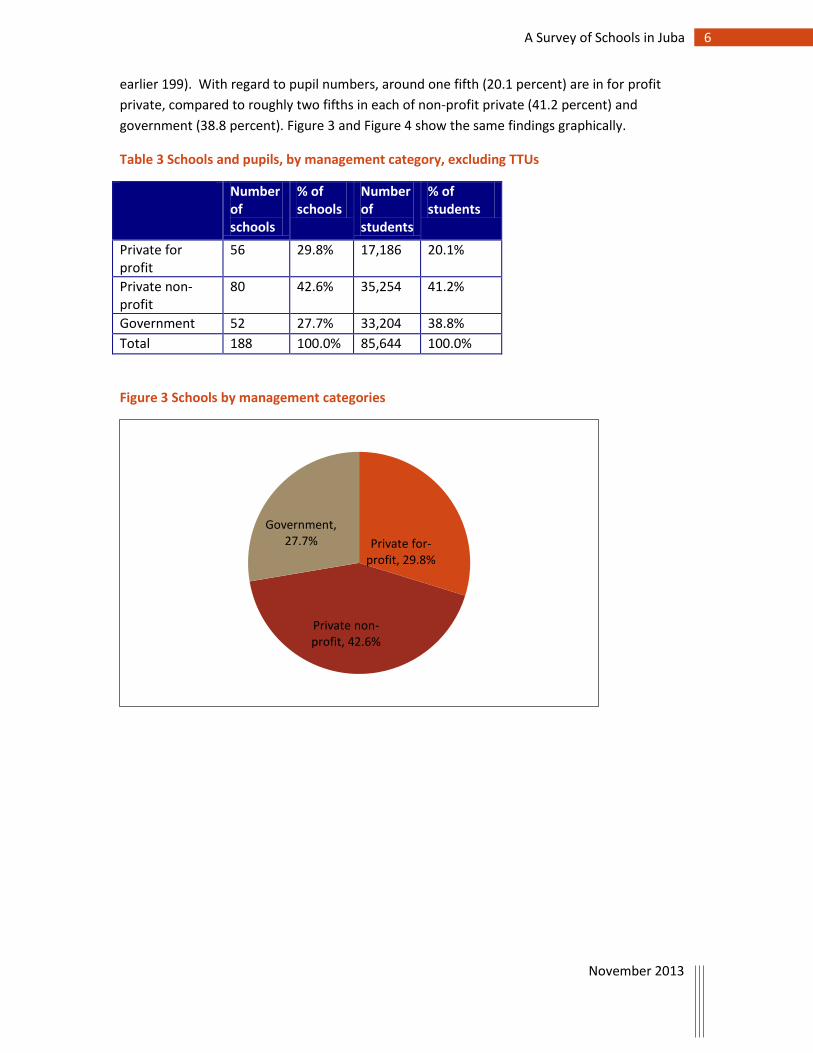
We decided to exclude the TTUs from this categorisation, as they may be hard or controversial
to classify. As the numbers are small, it makes little difference to the conclusions. Table 3
shows that 29.8 percent of schools are private for profit, 42.6 percent private non-profit and
27.7 percent government (as TTUs are excluded, we are looking at 188 schools rather than the
Private Proprietor,
19.3%
NGO, 6.6%
Community, 6.9%
Church, 25.6%
Mosque, 0.6%
TTU, 3.6%
Government, 37.4%
6 A Survey of Schools in Juba
November 2013
earlier 199). With regard to pupil numbers, around one fifth (20.1 percent) are in for profit
private, compared to roughly two fifths in each of non-profit private (41.2 percent) and
government (38.8 percent). Figure 3 and Figure 4 show the same findings graphically.
Table 3 Schools and pupils, by management category, excluding TTUs
Number of schools
% of schools
Number of students
% of students
Private for profit
56 29.8% 17,186 20.1%
Private non-profit
80 42.6% 35,254 41.2%
Government 52 27.7% 33,204 38.8%
Total 188 100.0% 85,644 100.0%
Figure 3 Schools by management categories
Private for-profit, 29.8%
Private non-profit, 42.6%
Government, 27.7%
7 A Survey of Schools in Juba
November 2013
Figure 4 Pupils by management categories
4. Levels of schooling
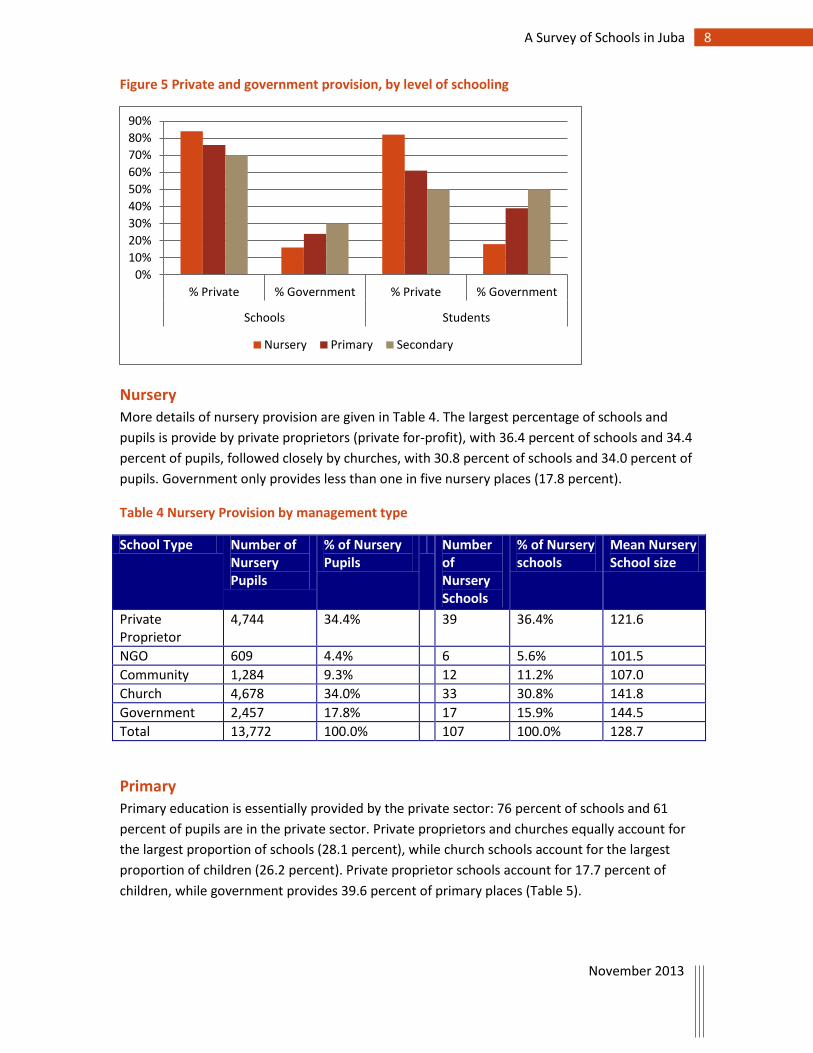
Figure 5 summarises the provision at each level of schooling:
Nursery education is essentially private provision: 84 percent of schools offering nursery
education are private, providing 82 percent of nursery places.
Primary education is essentially private too: 76 percent of schools and 61 percent of
pupils are in the private sector.
At secondary level, public and private provision is roughly equal with regards to pupil
numbers. Government has only 30 percent of secondary schools, but these are
generally larger than those in the private sector, enrolling 50 percent of students.
Private for-profit, 20.1%
Private non-profit, 41.2%
Government, 38.8%
8 A Survey of Schools in Juba
November 2013
Figure 5 Private and government provision, by level of schooling
Nursery More details of nursery provision are given in Table 4. The largest percentage of schools and
pupils is provide by private proprietors (private for-profit), with 36.4 percent of schools and 34.4
percent of pupils, followed closely by churches, with 30.8 percent of schools and 34.0 percent of
pupils. Government only provides less than one in five nursery places (17.8 percent).
Table 4 Nursery Provision by management type
School Type Number of Nursery Pupils
% of Nursery Pupils
Number of Nursery Schools
% of Nursery schools
Mean Nursery School size
Private Proprietor
4,744 34.4% 39 36.4% 121.6
NGO 609 4.4% 6 5.6% 101.5
Community 1,284 9.3% 12 11.2% 107.0
Church 4,678 34.0% 33 30.8% 141.8
Government 2,457 17.8% 17 15.9% 144.5
Total 13,772 100.0% 107 100.0% 128.7
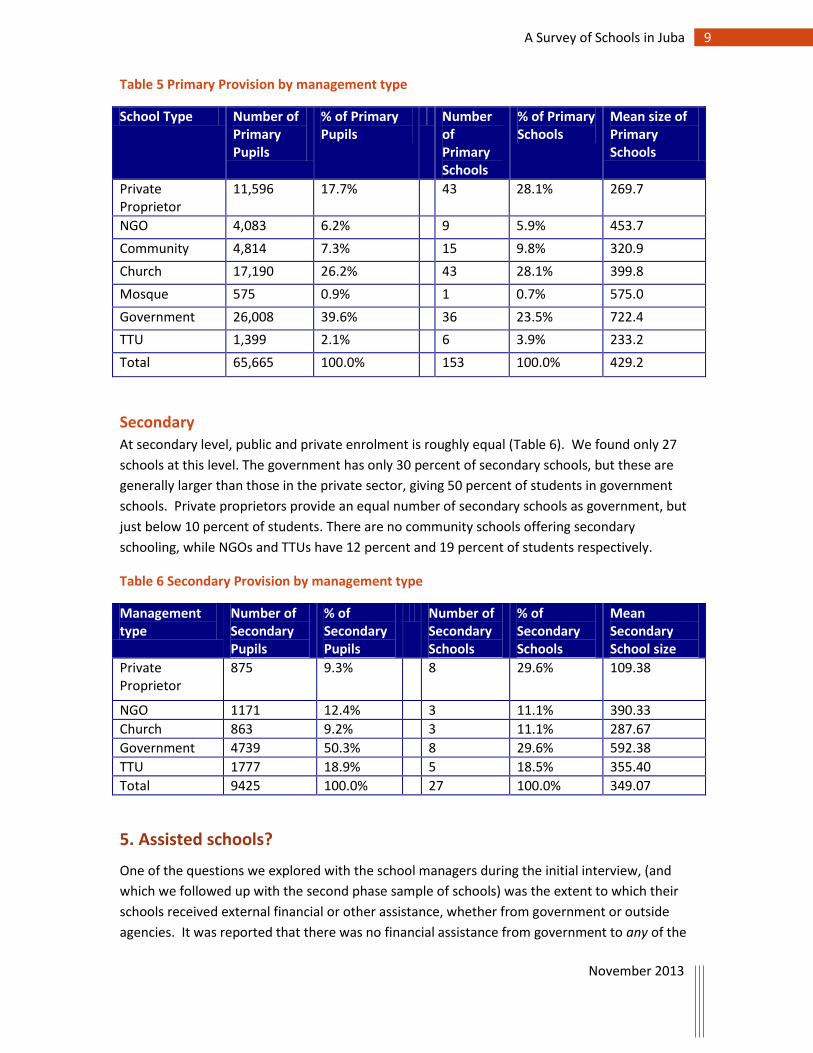
Primary
Primary education is essentially provided by the private sector: 76 percent of schools and 61
percent of pupils are in the private sector. Private proprietors and churches equally account for
the largest proportion of schools (28.1 percent), while church schools account for the largest
proportion of children (26.2 percent). Private proprietor schools account for 17.7 percent of
children, while government provides 39.6 percent of primary places (Table 5).
0%
10%
20%
30%
40%
50%
60%
70%
80%
90%
% Private % Government % Private % Government
Schools Students
Nursery Primary Secondary
9 A Survey of Schools in Juba
November 2013
Table 5 Primary Provision by management type
School Type Number of Primary Pupils
% of Primary Pupils
Number of Primary Schools
% of Primary Schools
Mean size of Primary Schools
Private Proprietor
11,596 17.7% 43 28.1% 269.7
NGO 4,083 6.2% 9 5.9% 453.7
Community 4,814 7.3% 15 9.8% 320.9
Church 17,190 26.2% 43 28.1% 399.8
Mosque 575 0.9% 1 0.7% 575.0
Government 26,008 39.6% 36 23.5% 722.4
TTU 1,399 2.1% 6 3.9% 233.2
Total 65,665 100.0% 153 100.0% 429.2
Secondary
At secondary level, public and private enrolment is roughly equal (Table 6). We found only 27
schools at this level. The government has only 30 percent of secondary schools, but these are
generally larger than those in the private sector, giving 50 percent of students in government
schools. Private proprietors provide an equal number of secondary schools as government, but
just below 10 percent of students. There are no community schools offering secondary
schooling, while NGOs and TTUs have 12 percent and 19 percent of students respectively.
Table 6 Secondary Provision by management type
Management type
Number of Secondary Pupils
% of Secondary Pupils
Number of Secondary Schools
% of Secondary Schools
Mean Secondary School size
Private Proprietor
875 9.3% 8 29.6% 109.38
NGO 1171 12.4% 3 11.1% 390.33
Church 863 9.2% 3 11.1% 287.67
Government 4739 50.3% 8 29.6% 592.38
TTU 1777 18.9% 5 18.5% 355.40
Total 9425 100.0% 27 100.0% 349.07
5. Assisted schools?
One of the questions we explored with the school managers during the initial interview, (and
which we followed up with the second phase sample of schools) was the extent to which their
schools received external financial or other assistance, whether from government or outside
agencies. It was reported that there was no financial assistance from government to any of the
10 A Survey of Schools in Juba
November 2013
private schools. In the past, we were told, many private schools, particularly those run by
churches, were assisted by government. “Government-Aided” schools (Government of South
Sudan (GoSS), 2011), was the term used for schools where government supplied and paid for
teachers (Goldsmith, 2010). However, this policy and practice has stopped, we were told. No
private schools (of any management type) indicated that they were financially assisted by
government now. However we heard of schools which had been given pupils’ books through the
government.
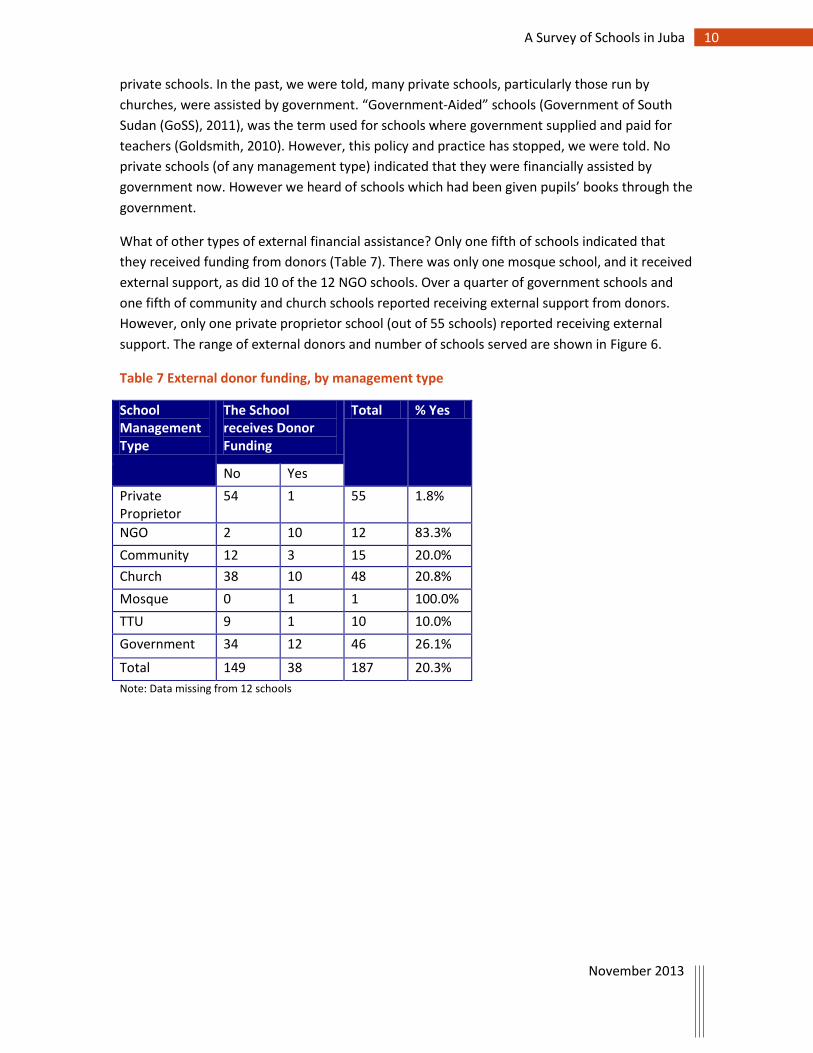
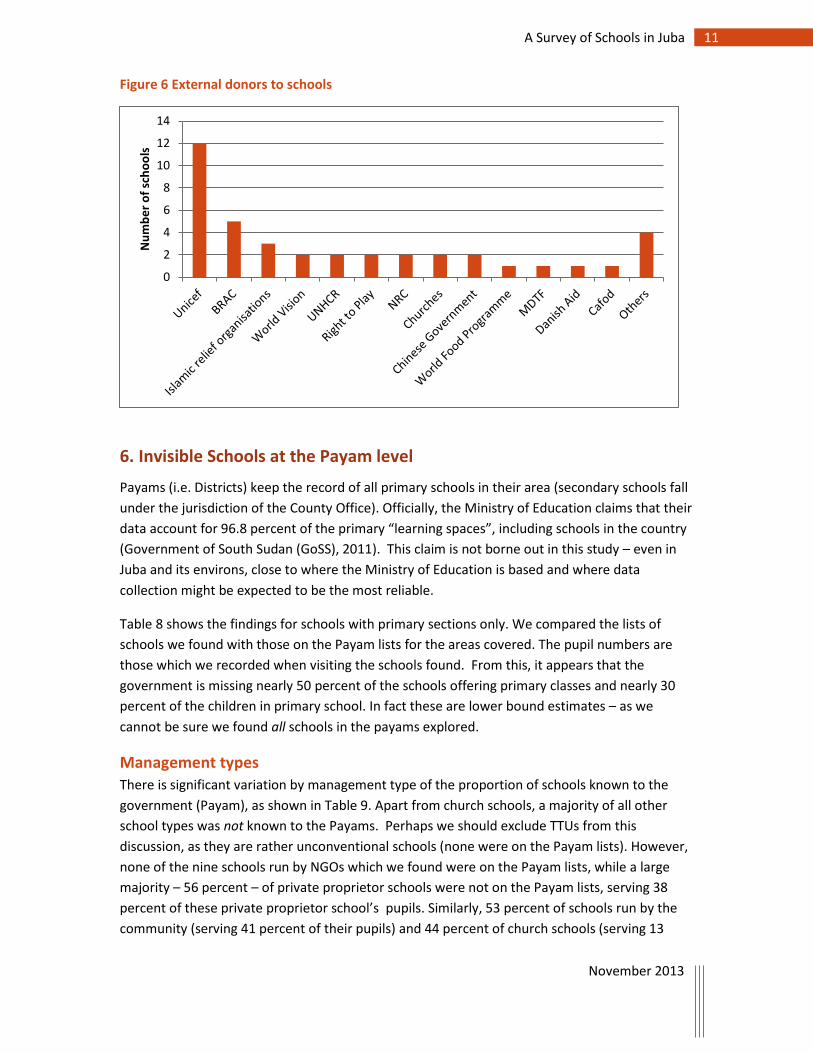
What of other types of external financial assistance? Only one fifth of schools indicated that
they received funding from donors (Table 7). There was only one mosque school, and it received
external support, as did 10 of the 12 NGO schools. Over a quarter of government schools and
one fifth of community and church schools reported receiving external support from donors.
However, only one private proprietor school (out of 55 schools) reported receiving external
support. The range of external donors and number of schools served are shown in Figure 6.
Table 7 External donor funding, by management type
School Management Type
The School receives Donor Funding
Total % Yes
No Yes
Private Proprietor
54 1 55 1.8%
NGO 2 10 12 83.3%
Community 12 3 15 20.0%
Church 38 10 48 20.8%
Mosque 0 1 1 100.0%
TTU 9 1 10 10.0%
Government 34 12 46 26.1%
Total 149 38 187 20.3%
Note: Data missing from 12 schools
11 A Survey of Schools in Juba
November 2013
Figure 6 External donors to schools
6. Invisible Schools at the Payam level
Payams (i.e. Districts) keep the record of all primary schools in their area (secondary schools fall
under the jurisdiction of the County Office). Officially, the Ministry of Education claims that their
data account for 96.8 percent of the primary “learning spaces”, including schools in the country
(Government of South Sudan (GoSS), 2011). This claim is not borne out in this study – even in
Juba and its environs, close to where the Ministry of Education is based and where data
collection might be expected to be the most reliable.
Table 8 shows the findings for schools with primary sections only. We compared the lists of
schools we found with those on the Payam lists for the areas covered. The pupil numbers are
those which we recorded when visiting the schools found. From this, it appears that the
government is missing nearly 50 percent of the schools offering primary classes and nearly 30
percent of the children in primary school. In fact these are lower bound estimates – as we
cannot be sure we found all schools in the payams explored.
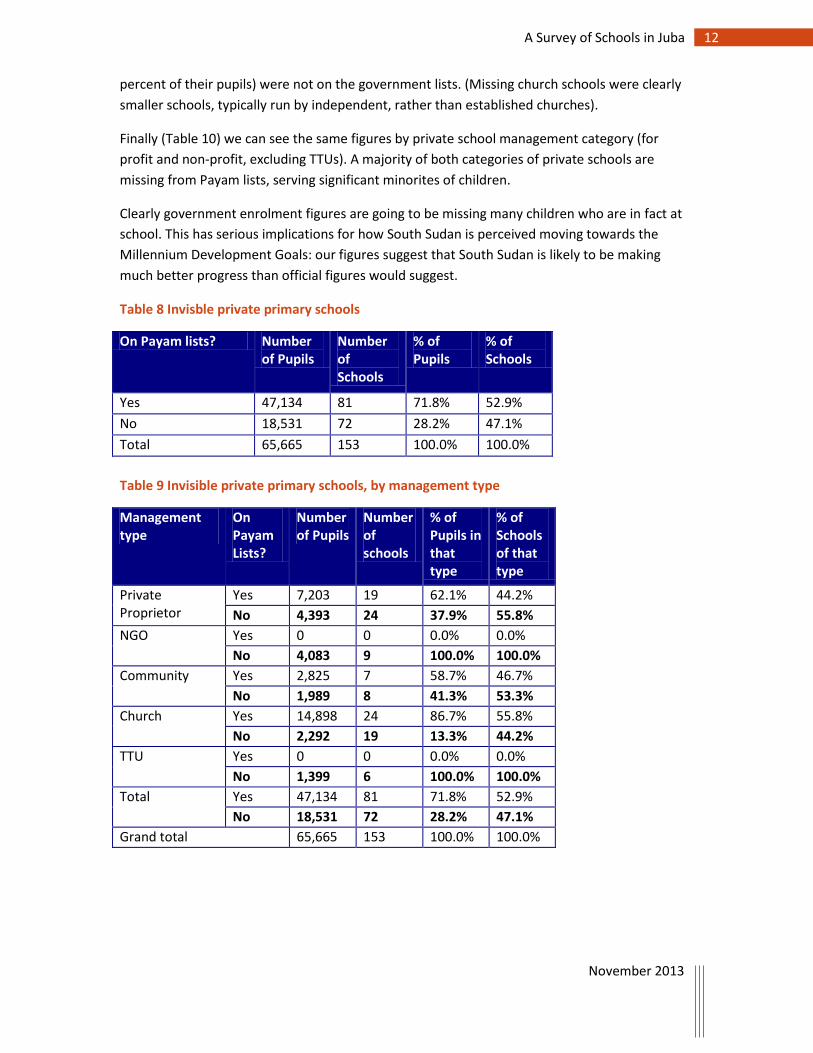
Management types
There is significant variation by management type of the proportion of schools known to the
government (Payam), as shown in Table 9. Apart from church schools, a majority of all other
school types was not known to the Payams. Perhaps we should exclude TTUs from this
discussion, as they are rather unconventional schools (none were on the Payam lists). However,
none of the nine schools run by NGOs which we found were on the Payam lists, while a large
majority – 56 percent – of private proprietor schools were not on the Payam lists, serving 38
percent of these private proprietor school’s pupils. Similarly, 53 percent of schools run by the
community (serving 41 percent of their pupils) and 44 percent of church schools (serving 13
0
2
4
6
8
10
12
14
Nu
mb
er
of
sch
oo
ls
12 A Survey of Schools in Juba
November 2013
percent of their pupils) were not on the government lists. (Missing church schools were clearly
smaller schools, typically run by independent, rather than established churches).
Finally (Table 10) we can see the same figures by private school management category (for
profit and non-profit, excluding TTUs). A majority of both categories of private schools are
missing from Payam lists, serving significant minorites of children.
Clearly government enrolment figures are going to be missing many children who are in fact at
school. This has serious implications for how South Sudan is perceived moving towards the
Millennium Development Goals: our figures suggest that South Sudan is likely to be making
much better progress than official figures would suggest.
Table 8 Invisble private primary schools
On Payam lists? Number of Pupils
Number of Schools
% of Pupils
% of Schools
Yes 47,134 81 71.8% 52.9%
No 18,531 72 28.2% 47.1%
Total 65,665 153 100.0% 100.0%
Table 9 Invisible private primary schools, by management type
Management type
On Payam Lists?
Number of Pupils
Number of schools
% of Pupils in that type
% of Schools of that type
Private Proprietor
Yes 7,203 19 62.1% 44.2%
No 4,393 24 37.9% 55.8%
NGO Yes 0 0 0.0% 0.0%
No 4,083 9 100.0% 100.0%
Community Yes 2,825 7 58.7% 46.7%
No 1,989 8 41.3% 53.3%
Church Yes 14,898 24 86.7% 55.8%
No 2,292 19 13.3% 44.2%
TTU Yes 0 0 0.0% 0.0%
No 1,399 6 100.0% 100.0%
Total Yes 47,134 81 71.8% 52.9%
No 18,531 72 28.2% 47.1%
Grand total 65,665 153 100.0% 100.0%
13 A Survey of Schools in Juba
November 2013
Table 10 Invisible primary schools, by management category
Management type
On Payam List?
Number of Pupils
Number of schools
% of Pupils in that type
% of Schools of that type
For profit Yes 7,203 19 62.1% 44.2%
No 4,393 24 37.9% 55.8%
Non-profit Yes 17,723 31 67.9% 46.3%
No 8,364 36 32.1% 53.7% Note: All private schools excluding TTUs
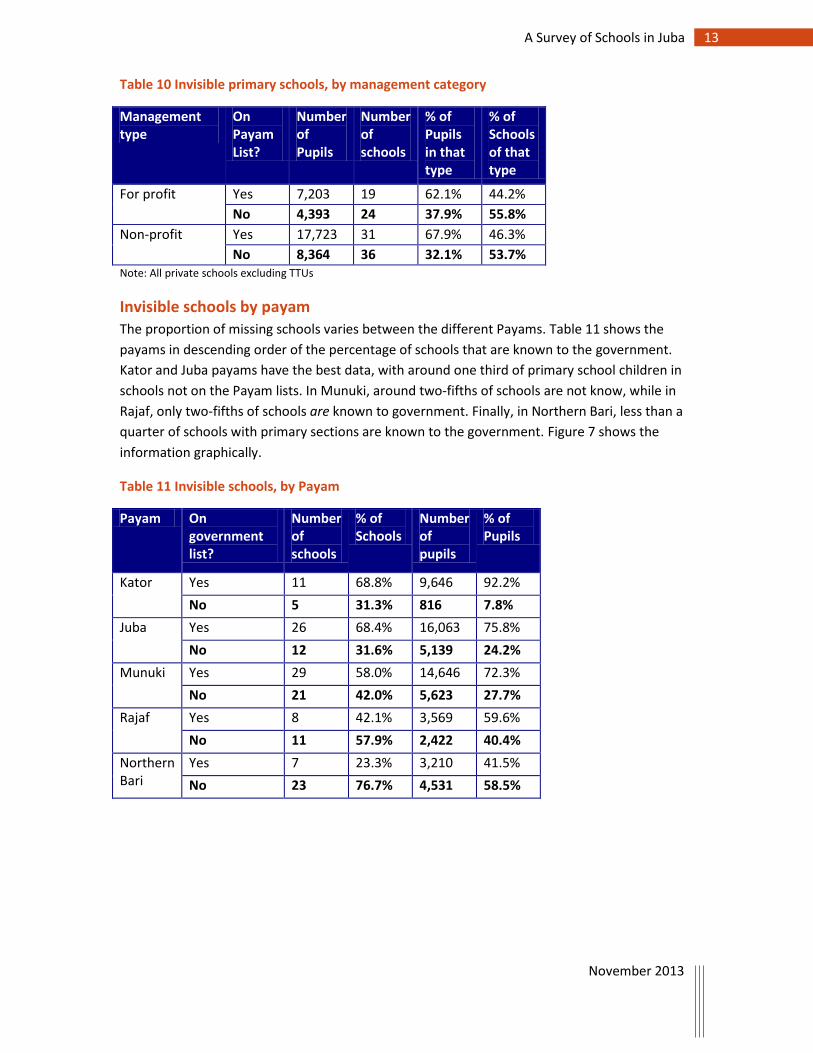
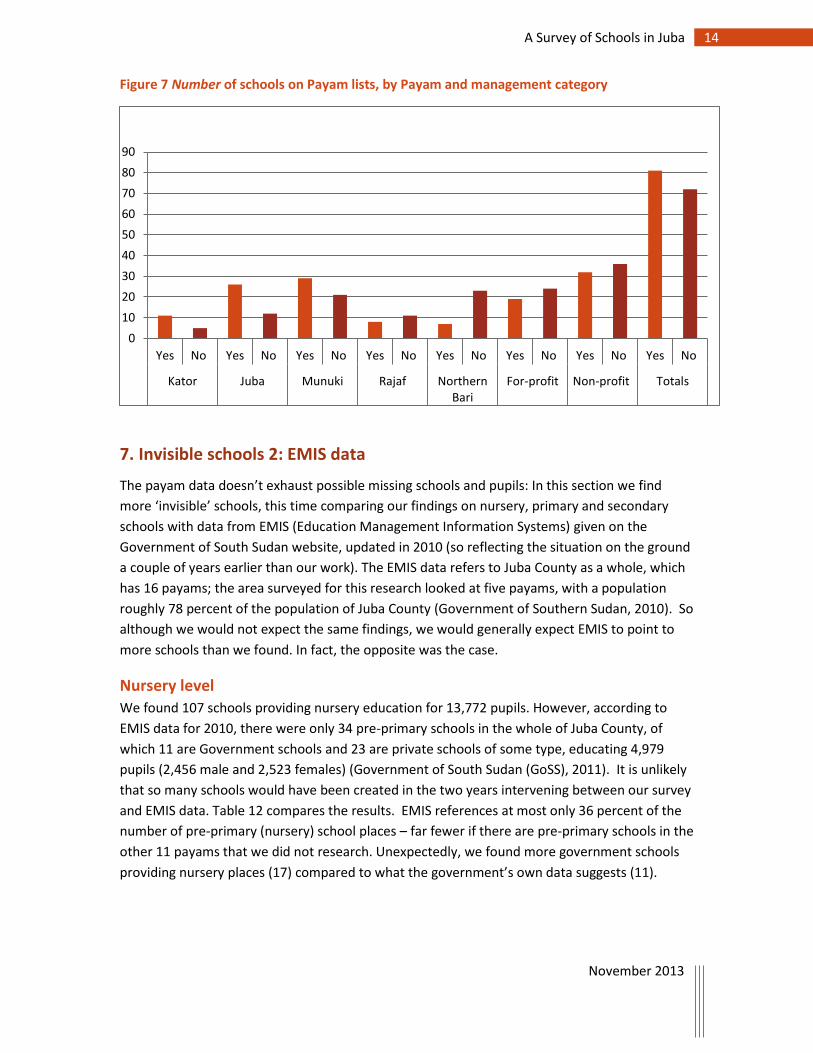
Invisible schools by payam
The proportion of missing schools varies between the different Payams. Table 11 shows the
payams in descending order of the percentage of schools that are known to the government.
Kator and Juba payams have the best data, with around one third of primary school children in
schools not on the Payam lists. In Munuki, around two-fifths of schools are not know, while in
Rajaf, only two-fifths of schools are known to government. Finally, in Northern Bari, less than a
quarter of schools with primary sections are known to the government. Figure 7 shows the
information graphically.
Table 11 Invisible schools, by Payam
Payam On government list?
Number of schools
% of Schools
Number of pupils
% of Pupils
Kator Yes 11 68.8% 9,646 92.2%
No 5 31.3% 816 7.8%
Juba Yes 26 68.4% 16,063 75.8%
No 12 31.6% 5,139 24.2%
Munuki Yes 29 58.0% 14,646 72.3%
No 21 42.0% 5,623 27.7%
Rajaf Yes 8 42.1% 3,569 59.6%
No 11 57.9% 2,422 40.4%
Northern Bari
Yes 7 23.3% 3,210 41.5%
No 23 76.7% 4,531 58.5%
14 A Survey of Schools in Juba
November 2013
Figure 7 Number of schools on Payam lists, by Payam and management category
7. Invisible schools 2: EMIS data
The payam data doesn’t exhaust possible missing schools and pupils: In this section we find
more ‘invisible’ schools, this time comparing our findings on nursery, primary and secondary
schools with data from EMIS (Education Management Information Systems) given on the
Government of South Sudan website, updated in 2010 (so reflecting the situation on the ground
a couple of years earlier than our work). The EMIS data refers to Juba County as a whole, which
has 16 payams; the area surveyed for this research looked at five payams, with a population
roughly 78 percent of the population of Juba County (Government of Southern Sudan, 2010). So
although we would not expect the same findings, we would generally expect EMIS to point to
more schools than we found. In fact, the opposite was the case.
Nursery level We found 107 schools providing nursery education for 13,772 pupils. However, according to
EMIS data for 2010, there were only 34 pre-primary schools in the whole of Juba County, of
which 11 are Government schools and 23 are private schools of some type, educating 4,979
pupils (2,456 male and 2,523 females) (Government of South Sudan (GoSS), 2011). It is unlikely
that so many schools would have been created in the two years intervening between our survey
and EMIS data. Table 12 compares the results. EMIS references at most only 36 percent of the
number of pre-primary (nursery) school places – far fewer if there are pre-primary schools in the
other 11 payams that we did not research. Unexpectedly, we found more government schools
providing nursery places (17) compared to what the government’s own data suggests (11).
0
10
20
30
40
50
60
70
80
90
Yes No Yes No Yes No Yes No Yes No Yes No Yes No Yes No
Kator Juba Munuki Rajaf NorthernBari
For-profit Non-profit Totals
15 A Survey of Schools in Juba
November 2013
Table 12 Pre-Primary Provision (EMIS data and Survey data)
EMIS data for Juba County (2010)
Survey data for 5 payams in Juba city area (2012)
Percentage EMIS/Survey
Schools Total 34 107 31.8%
Government 11 17 64.7%
Private 23 90 25.6%
Pupils Total 4,979 13,772 36.2%
Male 2,456 6,828 36.0%
Female 2,523 6,826 37.0%
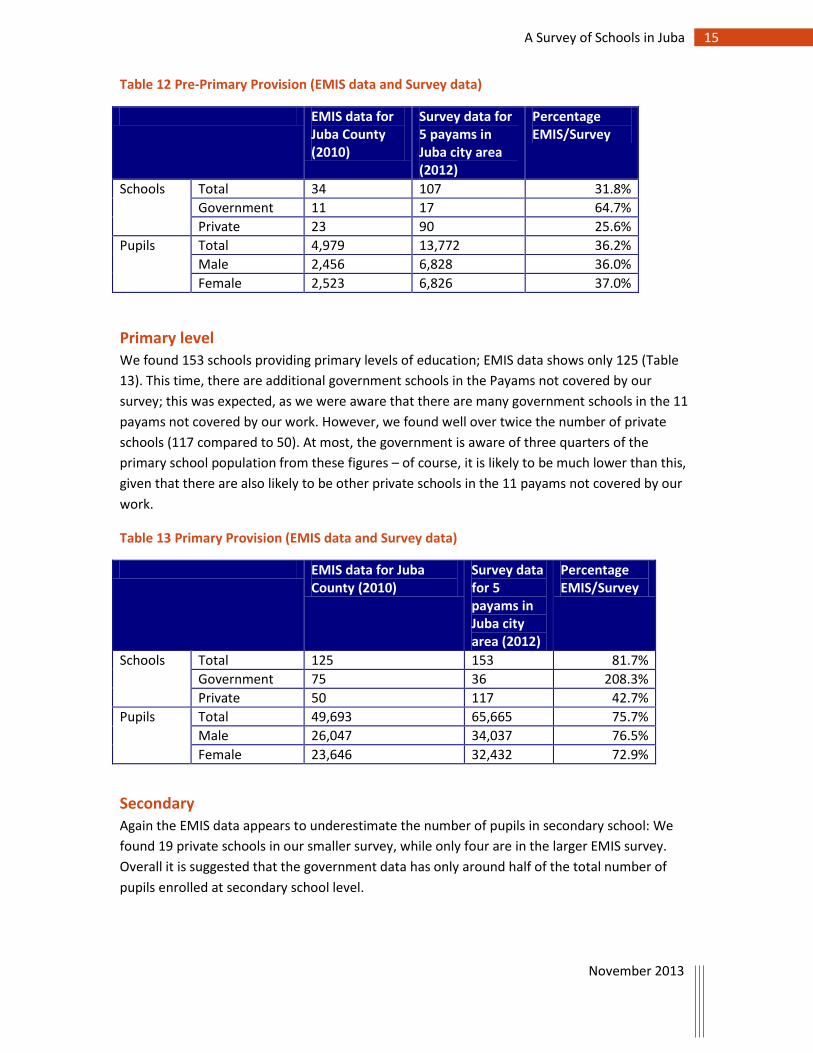
Primary level
We found 153 schools providing primary levels of education; EMIS data shows only 125 (Table
13). This time, there are additional government schools in the Payams not covered by our
survey; this was expected, as we were aware that there are many government schools in the 11
payams not covered by our work. However, we found well over twice the number of private
schools (117 compared to 50). At most, the government is aware of three quarters of the
primary school population from these figures – of course, it is likely to be much lower than this,
given that there are also likely to be other private schools in the 11 payams not covered by our
work.
Table 13 Primary Provision (EMIS data and Survey data)
EMIS data for Juba County (2010)
Survey data for 5 payams in Juba city area (2012)
Percentage EMIS/Survey
Schools Total 125 153 81.7%
Government 75 36 208.3%
Private 50 117 42.7%
Pupils Total 49,693 65,665 75.7%
Male 26,047 34,037 76.5%
Female 23,646 32,432 72.9%
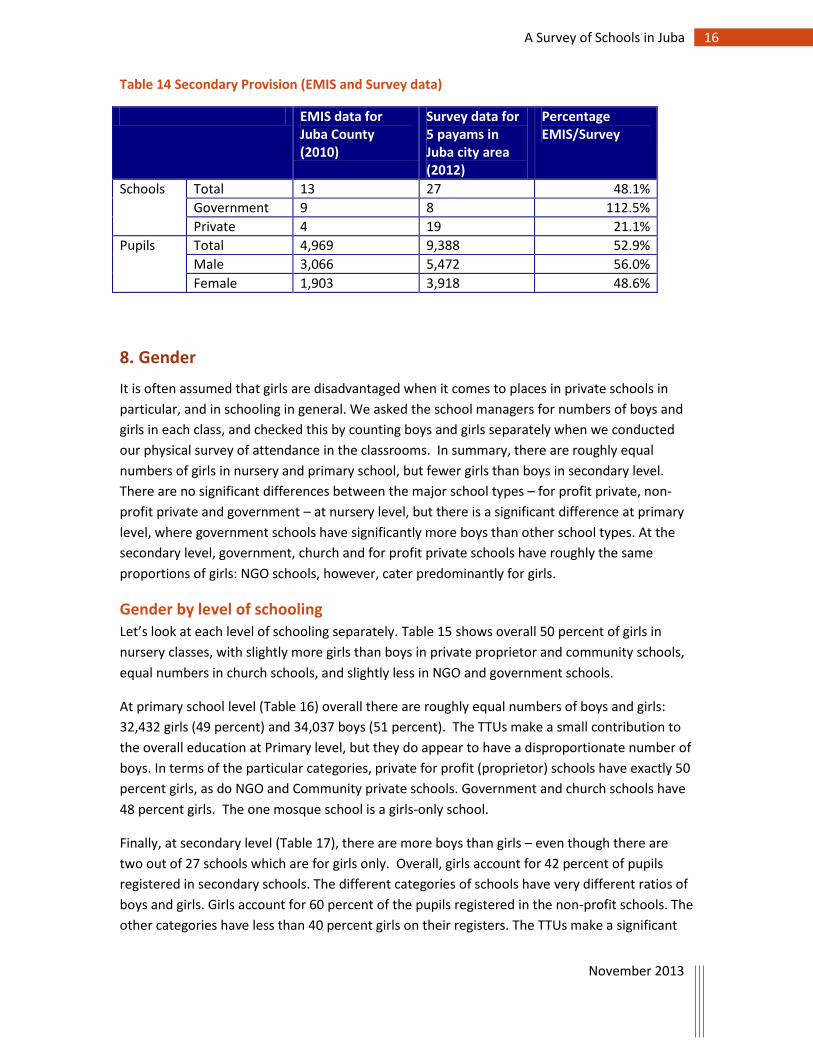
Secondary
Again the EMIS data appears to underestimate the number of pupils in secondary school: We
found 19 private schools in our smaller survey, while only four are in the larger EMIS survey.
Overall it is suggested that the government data has only around half of the total number of
pupils enrolled at secondary school level.
16 A Survey of Schools in Juba
November 2013
Table 14 Secondary Provision (EMIS and Survey data)
EMIS data for Juba County (2010)
Survey data for 5 payams in Juba city area (2012)
Percentage EMIS/Survey
Schools Total 13 27 48.1%
Government 9 8 112.5%
Private 4 19 21.1%
Pupils Total 4,969 9,388 52.9%
Male 3,066 5,472 56.0%
Female 1,903 3,918 48.6%
8. Gender
It is often assumed that girls are disadvantaged when it comes to places in private schools in
particular, and in schooling in general. We asked the school managers for numbers of boys and
girls in each class, and checked this by counting boys and girls separately when we conducted
our physical survey of attendance in the classrooms. In summary, there are roughly equal
numbers of girls in nursery and primary school, but fewer girls than boys in secondary level.
There are no significant differences between the major school types – for profit private, non-
profit private and government – at nursery level, but there is a significant difference at primary
level, where government schools have significantly more boys than other school types. At the
secondary level, government, church and for profit private schools have roughly the same
proportions of girls: NGO schools, however, cater predominantly for girls.
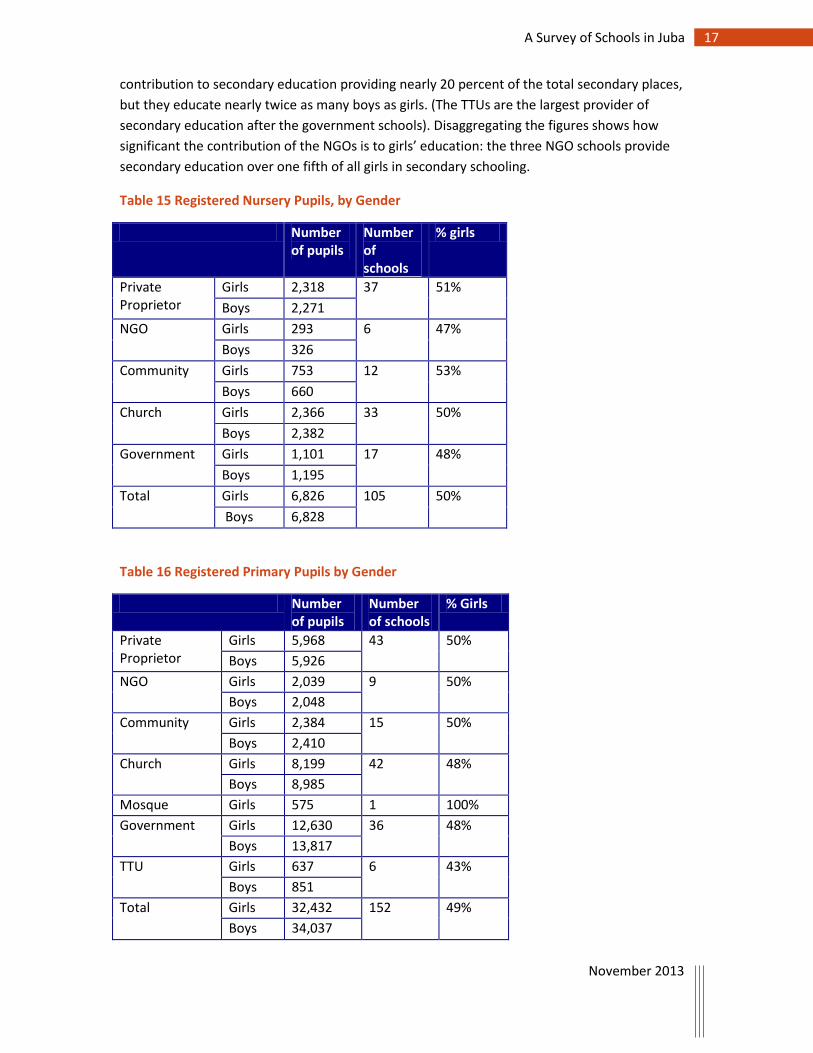
Gender by level of schooling
Let’s look at each level of schooling separately. Table 15 shows overall 50 percent of girls in
nursery classes, with slightly more girls than boys in private proprietor and community schools,
equal numbers in church schools, and slightly less in NGO and government schools.
At primary school level (Table 16) overall there are roughly equal numbers of boys and girls:
32,432 girls (49 percent) and 34,037 boys (51 percent). The TTUs make a small contribution to
the overall education at Primary level, but they do appear to have a disproportionate number of
boys. In terms of the particular categories, private for profit (proprietor) schools have exactly 50
percent girls, as do NGO and Community private schools. Government and church schools have
48 percent girls. The one mosque school is a girls-only school.
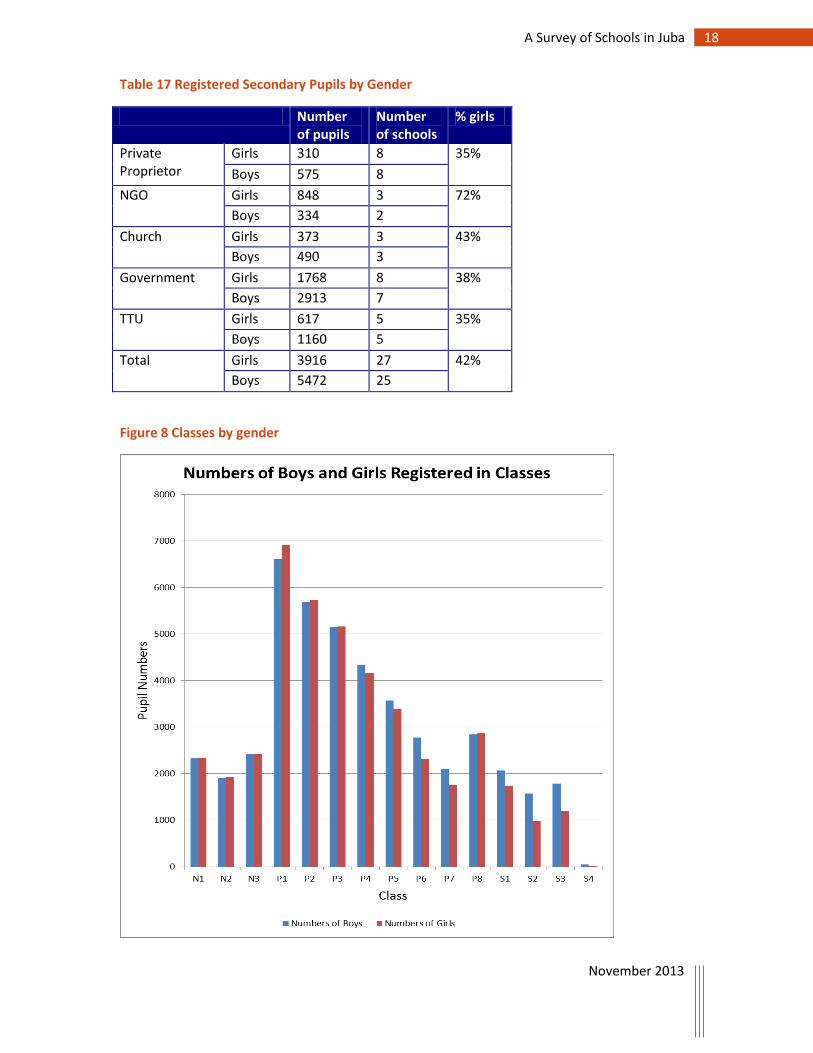
Finally, at secondary level (Table 17), there are more boys than girls – even though there are
two out of 27 schools which are for girls only. Overall, girls account for 42 percent of pupils
registered in secondary schools. The different categories of schools have very different ratios of
boys and girls. Girls account for 60 percent of the pupils registered in the non-profit schools. The
other categories have less than 40 percent girls on their registers. The TTUs make a significant
17 A Survey of Schools in Juba
November 2013
contribution to secondary education providing nearly 20 percent of the total secondary places,
but they educate nearly twice as many boys as girls. (The TTUs are the largest provider of
secondary education after the government schools). Disaggregating the figures shows how
significant the contribution of the NGOs is to girls’ education: the three NGO schools provide
secondary education over one fifth of all girls in secondary schooling.
Table 15 Registered Nursery Pupils, by Gender
Number of pupils
Number of schools
% girls
Private Proprietor
Girls 2,318 37 51%
Boys 2,271
NGO Girls 293 6 47%
Boys 326
Community Girls 753 12 53%
Boys 660
Church Girls 2,366 33 50%
Boys 2,382
Government Girls 1,101 17 48%
Boys 1,195
Total Girls 6,826 105 50%
Boys 6,828
Table 16 Registered Primary Pupils by Gender
Number of pupils
Number of schools
% Girls
Private Proprietor
Girls 5,968 43 50%
Boys 5,926
NGO Girls 2,039 9 50%
Boys 2,048
Community Girls 2,384 15 50%
Boys 2,410
Church Girls 8,199 42 48%
Boys 8,985
Mosque Girls 575 1 100%
Government Girls 12,630 36 48%
Boys 13,817
TTU Girls 637 6 43%
Boys 851
Total Girls 32,432 152 49%
Boys 34,037
18 A Survey of Schools in Juba
November 2013
Table 17 Registered Secondary Pupils by Gender
Number of pupils
Number of schools
% girls
Private Proprietor
Girls 310 8 35%
Boys 575 8
NGO Girls 848 3 72%
Boys 334 2
Church Girls 373 3 43%
Boys 490 3
Government Girls 1768 8 38%
Boys 2913 7
TTU Girls 617 5 35%
Boys 1160 5
Total Girls 3916 27 42%
Boys 5472 25
Figure 8 Classes by gender
19 A Survey of Schools in Juba
November 2013
Gender by classes
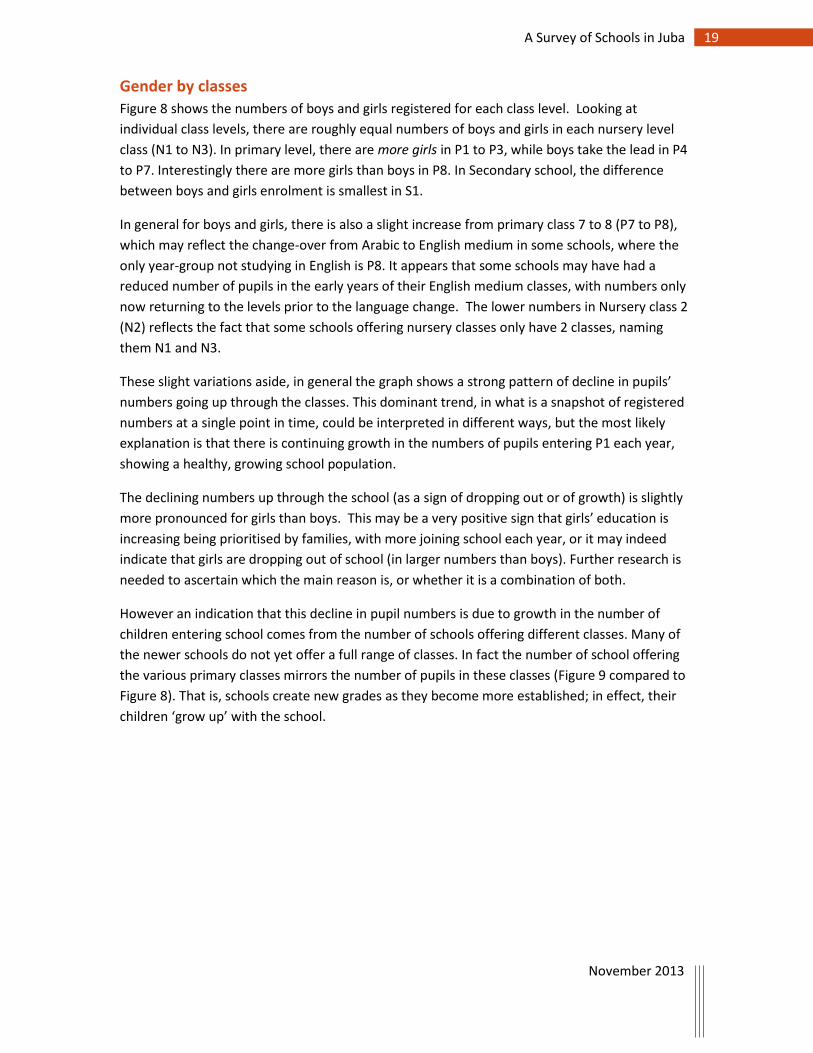
Figure 8 shows the numbers of boys and girls registered for each class level. Looking at
individual class levels, there are roughly equal numbers of boys and girls in each nursery level
class (N1 to N3). In primary level, there are more girls in P1 to P3, while boys take the lead in P4
to P7. Interestingly there are more girls than boys in P8. In Secondary school, the difference
between boys and girls enrolment is smallest in S1.
In general for boys and girls, there is also a slight increase from primary class 7 to 8 (P7 to P8),
which may reflect the change-over from Arabic to English medium in some schools, where the
only year-group not studying in English is P8. It appears that some schools may have had a
reduced number of pupils in the early years of their English medium classes, with numbers only
now returning to the levels prior to the language change. The lower numbers in Nursery class 2
(N2) reflects the fact that some schools offering nursery classes only have 2 classes, naming
them N1 and N3.
These slight variations aside, in general the graph shows a strong pattern of decline in pupils’
numbers going up through the classes. This dominant trend, in what is a snapshot of registered
numbers at a single point in time, could be interpreted in different ways, but the most likely
explanation is that there is continuing growth in the numbers of pupils entering P1 each year,
showing a healthy, growing school population.
The declining numbers up through the school (as a sign of dropping out or of growth) is slightly
more pronounced for girls than boys. This may be a very positive sign that girls’ education is
increasing being prioritised by families, with more joining school each year, or it may indeed
indicate that girls are dropping out of school (in larger numbers than boys). Further research is
needed to ascertain which the main reason is, or whether it is a combination of both.
However an indication that this decline in pupil numbers is due to growth in the number of
children entering school comes from the number of schools offering different classes. Many of
the newer schools do not yet offer a full range of classes. In fact the number of school offering
the various primary classes mirrors the number of pupils in these classes (Figure 9 compared to
Figure 8). That is, schools create new grades as they become more established; in effect, their
children ‘grow up’ with the school.
20 A Survey of Schools in Juba
November 2013
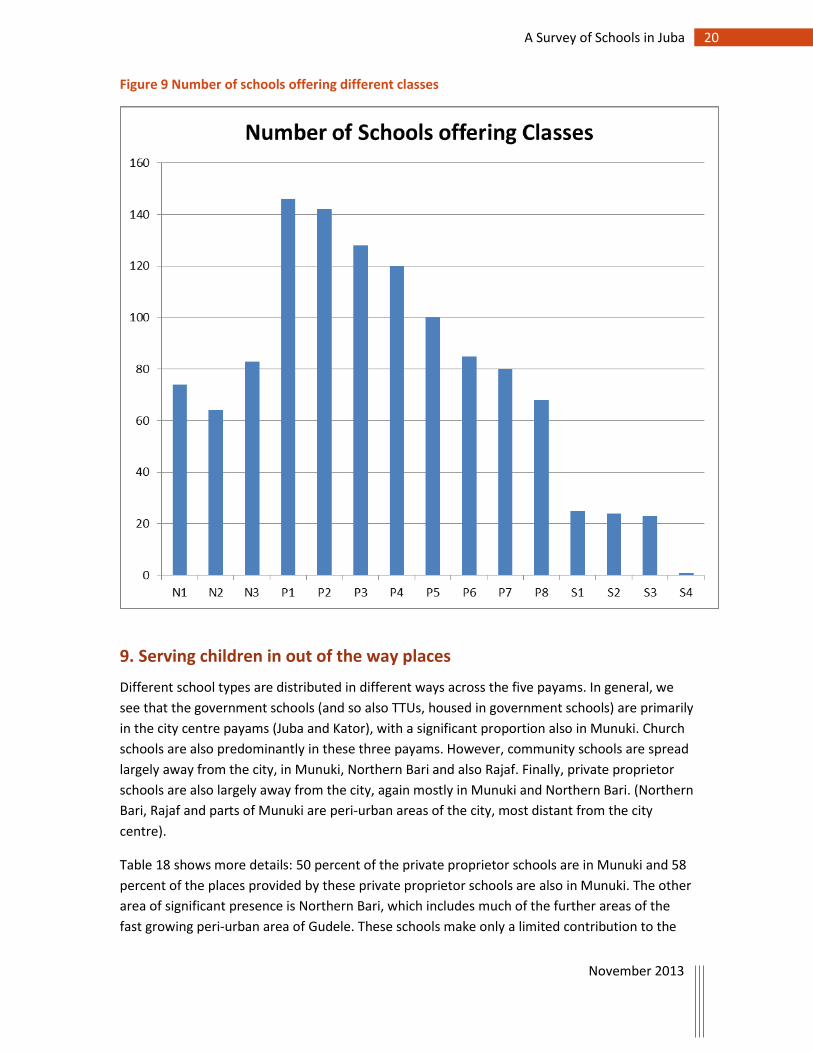
Figure 9 Number of schools offering different classes
9. Serving children in out of the way places
Different school types are distributed in different ways across the five payams. In general, we
see that the government schools (and so also TTUs, housed in government schools) are primarily
in the city centre payams (Juba and Kator), with a significant proportion also in Munuki. Church
schools are also predominantly in these three payams. However, community schools are spread
largely away from the city, in Munuki, Northern Bari and also Rajaf. Finally, private proprietor
schools are also largely away from the city, again mostly in Munuki and Northern Bari. (Northern
Bari, Rajaf and parts of Munuki are peri-urban areas of the city, most distant from the city
centre).
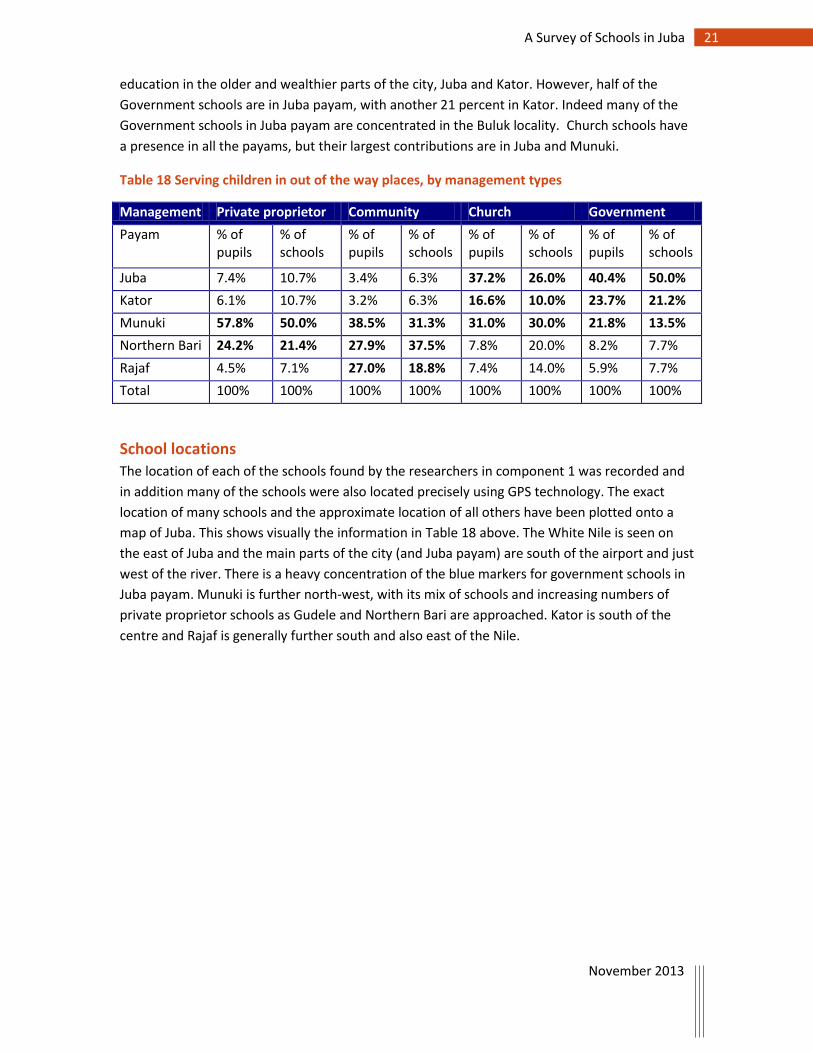
Table 18 shows more details: 50 percent of the private proprietor schools are in Munuki and 58
percent of the places provided by these private proprietor schools are also in Munuki. The other
area of significant presence is Northern Bari, which includes much of the further areas of the
fast growing peri-urban area of Gudele. These schools make only a limited contribution to the
21 A Survey of Schools in Juba
November 2013
education in the older and wealthier parts of the city, Juba and Kator. However, half of the
Government schools are in Juba payam, with another 21 percent in Kator. Indeed many of the
Government schools in Juba payam are concentrated in the Buluk locality. Church schools have
a presence in all the payams, but their largest contributions are in Juba and Munuki.
Table 18 Serving children in out of the way places, by management types
Management Private proprietor Community Church Government
Payam % of pupils
% of schools
% of pupils
% of schools
% of pupils
% of schools
% of pupils
% of schools
Juba 7.4% 10.7% 3.4% 6.3% 37.2% 26.0% 40.4% 50.0%
Kator 6.1% 10.7% 3.2% 6.3% 16.6% 10.0% 23.7% 21.2%
Munuki 57.8% 50.0% 38.5% 31.3% 31.0% 30.0% 21.8% 13.5%
Northern Bari 24.2% 21.4% 27.9% 37.5% 7.8% 20.0% 8.2% 7.7%
Rajaf 4.5% 7.1% 27.0% 18.8% 7.4% 14.0% 5.9% 7.7%
Total 100% 100% 100% 100% 100% 100% 100% 100%
School locations
The location of each of the schools found by the researchers in component 1 was recorded and
in addition many of the schools were also located precisely using GPS technology. The exact
location of many schools and the approximate location of all others have been plotted onto a
map of Juba. This shows visually the information in Table 18 above. The White Nile is seen on
the east of Juba and the main parts of the city (and Juba payam) are south of the airport and just
west of the river. There is a heavy concentration of the blue markers for government schools in
Juba payam. Munuki is further north-west, with its mix of schools and increasing numbers of
private proprietor schools as Gudele and Northern Bari are approached. Kator is south of the
centre and Rajaf is generally further south and also east of the Nile.
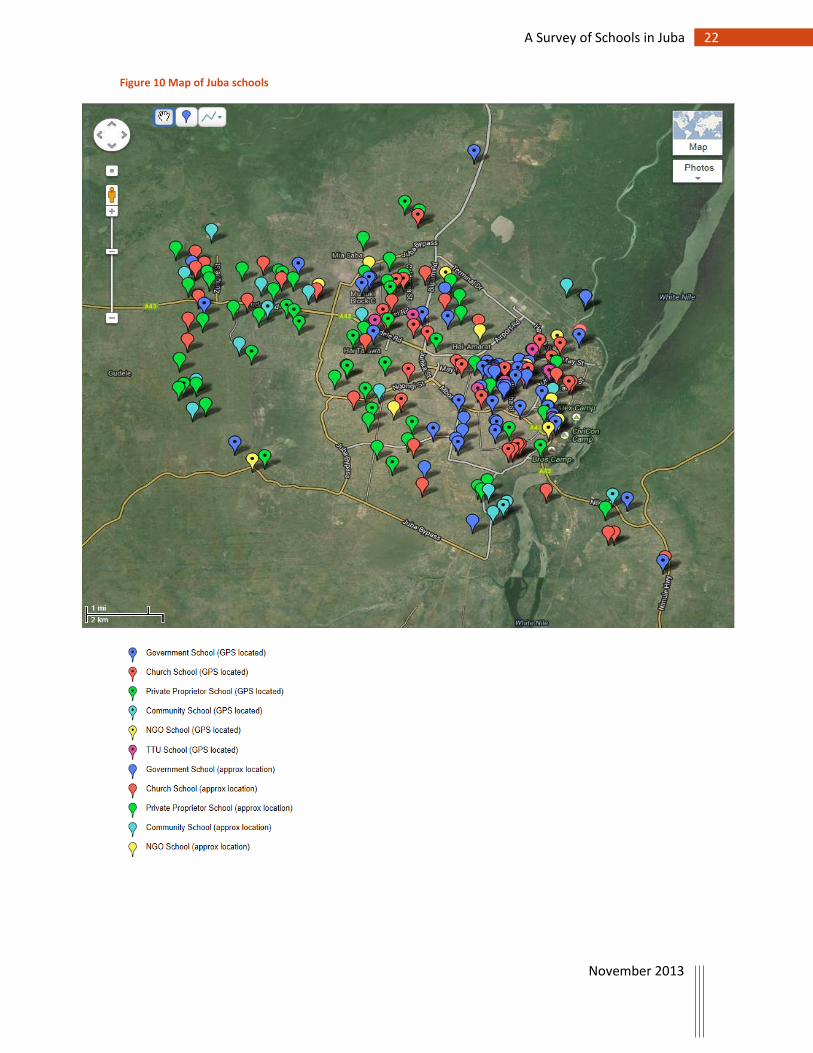
22 A Survey of Schools in Juba
November 2013
Figure 10 Map of Juba schools
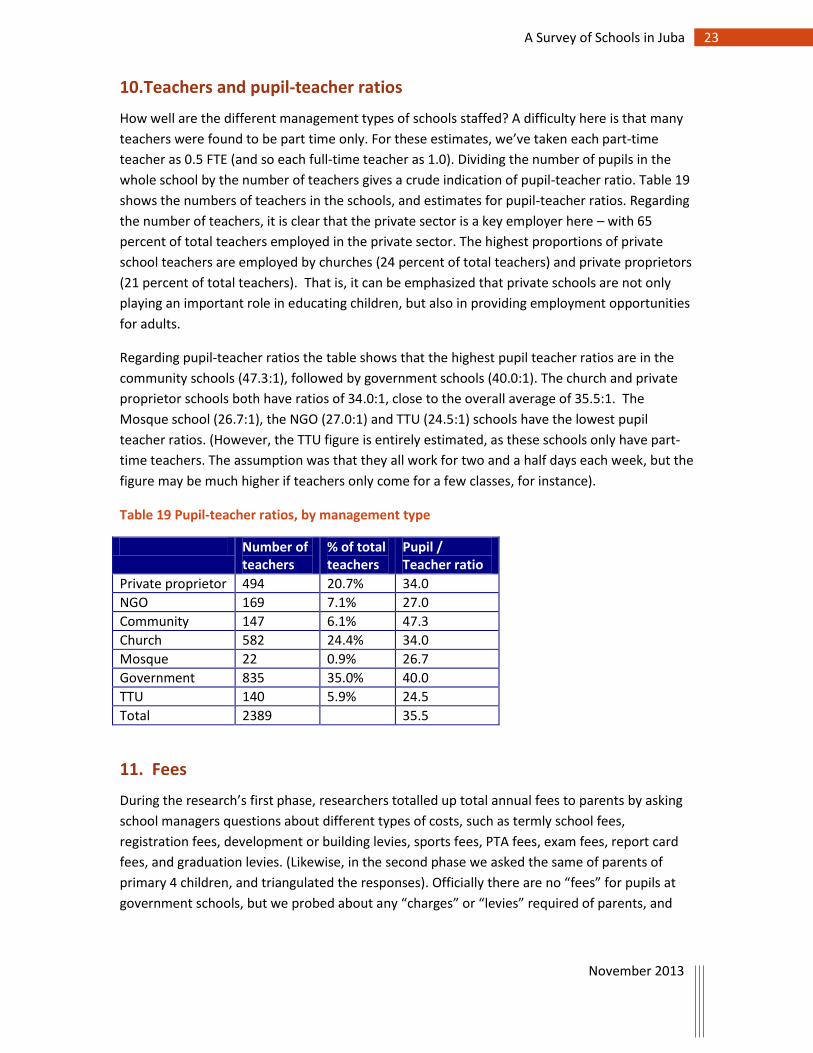
23 A Survey of Schools in Juba
November 2013
10. Teachers and pupil-teacher ratios
How well are the different management types of schools staffed? A difficulty here is that many
teachers were found to be part time only. For these estimates, we’ve taken each part-time
teacher as 0.5 FTE (and so each full-time teacher as 1.0). Dividing the number of pupils in the
whole school by the number of teachers gives a crude indication of pupil-teacher ratio. Table 19
shows the numbers of teachers in the schools, and estimates for pupil-teacher ratios. Regarding
the number of teachers, it is clear that the private sector is a key employer here – with 65
percent of total teachers employed in the private sector. The highest proportions of private
school teachers are employed by churches (24 percent of total teachers) and private proprietors
(21 percent of total teachers). That is, it can be emphasized that private schools are not only
playing an important role in educating children, but also in providing employment opportunities
for adults.
Regarding pupil-teacher ratios the table shows that the highest pupil teacher ratios are in the
community schools (47.3:1), followed by government schools (40.0:1). The church and private
proprietor schools both have ratios of 34.0:1, close to the overall average of 35.5:1. The
Mosque school (26.7:1), the NGO (27.0:1) and TTU (24.5:1) schools have the lowest pupil
teacher ratios. (However, the TTU figure is entirely estimated, as these schools only have part-
time teachers. The assumption was that they all work for two and a half days each week, but the
figure may be much higher if teachers only come for a few classes, for instance).
Table 19 Pupil-teacher ratios, by management type
Number of teachers
% of total teachers
Pupil / Teacher ratio
Private proprietor 494 20.7% 34.0
NGO 169 7.1% 27.0
Community 147 6.1% 47.3
Church 582 24.4% 34.0
Mosque 22 0.9% 26.7
Government 835 35.0% 40.0
TTU 140 5.9% 24.5
Total 2389 35.5
11. Fees
During the research’s first phase, researchers totalled up total annual fees to parents by asking
school managers questions about different types of costs, such as termly school fees,
registration fees, development or building levies, sports fees, PTA fees, exam fees, report card
fees, and graduation levies. (Likewise, in the second phase we asked the same of parents of
primary 4 children, and triangulated the responses). Officially there are no “fees” for pupils at
government schools, but we probed about any “charges” or “levies” required of parents, and
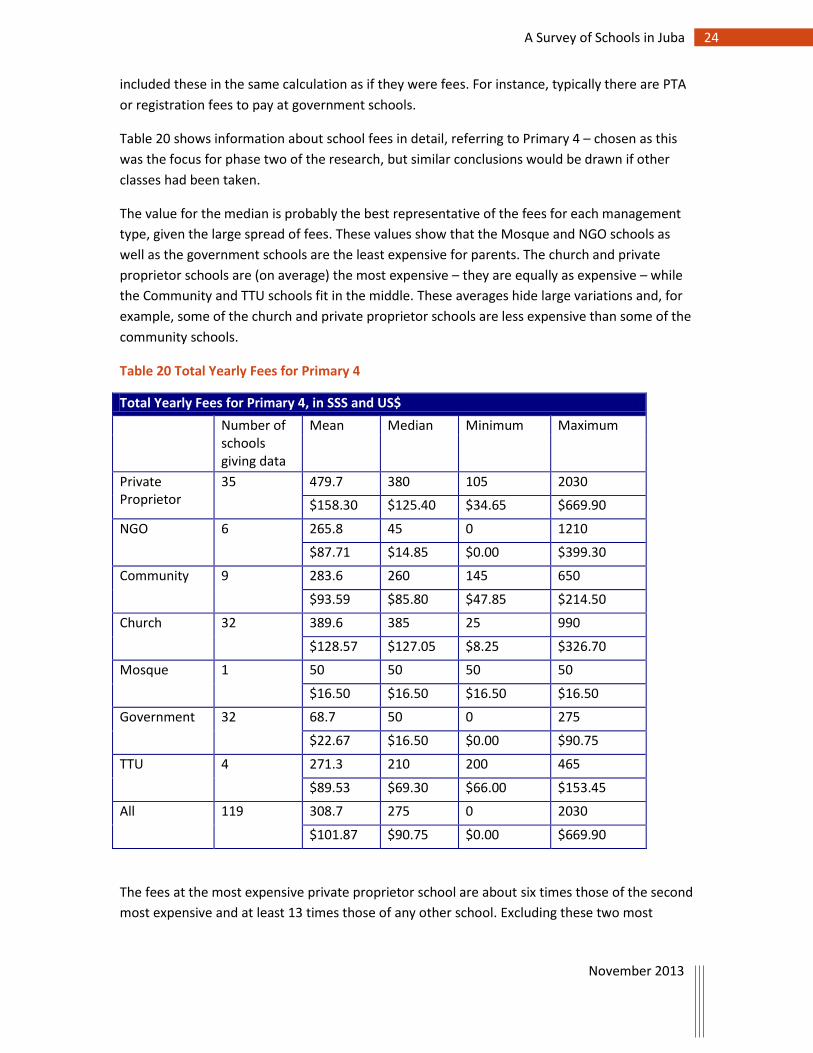
24 A Survey of Schools in Juba
November 2013
included these in the same calculation as if they were fees. For instance, typically there are PTA
or registration fees to pay at government schools.
Table 20 shows information about school fees in detail, referring to Primary 4 – chosen as this
was the focus for phase two of the research, but similar conclusions would be drawn if other
classes had been taken.
The value for the median is probably the best representative of the fees for each management
type, given the large spread of fees. These values show that the Mosque and NGO schools as
well as the government schools are the least expensive for parents. The church and private
proprietor schools are (on average) the most expensive – they are equally as expensive – while
the Community and TTU schools fit in the middle. These averages hide large variations and, for
example, some of the church and private proprietor schools are less expensive than some of the
community schools.
Table 20 Total Yearly Fees for Primary 4
Total Yearly Fees for Primary 4, in SSS and US$
Number of schools giving data
Mean Median Minimum Maximum
Private Proprietor
35 479.7 380 105 2030
$158.30 $125.40 $34.65 $669.90
NGO 6 265.8 45 0 1210
$87.71 $14.85 $0.00 $399.30
Community 9 283.6 260 145 650
$93.59 $85.80 $47.85 $214.50
Church 32 389.6 385 25 990
$128.57 $127.05 $8.25 $326.70
Mosque 1 50 50 50 50
$16.50 $16.50 $16.50 $16.50
Government 32 68.7 50 0 275
$22.67 $16.50 $0.00 $90.75
TTU 4 271.3 210 200 465
$89.53 $69.30 $66.00 $153.45
All 119 308.7 275 0 2030
$101.87 $90.75 $0.00 $669.90
The fees at the most expensive private proprietor school are about six times those of the second
most expensive and at least 13 times those of any other school. Excluding these two most
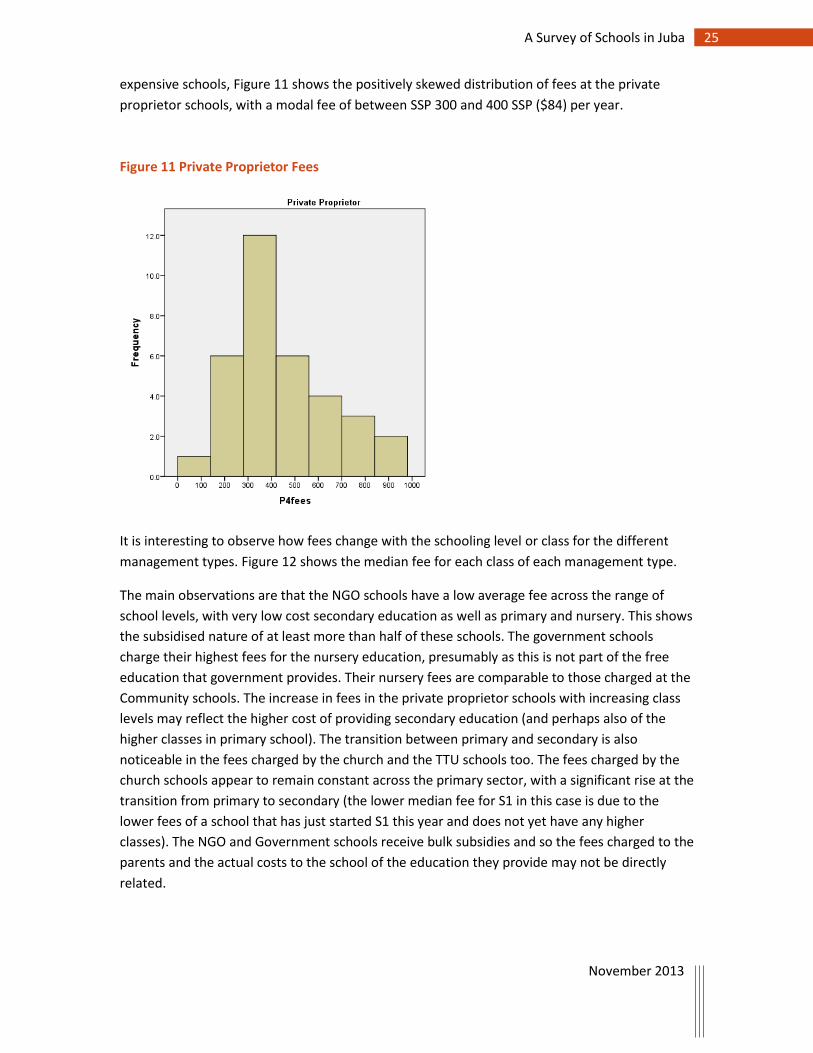
25 A Survey of Schools in Juba
November 2013
expensive schools, Figure 11 shows the positively skewed distribution of fees at the private
proprietor schools, with a modal fee of between SSP 300 and 400 SSP ($84) per year.
Figure 11 Private Proprietor Fees
It is interesting to observe how fees change with the schooling level or class for the different
management types. Figure 12 shows the median fee for each class of each management type.
The main observations are that the NGO schools have a low average fee across the range of
school levels, with very low cost secondary education as well as primary and nursery. This shows
the subsidised nature of at least more than half of these schools. The government schools
charge their highest fees for the nursery education, presumably as this is not part of the free
education that government provides. Their nursery fees are comparable to those charged at the
Community schools. The increase in fees in the private proprietor schools with increasing class
levels may reflect the higher cost of providing secondary education (and perhaps also of the
higher classes in primary school). The transition between primary and secondary is also
noticeable in the fees charged by the church and the TTU schools too. The fees charged by the
church schools appear to remain constant across the primary sector, with a significant rise at the
transition from primary to secondary (the lower median fee for S1 in this case is due to the
lower fees of a school that has just started S1 this year and does not yet have any higher
classes). The NGO and Government schools receive bulk subsidies and so the fees charged to the
parents and the actual costs to the school of the education they provide may not be directly
related.
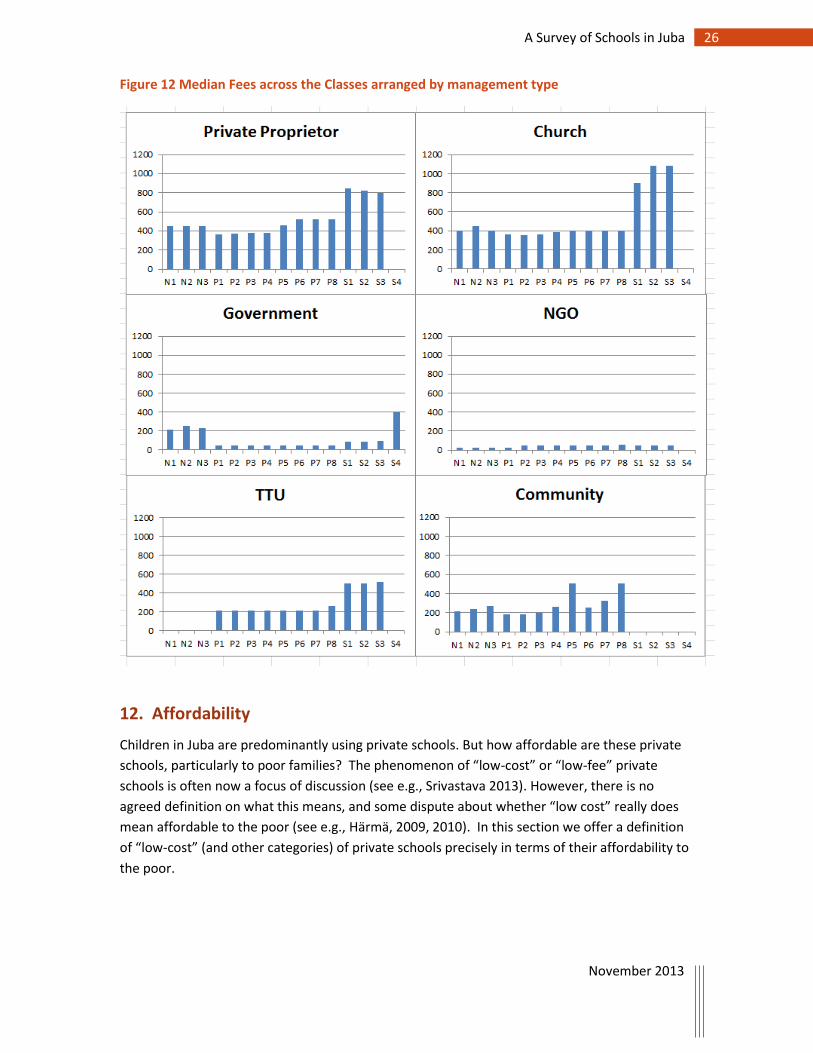
26 A Survey of Schools in Juba
November 2013
Figure 12 Median Fees across the Classes arranged by management type
12. Affordability
Children in Juba are predominantly using private schools. But how affordable are these private
schools, particularly to poor families? The phenomenon of “low-cost” or “low-fee” private
schools is often now a focus of discussion (see e.g., Srivastava 2013). However, there is no
agreed definition on what this means, and some dispute about whether “low cost” really does
mean affordable to the poor (see e.g., Härmä, 2009, 2010). In this section we offer a definition
of “low-cost” (and other categories) of private schools precisely in terms of their affordability to
the poor.
27 A Survey of Schools in Juba
November 2013
Defining “Low-cost” private schools
To explore affordability we require a recognised poverty line, the average family size for a family
with school-going children and the proportion of income that a poor family could afford to
spend on school fees.
Regarding poverty line, we could use the standard poverty line of $1.25 per person per day, (at
2005 exchange rate and purchasing power parity, PPP). Converted to South Sudan Pounds (SSP)
in 2012 this is SSP 4.70 per person per day, but we were wary of using this figure as its
calculation involves inflation rates for Sudan and South Sudan over periods before and after
independence as well as two currency changes. Fortunately a more recent local poverty line has
been calculated, used in the 2009 National Baseline Household Survey (Southern Sudan Centre
for Census Statistics and Evaluation, 2010). The figure used here was 72.9 SDG per person per
month (South Sudan National Bureau of Statistics, 2012). When this is adjusted for inflation
using figures from the World Bank for the period between 2009 and 2012 and the currency is
changed to South Sudan pounds it gives a figure of SSP 4.96 per person per day. This figure was
very close to the one we calculated (SSP 4.70) using the $1.25 poverty line, as noted above, so
we are comfortable that either figure represents a realistic poverty line to use in the research.
One approach to family size is to use the data from the 5th Sudan Population and Housing
Census (Government of Southern Sudan, 2010). This gives a dependency ratio of 75 percent,
meaning that a family on average has three children with four adults. Some of these children are
likely to be below school age. The age pyramid given in the Census, and regarding children from
5 to 15 as school-going, suggests that there would be two school-age children, one other child
and four adults in the average family of seven (Government of Southern Sudan, 2010).
Alternatively, the figures from the population pyramid would suggest that there are two
children of school age (5 to 15) for each ten members of the population, but this may not reflect
the reality for families with children in primary schools. The final approach is to use the data
from our own Phase 2 research, as reported in Chapters 14 and onwards below. Here we
collected information about the number of siblings as well as boys, girls, men and women in the
pupil’s family. If we assume that the words “boys” and “girls” are synonymous with children of
school age or below and men and women are older people in the home, we can make an
estimate of the number of school-age children in a household and the total number of family
members. The results using either the 5% trimmed mean (to avoid extreme values like 38
siblings etc.) or the median numbers of boys, girls, men and women, and again taking the
number of school aged children as about 11/16 of the total children, it gives a figure of six
children in a household of ten, i.e., four school aged children in a household with four adults and
two pre-school children.
These are the figures we use in our calculations: SSP 4.96 per person per day as the poverty line,
and an “average family” of ten with four of these individuals at school, i.e. 40 percent of the
family group are in school. (This is a higher percentage, and therefore a lower fee boundary,
than would be were the two children from seven people figures used (29% of the family group
28 A Survey of Schools in Juba
November 2013
in school) or the 75% dependency ratio, so we are comfortable we are looking at the ‘most
extreme’ possible situation).
It has been suggested that a maximum of around 10 percent of family income of the poor could
or should be spent on school fees (Lewin, 2007), a figure that we will use in our calculation here.
That is, if total schooling costs for all of a family’s children come to around 10 percent of total
family income, then this will be considered affordable for that family.
The figure of SSP 4.96 per person per day amounts to SSP 18,104 per family (of 10) per year (see
Table 22). Allowing 10 percent for school fees and spreading that across the four children gives
SSP 452.6 available for each child’s school fees. This is therefore set as the upper boundary for
the very low cost school fee category. As this is so close to the value that would be found using
$1.25 PPP (as noted above, which we have used in our other studies), it is consistent to use the
values that correspond to $2 and $4 as the upper boundaries for the low cost and medium cost
school fee categories.
Hence, schools charging around SSP 450 for total fees, we’ll define as “very low cost” schools.
They are affordable by families on the poverty line. Many private schools charge lower than this
and so these are affordable by families below the poverty line.
Similarly, for a family living on $2.00 per person per day (PPP, 2005 exchange rate), still
considered poor by the international development community, then the corresponding
calculation gives an amount available to the family of SSP 27,467 for annual school fees for all
children or SSP 687 per child. Hence school fees of SSP 690 we will define as “low cost” private
schools.
At the “middle class” level of $4.00 per person per day (PPP, 2005 exchange rate), the same
calculation gives an amount for school fees of SSP 1,374. Hence schools between SSP 690 and
SSP 1, 370 we define as “medium cost” private schools, while those with total fees above SSP
1,370 per annum we define as “high cost” private schools.
Official statistics report that 36 percent of the population of Juba County are under the poverty
line (South Sudan National Bureau of Statistics, 2012), it may be argued that if the fees of most
of the very low cost schools are near the upper boundary of 450 SSP per year, then they may be
out of reach for nearly a third of the population. However, this is not likely to affect the
discussion here, as the proportion of poor in urban areas is lower, at one in four (Southern
Sudan Centre for Census Statistics and Evaluation, 2010), and the pupils in the study are all from
urban or peri-urban areas.
To confirm how many schools are within reach of the poorest of the poor, it was decided in this
case to look at an ultra-low fee category. This is based on 39 SDG, which is reported to be the
average consumption figure for those who are below the poverty line of 72.9 SDG per month
(Southern Sudan Centre for Census Statistics and Evaluation, 2010). This is updated to SSP 2.65
per person in 2012. Using the same family size and parallel calculations to the above (as in Table
22) gives an ultra-low school fee level of SSP 242 per child per year.
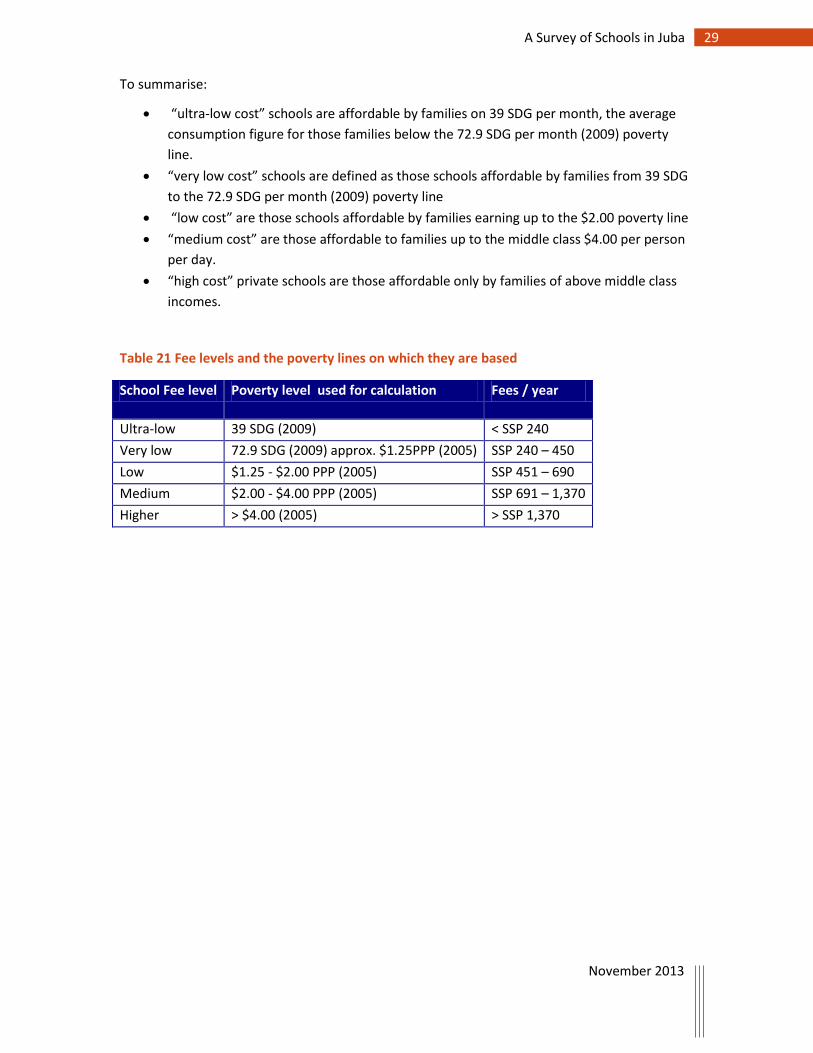
29 A Survey of Schools in Juba
November 2013
To summarise:
“ultra-low cost” schools are affordable by families on 39 SDG per month, the average
consumption figure for those families below the 72.9 SDG per month (2009) poverty
line.
“very low cost” schools are defined as those schools affordable by families from 39 SDG
to the 72.9 SDG per month (2009) poverty line
“low cost” are those schools affordable by families earning up to the $2.00 poverty line
“medium cost” are those affordable to families up to the middle class $4.00 per person
per day.
“high cost” private schools are those affordable only by families of above middle class
incomes.
Table 21 Fee levels and the poverty lines on which they are based
School Fee level Poverty level used for calculation Fees / year
Ultra-low 39 SDG (2009) < SSP 240
Very low 72.9 SDG (2009) approx. $1.25PPP (2005) SSP 240 – 450
Low $1.25 - $2.00 PPP (2005) SSP 451 – 690
Medium $2.00 - $4.00 PPP (2005) SSP 691 – 1,370
Higher > $4.00 (2005) > SSP 1,370
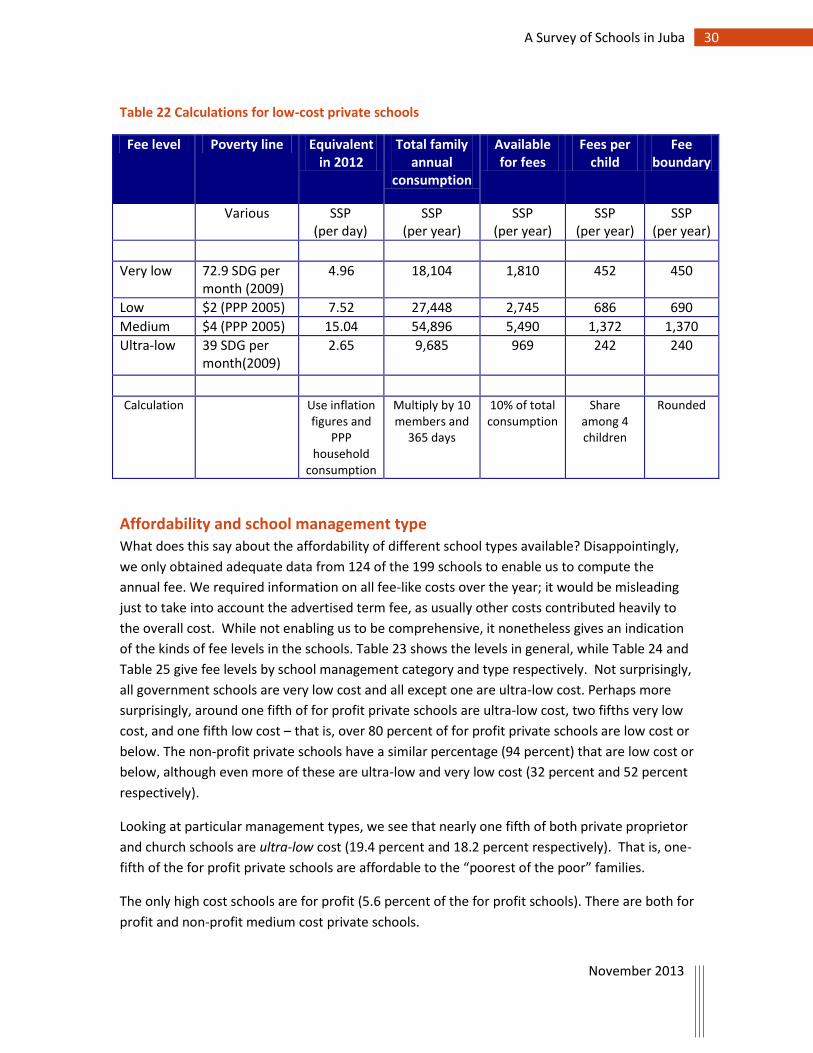
30 A Survey of Schools in Juba
November 2013
Table 22 Calculations for low-cost private schools
Fee level Poverty line Equivalent in 2012
Total family annual
consumption
Available for fees
Fees per child
Fee boundary
Various SSP (per day)
SSP (per year)
SSP (per year)
SSP (per year)
SSP (per year)
Very low 72.9 SDG per month (2009)
4.96 18,104 1,810 452 450
Low $2 (PPP 2005) 7.52 27,448 2,745 686 690
Medium $4 (PPP 2005) 15.04 54,896 5,490 1,372 1,370
Ultra-low 39 SDG per month(2009)
2.65 9,685 969 242 240
Calculation Use inflation figures and
PPP household
consumption
Multiply by 10 members and
365 days
10% of total consumption
Share among 4 children
Rounded
Affordability and school management type
What does this say about the affordability of different school types available? Disappointingly,
we only obtained adequate data from 124 of the 199 schools to enable us to compute the
annual fee. We required information on all fee-like costs over the year; it would be misleading
just to take into account the advertised term fee, as usually other costs contributed heavily to
the overall cost. While not enabling us to be comprehensive, it nonetheless gives an indication
of the kinds of fee levels in the schools. Table 23 shows the levels in general, while Table 24 and
Table 25 give fee levels by school management category and type respectively. Not surprisingly,
all government schools are very low cost and all except one are ultra-low cost. Perhaps more
surprisingly, around one fifth of for profit private schools are ultra-low cost, two fifths very low
cost, and one fifth low cost – that is, over 80 percent of for profit private schools are low cost or
below. The non-profit private schools have a similar percentage (94 percent) that are low cost or
below, although even more of these are ultra-low and very low cost (32 percent and 52 percent
respectively).
Looking at particular management types, we see that nearly one fifth of both private proprietor
and church schools are ultra-low cost (19.4 percent and 18.2 percent respectively). That is, one-
fifth of the for profit private schools are affordable to the “poorest of the poor” families.
The only high cost schools are for profit (5.6 percent of the for profit schools). There are both for
profit and non-profit medium cost private schools.
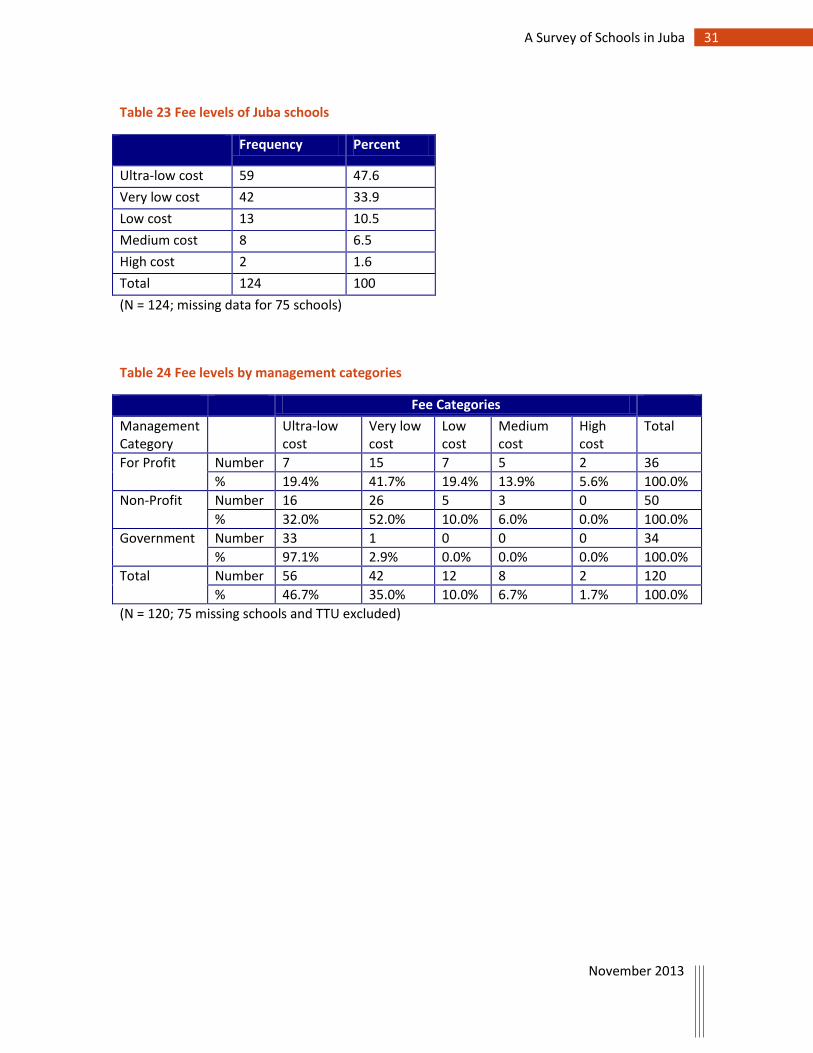
31 A Survey of Schools in Juba
November 2013
Table 23 Fee levels of Juba schools
Frequency Percent
Ultra-low cost 59 47.6
Very low cost 42 33.9
Low cost 13 10.5
Medium cost 8 6.5
High cost 2 1.6
Total 124 100
(N = 124; missing data for 75 schools)
Table 24 Fee levels by management categories
Fee Categories
Management Category
Ultra-low cost
Very low cost
Low cost
Medium cost
High cost
Total
For Profit Number 7 15 7 5 2 36
% 19.4% 41.7% 19.4% 13.9% 5.6% 100.0%
Non-Profit Number 16 26 5 3 0 50
% 32.0% 52.0% 10.0% 6.0% 0.0% 100.0%
Government Number 33 1 0 0 0 34
% 97.1% 2.9% 0.0% 0.0% 0.0% 100.0%
Total Number 56 42 12 8 2 120
% 46.7% 35.0% 10.0% 6.7% 1.7% 100.0%
(N = 120; 75 missing schools and TTU excluded)
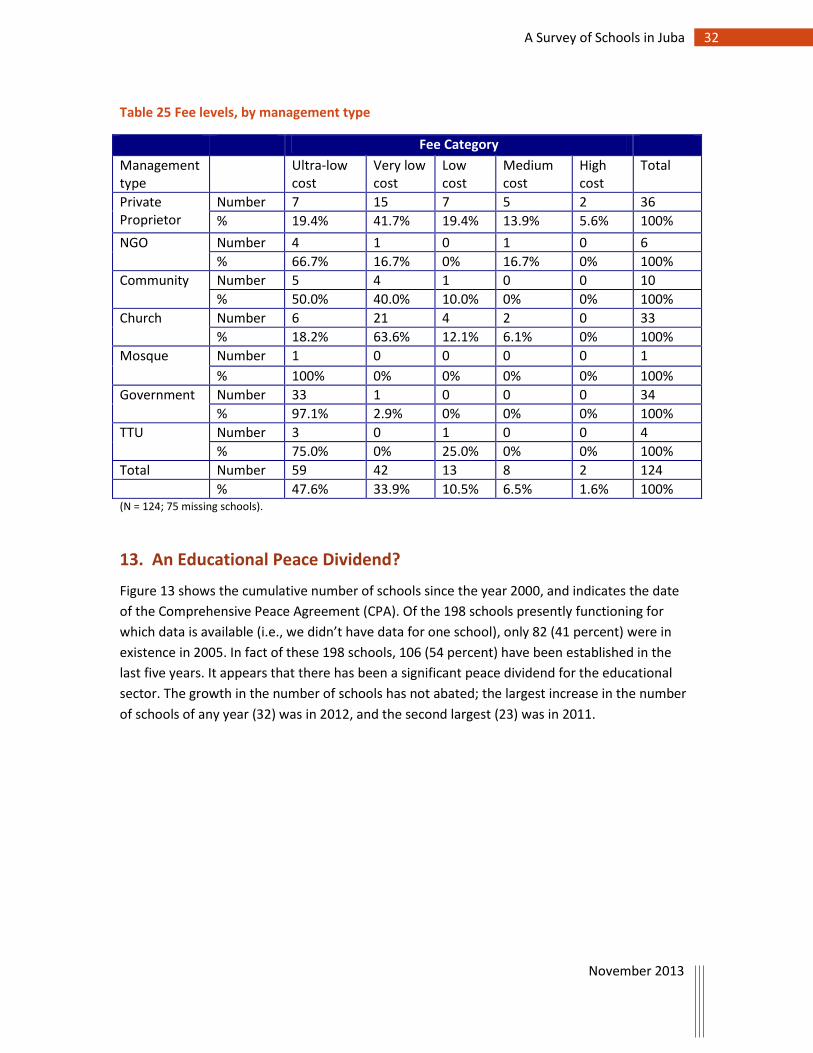
32 A Survey of Schools in Juba
November 2013
Table 25 Fee levels, by management type
Fee Category
Management type
Ultra-low cost
Very low cost
Low cost
Medium cost
High cost
Total
Private Proprietor
Number 7 15 7 5 2 36
% 19.4% 41.7% 19.4% 13.9% 5.6% 100%
NGO Number 4 1 0 1 0 6
% 66.7% 16.7% 0% 16.7% 0% 100%
Community Number 5 4 1 0 0 10
% 50.0% 40.0% 10.0% 0% 0% 100%
Church Number 6 21 4 2 0 33
% 18.2% 63.6% 12.1% 6.1% 0% 100%
Mosque Number 1 0 0 0 0 1
% 100% 0% 0% 0% 0% 100%
Government Number 33 1 0 0 0 34
% 97.1% 2.9% 0% 0% 0% 100%
TTU Number 3 0 1 0 0 4
% 75.0% 0% 25.0% 0% 0% 100%
Total Number 59 42 13 8 2 124
% 47.6% 33.9% 10.5% 6.5% 1.6% 100% (N = 124; 75 missing schools).
13. An Educational Peace Dividend?
Figure 13 shows the cumulative number of schools since the year 2000, and indicates the date
of the Comprehensive Peace Agreement (CPA). Of the 198 schools presently functioning for
which data is available (i.e., we didn’t have data for one school), only 82 (41 percent) were in
existence in 2005. In fact of these 198 schools, 106 (54 percent) have been established in the
last five years. It appears that there has been a significant peace dividend for the educational
sector. The growth in the number of schools has not abated; the largest increase in the number
of schools of any year (32) was in 2012, and the second largest (23) was in 2011.
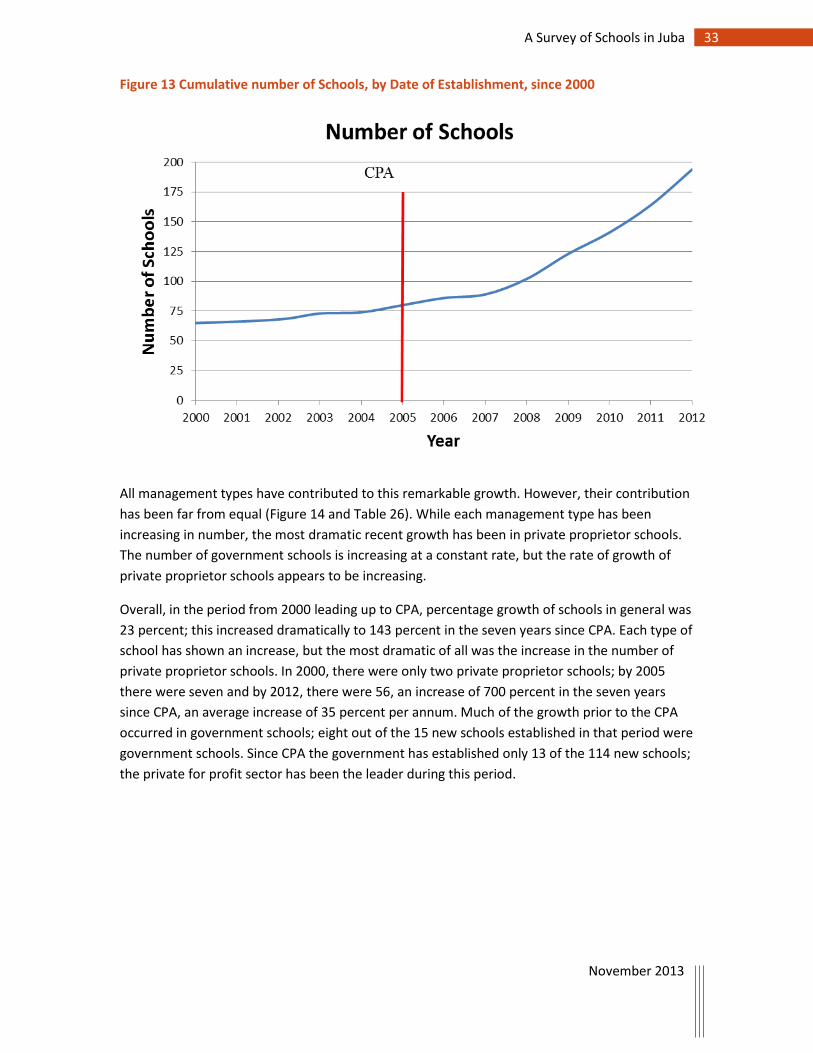
33 A Survey of Schools in Juba
November 2013
Figure 13 Cumulative number of Schools, by Date of Establishment, since 2000
All management types have contributed to this remarkable growth. However, their contribution
has been far from equal (Figure 14 and Table 26). While each management type has been
increasing in number, the most dramatic recent growth has been in private proprietor schools.
The number of government schools is increasing at a constant rate, but the rate of growth of
private proprietor schools appears to be increasing.
Overall, in the period from 2000 leading up to CPA, percentage growth of schools in general was
23 percent; this increased dramatically to 143 percent in the seven years since CPA. Each type of
school has shown an increase, but the most dramatic of all was the increase in the number of
private proprietor schools. In 2000, there were only two private proprietor schools; by 2005
there were seven and by 2012, there were 56, an increase of 700 percent in the seven years
since CPA, an average increase of 35 percent per annum. Much of the growth prior to the CPA
occurred in government schools; eight out of the 15 new schools established in that period were
government schools. Since CPA the government has established only 13 of the 114 new schools;
the private for profit sector has been the leader during this period.
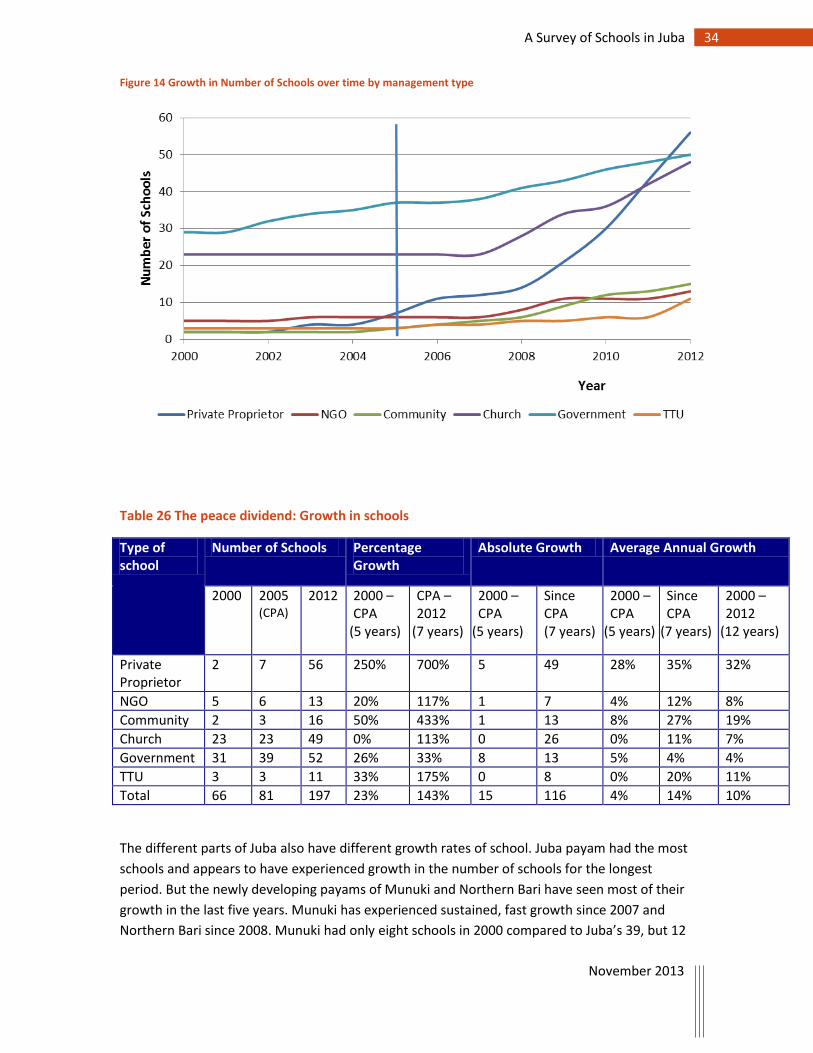
34 A Survey of Schools in Juba
November 2013
Figure 14 Growth in Number of Schools over time by management type
Table 26 The peace dividend: Growth in schools
Type of school
Number of Schools Percentage Growth
Absolute Growth Average Annual Growth
2000 2005 (CPA)
2012 2000 – CPA
(5 years)
CPA – 2012
(7 years)
2000 – CPA
(5 years)
Since CPA (7 years)
2000 – CPA
(5 years)
Since CPA
(7 years)
2000 – 2012
(12 years)
Private Proprietor
2 7 56 250% 700% 5 49 28% 35% 32%
NGO 5 6 13 20% 117% 1 7 4% 12% 8%
Community 2 3 16 50% 433% 1 13 8% 27% 19%
Church 23 23 49 0% 113% 0 26 0% 11% 7%
Government 31 39 52 26% 33% 8 13 5% 4% 4%
TTU 3 3 11 33% 175% 0 8 0% 20% 11%
Total 66 81 197 23% 143% 15 116 4% 14% 10%
The different parts of Juba also have different growth rates of school. Juba payam had the most
schools and appears to have experienced growth in the number of schools for the longest
period. But the newly developing payams of Munuki and Northern Bari have seen most of their
growth in the last five years. Munuki has experienced sustained, fast growth since 2007 and
Northern Bari since 2008. Munuki had only eight schools in 2000 compared to Juba’s 39, but 12
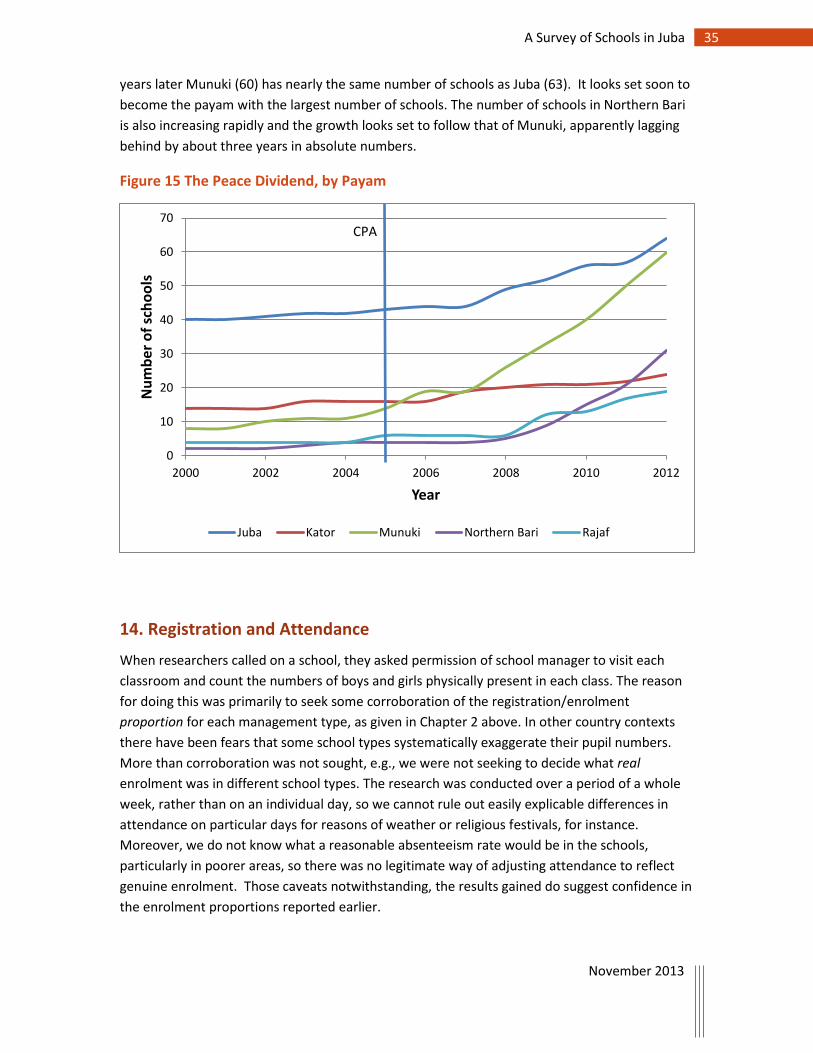
35 A Survey of Schools in Juba
November 2013
years later Munuki (60) has nearly the same number of schools as Juba (63). It looks set soon to
become the payam with the largest number of schools. The number of schools in Northern Bari
is also increasing rapidly and the growth looks set to follow that of Munuki, apparently lagging
behind by about three years in absolute numbers.
Figure 15 The Peace Dividend, by Payam
14. Registration and Attendance
When researchers called on a school, they asked permission of school manager to visit each
classroom and count the numbers of boys and girls physically present in each class. The reason
for doing this was primarily to seek some corroboration of the registration/enrolment
proportion for each management type, as given in Chapter 2 above. In other country contexts
there have been fears that some school types systematically exaggerate their pupil numbers.
More than corroboration was not sought, e.g., we were not seeking to decide what real
enrolment was in different school types. The research was conducted over a period of a whole
week, rather than on an individual day, so we cannot rule out easily explicable differences in
attendance on particular days for reasons of weather or religious festivals, for instance.
Moreover, we do not know what a reasonable absenteeism rate would be in the schools,
particularly in poorer areas, so there was no legitimate way of adjusting attendance to reflect
genuine enrolment. Those caveats notwithstanding, the results gained do suggest confidence in
the enrolment proportions reported earlier.
0
10
20
30
40
50
60
70
2000 2002 2004 2006 2008 2010 2012
Nu
mb
er o
f sc
ho
ols
Year
Juba Kator Munuki Northern Bari Rajaf
CPA
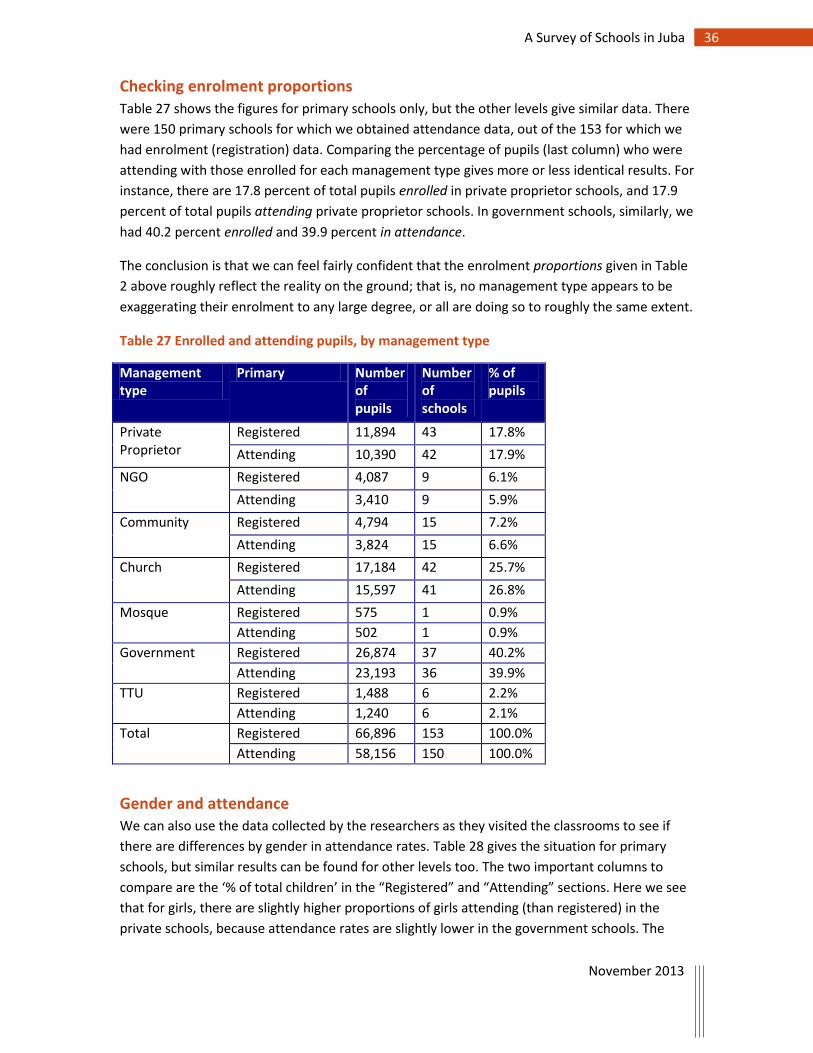
36 A Survey of Schools in Juba
November 2013
Checking enrolment proportions
Table 27 shows the figures for primary schools only, but the other levels give similar data. There
were 150 primary schools for which we obtained attendance data, out of the 153 for which we
had enrolment (registration) data. Comparing the percentage of pupils (last column) who were
attending with those enrolled for each management type gives more or less identical results. For
instance, there are 17.8 percent of total pupils enrolled in private proprietor schools, and 17.9
percent of total pupils attending private proprietor schools. In government schools, similarly, we
had 40.2 percent enrolled and 39.9 percent in attendance.
The conclusion is that we can feel fairly confident that the enrolment proportions given in Table
2 above roughly reflect the reality on the ground; that is, no management type appears to be
exaggerating their enrolment to any large degree, or all are doing so to roughly the same extent.
Table 27 Enrolled and attending pupils, by management type
Management type
Primary Number of pupils
Number of schools
% of pupils
Private Proprietor
Registered 11,894 43 17.8%
Attending 10,390 42 17.9%
NGO Registered 4,087 9 6.1%
Attending 3,410 9 5.9%
Community Registered 4,794 15 7.2%
Attending 3,824 15 6.6%
Church Registered 17,184 42 25.7%
Attending 15,597 41 26.8%
Mosque Registered 575 1 0.9%
Attending 502 1 0.9%
Government Registered 26,874 37 40.2%
Attending 23,193 36 39.9%
TTU Registered 1,488 6 2.2%
Attending 1,240 6 2.1%
Total Registered 66,896 153 100.0%
Attending 58,156 150 100.0%
Gender and attendance
We can also use the data collected by the researchers as they visited the classrooms to see if
there are differences by gender in attendance rates. Table 28 gives the situation for primary
schools, but similar results can be found for other levels too. The two important columns to
compare are the ‘% of total children’ in the “Registered” and “Attending” sections. Here we see
that for girls, there are slightly higher proportions of girls attending (than registered) in the
private schools, because attendance rates are slightly lower in the government schools. The
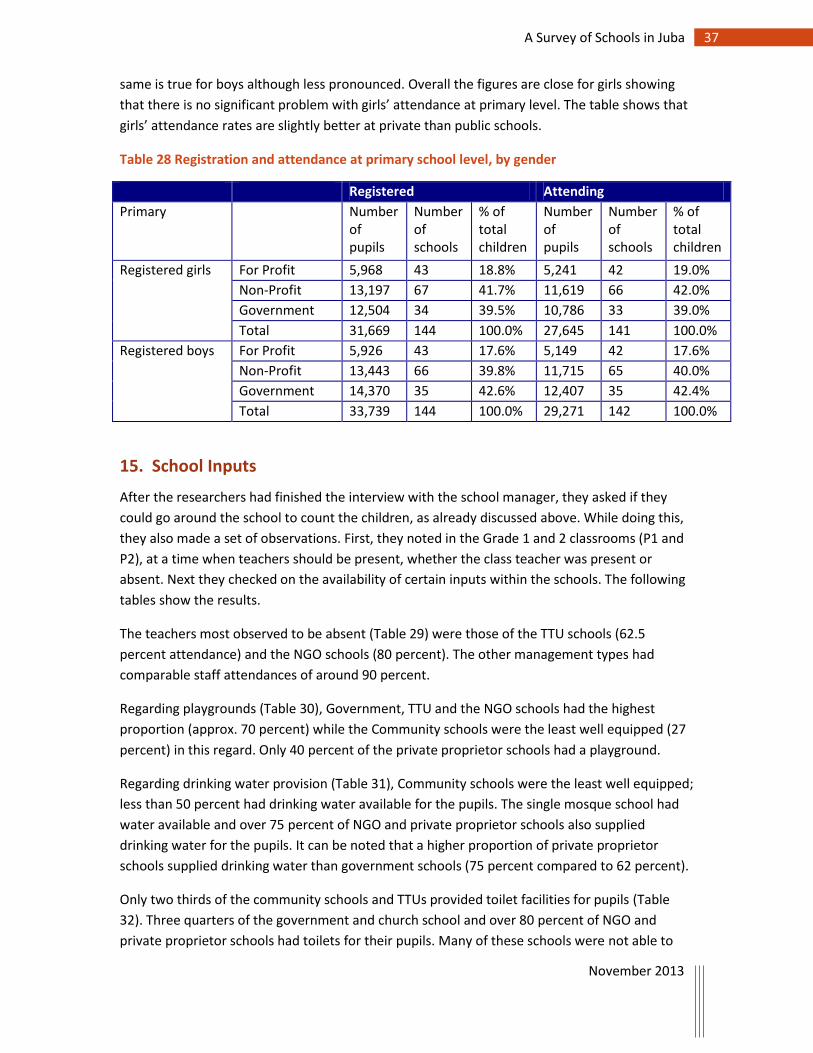
37 A Survey of Schools in Juba
November 2013
same is true for boys although less pronounced. Overall the figures are close for girls showing
that there is no significant problem with girls’ attendance at primary level. The table shows that
girls’ attendance rates are slightly better at private than public schools.
Table 28 Registration and attendance at primary school level, by gender
Registered Attending
Primary Number of pupils
Number of schools
% of total children
Number of pupils
Number of schools
% of total children
Registered girls For Profit 5,968 43 18.8% 5,241 42 19.0%
Non-Profit 13,197 67 41.7% 11,619 66 42.0%
Government 12,504 34 39.5% 10,786 33 39.0%
Total 31,669 144 100.0% 27,645 141 100.0%
Registered boys For Profit 5,926 43 17.6% 5,149 42 17.6%
Non-Profit 13,443 66 39.8% 11,715 65 40.0%
Government 14,370 35 42.6% 12,407 35 42.4%
Total 33,739 144 100.0% 29,271 142 100.0%
15. School Inputs
After the researchers had finished the interview with the school manager, they asked if they
could go around the school to count the children, as already discussed above. While doing this,
they also made a set of observations. First, they noted in the Grade 1 and 2 classrooms (P1 and
P2), at a time when teachers should be present, whether the class teacher was present or
absent. Next they checked on the availability of certain inputs within the schools. The following
tables show the results.
The teachers most observed to be absent (Table 29) were those of the TTU schools (62.5
percent attendance) and the NGO schools (80 percent). The other management types had
comparable staff attendances of around 90 percent.
Regarding playgrounds (Table 30), Government, TTU and the NGO schools had the highest
proportion (approx. 70 percent) while the Community schools were the least well equipped (27
percent) in this regard. Only 40 percent of the private proprietor schools had a playground.
Regarding drinking water provision (Table 31), Community schools were the least well equipped;
less than 50 percent had drinking water available for the pupils. The single mosque school had
water available and over 75 percent of NGO and private proprietor schools also supplied
drinking water for the pupils. It can be noted that a higher proportion of private proprietor
schools supplied drinking water than government schools (75 percent compared to 62 percent).
Only two thirds of the community schools and TTUs provided toilet facilities for pupils (Table
32). Three quarters of the government and church school and over 80 percent of NGO and
private proprietor schools had toilets for their pupils. Many of these schools were not able to
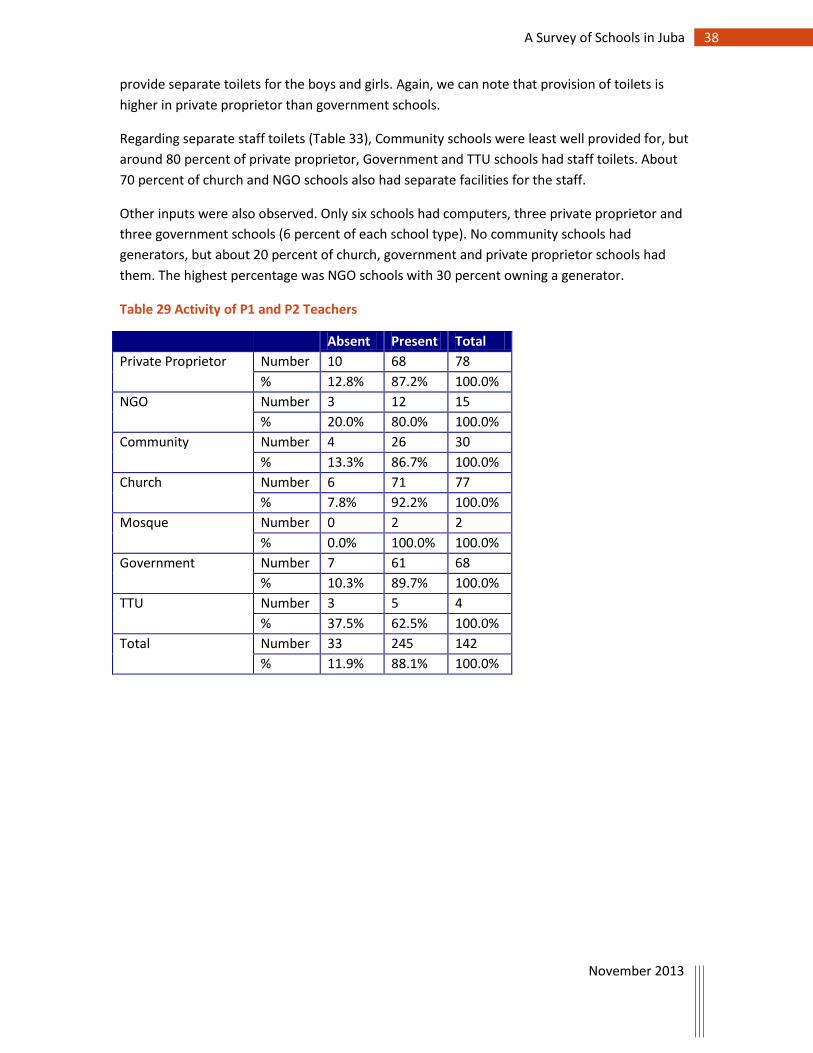
38 A Survey of Schools in Juba
November 2013
provide separate toilets for the boys and girls. Again, we can note that provision of toilets is
higher in private proprietor than government schools.
Regarding separate staff toilets (Table 33), Community schools were least well provided for, but
around 80 percent of private proprietor, Government and TTU schools had staff toilets. About
70 percent of church and NGO schools also had separate facilities for the staff.
Other inputs were also observed. Only six schools had computers, three private proprietor and
three government schools (6 percent of each school type). No community schools had
generators, but about 20 percent of church, government and private proprietor schools had
them. The highest percentage was NGO schools with 30 percent owning a generator.
Table 29 Activity of P1 and P2 Teachers
Absent Present Total
Private Proprietor Number 10 68 78
% 12.8% 87.2% 100.0%
NGO Number 3 12 15
% 20.0% 80.0% 100.0%
Community Number 4 26 30
% 13.3% 86.7% 100.0%
Church Number 6 71 77
% 7.8% 92.2% 100.0%
Mosque Number 0 2 2
% 0.0% 100.0% 100.0%
Government Number 7 61 68
% 10.3% 89.7% 100.0%
TTU Number 3 5 4
% 37.5% 62.5% 100.0%
Total Number 33 245 142
% 11.9% 88.1% 100.0%
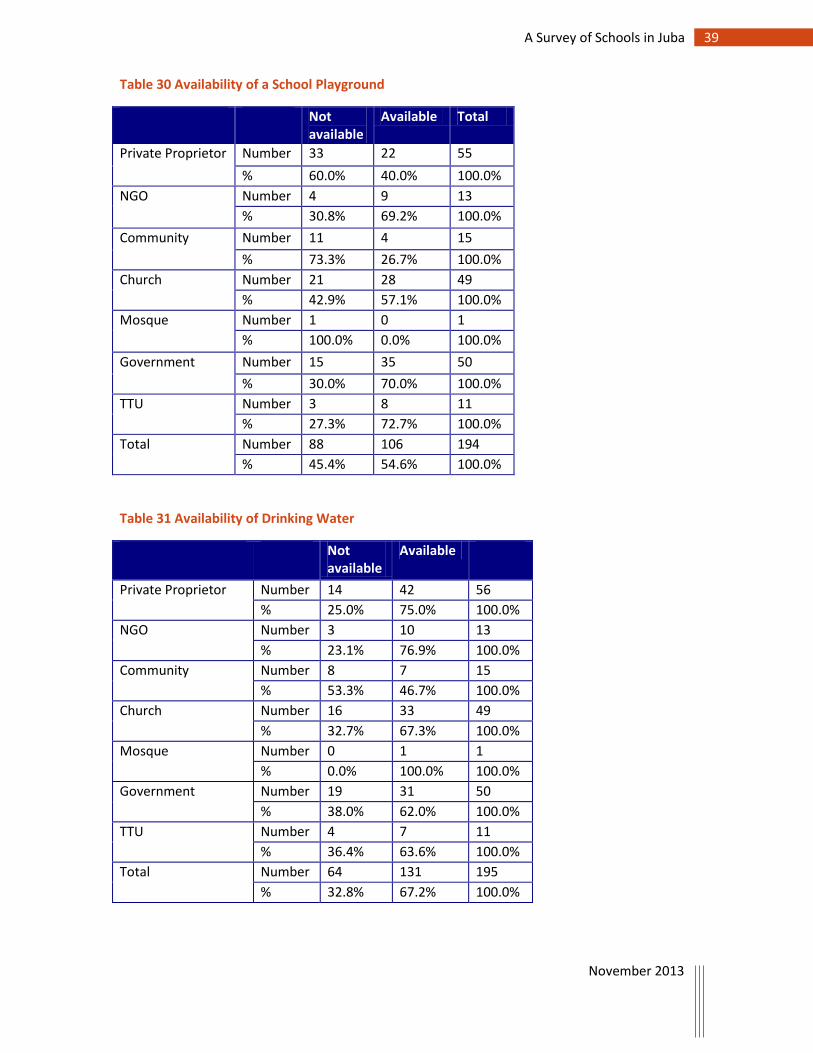
39 A Survey of Schools in Juba
November 2013
Table 30 Availability of a School Playground
Not available
Available Total
Private Proprietor Number 33 22 55
% 60.0% 40.0% 100.0%
NGO Number 4 9 13
% 30.8% 69.2% 100.0%
Community Number 11 4 15
% 73.3% 26.7% 100.0%
Church Number 21 28 49
% 42.9% 57.1% 100.0%
Mosque Number 1 0 1
% 100.0% 0.0% 100.0%
Government Number 15 35 50
% 30.0% 70.0% 100.0%
TTU Number 3 8 11
% 27.3% 72.7% 100.0%
Total Number 88 106 194
% 45.4% 54.6% 100.0%
Table 31 Availability of Drinking Water
Not available
Available
Private Proprietor Number 14 42 56
% 25.0% 75.0% 100.0%
NGO Number 3 10 13
% 23.1% 76.9% 100.0%
Community Number 8 7 15
% 53.3% 46.7% 100.0%
Church Number 16 33 49
% 32.7% 67.3% 100.0%
Mosque Number 0 1 1
% 0.0% 100.0% 100.0%
Government Number 19 31 50
% 38.0% 62.0% 100.0%
TTU Number 4 7 11
% 36.4% 63.6% 100.0%
Total Number 64 131 195
% 32.8% 67.2% 100.0%
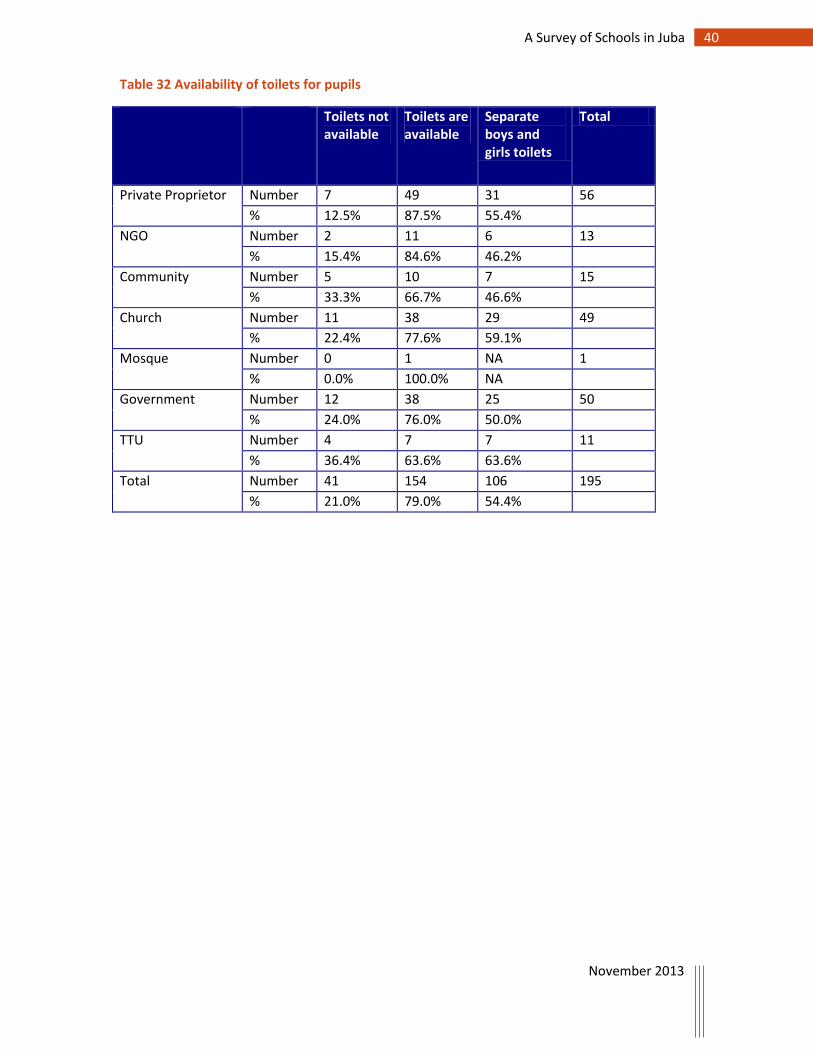
40 A Survey of Schools in Juba
November 2013
Table 32 Availability of toilets for pupils
Toilets not available
Toilets are available
Separate boys and girls toilets
Total
Private Proprietor Number 7 49 31 56
% 12.5% 87.5% 55.4%
NGO Number 2 11 6 13
% 15.4% 84.6% 46.2%
Community Number 5 10 7 15
% 33.3% 66.7% 46.6%
Church Number 11 38 29 49
% 22.4% 77.6% 59.1%
Mosque Number 0 1 NA 1
% 0.0% 100.0% NA
Government Number 12 38 25 50
% 24.0% 76.0% 50.0%
TTU Number 4 7 7 11
% 36.4% 63.6% 63.6%
Total Number 41 154 106 195
% 21.0% 79.0% 54.4%
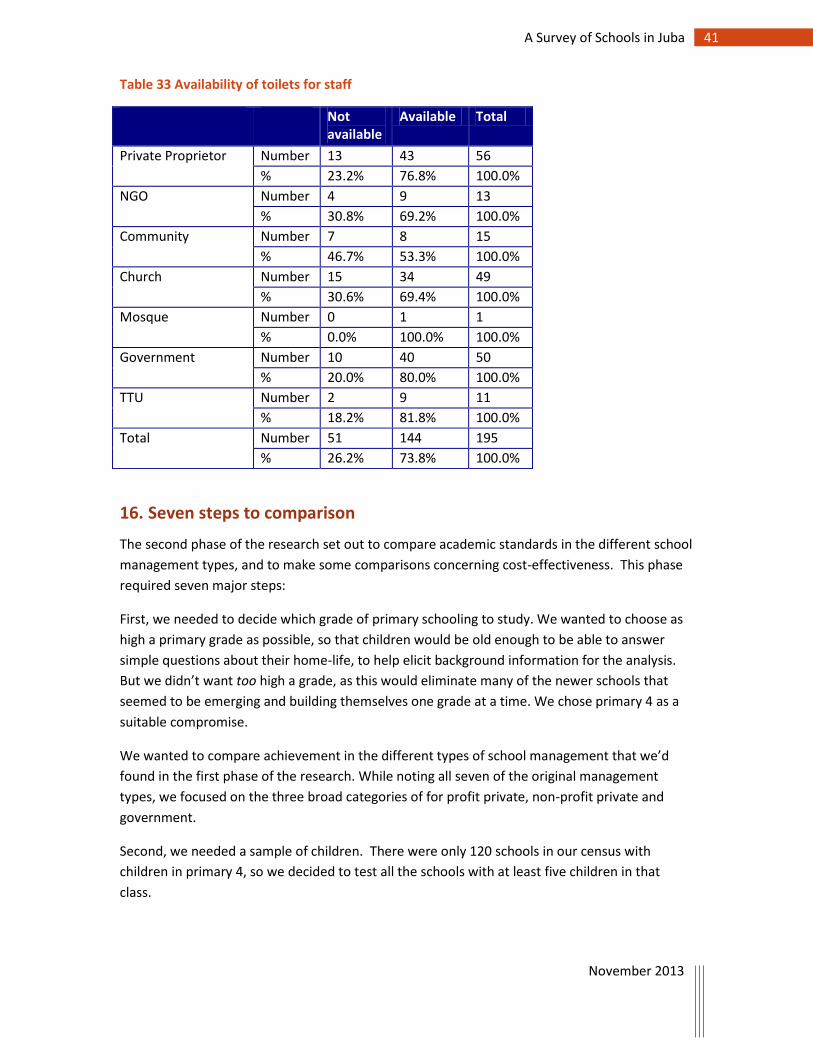
41 A Survey of Schools in Juba
November 2013
Table 33 Availability of toilets for staff
Not available
Available Total
Private Proprietor Number 13 43 56
% 23.2% 76.8% 100.0%
NGO Number 4 9 13
% 30.8% 69.2% 100.0%
Community Number 7 8 15
% 46.7% 53.3% 100.0%
Church Number 15 34 49
% 30.6% 69.4% 100.0%
Mosque Number 0 1 1
% 0.0% 100.0% 100.0%
Government Number 10 40 50
% 20.0% 80.0% 100.0%
TTU Number 2 9 11
% 18.2% 81.8% 100.0%
Total Number 51 144 195
% 26.2% 73.8% 100.0%
16. Seven steps to comparison
The second phase of the research set out to compare academic standards in the different school
management types, and to make some comparisons concerning cost-effectiveness. This phase
required seven major steps:
First, we needed to decide which grade of primary schooling to study. We wanted to choose as
high a primary grade as possible, so that children would be old enough to be able to answer
simple questions about their home-life, to help elicit background information for the analysis.
But we didn’t want too high a grade, as this would eliminate many of the newer schools that
seemed to be emerging and building themselves one grade at a time. We chose primary 4 as a
suitable compromise.
We wanted to compare achievement in the different types of school management that we’d
found in the first phase of the research. While noting all seven of the original management
types, we focused on the three broad categories of for profit private, non-profit private and
government.
Second, we needed a sample of children. There were only 120 schools in our census with
children in primary 4, so we decided to test all the schools with at least five children in that
class.
42 A Survey of Schools in Juba
November 2013
To avoid skewing the data towards larger schools, we restricted ourselves to a maximum of
thirty children in primary 4 from each school. If there were more than thirty children, then the
required number was randomly selected using a counting method from the school register
(aiming for equal boys and girls and suitably adapted if there were more than one primary 4
class).
Nearly 120 schools (all those with five or more pupils in primary 4) were approached before the
research began and asked if they were willing to have two researchers in their school for one
whole day to conduct tests and questionnaires. Most schools readily agreed and fully
cooperated with the researchers; they assisted them in the logistics of classroom space and the
pupils chosen by the researchers were allowed to participate. A small minority of schools did
refuse, despite follow up phone calls, generally on account of their own internal programmes.
Although research was conducted in the TTU schools, we found that the pupils were on average
significantly older and were not representative of the broader population in the research; hence
they were not included in the analysis. Finally, we were able to get full sets of information from
97 schools.
Third, we needed data on children’s academic achievement that would be easy enough to
administer, relevant to the curricular context, and reliable enough for our analysis. After
discussions with teachers and education experts in Juba, we chose, for English, standardised
individual reading and group spelling tests developed by GL Assessment (formerly NFER-Nelson).
For mathematics we used a standardised GMADE (Group Mathematics Assessment and
Diagnostic Evaluation) test. We also needed a proxy for prior attainment, so chose the Non-
Verbal Reasoning (NVR) test developed by GL Assessment.
Fourth, we needed data on background variables that other research had suggested might be
significant for achievement. These were collected through the following questionnaires that
were designed and modified by the teams in Newcastle and Juba. (In each case, as throughout
the research, all respondents were guaranteed anonymity, and other ethical procedures
mandated by Newcastle University were followed):
Pupil questionnaires – these were given to all the pupils after they had done the tests,
with researchers explaining every question to the children, and helping children where
appropriate. This was often done on a one-to-one basis. The questionnaires explored
basic facts about the child and their family background.
Family questionnaires – again these were explained to students, who were asked to take
them home to give to their parents or guardians, and if necessary to seek help from
older siblings or other relatives. These questionnaires were very brief, asking mainly
about parental education levels, employment situation and degree of satisfaction with
aspects of their child’s school. Most used multi-choice answers. The children were
asked to return their questionnaires the next day to one of the researchers, who would
reward the return with a small gift.
43 A Survey of Schools in Juba
November 2013
Teacher questionnaires – the primary 4 class teacher(s) were given questionnaires
exploring their experience, education and training levels and other basic facts about the
class and learning equipment availability. It also asked about their salaries. (We already
had data from the school level which we had gained during component 1 of the
research. If the school had subject- rather than class-teachers at primary 4, researchers
selected the English teacher).
School information – we gave follow-up questions to the researchers and/or supervisors
where clarification was needed for items raised in the school questionnaire from the
first phase.
Fifth, a team of 40 researchers (mainly the same as had taken part in component 1) and the
same five supervisors were trained over a two-day period. It was a complex procedure – the
reading tests required assessing children individually, while other tests were done as a class or
in groups of up to 15 pupils. Questionnaires were also administered to all the class members
involved in the study, while one of the team had to pick up family questionnaires the next
morning and give out gifts, before moving on to the next school. The testing took place over a
six day period. At the end of each day in the schools, the researchers returned to ‘base camp’
with completed tests and questionnaires (including family questionnaires from the previous day)
for checking.
Sixth, data from the tests and questionnaires were entered into Excel by a data entry team at
the Nile Institute office. (The spelling tests were marked, but the Mathematics and NVR Tests
were ‘automatically’ marked by the software, so no markers were needed).
Finally, data were analysed in Newcastle. Data were transferred to SPSS for cleaning and
preparatory work, including factor analysis and creating descriptive statistics. During this time
there was frequent back and forth between Newcastle and Juba to clarify any issues that arose,
usually by checking inconsistencies against the actual questionnaires or test papers. Data were
then transferred to MLwiN for multilevel modelling analysis.
These seven steps followed fairly soon after the research for component 1 reported in the
earlier chapters, which took place in June 2012. This research took place four months later in
October 2012.
17. The sample
As we attempted to gain access to all the relevant schools we attempted to conduct a census of
schools, but taking only up to 30 pupils from each school meant that many schools were
represented by a sample of their children. Table 34 shows the number of schools and pupils in
primary 4 assessed in this phase of the research.
In total there were 97 schools in the analysis, 32 for profit, 36 non-profit and 29 government
schools. The results include the data from the 2,387 pupils who were tested in these schools; a
third in government schools, just over a third in non-profit and just under a third in the for profit
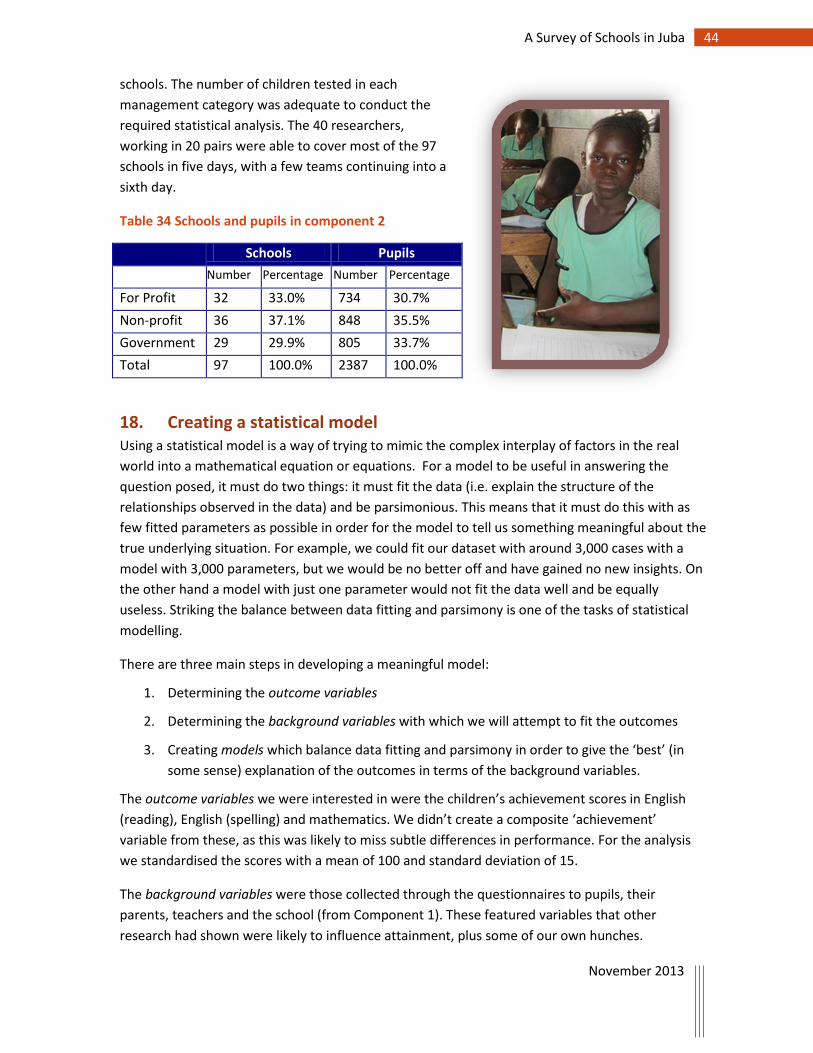
44 A Survey of Schools in Juba
November 2013
schools. The number of children tested in each
management category was adequate to conduct the
required statistical analysis. The 40 researchers,
working in 20 pairs were able to cover most of the 97
schools in five days, with a few teams continuing into a
sixth day.
Table 34 Schools and pupils in component 2
Schools Pupils
Number Percentage Number Percentage
For Profit 32 33.0% 734 30.7%
Non-profit 36 37.1% 848 35.5%
Government 29 29.9% 805 33.7%
Total 97 100.0% 2387 100.0%
18. Creating a statistical model Using a statistical model is a way of trying to mimic the complex interplay of factors in the real
world into a mathematical equation or equations. For a model to be useful in answering the
question posed, it must do two things: it must fit the data (i.e. explain the structure of the
relationships observed in the data) and be parsimonious. This means that it must do this with as
few fitted parameters as possible in order for the model to tell us something meaningful about the
true underlying situation. For example, we could fit our dataset with around 3,000 cases with a
model with 3,000 parameters, but we would be no better off and have gained no new insights. On
the other hand a model with just one parameter would not fit the data well and be equally
useless. Striking the balance between data fitting and parsimony is one of the tasks of statistical
modelling.
There are three main steps in developing a meaningful model:
1. Determining the outcome variables
2. Determining the background variables with which we will attempt to fit the outcomes
3. Creating models which balance data fitting and parsimony in order to give the ‘best’ (in
some sense) explanation of the outcomes in terms of the background variables.
The outcome variables we were interested in were the children’s achievement scores in English
(reading), English (spelling) and mathematics. We didn’t create a composite ‘achievement’
variable from these, as this was likely to miss subtle differences in performance. For the analysis
we standardised the scores with a mean of 100 and standard deviation of 15.
The background variables were those collected through the questionnaires to pupils, their
parents, teachers and the school (from Component 1). These featured variables that other
research had shown were likely to influence attainment, plus some of our own hunches.
45 A Survey of Schools in Juba
November 2013
To be used in regression models (the kind of statistical analysis we were conducting), background
variables should either be binary (that is, with two values, 0 or 1), e.g. gender (boy/girl), or in a
numerical form which can be assumed to form a scale in some sense. Age and NVR score are
examples of this, as are level of mother’s or father’s education (coded, for instance, from 0 to 4 to
reflect no schooling, up to pre-primary, up to primary, up to secondary, and beyond secondary).
One of the challenges with the data set was the relatively large number of variables. Many of
these background variables were likely to be highly correlated with each other and including all
variables in the model would lead to poor and generally un-interpretable results. There are
various techniques for reducing the number of variables. One of these is factor analysis, which we
used to ‘combine’ several sets of variables into a smaller, more manageable number.
For instance, we were interested in each family’s wealth, so had asked in the pupil questionnaire
about 20 possessions held by the family. These values (set to zero if the item was not possessed)
were entered into a factor analysis procedure in order to derive one or more composite wealth
variables. Examination of the eigenvalues showed that a good solution was to extract two factors.
When these factors were rotated, one factor loaded heavily on the possession of CD players,
generators, stoves, TVs, number of cellphones, refrigerators, freezers, PCs and cars. The second
factor loaded heavily on the possession of land, cattle, and animals. The first factor, which relates
to the possession of modern goods, was named wealth1 and the second, relating to what might be
termed “traditional” possessions, was named wealth2.
Similarly, we were very interested in parental education, which has been shown to be a key
determinant of children’s achievement levels. We asked questions of parents (and this was one of
the most important reasons for wanting a parental questionnaire – as we were not sure that
children would know enough about their parents’ educational levels). There were five variables
included in this factor analysis – father’s education level (coded as above), mother’s education
level, father’s years of education, mother’s years of education, and whether the father spoke
English. Not surprisingly, two factors were extracted; one reflecting father’s education and the
other the mother’s. Similar analysis was conducted on teachers’ data. Again two factors were
extracted, one reflecting the teacher’s age and experience, the other the teacher’s education and
training.
One possible statistical model with this data is simply to use linear regression. However, there is a
danger using this type of model as the cases (i.e., pupils) are clustered into schools and so are not
a random sample of all possible pupils. But pupils in a particular school are more likely to be more
similar to each other than to other pupils in different schools. Hence the standard error of these
cluster based variable is likely to be underestimated and the significance of the variable to the
regression model is therefore probably overestimated. Hence a multi-level model needs to be
used to improve the regression analysis. In this case, the model was set up with two levels: school
and pupil. Three separate outcome measures were modelled – English (reading), English (spelling)
and mathematics test scores, each standardised to have a mean of 100 and standard deviation of
15. The background variables fitted in the model included all those variables defined above,
including the composite ones derived from factor analysis.
46 A Survey of Schools in Juba
November 2013
In addition, we also created some “interaction” variables, to further address the research
questions. These were created by multiplying together relevant variables in order to see if the
coefficients of one variable were modified by the value of the other. For instance, to investigate
whether a particular management type of school was better or worse for brighter or less bright
children, we created the variables Profiq and Nprofiq (by multiplying the two relevant variables
together, with IQ subtracted from its mean), respectively the ways in which for profit and non-
profit schools lead to better or worse outcomes for brighter and less bright children.
When the models were run, variables which were clearly not significant were deleted, although
borderline significant variables were retained. The profit and non-profit variables were kept as
these were part of the key research question.
In this analysis, government schools were regarded as the default throughout. So, for instance, the
coefficient of “Non-Profit” gives the change that takes place going from a government school to a
non-profit school. Positive values for the coefficient indicate that the scores of this group will be
higher and a negative coefficient means their score will be lower. The variables that we used are
shown in Table 35.
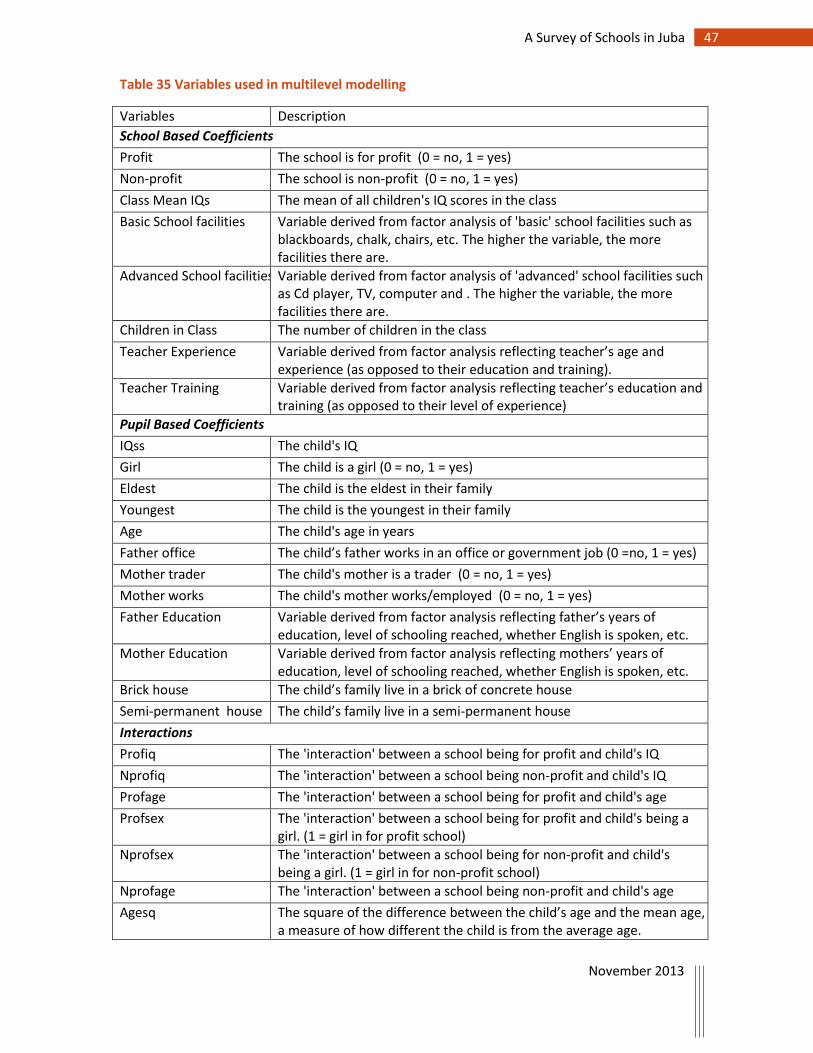
47 A Survey of Schools in Juba
November 2013
Table 35 Variables used in multilevel modelling
Variables Description
School Based Coefficients
Profit The school is for profit (0 = no, 1 = yes)
Non-profit The school is non-profit (0 = no, 1 = yes)
Class Mean IQs The mean of all children's IQ scores in the class
Basic School facilities Variable derived from factor analysis of 'basic' school facilities such as blackboards, chalk, chairs, etc. The higher the variable, the more facilities there are.
Advanced School facilities Variable derived from factor analysis of 'advanced' school facilities such as Cd player, TV, computer and . The higher the variable, the more facilities there are.
Children in Class The number of children in the class
Teacher Experience Variable derived from factor analysis reflecting teacher’s age and experience (as opposed to their education and training).
Teacher Training Variable derived from factor analysis reflecting teacher’s education and training (as opposed to their level of experience)
Pupil Based Coefficients
IQss The child's IQ
Girl The child is a girl (0 = no, 1 = yes)
Eldest The child is the eldest in their family
Youngest The child is the youngest in their family
Age The child's age in years
Father office The child’s father works in an office or government job (0 =no, 1 = yes)
Mother trader The child's mother is a trader (0 = no, 1 = yes)
Mother works The child's mother works/employed (0 = no, 1 = yes)
Father Education Variable derived from factor analysis reflecting father’s years of education, level of schooling reached, whether English is spoken, etc.
Mother Education Variable derived from factor analysis reflecting mothers’ years of education, level of schooling reached, whether English is spoken, etc.
Brick house The child’s family live in a brick of concrete house
Semi-permanent house The child’s family live in a semi-permanent house
Interactions
Profiq The 'interaction' between a school being for profit and child's IQ
Nprofiq The 'interaction' between a school being non-profit and child's IQ
Profage The 'interaction' between a school being for profit and child's age
Profsex The 'interaction' between a school being for profit and child's being a girl. (1 = girl in for profit school)
Nprofsex The 'interaction' between a school being for non-profit and child's being a girl. (1 = girl in for non-profit school)
Nprofage The 'interaction' between a school being non-profit and child's age
Agesq The square of the difference between the child’s age and the mean age, a measure of how different the child is from the average age.
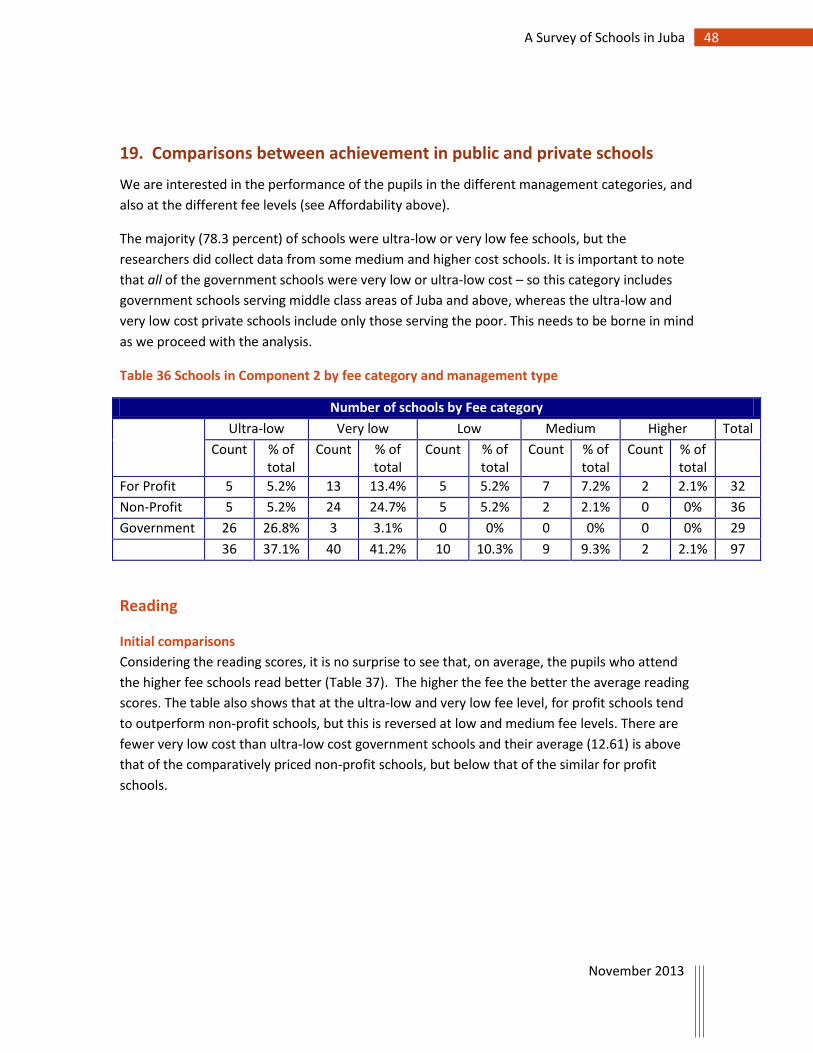
48 A Survey of Schools in Juba
November 2013
19. Comparisons between achievement in public and private schools
We are interested in the performance of the pupils in the different management categories, and
also at the different fee levels (see Affordability above).
The majority (78.3 percent) of schools were ultra-low or very low fee schools, but the
researchers did collect data from some medium and higher cost schools. It is important to note
that all of the government schools were very low or ultra-low cost – so this category includes
government schools serving middle class areas of Juba and above, whereas the ultra-low and
very low cost private schools include only those serving the poor. This needs to be borne in mind
as we proceed with the analysis.
Table 36 Schools in Component 2 by fee category and management type
Number of schools by Fee category
Ultra-low Very low Low Medium Higher Total
Count % of total
Count % of total
Count % of total
Count % of total
Count % of total
For Profit 5 5.2% 13 13.4% 5 5.2% 7 7.2% 2 2.1% 32
Non-Profit 5 5.2% 24 24.7% 5 5.2% 2 2.1% 0 0% 36
Government 26 26.8% 3 3.1% 0 0% 0 0% 0 0% 29
36 37.1% 40 41.2% 10 10.3% 9 9.3% 2 2.1% 97
Reading
Initial comparisons
Considering the reading scores, it is no surprise to see that, on average, the pupils who attend
the higher fee schools read better (Table 37). The higher the fee the better the average reading
scores. The table also shows that at the ultra-low and very low fee level, for profit schools tend
to outperform non-profit schools, but this is reversed at low and medium fee levels. There are
fewer very low cost than ultra-low cost government schools and their average (12.61) is above
that of the comparatively priced non-profit schools, but below that of the similar for profit
schools.
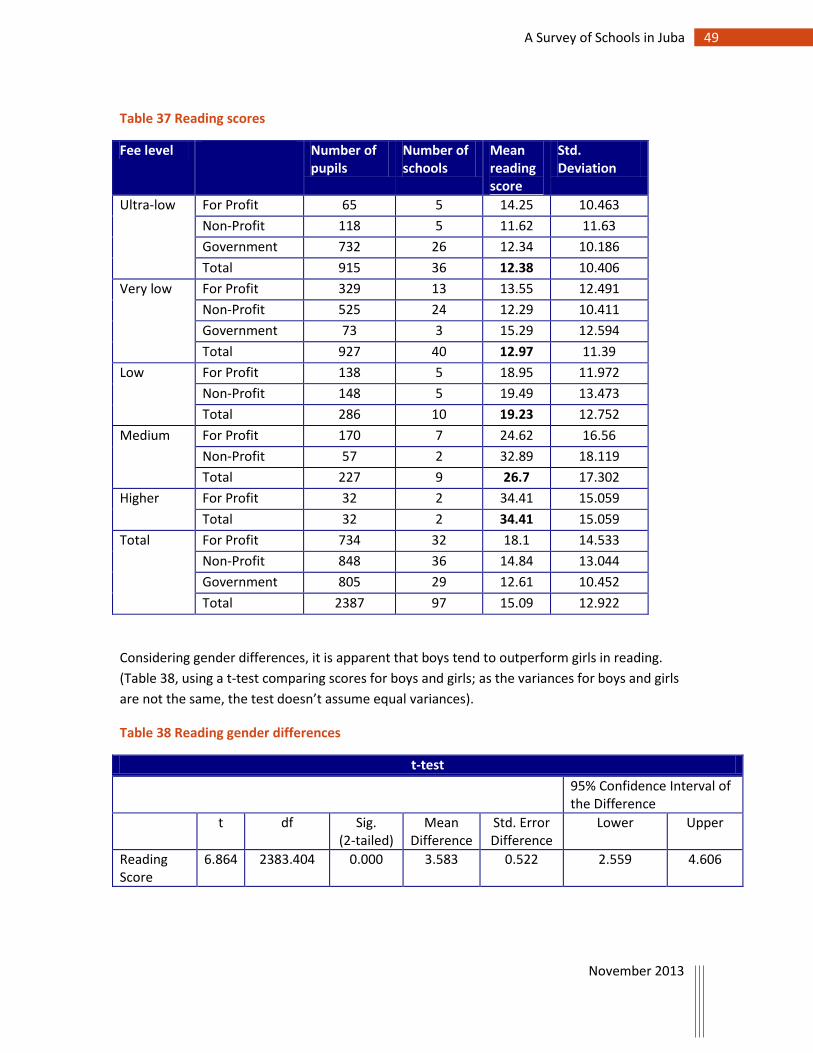
49 A Survey of Schools in Juba
November 2013
Table 37 Reading scores
Fee level Number of pupils
Number of schools
Mean reading score
Std. Deviation
Ultra-low For Profit 65 5 14.25 10.463
Non-Profit 118 5 11.62 11.63
Government 732 26 12.34 10.186
Total 915 36 12.38 10.406
Very low For Profit 329 13 13.55 12.491
Non-Profit 525 24 12.29 10.411
Government 73 3 15.29 12.594
Total 927 40 12.97 11.39
Low For Profit 138 5 18.95 11.972
Non-Profit 148 5 19.49 13.473
Total 286 10 19.23 12.752
Medium For Profit 170 7 24.62 16.56
Non-Profit 57 2 32.89 18.119
Total 227 9 26.7 17.302
Higher For Profit 32 2 34.41 15.059
Total 32 2 34.41 15.059
Total For Profit 734 32 18.1 14.533
Non-Profit 848 36 14.84 13.044
Government 805 29 12.61 10.452
Total 2387 97 15.09 12.922
Considering gender differences, it is apparent that boys tend to outperform girls in reading.
(Table 38, using a t-test comparing scores for boys and girls; as the variances for boys and girls
are not the same, the test doesn’t assume equal variances).
Table 38 Reading gender differences
t-test
95% Confidence Interval of the Difference
t df Sig. (2-tailed)
Mean Difference
Std. Error Difference
Lower Upper
Reading Score
6.864 2383.404 0.000 3.583 0.522 2.559 4.606
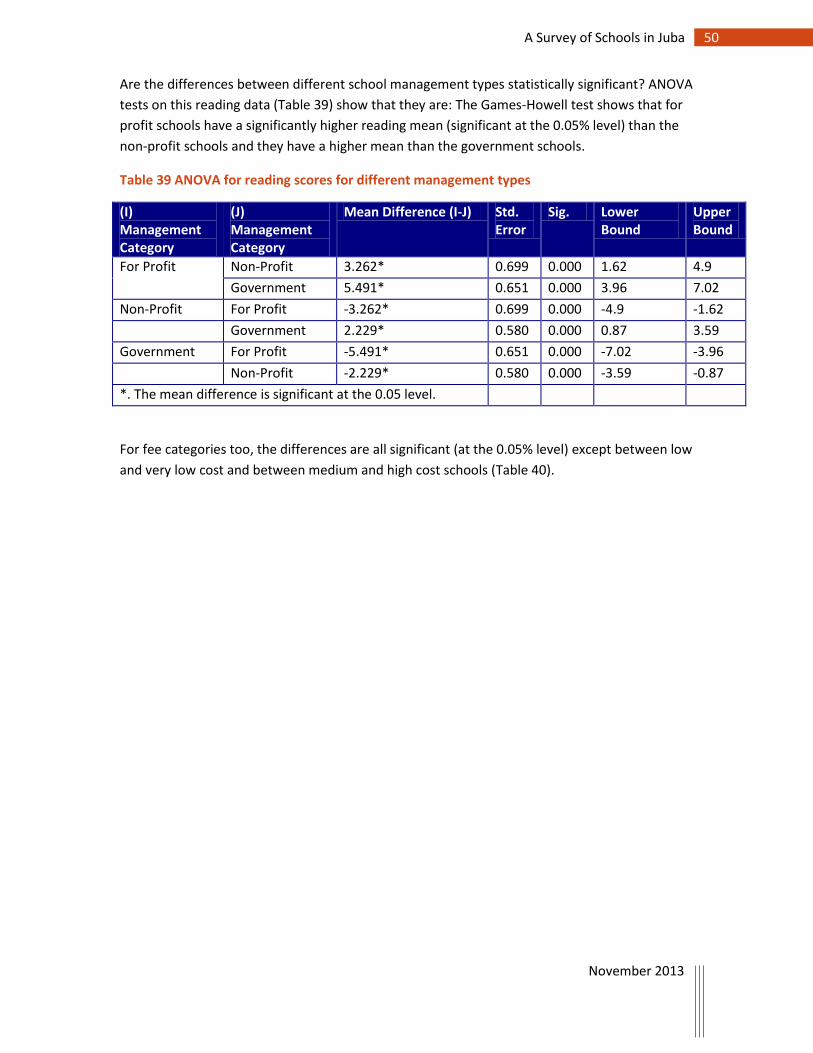
50 A Survey of Schools in Juba
November 2013
Are the differences between different school management types statistically significant? ANOVA
tests on this reading data (Table 39) show that they are: The Games-Howell test shows that for
profit schools have a significantly higher reading mean (significant at the 0.05% level) than the
non-profit schools and they have a higher mean than the government schools.
Table 39 ANOVA for reading scores for different management types
(I) Management Category
(J) Management Category
Mean Difference (I-J) Std. Error
Sig. Lower Bound
Upper Bound
For Profit Non-Profit 3.262* 0.699 0.000 1.62 4.9
Government 5.491* 0.651 0.000 3.96 7.02
Non-Profit For Profit -3.262* 0.699 0.000 -4.9 -1.62
Government 2.229* 0.580 0.000 0.87 3.59
Government For Profit -5.491* 0.651 0.000 -7.02 -3.96
Non-Profit -2.229* 0.580 0.000 -3.59 -0.87
*. The mean difference is significant at the 0.05 level.
For fee categories too, the differences are all significant (at the 0.05% level) except between low
and very low cost and between medium and high cost schools (Table 40).
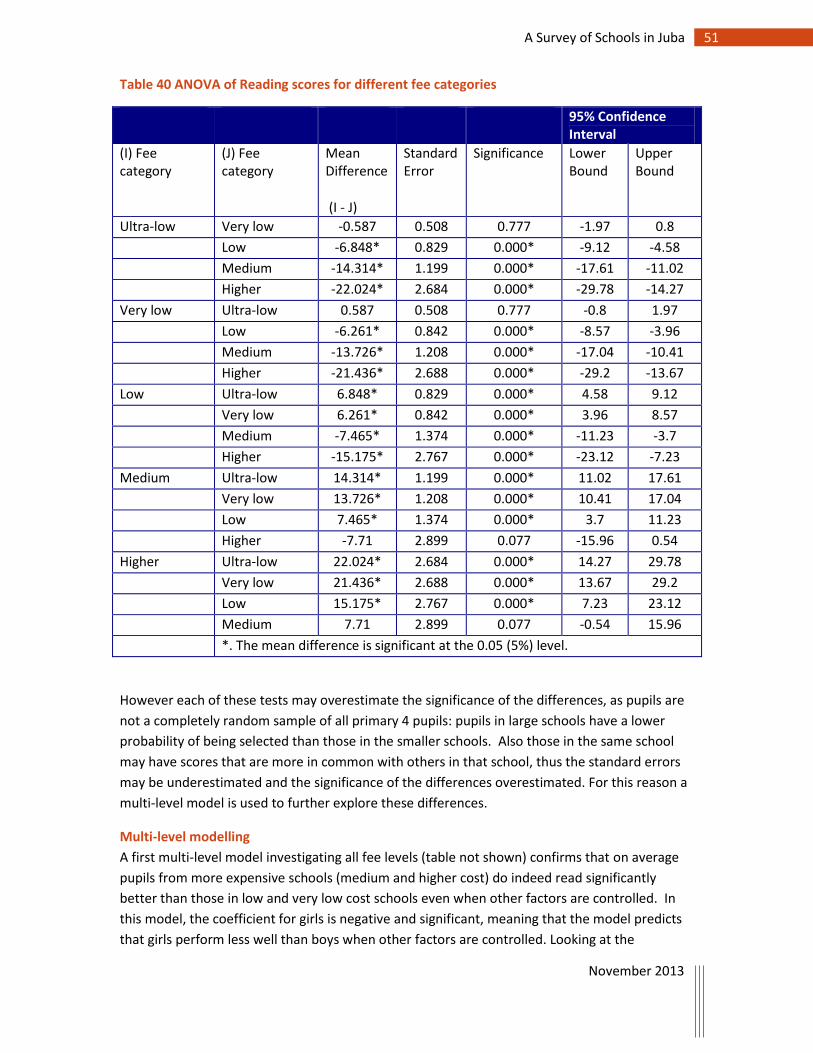
51 A Survey of Schools in Juba
November 2013
Table 40 ANOVA of Reading scores for different fee categories
95% Confidence Interval
(I) Fee category
(J) Fee category
Mean Difference
(I - J)
Standard Error
Significance Lower Bound
Upper Bound
Ultra-low Very low -0.587 0.508 0.777 -1.97 0.8
Low -6.848* 0.829 0.000* -9.12 -4.58
Medium -14.314* 1.199 0.000* -17.61 -11.02
Higher -22.024* 2.684 0.000* -29.78 -14.27
Very low Ultra-low 0.587 0.508 0.777 -0.8 1.97
Low -6.261* 0.842 0.000* -8.57 -3.96
Medium -13.726* 1.208 0.000* -17.04 -10.41
Higher -21.436* 2.688 0.000* -29.2 -13.67
Low Ultra-low 6.848* 0.829 0.000* 4.58 9.12
Very low 6.261* 0.842 0.000* 3.96 8.57
Medium -7.465* 1.374 0.000* -11.23 -3.7
Higher -15.175* 2.767 0.000* -23.12 -7.23
Medium Ultra-low 14.314* 1.199 0.000* 11.02 17.61
Very low 13.726* 1.208 0.000* 10.41 17.04
Low 7.465* 1.374 0.000* 3.7 11.23
Higher -7.71 2.899 0.077 -15.96 0.54
Higher Ultra-low 22.024* 2.684 0.000* 14.27 29.78
Very low 21.436* 2.688 0.000* 13.67 29.2
Low 15.175* 2.767 0.000* 7.23 23.12
Medium 7.71 2.899 0.077 -0.54 15.96
*. The mean difference is significant at the 0.05 (5%) level.
However each of these tests may overestimate the significance of the differences, as pupils are
not a completely random sample of all primary 4 pupils: pupils in large schools have a lower
probability of being selected than those in the smaller schools. Also those in the same school
may have scores that are more in common with others in that school, thus the standard errors
may be underestimated and the significance of the differences overestimated. For this reason a
multi-level model is used to further explore these differences.
Multi-level modelling
A first multi-level model investigating all fee levels (table not shown) confirms that on average
pupils from more expensive schools (medium and higher cost) do indeed read significantly
better than those in low and very low cost schools even when other factors are controlled. In
this model, the coefficient for girls is negative and significant, meaning that the model predicts
that girls perform less well than boys when other factors are controlled. Looking at the
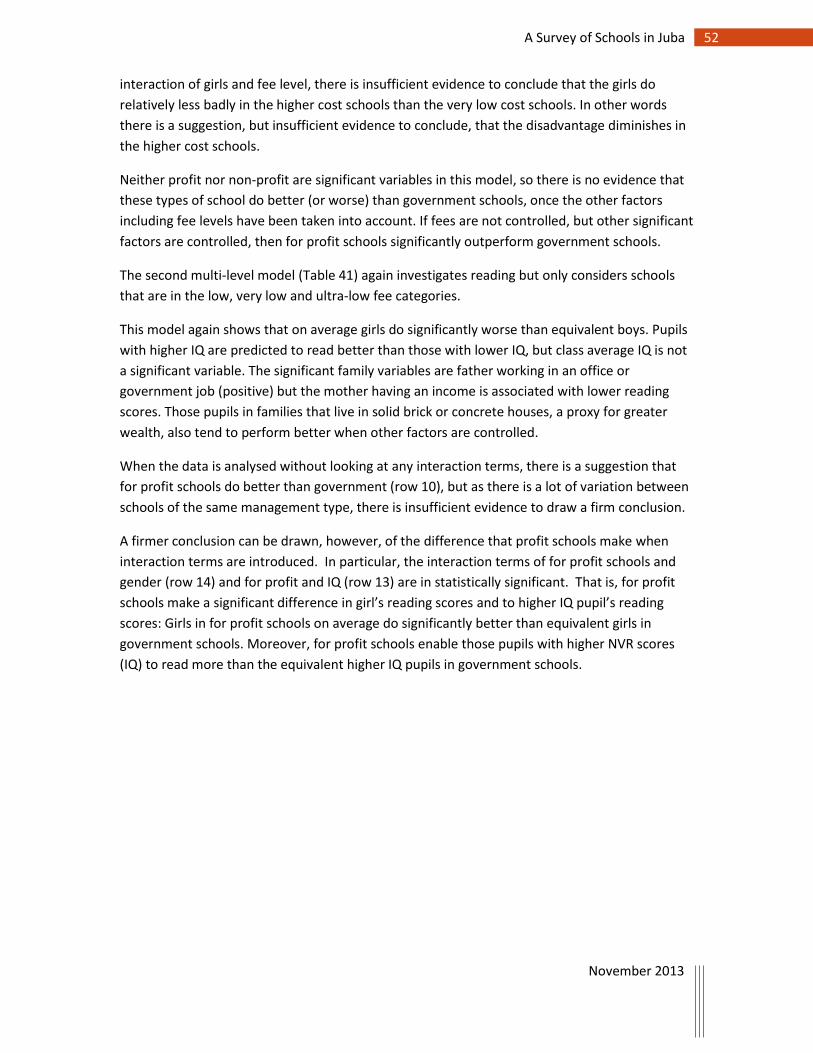
52 A Survey of Schools in Juba
November 2013
interaction of girls and fee level, there is insufficient evidence to conclude that the girls do
relatively less badly in the higher cost schools than the very low cost schools. In other words
there is a suggestion, but insufficient evidence to conclude, that the disadvantage diminishes in
the higher cost schools.
Neither profit nor non-profit are significant variables in this model, so there is no evidence that
these types of school do better (or worse) than government schools, once the other factors
including fee levels have been taken into account. If fees are not controlled, but other significant
factors are controlled, then for profit schools significantly outperform government schools.
The second multi-level model (Table 41) again investigates reading but only considers schools
that are in the low, very low and ultra-low fee categories.
This model again shows that on average girls do significantly worse than equivalent boys. Pupils
with higher IQ are predicted to read better than those with lower IQ, but class average IQ is not
a significant variable. The significant family variables are father working in an office or
government job (positive) but the mother having an income is associated with lower reading
scores. Those pupils in families that live in solid brick or concrete houses, a proxy for greater
wealth, also tend to perform better when other factors are controlled.
When the data is analysed without looking at any interaction terms, there is a suggestion that
for profit schools do better than government (row 10), but as there is a lot of variation between
schools of the same management type, there is insufficient evidence to draw a firm conclusion.
A firmer conclusion can be drawn, however, of the difference that profit schools make when
interaction terms are introduced. In particular, the interaction terms of for profit schools and
gender (row 14) and for profit and IQ (row 13) are in statistically significant. That is, for profit
schools make a significant difference in girl’s reading scores and to higher IQ pupil’s reading
scores: Girls in for profit schools on average do significantly better than equivalent girls in
government schools. Moreover, for profit schools enable those pupils with higher NVR scores
(IQ) to read more than the equivalent higher IQ pupils in government schools.
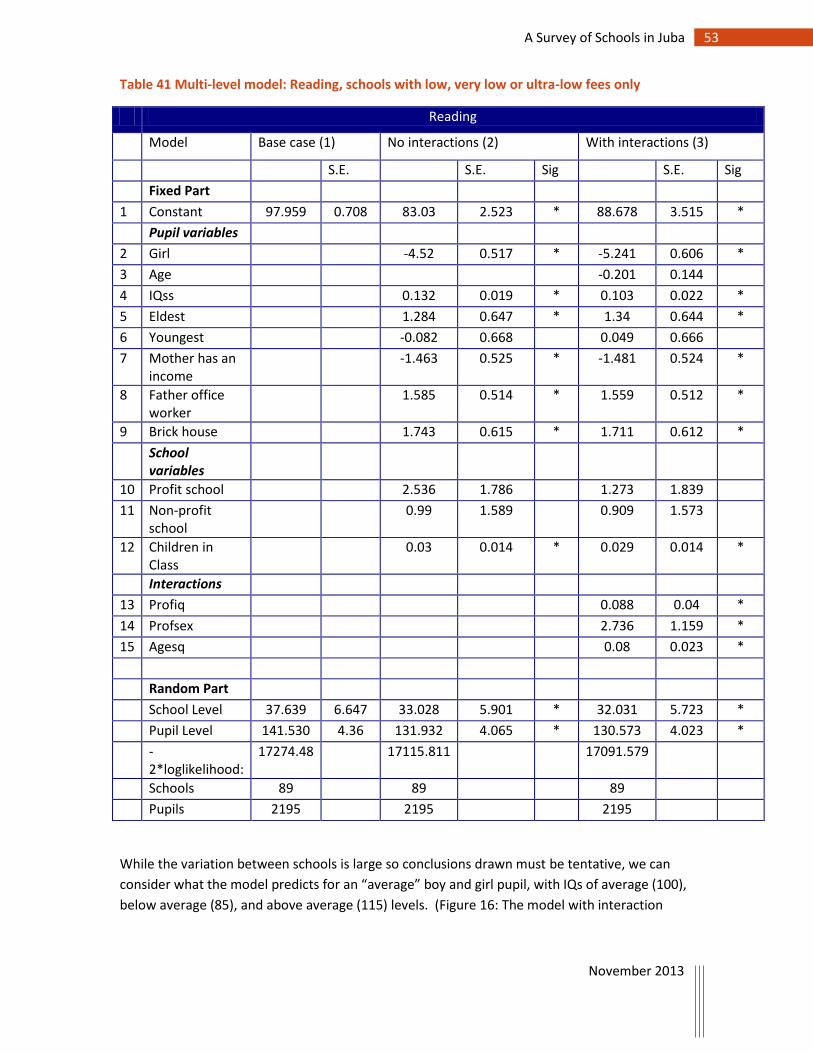
53 A Survey of Schools in Juba
November 2013
Table 41 Multi-level model: Reading, schools with low, very low or ultra-low fees only
Reading
Model Base case (1) No interactions (2) With interactions (3)
S.E. S.E. Sig S.E. Sig
Fixed Part
1 Constant 97.959 0.708 83.03 2.523 * 88.678 3.515 *
Pupil variables
2 Girl -4.52 0.517 * -5.241 0.606 *
3 Age -0.201 0.144
4 IQss 0.132 0.019 * 0.103 0.022 *
5 Eldest 1.284 0.647 * 1.34 0.644 *
6 Youngest -0.082 0.668 0.049 0.666
7 Mother has an income
-1.463 0.525 * -1.481 0.524 *
8 Father office worker
1.585 0.514 * 1.559 0.512 *
9 Brick house 1.743 0.615 * 1.711 0.612 *
School variables
10 Profit school 2.536 1.786 1.273 1.839
11 Non-profit school
0.99 1.589 0.909 1.573
12 Children in Class
0.03 0.014 * 0.029 0.014 *
Interactions
13 Profiq 0.088 0.04 *
14 Profsex 2.736 1.159 *
15 Agesq 0.08 0.023 *
Random Part
School Level 37.639 6.647 33.028 5.901 * 32.031 5.723 *
Pupil Level 141.530 4.36 131.932 4.065 * 130.573 4.023 *
-2*loglikelihood:
17274.48 17115.811 17091.579
Schools 89 89 89
Pupils 2195 2195 2195
While the variation between schools is large so conclusions drawn must be tentative, we can
consider what the model predicts for an “average” boy and girl pupil, with IQs of average (100),
below average (85), and above average (115) levels. (Figure 16: The model with interaction
54 A Survey of Schools in Juba
November 2013
terms included suggests that the predicted scores will vary between school type and gender and
according to IQ).
The different “slopes” of the lines in the graph are important to note: in general, for both boys
and girls, in government schools the slope is lower than in for profit schools. This suggests that
more able children in government schools are not extended academically as much as the more
able in for profit private schools. For girls, the impact is even greater: while girls are behind boys
in reading in all school types, the model predicts that more able girls in for profit schools will
actually outperform more able boys in government schools. The same data is shown in Table 42
with the addition of (tentatively) predicted scores for non-profit schools added, while Table 43
shows the same result using predicted raw scores.
Figure 16 Reading scores predicted by interaction model for low, very low and ultra-low cost schools
90
92
94
96
98
100
102
104
85 90 95 100 105 110 115
Stan
dar
dis
ed
Re
adin
g Sc
ore
Standardised NVR (IQ) Score
Predicted Reading Scores
Government Boy Government Girl For profit Boy For profit Girl
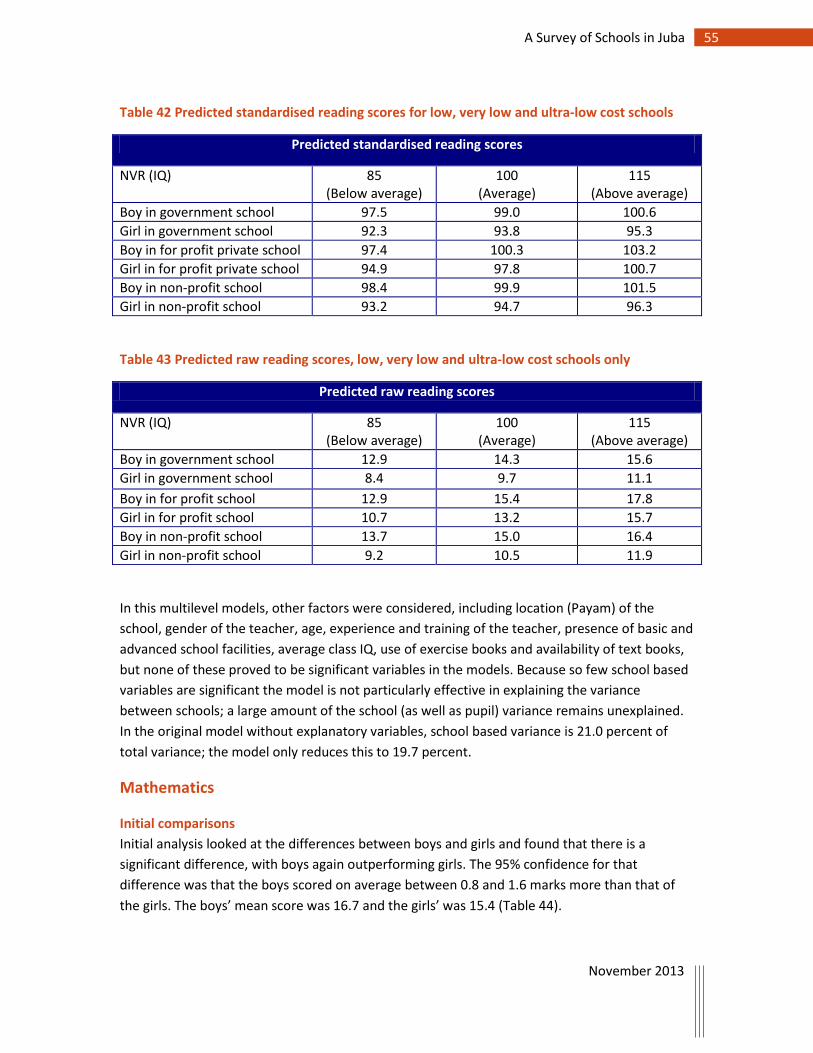
55 A Survey of Schools in Juba
November 2013
Table 42 Predicted standardised reading scores for low, very low and ultra-low cost schools
Predicted standardised reading scores
NVR (IQ) 85 (Below average)
100 (Average)
115 (Above average)
Boy in government school 97.5 99.0 100.6
Girl in government school 92.3 93.8 95.3
Boy in for profit private school 97.4 100.3 103.2
Girl in for profit private school 94.9 97.8 100.7
Boy in non-profit school 98.4 99.9 101.5
Girl in non-profit school 93.2 94.7 96.3
Table 43 Predicted raw reading scores, low, very low and ultra-low cost schools only
Predicted raw reading scores
NVR (IQ) 85 (Below average)
100 (Average)
115 (Above average)
Boy in government school 12.9 14.3 15.6
Girl in government school 8.4 9.7 11.1
Boy in for profit school 12.9 15.4 17.8
Girl in for profit school 10.7 13.2 15.7
Boy in non-profit school 13.7 15.0 16.4
Girl in non-profit school 9.2 10.5 11.9
In this multilevel models, other factors were considered, including location (Payam) of the
school, gender of the teacher, age, experience and training of the teacher, presence of basic and
advanced school facilities, average class IQ, use of exercise books and availability of text books,
but none of these proved to be significant variables in the models. Because so few school based
variables are significant the model is not particularly effective in explaining the variance
between schools; a large amount of the school (as well as pupil) variance remains unexplained.
In the original model without explanatory variables, school based variance is 21.0 percent of
total variance; the model only reduces this to 19.7 percent.
Mathematics
Initial comparisons
Initial analysis looked at the differences between boys and girls and found that there is a
significant difference, with boys again outperforming girls. The 95% confidence for that
difference was that the boys scored on average between 0.8 and 1.6 marks more than that of
the girls. The boys’ mean score was 16.7 and the girls’ was 15.4 (Table 44).
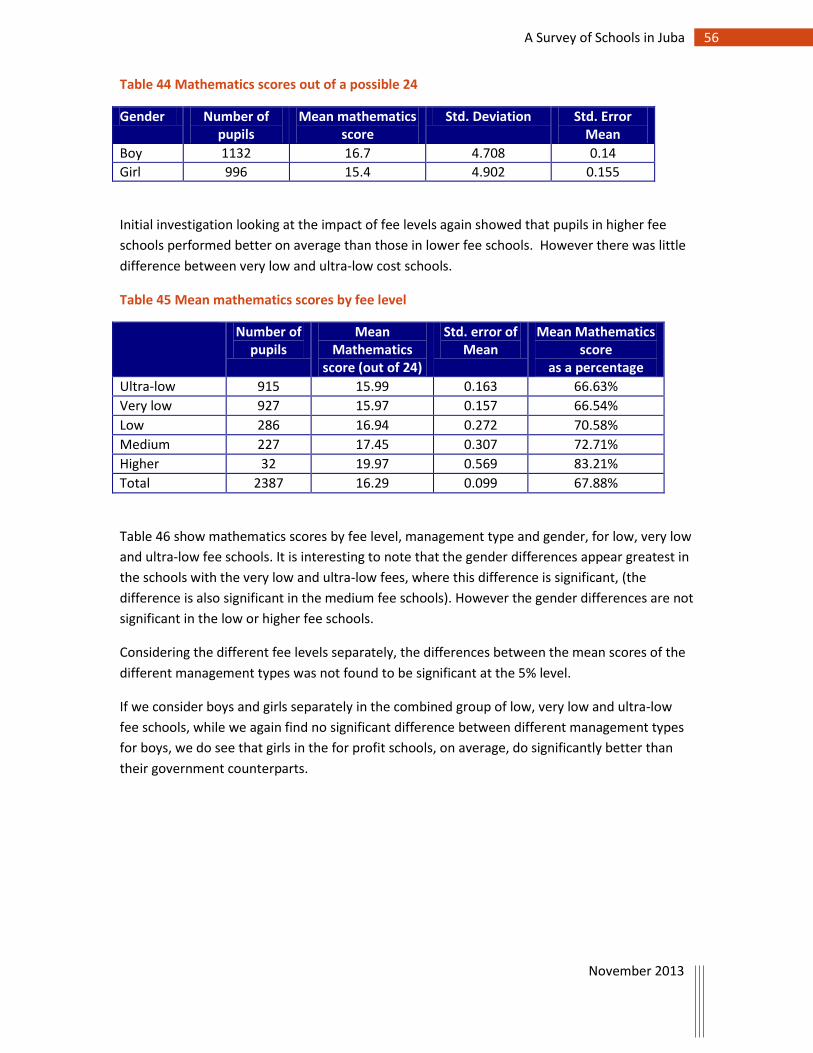
56 A Survey of Schools in Juba
November 2013
Table 44 Mathematics scores out of a possible 24
Gender Number of pupils
Mean mathematics score
Std. Deviation Std. Error Mean
Boy 1132 16.7 4.708 0.14
Girl 996 15.4 4.902 0.155
Initial investigation looking at the impact of fee levels again showed that pupils in higher fee
schools performed better on average than those in lower fee schools. However there was little
difference between very low and ultra-low cost schools.
Table 45 Mean mathematics scores by fee level
Number of pupils
Mean Mathematics
score (out of 24)
Std. error of Mean
Mean Mathematics score
as a percentage
Ultra-low 915 15.99 0.163 66.63%
Very low 927 15.97 0.157 66.54%
Low 286 16.94 0.272 70.58%
Medium 227 17.45 0.307 72.71%
Higher 32 19.97 0.569 83.21%
Total 2387 16.29 0.099 67.88%
Table 46 show mathematics scores by fee level, management type and gender, for low, very low
and ultra-low fee schools. It is interesting to note that the gender differences appear greatest in
the schools with the very low and ultra-low fees, where this difference is significant, (the
difference is also significant in the medium fee schools). However the gender differences are not
significant in the low or higher fee schools.
Considering the different fee levels separately, the differences between the mean scores of the
different management types was not found to be significant at the 5% level.
If we consider boys and girls separately in the combined group of low, very low and ultra-low
fee schools, while we again find no significant difference between different management types
for boys, we do see that girls in the for profit schools, on average, do significantly better than
their government counterparts.
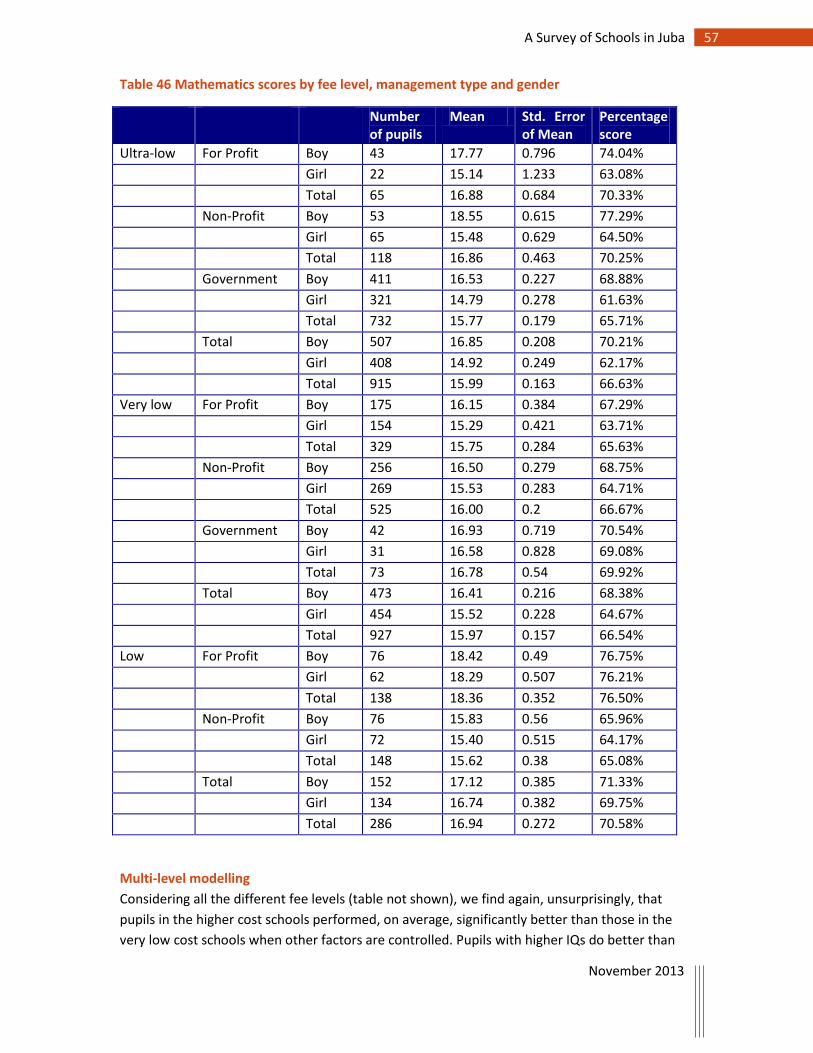
57 A Survey of Schools in Juba
November 2013
Table 46 Mathematics scores by fee level, management type and gender
Number of pupils
Mean Std. Error of Mean
Percentage score
Ultra-low For Profit Boy 43 17.77 0.796 74.04%
Girl 22 15.14 1.233 63.08%
Total 65 16.88 0.684 70.33%
Non-Profit Boy 53 18.55 0.615 77.29%
Girl 65 15.48 0.629 64.50%
Total 118 16.86 0.463 70.25%
Government Boy 411 16.53 0.227 68.88%
Girl 321 14.79 0.278 61.63%
Total 732 15.77 0.179 65.71%
Total Boy 507 16.85 0.208 70.21%
Girl 408 14.92 0.249 62.17%
Total 915 15.99 0.163 66.63%
Very low For Profit Boy 175 16.15 0.384 67.29%
Girl 154 15.29 0.421 63.71%
Total 329 15.75 0.284 65.63%
Non-Profit Boy 256 16.50 0.279 68.75%
Girl 269 15.53 0.283 64.71%
Total 525 16.00 0.2 66.67%
Government Boy 42 16.93 0.719 70.54%
Girl 31 16.58 0.828 69.08%
Total 73 16.78 0.54 69.92%
Total Boy 473 16.41 0.216 68.38%
Girl 454 15.52 0.228 64.67%
Total 927 15.97 0.157 66.54%
Low For Profit Boy 76 18.42 0.49 76.75%
Girl 62 18.29 0.507 76.21%
Total 138 18.36 0.352 76.50%
Non-Profit Boy 76 15.83 0.56 65.96%
Girl 72 15.40 0.515 64.17%
Total 148 15.62 0.38 65.08%
Total Boy 152 17.12 0.385 71.33%
Girl 134 16.74 0.382 69.75%
Total 286 16.94 0.272 70.58%
Multi-level modelling
Considering all the different fee levels (table not shown), we find again, unsurprisingly, that
pupils in the higher cost schools performed, on average, significantly better than those in the
very low cost schools when other factors are controlled. Pupils with higher IQs do better than
58 A Survey of Schools in Juba
November 2013
those with lower IQs when other factors are controlled. Age is interesting as age has a positive
coefficient, but age squared has a negative one. The negative age squared means that the
predicted score decreased the further the age of the pupil is from the mean age. But the
positive age term implies that the predicted score increases with age. Combining these shows
that the youngest pupils are likely to do poorly, as the age and the age squared terms both bring
the score down below the average. The difference between the older pupils and those of
average age is less because the age term predicts an increase in score and the age squared
predicts a decrease.
Other key variables are the class mean IQ: the positive effect of more able peers. Also the
presence of advanced school facilities is significant. Family speaking English, travelling further to
school and living in a better quality house all have significant positive effects. Girls again do less
well than boys. While having a female teacher has a negative coefficient there is insufficient
evidence to conclude the effect is significant.
When we look at the different payams we find the schools in Kator, on average, do better than
those in Juba, when other factors are controlled. In this analysis, i.e. looking at all the schools,
there is insufficient evidence to conclude that for profit or non-profit schools perform better (or
worse) than government schools, when fees are controlled.
Of greater interest is the analysis of schools that charge low, very low or ultra-low fees. Table 47
shows the results of two multi-level models, the first excluding and the second including
interaction terms. Both models show very similar results as the interaction term are not
significant at the 5% level:
1. Girls, on average, do less well than equivalent boys
2. Pupils who have higher NVR scores (IQ) tend to do better than those with lower NVR
scores.
3. Older pupils do better than younger pupils, other things being equal.
4. Pupils in classes where their peers have higher NVR scores (IQ) tend to do better than
similar pupils in classes with lower NVR scoring peers. The fact that this is significant in
mathematics, but not in reading or spelling, may suggest that pupils interact and learn
from each other more in mathematics than they do in reading or spelling. However
further research would be needed to ascertain if this is the case.
5. There is some evidence (at 10% level) that the eldest and youngest children do less well
than those in the middle of the family.
6. Pupils with a female teacher tend, on average, to do worse than equivalent pupils with a
male teacher.
7. If the mother is a trader, then the pupil tends to do better than equivalent pupils with a
housewife mother or a mother with other skilled or unskilled work. It is interesting to
speculate why this might be the case: perhaps such pupils learn arithmetical skills from
helping their mothers with stock and monetary transactions; or their mothers have
improved numerical skills acquired through trade which they use to help their children;
59 A Survey of Schools in Juba
November 2013
or finally the mothers see the value in their children learning numerical skills because
they are valuable in their work.
8. Living in a brick building (proxy for wealth) leads to better performance than living in
semi-permanent or temporary buildings.
9. There is insufficient evidence to conclude that for profit schools do better (or worse)
than government schools when other factors are controlled.
10. The interaction terms that are significant in the reading analysis are not significant here.
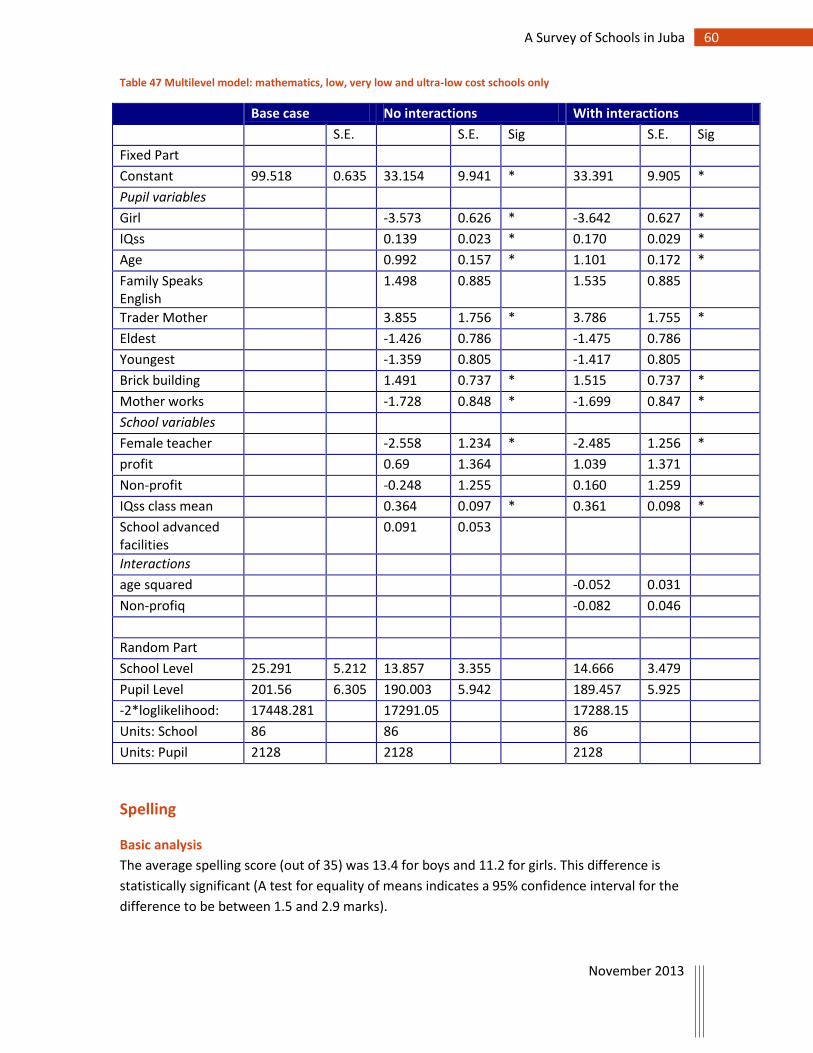
60 A Survey of Schools in Juba
November 2013
Table 47 Multilevel model: mathematics, low, very low and ultra-low cost schools only
Base case No interactions With interactions
S.E. S.E. Sig S.E. Sig
Fixed Part
Constant 99.518 0.635 33.154 9.941 * 33.391 9.905 *
Pupil variables
Girl -3.573 0.626 * -3.642 0.627 *
IQss 0.139 0.023 * 0.170 0.029 *
Age 0.992 0.157 * 1.101 0.172 *
Family Speaks English
1.498 0.885 1.535 0.885
Trader Mother 3.855 1.756 * 3.786 1.755 *
Eldest -1.426 0.786 -1.475 0.786
Youngest -1.359 0.805 -1.417 0.805
Brick building 1.491 0.737 * 1.515 0.737 *
Mother works -1.728 0.848 * -1.699 0.847 *
School variables
Female teacher -2.558 1.234 * -2.485 1.256 *
profit 0.69 1.364 1.039 1.371
Non-profit -0.248 1.255 0.160 1.259
IQss class mean 0.364 0.097 * 0.361 0.098 *
School advanced facilities
0.091 0.053
Interactions
age squared -0.052 0.031
Non-profiq -0.082 0.046
Random Part
School Level 25.291 5.212 13.857 3.355 14.666 3.479
Pupil Level 201.56 6.305 190.003 5.942 189.457 5.925
-2*loglikelihood: 17448.281 17291.05 17288.15
Units: School 86 86 86
Units: Pupil 2128 2128 2128
Spelling
Basic analysis
The average spelling score (out of 35) was 13.4 for boys and 11.2 for girls. This difference is
statistically significant (A test for equality of means indicates a 95% confidence interval for the
difference to be between 1.5 and 2.9 marks).
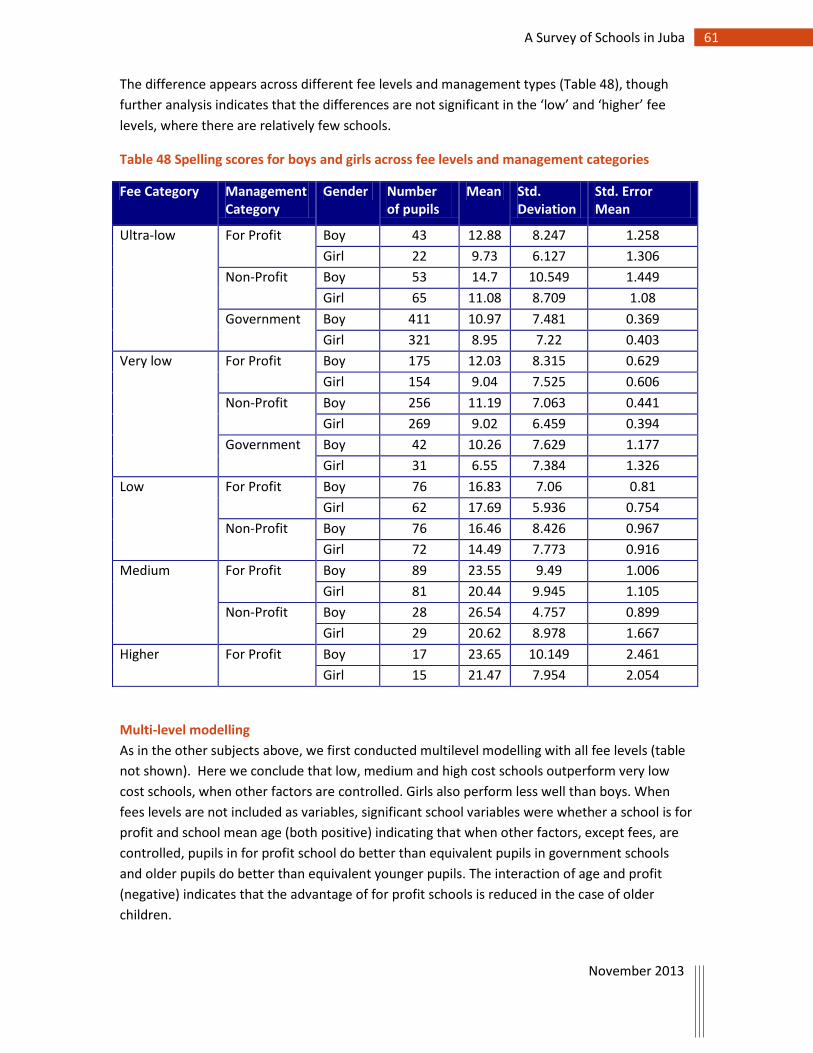
61 A Survey of Schools in Juba
November 2013
The difference appears across different fee levels and management types (Table 48), though
further analysis indicates that the differences are not significant in the ‘low’ and ‘higher’ fee
levels, where there are relatively few schools.
Table 48 Spelling scores for boys and girls across fee levels and management categories
Fee Category Management Category
Gender Number of pupils
Mean Std. Deviation
Std. Error Mean
Ultra-low For Profit Boy 43 12.88 8.247 1.258
Girl 22 9.73 6.127 1.306
Non-Profit Boy 53 14.7 10.549 1.449
Girl 65 11.08 8.709 1.08
Government Boy 411 10.97 7.481 0.369
Girl 321 8.95 7.22 0.403
Very low For Profit Boy 175 12.03 8.315 0.629
Girl 154 9.04 7.525 0.606
Non-Profit Boy 256 11.19 7.063 0.441
Girl 269 9.02 6.459 0.394
Government Boy 42 10.26 7.629 1.177
Girl 31 6.55 7.384 1.326
Low For Profit Boy 76 16.83 7.06 0.81
Girl 62 17.69 5.936 0.754
Non-Profit Boy 76 16.46 8.426 0.967
Girl 72 14.49 7.773 0.916
Medium For Profit Boy 89 23.55 9.49 1.006
Girl 81 20.44 9.945 1.105
Non-Profit Boy 28 26.54 4.757 0.899
Girl 29 20.62 8.978 1.667
Higher For Profit Boy 17 23.65 10.149 2.461
Girl 15 21.47 7.954 2.054
Multi-level modelling
As in the other subjects above, we first conducted multilevel modelling with all fee levels (table
not shown). Here we conclude that low, medium and high cost schools outperform very low
cost schools, when other factors are controlled. Girls also perform less well than boys. When
fees levels are not included as variables, significant school variables were whether a school is for
profit and school mean age (both positive) indicating that when other factors, except fees, are
controlled, pupils in for profit school do better than equivalent pupils in government schools
and older pupils do better than equivalent younger pupils. The interaction of age and profit
(negative) indicates that the advantage of for profit schools is reduced in the case of older
children.
62 A Survey of Schools in Juba
November 2013
Pupil variables that were significant were age, family speaks English and living in a brick building
(all positive) and girls and being the youngest in the family (both negative).
The second multilevel model concentrates only on schools with low, very low and ultra-low fees
(Table 49). In this model we find that no school variables are significant. With regard to location,
there was no evidence of any differences between payams. While for profit and non-profit both
had positive coefficients they were not significant and so there was insufficient evidence to
conclude that these schools do better than the government schools. When the pupils’ variables
are considered, we find that pupils with individually higher IQs (NVR) scores tend to do better
than those with lower scores when other factors are controlled, but the class mean IQ was not a
significant variable. This may be that pupils have an impact on each other in mathematics but
spelling is more individually determined. There are strong indications that the older children
may do better, but the evidence is just short of significant at the 5% level. The age profit
interaction is negative and approaching significance, but there was insufficient evidence that
these schools do better with younger children. Girls tend to do worse (significant) when other
factors are controlled.
There were a number of school factors that were not significant and these included teacher
training and teacher experience, the number of children in the class, the use of text books or
exercise books, female teachers and the presence of more of the basic or advanced equipment.
Pupils from families with the ability to speak English tended to perform better when other
factors were controlled. Also children from better quality houses performed (significantly)
better. Neither the number of siblings nor either of the household wealth factors was
significant. None of the mother’s employment roles were significant and it was only the children
whose fathers worked in an office/government who performed better when other factors were
controlled. No other employment was significant. Children who were the youngest in the family
tended to do less well than those who were the eldest or a middle child.
Further analysis suggested that the indication of positive impact of being a for profit school was
not due to the presence of more of the advanced or more of the basic equipment as the for
profit coefficient increased and became closer to being significant when these factors were
included in the model.
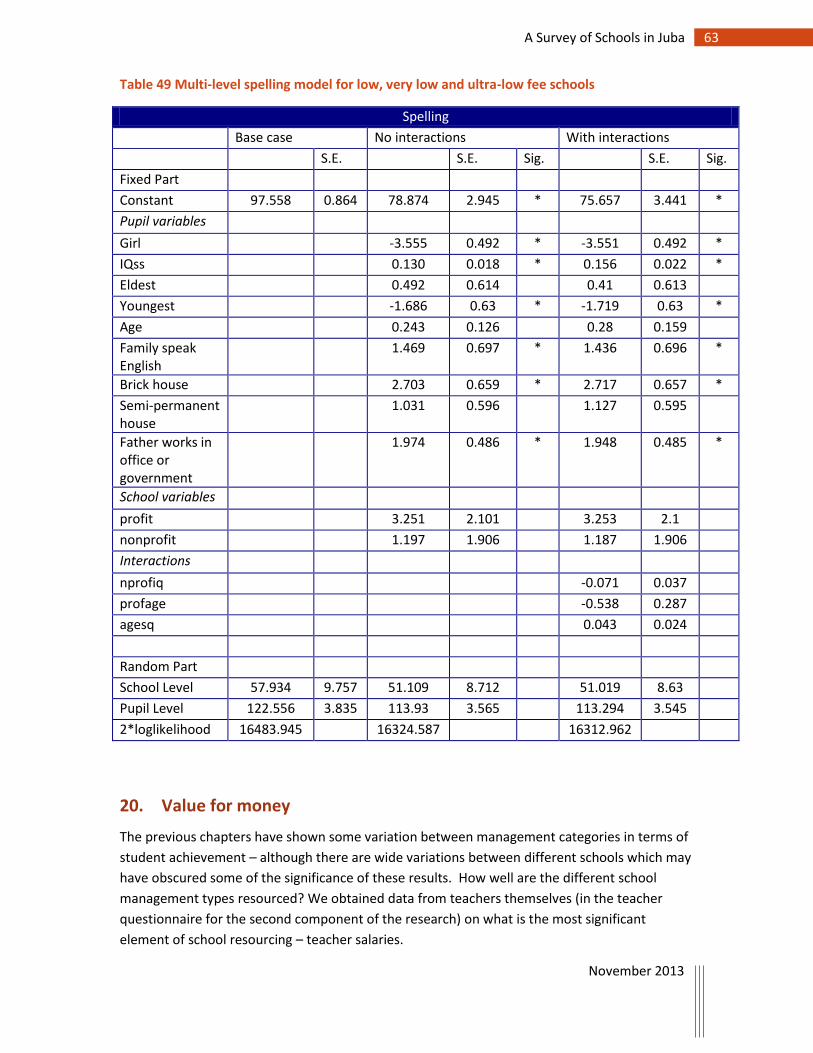
63 A Survey of Schools in Juba
November 2013
Table 49 Multi-level spelling model for low, very low and ultra-low fee schools
Spelling
Base case No interactions With interactions
S.E. S.E. Sig. S.E. Sig.
Fixed Part
Constant 97.558 0.864 78.874 2.945 * 75.657 3.441 *
Pupil variables
Girl -3.555 0.492 * -3.551 0.492 *
IQss 0.130 0.018 * 0.156 0.022 *
Eldest 0.492 0.614 0.41 0.613
Youngest -1.686 0.63 * -1.719 0.63 *
Age 0.243 0.126 0.28 0.159
Family speak English
1.469 0.697 * 1.436 0.696 *
Brick house 2.703 0.659 * 2.717 0.657 *
Semi-permanent house
1.031 0.596 1.127 0.595
Father works in office or government
1.974 0.486 * 1.948 0.485 *
School variables
profit 3.251 2.101 3.253 2.1
nonprofit 1.197 1.906 1.187 1.906
Interactions
nprofiq -0.071 0.037
profage -0.538 0.287
agesq 0.043 0.024
Random Part
School Level 57.934 9.757 51.109 8.712 51.019 8.63
Pupil Level 122.556 3.835 113.93 3.565 113.294 3.545
2*loglikelihood 16483.945 16324.587 16312.962
20. Value for money
The previous chapters have shown some variation between management categories in terms of
student achievement – although there are wide variations between different schools which may
have obscured some of the significance of these results. How well are the different school
management types resourced? We obtained data from teachers themselves (in the teacher
questionnaire for the second component of the research) on what is the most significant
element of school resourcing – teacher salaries.
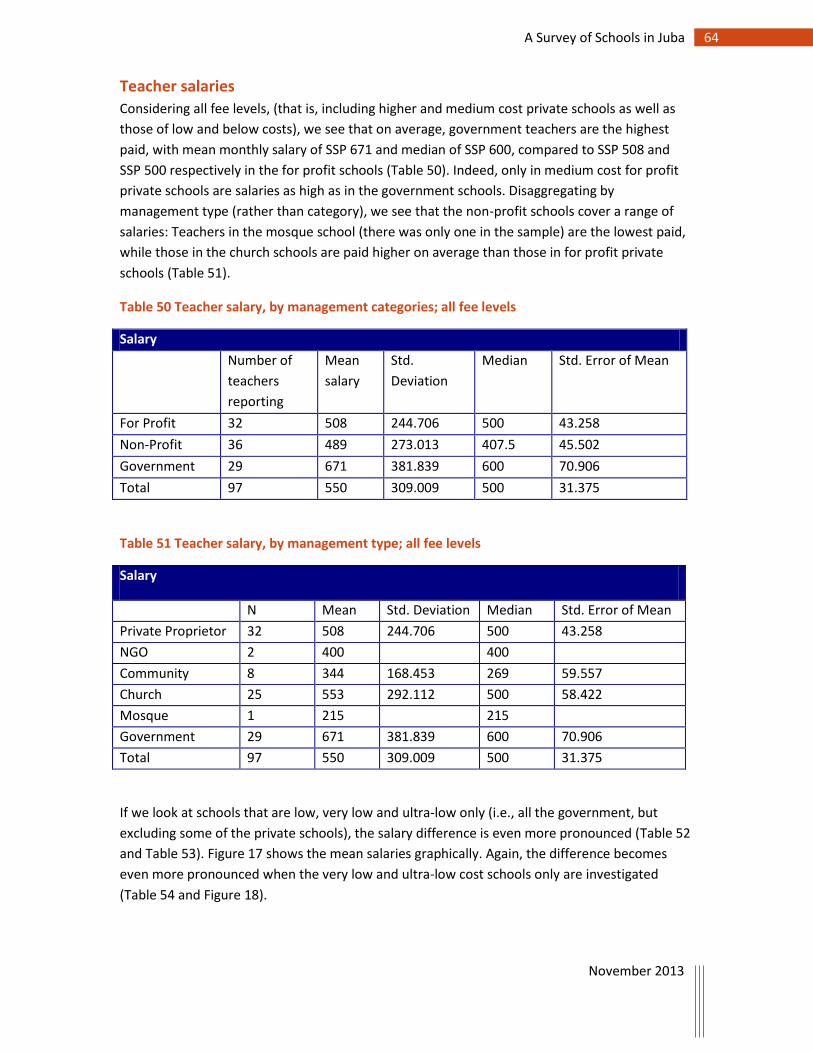
64 A Survey of Schools in Juba
November 2013
Teacher salaries
Considering all fee levels, (that is, including higher and medium cost private schools as well as
those of low and below costs), we see that on average, government teachers are the highest
paid, with mean monthly salary of SSP 671 and median of SSP 600, compared to SSP 508 and
SSP 500 respectively in the for profit schools (Table 50). Indeed, only in medium cost for profit
private schools are salaries as high as in the government schools. Disaggregating by
management type (rather than category), we see that the non-profit schools cover a range of
salaries: Teachers in the mosque school (there was only one in the sample) are the lowest paid,
while those in the church schools are paid higher on average than those in for profit private
schools (Table 51).
Table 50 Teacher salary, by management categories; all fee levels
Salary
Number of
teachers
reporting
Mean
salary
Std.
Deviation
Median Std. Error of Mean
For Profit 32 508 244.706 500 43.258
Non-Profit 36 489 273.013 407.5 45.502
Government 29 671 381.839 600 70.906
Total 97 550 309.009 500 31.375
Table 51 Teacher salary, by management type; all fee levels
Salary
N Mean Std. Deviation Median Std. Error of Mean
Private Proprietor 32 508 244.706 500 43.258
NGO 2 400 400
Community 8 344 168.453 269 59.557
Church 25 553 292.112 500 58.422
Mosque 1 215 215
Government 29 671 381.839 600 70.906
Total 97 550 309.009 500 31.375
If we look at schools that are low, very low and ultra-low only (i.e., all the government, but
excluding some of the private schools), the salary difference is even more pronounced (Table 52
and Table 53). Figure 17 shows the mean salaries graphically. Again, the difference becomes
even more pronounced when the very low and ultra-low cost schools only are investigated
(Table 54 and Figure 18).
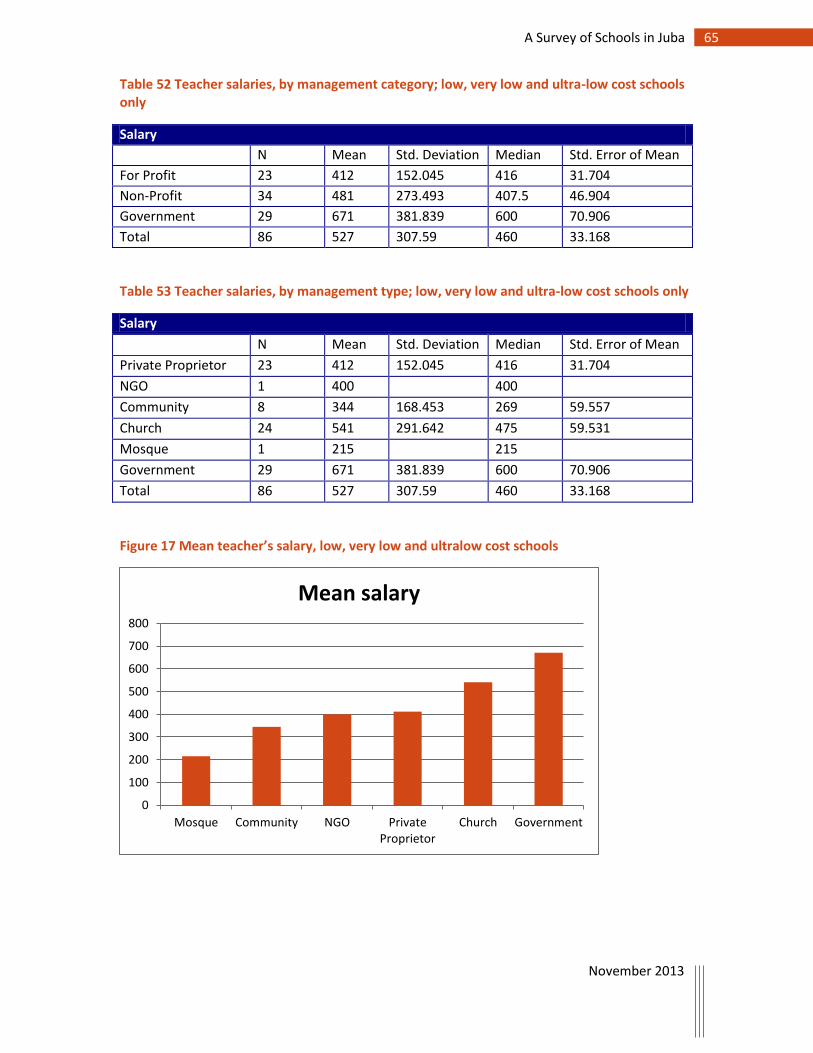
65 A Survey of Schools in Juba
November 2013
Table 52 Teacher salaries, by management category; low, very low and ultra-low cost schools only
Salary
N Mean Std. Deviation Median Std. Error of Mean
For Profit 23 412 152.045 416 31.704
Non-Profit 34 481 273.493 407.5 46.904
Government 29 671 381.839 600 70.906
Total 86 527 307.59 460 33.168
Table 53 Teacher salaries, by management type; low, very low and ultra-low cost schools only
Salary
N Mean Std. Deviation Median Std. Error of Mean
Private Proprietor 23 412 152.045 416 31.704
NGO 1 400 400
Community 8 344 168.453 269 59.557
Church 24 541 291.642 475 59.531
Mosque 1 215 215
Government 29 671 381.839 600 70.906
Total 86 527 307.59 460 33.168
Figure 17 Mean teacher’s salary, low, very low and ultralow cost schools
0
100
200
300
400
500
600
700
800
Mosque Community NGO PrivateProprietor
Church Government
Mean salary
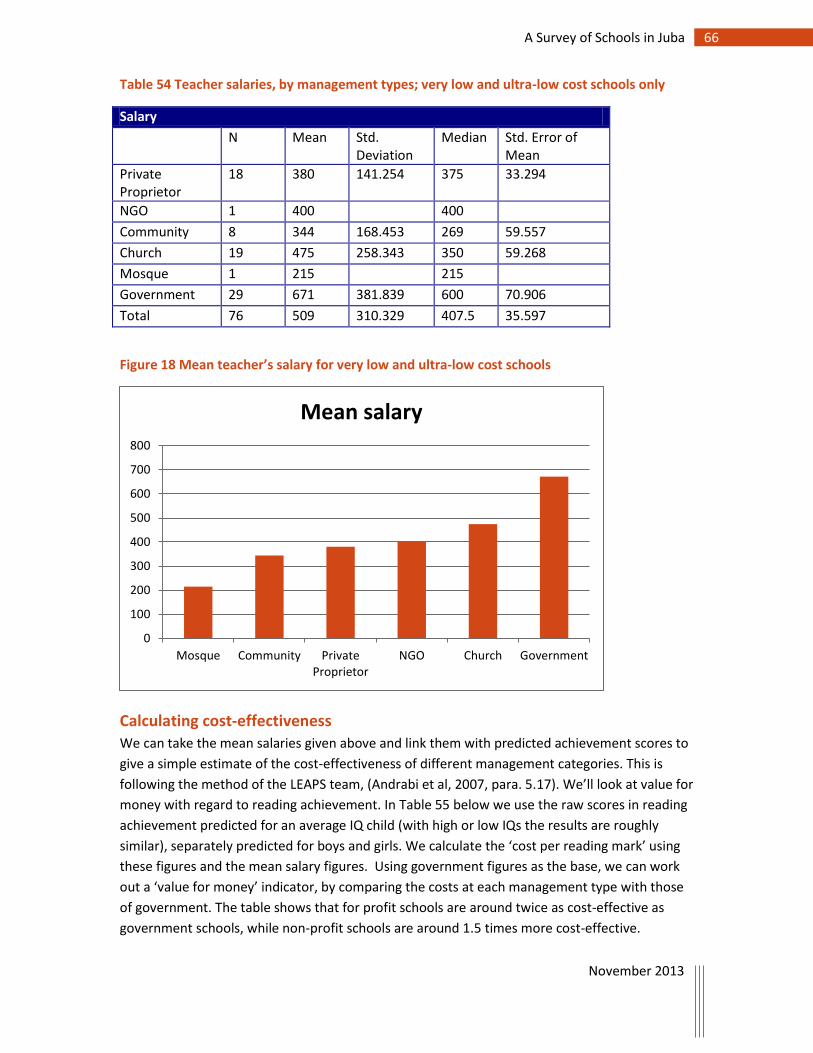
66 A Survey of Schools in Juba
November 2013
Table 54 Teacher salaries, by management types; very low and ultra-low cost schools only
Salary
N Mean Std. Deviation
Median Std. Error of Mean
Private Proprietor
18 380 141.254 375 33.294
NGO 1 400 400
Community 8 344 168.453 269 59.557
Church 19 475 258.343 350 59.268
Mosque 1 215 215
Government 29 671 381.839 600 70.906
Total 76 509 310.329 407.5 35.597
Figure 18 Mean teacher’s salary for very low and ultra-low cost schools
Calculating cost-effectiveness
We can take the mean salaries given above and link them with predicted achievement scores to
give a simple estimate of the cost-effectiveness of different management categories. This is
following the method of the LEAPS team, (Andrabi et al, 2007, para. 5.17). We’ll look at value for
money with regard to reading achievement. In Table 55 below we use the raw scores in reading
achievement predicted for an average IQ child (with high or low IQs the results are roughly
similar), separately predicted for boys and girls. We calculate the ‘cost per reading mark’ using
these figures and the mean salary figures. Using government figures as the base, we can work
out a ‘value for money’ indicator, by comparing the costs at each management type with those
of government. The table shows that for profit schools are around twice as cost-effective as
government schools, while non-profit schools are around 1.5 times more cost-effective.
0
100
200
300
400
500
600
700
800
Mosque Community PrivateProprietor
NGO Church Government
Mean salary
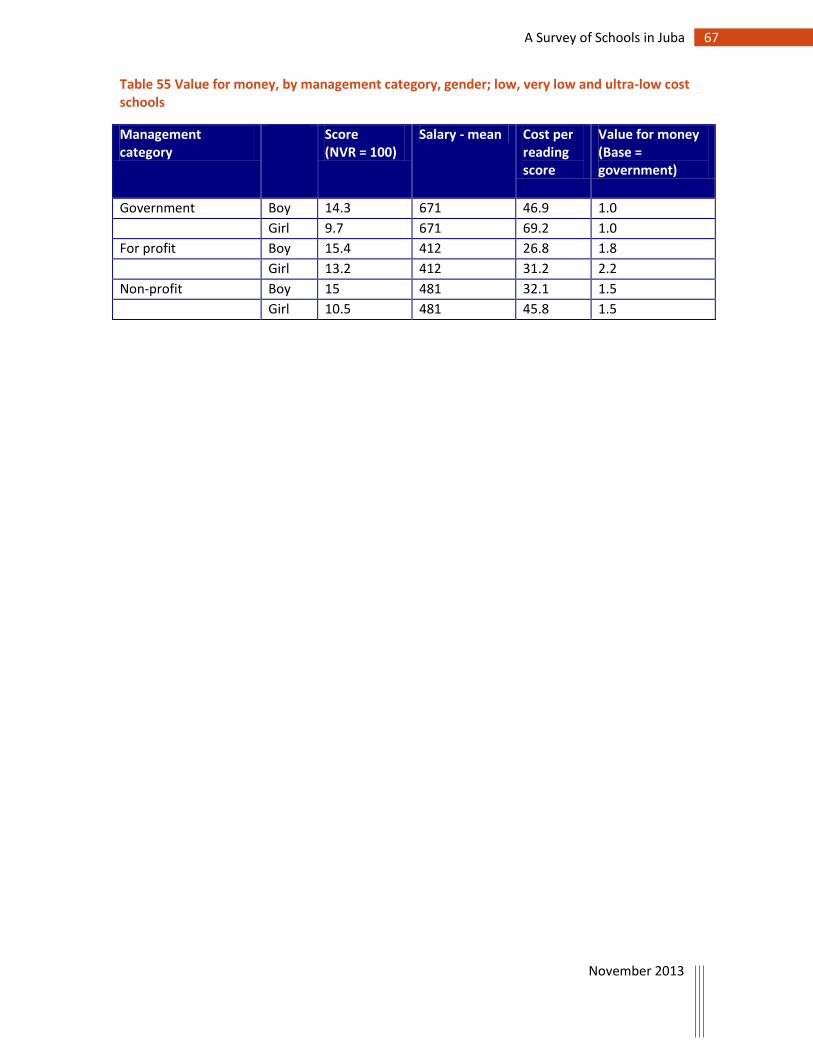
67 A Survey of Schools in Juba
November 2013
Table 55 Value for money, by management category, gender; low, very low and ultra-low cost schools
Management category
Score (NVR = 100)
Salary - mean Cost per reading score
Value for money (Base = government)
Government Boy 14.3 671 46.9 1.0
Girl 9.7 671 69.2 1.0
For profit Boy 15.4 412 26.8 1.8
Girl 13.2 412 31.2 2.2
Non-profit Boy 15 481 32.1 1.5
Girl 10.5 481 45.8 1.5
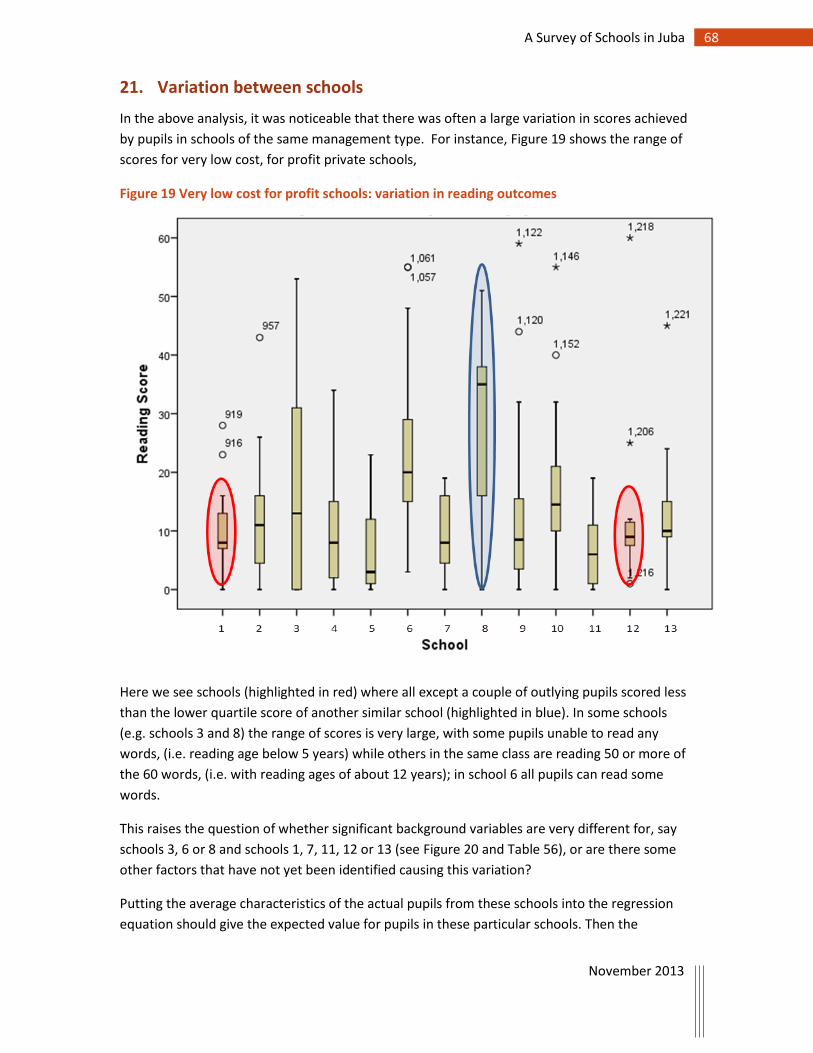
68 A Survey of Schools in Juba
November 2013
21. Variation between schools
In the above analysis, it was noticeable that there was often a large variation in scores achieved
by pupils in schools of the same management type. For instance, Figure 19 shows the range of
scores for very low cost, for profit private schools,
Figure 19 Very low cost for profit schools: variation in reading outcomes
Here we see schools (highlighted in red) where all except a couple of outlying pupils scored less
than the lower quartile score of another similar school (highlighted in blue). In some schools
(e.g. schools 3 and 8) the range of scores is very large, with some pupils unable to read any
words, (i.e. reading age below 5 years) while others in the same class are reading 50 or more of
the 60 words, (i.e. with reading ages of about 12 years); in school 6 all pupils can read some
words.
This raises the question of whether significant background variables are very different for, say
schools 3, 6 or 8 and schools 1, 7, 11, 12 or 13 (see Figure 20 and Table 56), or are there some
other factors that have not yet been identified causing this variation?
Putting the average characteristics of the actual pupils from these schools into the regression
equation should give the expected value for pupils in these particular schools. Then the
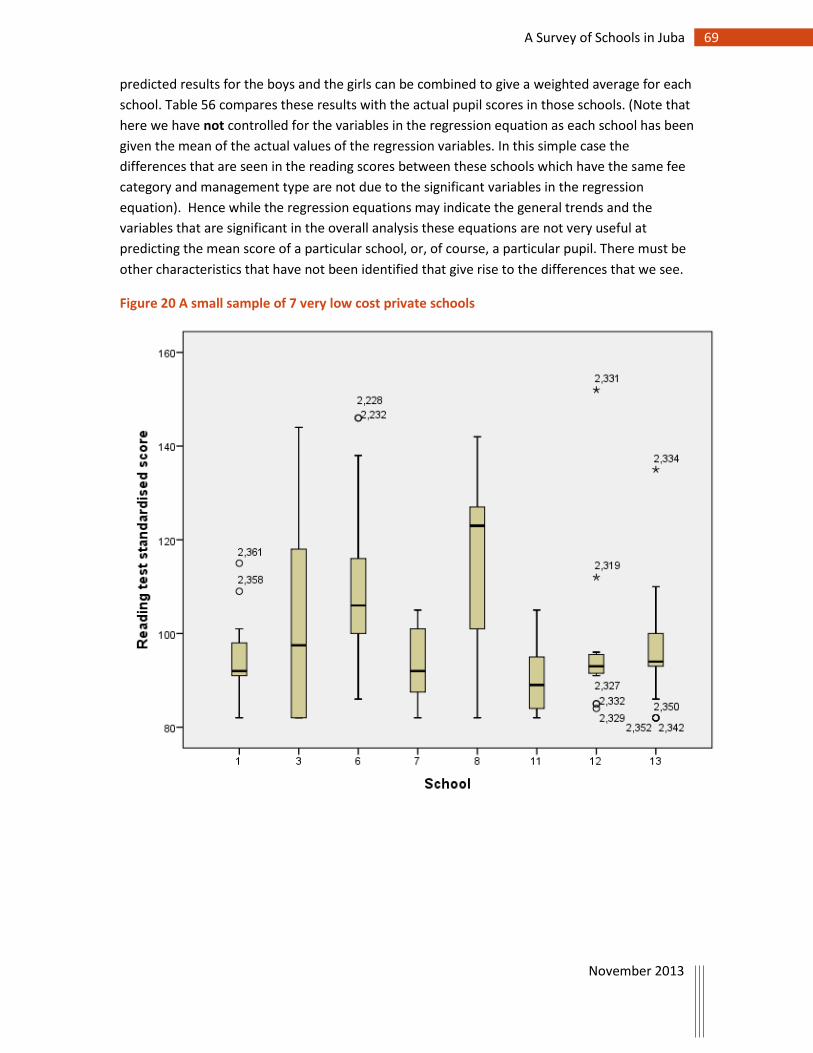
69 A Survey of Schools in Juba
November 2013
predicted results for the boys and the girls can be combined to give a weighted average for each
school. Table 56 compares these results with the actual pupil scores in those schools. (Note that
here we have not controlled for the variables in the regression equation as each school has been
given the mean of the actual values of the regression variables. In this simple case the
differences that are seen in the reading scores between these schools which have the same fee
category and management type are not due to the significant variables in the regression
equation). Hence while the regression equations may indicate the general trends and the
variables that are significant in the overall analysis these equations are not very useful at
predicting the mean score of a particular school, or, of course, a particular pupil. There must be
other characteristics that have not been identified that give rise to the differences that we see.
Figure 20 A small sample of 7 very low cost private schools
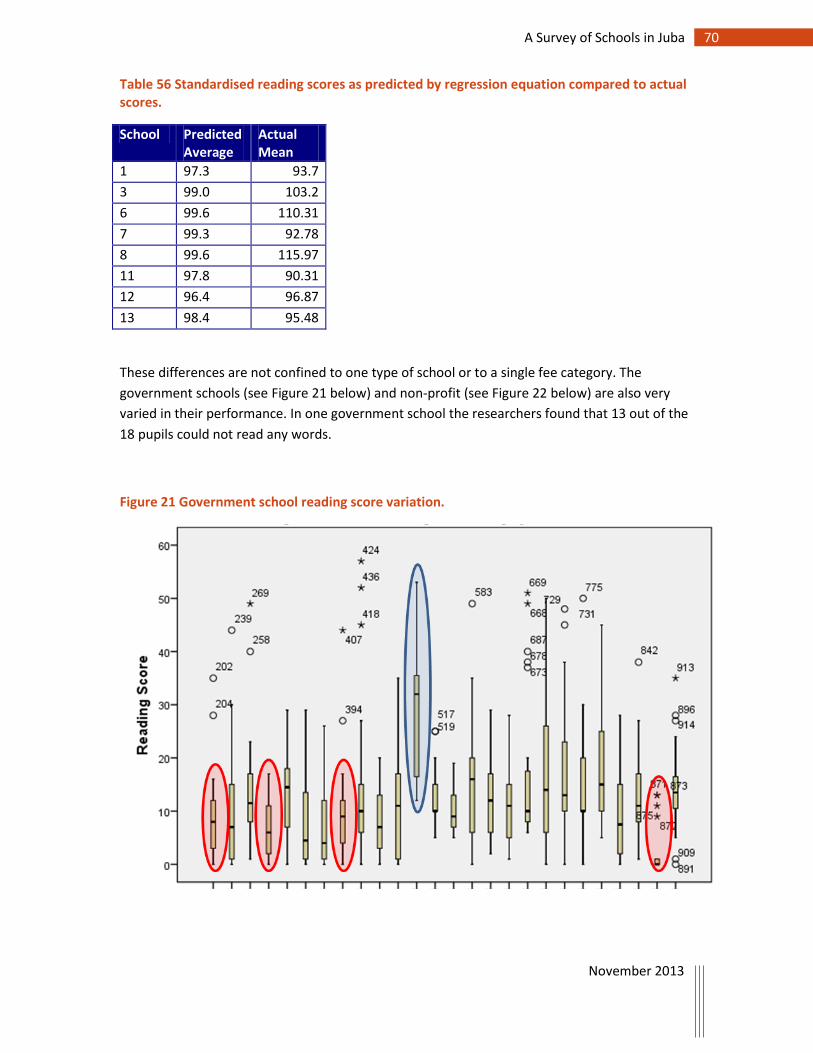
70 A Survey of Schools in Juba
November 2013
Table 56 Standardised reading scores as predicted by regression equation compared to actual scores.
School Predicted Average
Actual Mean
1 97.3 93.7
3 99.0 103.2
6 99.6 110.31
7 99.3 92.78
8 99.6 115.97
11 97.8 90.31
12 96.4 96.87
13 98.4 95.48
These differences are not confined to one type of school or to a single fee category. The
government schools (see Figure 21 below) and non-profit (see Figure 22 below) are also very
varied in their performance. In one government school the researchers found that 13 out of the
18 pupils could not read any words.
Figure 21 Government school reading score variation.
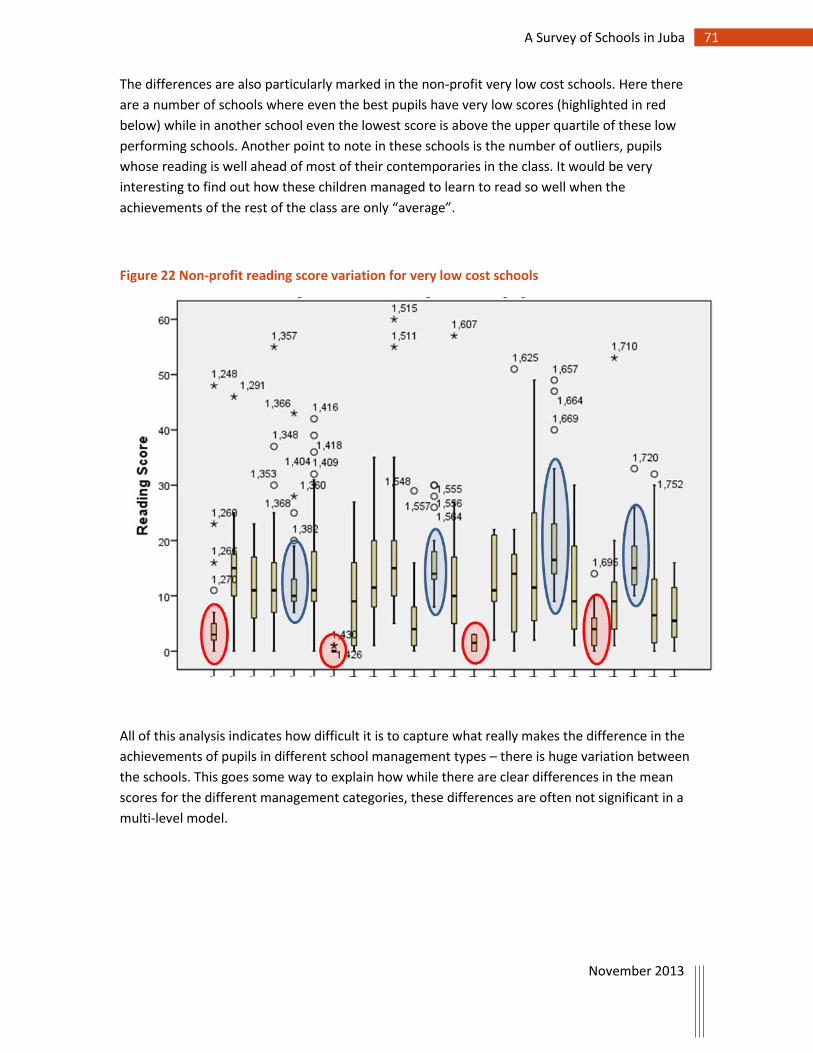
71 A Survey of Schools in Juba
November 2013
The differences are also particularly marked in the non-profit very low cost schools. Here there
are a number of schools where even the best pupils have very low scores (highlighted in red
below) while in another school even the lowest score is above the upper quartile of these low
performing schools. Another point to note in these schools is the number of outliers, pupils
whose reading is well ahead of most of their contemporaries in the class. It would be very
interesting to find out how these children managed to learn to read so well when the
achievements of the rest of the class are only “average”.
Figure 22 Non-profit reading score variation for very low cost schools
All of this analysis indicates how difficult it is to capture what really makes the difference in the
achievements of pupils in different school management types – there is huge variation between
the schools. This goes some way to explain how while there are clear differences in the mean
scores for the different management categories, these differences are often not significant in a
multi-level model.
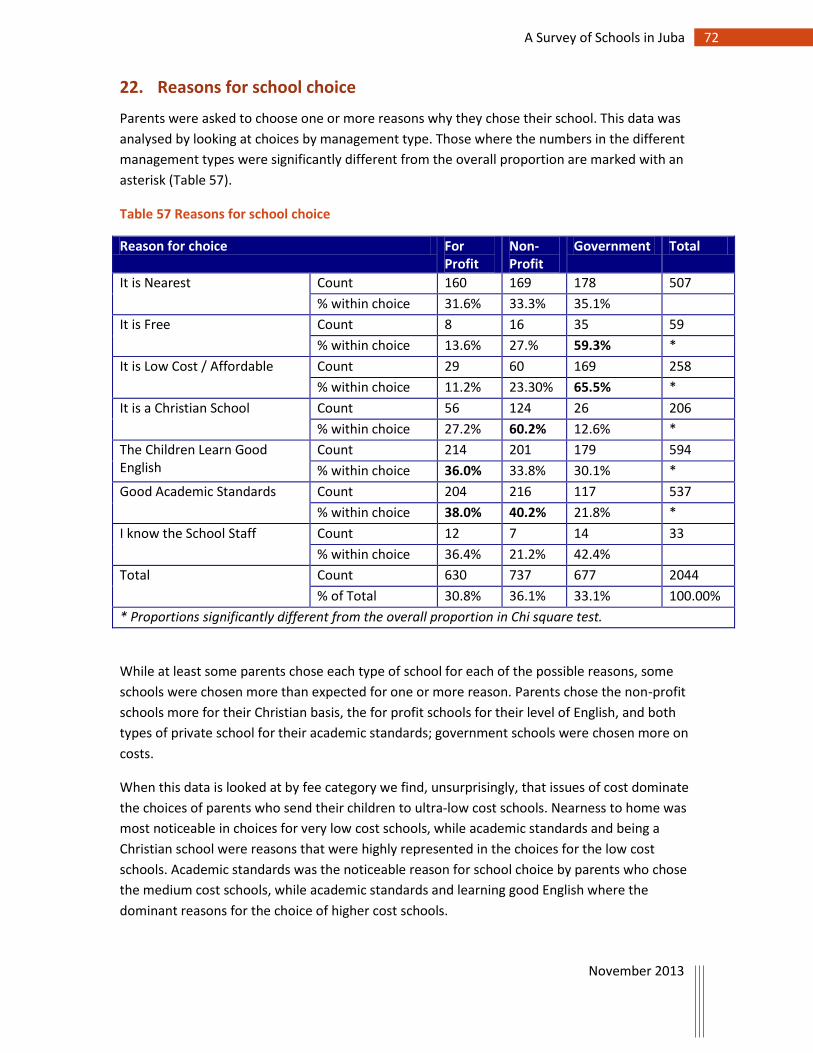
72 A Survey of Schools in Juba
November 2013
22. Reasons for school choice
Parents were asked to choose one or more reasons why they chose their school. This data was
analysed by looking at choices by management type. Those where the numbers in the different
management types were significantly different from the overall proportion are marked with an
asterisk (Table 57).
Table 57 Reasons for school choice
Reason for choice For Profit
Non-Profit
Government Total
It is Nearest Count 160 169 178 507
% within choice 31.6% 33.3% 35.1%
It is Free Count 8 16 35 59
% within choice 13.6% 27.% 59.3% *
It is Low Cost / Affordable Count 29 60 169 258
% within choice 11.2% 23.30% 65.5% *
It is a Christian School Count 56 124 26 206
% within choice 27.2% 60.2% 12.6% *
The Children Learn Good English
Count 214 201 179 594
% within choice 36.0% 33.8% 30.1% *
Good Academic Standards Count 204 216 117 537
% within choice 38.0% 40.2% 21.8% *
I know the School Staff Count 12 7 14 33
% within choice 36.4% 21.2% 42.4%
Total Count 630 737 677 2044
% of Total 30.8% 36.1% 33.1% 100.00%
* Proportions significantly different from the overall proportion in Chi square test.
While at least some parents chose each type of school for each of the possible reasons, some
schools were chosen more than expected for one or more reason. Parents chose the non-profit
schools more for their Christian basis, the for profit schools for their level of English, and both
types of private school for their academic standards; government schools were chosen more on
costs.
When this data is looked at by fee category we find, unsurprisingly, that issues of cost dominate
the choices of parents who send their children to ultra-low cost schools. Nearness to home was
most noticeable in choices for very low cost schools, while academic standards and being a
Christian school were reasons that were highly represented in the choices for the low cost
schools. Academic standards was the noticeable reason for school choice by parents who chose
the medium cost schools, while academic standards and learning good English where the
dominant reasons for the choice of higher cost schools.
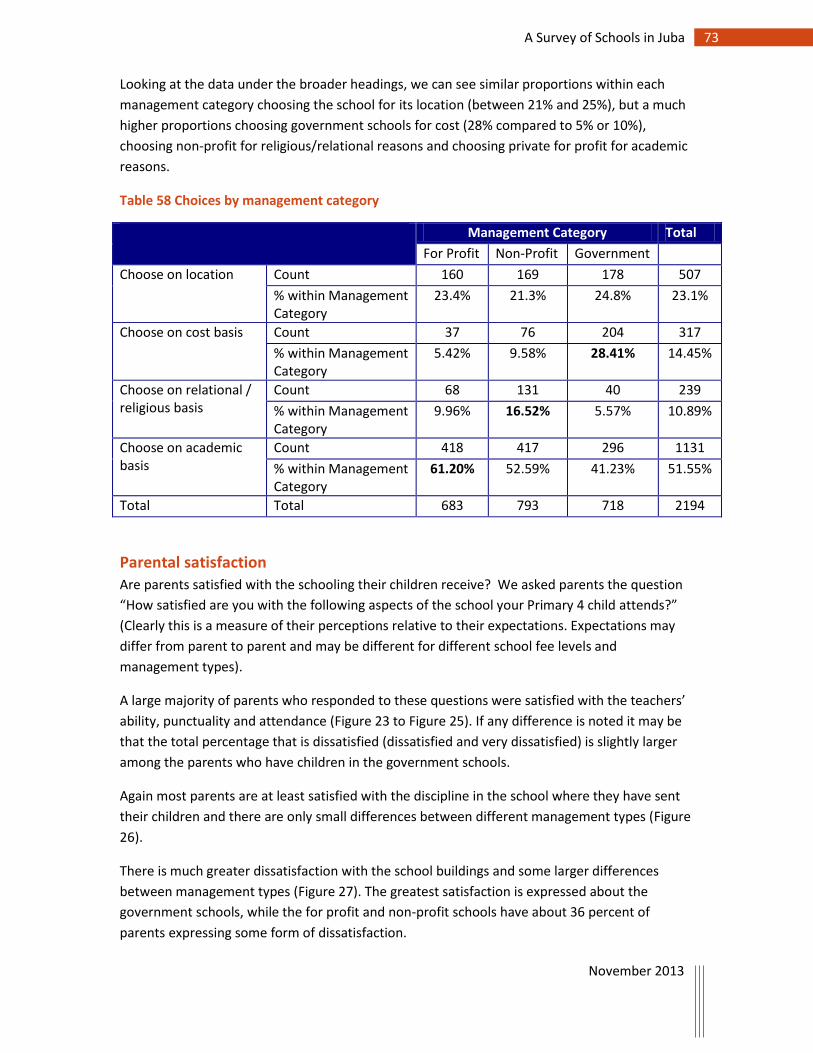
73 A Survey of Schools in Juba
November 2013
Looking at the data under the broader headings, we can see similar proportions within each
management category choosing the school for its location (between 21% and 25%), but a much
higher proportions choosing government schools for cost (28% compared to 5% or 10%),
choosing non-profit for religious/relational reasons and choosing private for profit for academic
reasons.
Table 58 Choices by management category
Management Category Total
For Profit Non-Profit Government
Choose on location Count 160 169 178 507
% within Management Category
23.4% 21.3% 24.8% 23.1%
Choose on cost basis Count 37 76 204 317
% within Management Category
5.42% 9.58% 28.41% 14.45%
Choose on relational / religious basis
Count 68 131 40 239
% within Management Category
9.96% 16.52% 5.57% 10.89%
Choose on academic basis
Count 418 417 296 1131
% within Management Category
61.20% 52.59% 41.23% 51.55%
Total Total 683 793 718 2194
Parental satisfaction
Are parents satisfied with the schooling their children receive? We asked parents the question
“How satisfied are you with the following aspects of the school your Primary 4 child attends?”
(Clearly this is a measure of their perceptions relative to their expectations. Expectations may
differ from parent to parent and may be different for different school fee levels and
management types).
A large majority of parents who responded to these questions were satisfied with the teachers’
ability, punctuality and attendance (Figure 23 to Figure 25). If any difference is noted it may be
that the total percentage that is dissatisfied (dissatisfied and very dissatisfied) is slightly larger
among the parents who have children in the government schools.
Again most parents are at least satisfied with the discipline in the school where they have sent
their children and there are only small differences between different management types (Figure
26).
There is much greater dissatisfaction with the school buildings and some larger differences
between management types (Figure 27). The greatest satisfaction is expressed about the
government schools, while the for profit and non-profit schools have about 36 percent of
parents expressing some form of dissatisfaction.
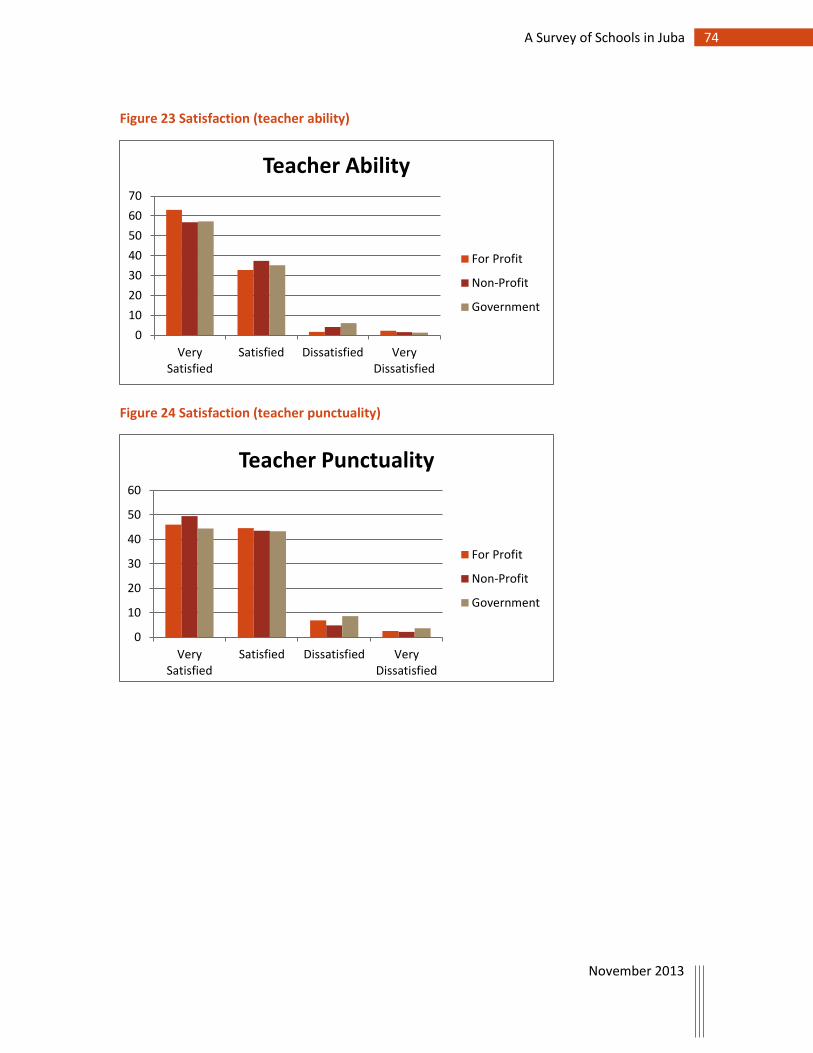
74 A Survey of Schools in Juba
November 2013
Figure 23 Satisfaction (teacher ability)
Figure 24 Satisfaction (teacher punctuality)
0
10
20
30
40
50
60
70
VerySatisfied
Satisfied Dissatisfied VeryDissatisfied
Teacher Ability
For Profit
Non-Profit
Government
0
10
20
30
40
50
60
VerySatisfied
Satisfied Dissatisfied VeryDissatisfied
Teacher Punctuality
For Profit
Non-Profit
Government
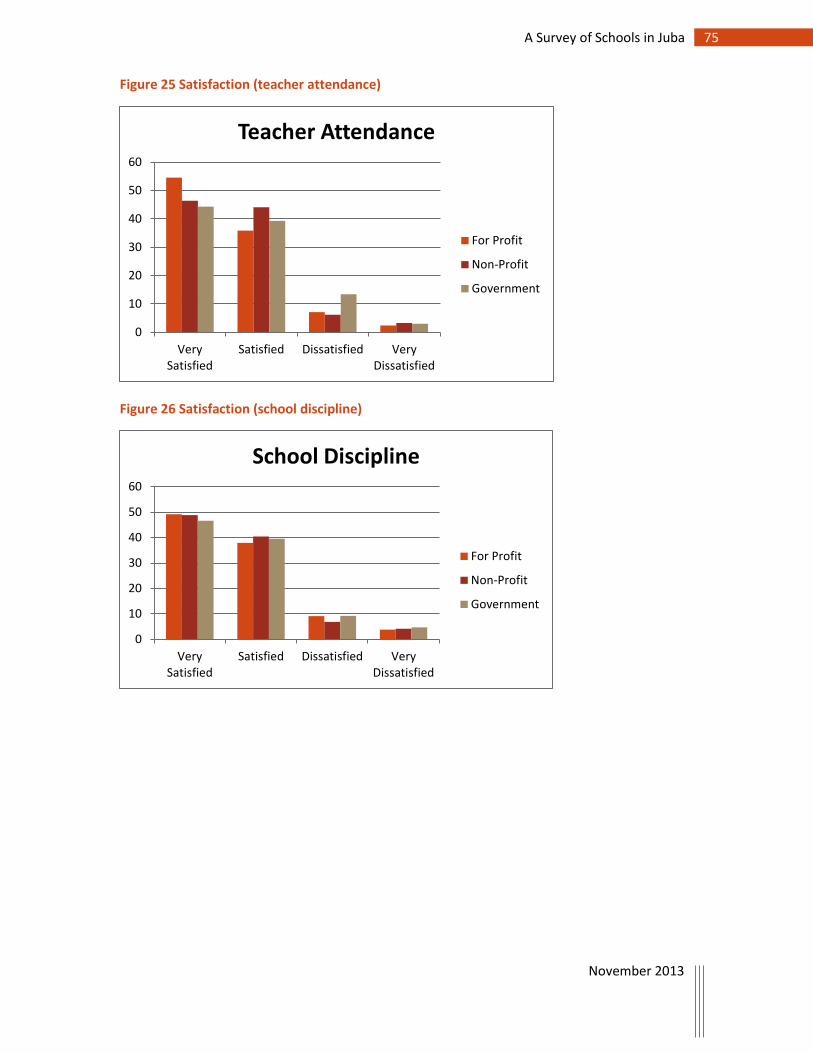
75 A Survey of Schools in Juba
November 2013
Figure 25 Satisfaction (teacher attendance)
Figure 26 Satisfaction (school discipline)
0
10
20
30
40
50
60
VerySatisfied
Satisfied Dissatisfied VeryDissatisfied
Teacher Attendance
For Profit
Non-Profit
Government
0
10
20
30
40
50
60
VerySatisfied
Satisfied Dissatisfied VeryDissatisfied
School Discipline
For Profit
Non-Profit
Government
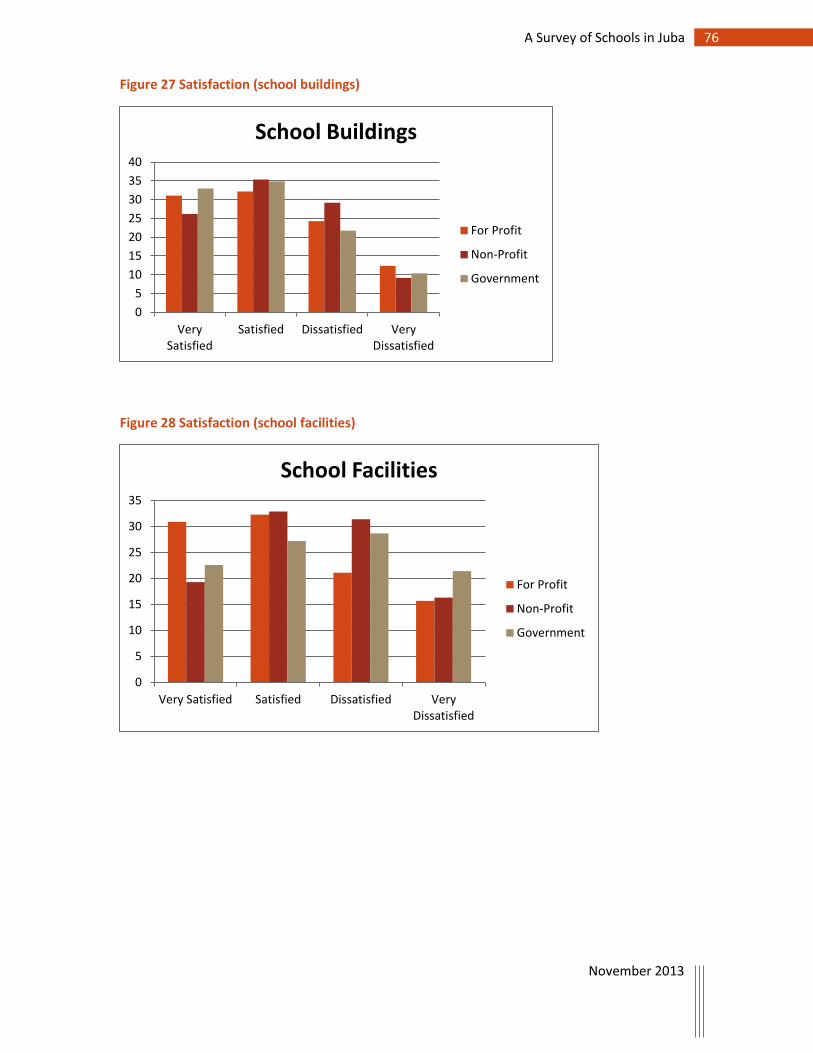
76 A Survey of Schools in Juba
November 2013
Figure 27 Satisfaction (school buildings)
Figure 28 Satisfaction (school facilities)
0
5
10
15
20
25
30
35
40
VerySatisfied
Satisfied Dissatisfied VeryDissatisfied
School Buildings
For Profit
Non-Profit
Government
0
5
10
15
20
25
30
35
Very Satisfied Satisfied Dissatisfied VeryDissatisfied
School Facilities
For Profit
Non-Profit
Government
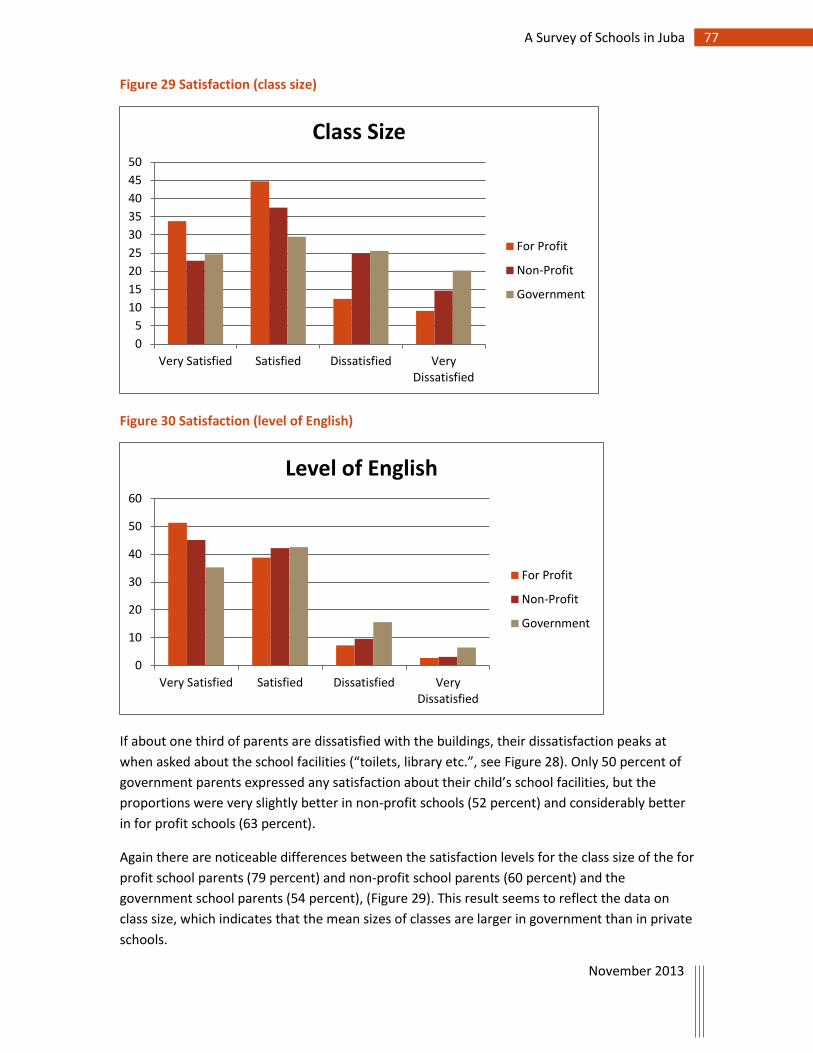
77 A Survey of Schools in Juba
November 2013
Figure 29 Satisfaction (class size)
Figure 30 Satisfaction (level of English)
If about one third of parents are dissatisfied with the buildings, their dissatisfaction peaks at
when asked about the school facilities (“toilets, library etc.”, see Figure 28). Only 50 percent of
government parents expressed any satisfaction about their child’s school facilities, but the
proportions were very slightly better in non-profit schools (52 percent) and considerably better
in for profit schools (63 percent).
Again there are noticeable differences between the satisfaction levels for the class size of the for
profit school parents (79 percent) and non-profit school parents (60 percent) and the
government school parents (54 percent), (Figure 29). This result seems to reflect the data on
class size, which indicates that the mean sizes of classes are larger in government than in private
schools.
0
5
10
15
20
25
30
35
40
45
50
Very Satisfied Satisfied Dissatisfied VeryDissatisfied
Class Size
For Profit
Non-Profit
Government
0
10
20
30
40
50
60
Very Satisfied Satisfied Dissatisfied VeryDissatisfied
Level of English
For Profit
Non-Profit
Government
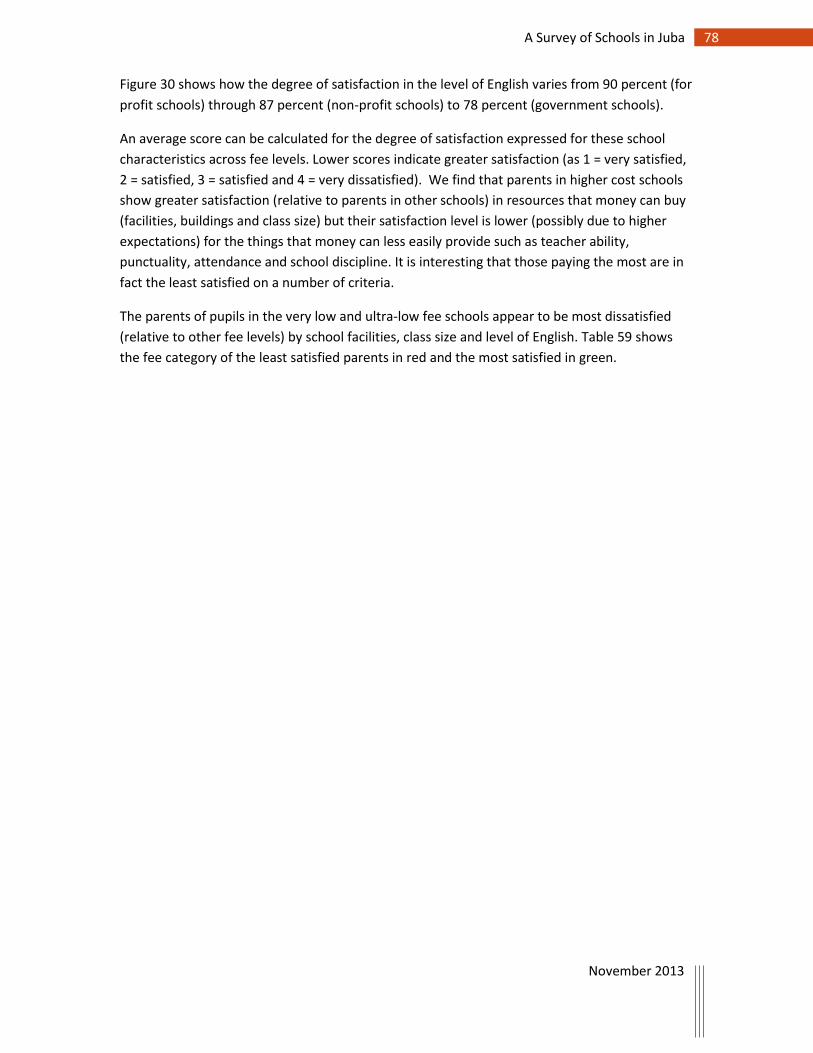
78 A Survey of Schools in Juba
November 2013
Figure 30 shows how the degree of satisfaction in the level of English varies from 90 percent (for
profit schools) through 87 percent (non-profit schools) to 78 percent (government schools).
An average score can be calculated for the degree of satisfaction expressed for these school
characteristics across fee levels. Lower scores indicate greater satisfaction (as 1 = very satisfied,
2 = satisfied, 3 = satisfied and 4 = very dissatisfied). We find that parents in higher cost schools
show greater satisfaction (relative to parents in other schools) in resources that money can buy
(facilities, buildings and class size) but their satisfaction level is lower (possibly due to higher
expectations) for the things that money can less easily provide such as teacher ability,
punctuality, attendance and school discipline. It is interesting that those paying the most are in
fact the least satisfied on a number of criteria.
The parents of pupils in the very low and ultra-low fee schools appear to be most dissatisfied
(relative to other fee levels) by school facilities, class size and level of English. Table 59 shows
the fee category of the least satisfied parents in red and the most satisfied in green.
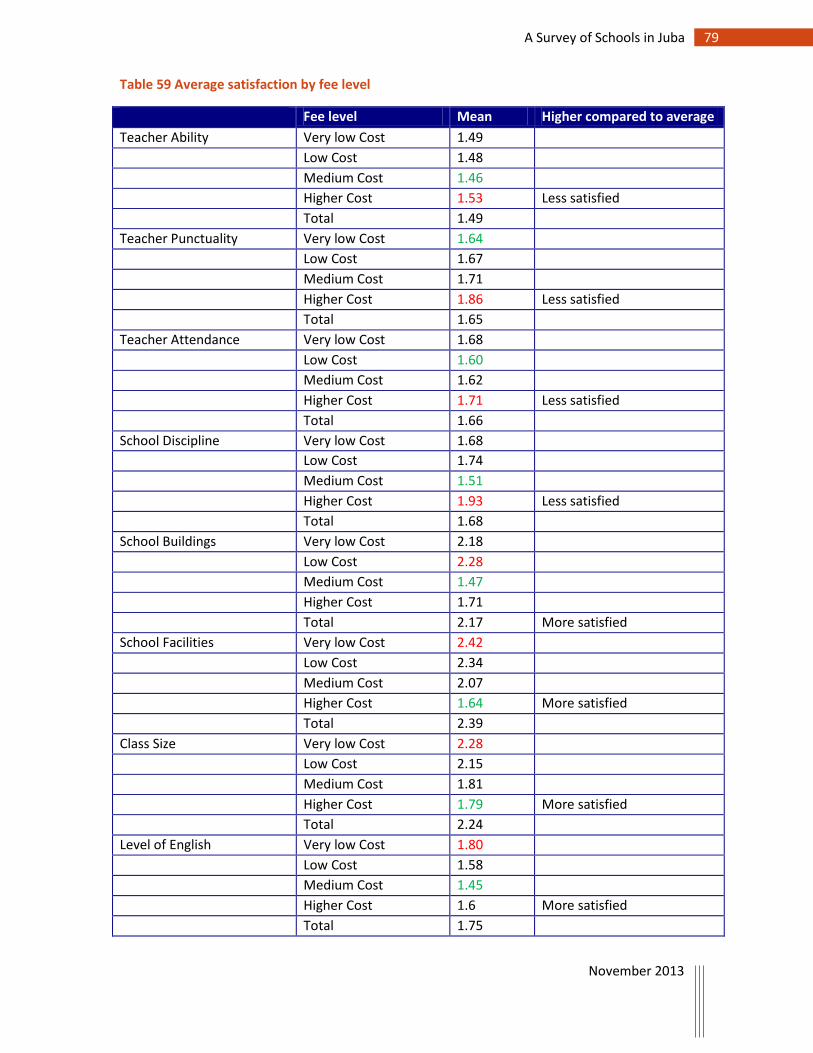
79 A Survey of Schools in Juba
November 2013
Table 59 Average satisfaction by fee level
Fee level Mean Higher compared to average
Teacher Ability Very low Cost 1.49
Low Cost 1.48
Medium Cost 1.46
Higher Cost 1.53 Less satisfied
Total 1.49
Teacher Punctuality Very low Cost 1.64
Low Cost 1.67
Medium Cost 1.71
Higher Cost 1.86 Less satisfied
Total 1.65
Teacher Attendance Very low Cost 1.68
Low Cost 1.60
Medium Cost 1.62
Higher Cost 1.71 Less satisfied
Total 1.66
School Discipline Very low Cost 1.68
Low Cost 1.74
Medium Cost 1.51
Higher Cost 1.93 Less satisfied
Total 1.68
School Buildings Very low Cost 2.18
Low Cost 2.28
Medium Cost 1.47
Higher Cost 1.71
Total 2.17 More satisfied
School Facilities Very low Cost 2.42
Low Cost 2.34
Medium Cost 2.07
Higher Cost 1.64 More satisfied
Total 2.39
Class Size Very low Cost 2.28
Low Cost 2.15
Medium Cost 1.81
Higher Cost 1.79 More satisfied
Total 2.24
Level of English Very low Cost 1.80
Low Cost 1.58
Medium Cost 1.45
Higher Cost 1.6 More satisfied
Total 1.75
80 A Survey of Schools in Juba
November 2013
23. Conclusion This study, exploring the role played by private education in and around Juba has revealed a
tremendous success story happening in South Sudan. Social entrepreneurs and other socially-
minded groups have set up private schools, many of which are affordable even to the poorest,
those on or below internationally recognised poverty lines in the country. Private schools are
serving the vast majority of children at nursery and primary school levels, and roughly half of all
students at secondary level. While the huge variation between schools within management
categories made it hard to find significant differences in spelling and mathematics, in reading at
least, children – especially girls – are achieving higher in for profit private schools than in
government schools. Private schools also appear to be more cost-effective than government
schools.
When we came to South Sudan to conduct this study, and talking to people about our approach
before we came, we were told that the only types of private schools we would find were those
run by churches, mosques, NGOs and communities. We have added an important fifth category
of private school – those run by private proprietors, which can be labelled ‘for profit’ private
schools. As these appear to be a relatively unfamiliar type of private school in the South Sudan
context, it may be worthwhile listing a few of their more notable attributes that have come up
in the course of the research. It is also the case that many development experts appear to be
uncomfortable with their potential role in education and development, and we anticipate a
similar response by many in South Sudan. So what does our research show about for profit
private schools?
Private for profit schools are providing significant access to children at all levels:
a. Private for profit schools are providing more schools than government or church (28.1
percent of schools, compared to 26.1 and 25.1 for government and church respectively).
b. Private for profit schools are generally smaller than other school types – suggesting they
may be closer to parents’ homes, which is a desirable feature for many parents.
c. Private for profit schools enrol a significant proportion of children – around one fifth
(19.3 percent), over half the proportion in government schools (37.4 percent).
d. At nursery school level, however, the largest proportion of both schools and pupils is
provided by private for profit schools (36.4 and 34.4 percent respectively)
e. The largest proportion of primary schools is provided equally by private for profit and
church schools (28.1 percent each), compared to 23.5 percent of government schools;
around one fifth (17.7 percent) of primary school children are in for profit schools.
f. The for profit sector provides an equal number of secondary schools to government
(around 30 percent of schools).
g. For profit private schools appear to be serving children in more ‘out of the way’ or
‘remote’ places than government schools: for profit schools are largely in payams away
81 A Survey of Schools in Juba
November 2013
from the city centre, while government schools are mostly situated in those near the
city centre.
For profit private schools are also a significant employer
a. The for profit private sector is a significant employer of teachers: Over one fifth of all
teachers are employed in the for profit private sector, almost the same as the figure in
church schools.
For profit private schools are not a drain on the treasury, nor are they favoured by international
donors
a. None of the private schools reported receiving any government financial assistance.
b. Only 1.8 percent of for profit private schools received any external donations at all,
compared to 26.1 percent of government schools.
For profit private schools are helping South Sudan meet its Millennium Development Goals,
faster than the government may realise.
a. 55.8 percent of for profit private primary schools are not on the official payam lists.
b. EMIS records only half the number of private schools that were found in our research.
c. In both cases, this is likely to underestimate the difference – we can’t be sure we found
all schools and in any case the EMIS data covers 11 more payams than we covered.
For profit private schools do not discriminate against girls
a. In for profit primary schools, 50 percent of children are girls, compared to 48 percent
girls in government schools.
b. Girls’ attendance rates are slightly higher in for profit private schools than in
government schools.
c. Girls are predicted to do much better in for profit than government schools in reading.
For profit schools are not necessarily more expensive to parents than other private school types;
many are affordable by the poorest of the poor families
a. The median annual fees in for profit schools are in fact marginally lower than in church
schools ($125.40 compared to $127.05).
b. Around one fifth of for profit private schools are ultra-low cost, that is affordable to the
poorest of the poor. Two fifths are very low cost, affordable to those on the
internationally accepted $1.25 PPP poverty line. The proportion of private proprietor
and church schools that are ultra-low cost is roughly the same (19.4 percent and 18.2
percent respectively).
82 A Survey of Schools in Juba
November 2013
For profit private schools are booming since the Comprehensive Peace Agreement, growing
faster than any other school management type
a. For profit private schools have grown 700 percent since CPA, an average growth of 35
percent per annum, compared to growth of only 4 percent per annum in government
schools.
b. For profit private schools can truly be seen as an important part of the ‘peace dividend’.
On quality and value-for money
c. For profit private schools have lower pupil-teacher ratios than government schools.
d. For profit private school teachers are present as often as those in other management
types.
e. While for profit private schools do have fewer playgrounds, in common with other
private school types, than government schools, they are more likely to provide toilets
and drinking water than government schools.
f. For reading, girls in for profit schools on average do significantly better than equivalent
girls in government schools, while for profit schools enable those with higher IQs to read
more than equivalent students in government schools. (In spelling and mathematics, the
variation between schools was too large to give statistically significant results).
g. For profit schools many be around twice as cost-effective than government schools, in
reading at least, taking into account higher teacher salaries in government schools but
lower reading scores.
Reasons for school choice
a. Parents tend to choose for profit schools for their level of English and (along with non-
profit schools) for their academic standards, compared to parents who choose
government schools more for their costs.
b. Parents are most satisfied with class size and level of English if they are using for-profit
schools, considerably more satisfied than if they are using government or non-profit
schools.
Overall, taking into account the important contributions made by both for profit and non-profit
private schools, the private contribution to education suggests a fusion of civil society and
market working together for the public good. Indeed, countries like South Sudan could be seen
as demonstrating a new model for educational development, a public-private partnership where
the private sector assists in meeting educational demand and need. This report has set out this
new phenomenon in some detail. With understanding of this contribution comes an
appreciation of the power of the private sector in education, both non-profit and for-profit, to
contribute to educational achievement, including of the poor, in South Sudan. Perhaps a major
conclusion could be that the sector can be seen as making a positive contribution to
development, and therefore is entitled to nurture and encouragement, rather than sanction and
censure.
83 A Survey of Schools in Juba
November 2013
References
Akaguri, L., & Akyeamapong, K. (2010). Public and private schooling in rural Ghana: Are the poor
being served? (Create Ghana policy brief 3), September
Andrabi, Tahir, Jishnu Das, Asim Ijaz Khwaja, Tara Vishwanath, Tristan Zajonc, and The LEAPS
Team. 2007. PAKISTAN: Learning and Educational Achievements in Punjab Schools (LEAPS):
Insights to Inform the Education Policy Debate, Executive Summary, February 20, 2007.
Ghani, A. and Lockhart, C. (2008) Fixing failed states, a framework for rebuilding a fractured
world. New York: OUP.
Government of South Sudan (GoSS) (2011) Educational Statistics for Central Equatoria. Juba:
(GoSS), G.o.S.S.
Government of Southern Sudan (2010) Southern Sudan Counts: Tables from the 5th Sudan
Population and Housing Census, 2008. Khartoum: Government of Southern Sudan.
Härmä, J. (2009). Can choice promote Education for All? Evidence from growth in private
primary schooling in India. Compare, 39(2), 151-165.
Härmä, Joanna (2010). School choice for the poor? The limits of marketisation of primary
education in rural India, CREATE Pathways to Access, Research Monograph No. 23, January
2010, University of Sussex, Centre for International Education/Education & Social Work
Härmä, J (2011a). Lagos Private School Census 2010-11 Report: Report Number LG 501,
Education Sector Support Programme in Nigeria (ESSPIN), June 2011,
http://www.esspin.org/index/php/resources/abs/lagos/296
Härmä, J (2011b). Study of Private Schools in Lagos, June 2011, Joanna Harma, Report: Report
Number LG 303, Education Sector Support Programme in Nigeria (ESSPIN), June 2011
Lewin, Keith M (2007). The Limits to Growth of Non-Government: Private Schooling in Sub
Saharan Africa. Project Report. Consortium for Research on Educational Access, Transitions and
Equity (CREATE), Falmer, UK.
MEST (2012). Making Progress – Schools and Students in Sierra Leone, The 2010/11 School
Census Report – Vol.1, Ministry of Education Science and Technology, February
Oketch, M., Mutisya, M., Ngware, M. and Ezeh, A.C. (2010). Why are there proportionately more
poor pupils enrolled in non-state schools in urban Kenya in spite of FPE policy? International
Journal of Educational Development, 30:1, 23-32.
84 A Survey of Schools in Juba
November 2013
Schagen, I. (2004). “Presenting the results of complex models – Normalised coefficients, star
wars plots and other ideas”. In But what does it mean? The use of effect sizes in educational
research, Edited by: Schagen, I. and Elliot, K. 25–41. Slough, UK: NFER
South Sudan National Bureau of Statistics (2012) South Sudan Poverty Estimates at the County
Level for 2008. Juba: SSNBS.
Southern Sudan Centre for Census, Statistics and Evaluation (2010) Statistical Yearbook for
Southern Sudan 2010. Juba: National Bureau of Statistics. [Online]. Available at:
http://ssnbs.org/statistical-year-book/.
Srivastava, P. (2013). ‘Low-fee private schooling: issues and evidence’, in P. Srivastava (Ed.), Low-
fee Private Schooling: aggravating equity or mitigating disadvantage? Oxford Studies in
Comparative Education Series. (Symposium Books, Oxford).
Related Documents


![School census 2020 to 2021 - GOV UK · 2021. 1. 15. · census only] Schools with funded on-site early years provision make their return via either the school census or the early](https://static.cupdf.com/doc/110x72/60cea38f5b8ef95797678dba/school-census-2020-to-2021-gov-uk-2021-1-15-census-only-schools-with-funded.jpg)