Resource A cell-type-specific atlas of the inner ear transcriptional response to acoustic trauma Graphical abstract Highlights d A cell-type-specific transcriptomic map of the cochlear response to noise d Noise-resilient type 1A auditory neurons upregulate the ATF3/4 pathway d Monocytes significantly alter their gene expression in response to noise exposure d STAT3/IRF7 are probable regulators of a general cochlear transcriptomic response to noise Authors Beatrice Milon, Eldad D. Shulman, Kathy S. So, ..., Joe Burns, Ran Elkon, Ronna Hertzano Correspondence [email protected] (R.E.), [email protected] (R.H.) In brief Milon et al. show that cell-type-specific transcriptomic changes following noise exposure dominate the response compared to common changes. The noise-resilient type 1A neurons induce the ATF3/ATF4 stress-response pathway, and the outer hair cells and lateral wall downregulate mRNA metabolism genes and potassium transport genes, respectively. Milon et al., 2021, Cell Reports 36, 109758 September 28, 2021 ª 2021 The Authors. https://doi.org/10.1016/j.celrep.2021.109758 ll

Welcome message from author
This document is posted to help you gain knowledge. Please leave a comment to let me know what you think about it! Share it to your friends and learn new things together.
Transcript
Resource
A cell-type-specific atlas o
f the inner eartranscriptional response to acoustic traumaGraphical abstract
Highlights
d A cell-type-specific transcriptomic map of the cochlear
response to noise
d Noise-resilient type 1A auditory neurons upregulate the
ATF3/4 pathway
d Monocytes significantly alter their gene expression in
response to noise exposure
d STAT3/IRF7 are probable regulators of a general cochlear
transcriptomic response to noise
Milon et al., 2021, Cell Reports 36, 109758September 28, 2021 ª 2021 The Authors.https://doi.org/10.1016/j.celrep.2021.109758
Authors
Beatrice Milon, Eldad D. Shulman,
Kathy S. So, ..., Joe Burns, Ran Elkon,
Ronna Hertzano
[email protected] (R.E.),[email protected] (R.H.)
In brief
Milon et al. show that cell-type-specific
transcriptomic changes following noise
exposure dominate the response
compared to common changes. The
noise-resilient type 1A neurons induce
the ATF3/ATF4 stress-response pathway,
and the outer hair cells and lateral wall
downregulate mRNA metabolism genes
and potassium transport genes,
respectively.
ll

OPEN ACCESS
llResource
A cell-type-specific atlas ofthe inner ear transcriptional responseto acoustic traumaBeatrice Milon,1,10 Eldad D. Shulman,2,10 Kathy S. So,3 Christopher R. Cederroth,4,5 Erika L. Lipford,1 Michal Sperber,2
Jonathan B. Sellon,3 Heela Sarlus,4,6 Gabriela Pregernig,3 Benjamin Shuster,1 Yang Song,7 Sunayana Mitra,1
Joshua Orvis,7 Zachary Margulies,1 Yoko Ogawa,1 Christopher Shults,1 Didier A. Depireux,8 Adam T. Palermo,3
Barbara Canlon,4 Joe Burns,3 Ran Elkon,2,* and Ronna Hertzano1,7,9,11,*1Department of Otorhinolaryngology Head and Neck Surgery, University of Maryland School of Medicine, Baltimore, MD 21201, USA2Department of Human Molecular Genetics and Biochemistry, Sackler School of Medicine, Tel Aviv University, Tel Aviv, Israel3Decibel Therapeutics, Boston, MA 02215, USA4Laboratory of Experimental Audiology, Department of Physiology and Pharmacology, Karolinska Institute, 171 77 Stockholm, Sweden5Hearing Sciences, Division of Clinical Neuroscience, School of Medicine, University of Nottingham, Nottingham NG7 2UH, UK6Applied Immunology & Immunotherapy, Neuroimmunology Unit, Department of Clinical Neuroscience, Center for Molecular Medicine,
Karolinska University Hospital, 171 77 Stockholm, Sweden7Institute for Genome Sciences, University of Maryland School of Medicine, Baltimore, MD 21201, USA8Otolith Labs, Washington, DC 20009, USA9Department of Anatomy and Neurobiology, University of Maryland School of Medicine, Baltimore, MD 21201, USA10These authors contributed equally11Lead contact*Correspondence: [email protected] (R.E.), [email protected] (R.H.)
https://doi.org/10.1016/j.celrep.2021.109758
SUMMARY
Noise-induced hearing loss (NIHL) results from a complex interplay of damage to the sensory cells of the in-ner ear, dysfunction of its lateral wall, axonal retraction of type 1C spiral ganglion neurons, and activation ofthe immune response. We use RiboTag and single-cell RNA sequencing to survey the cell-type-specificmolecular landscape of the mouse inner ear before and after noise trauma. We identify induction of the tran-scription factors STAT3 and IRF7 and immune-related genes across all cell-types. Yet, cell-type-specifictranscriptomic changes dominate the response. The ATF3/ATF4 stress-response pathway is robustlyinduced in the type 1A noise-resilient neurons, potassium transport genes are downregulated in the lateralwall, mRNA metabolism genes are downregulated in outer hair cells, and deafness-associated genes aredownregulated in most cell types. This transcriptomic resource is available via the Gene Expression AnalysisResource (gEAR; https://umgear.org/NIHL) and provides a blueprint for the rational development of drugs toprevent and treat NIHL.
INTRODUCTION
Hearing loss afflicts nearly 1.57 billion people worldwide, and the
incidence is expected to rise as a result of the increase in life ex-
pectancy and recreational noise exposures (Cederroth et al.,
2013;GBD2019Hearing LossCollaborators, 2021). Themamma-
lian inner ear houses the cochlea, the intricate organ of hearing,
which is comprised of at least four distinct functional domains
(sensory epithelium, neuronal compartment, lateral wall [LW],
and immune cells; Figure 1A). The sensory epithelium consists
of mechanosensitive inner and outer hair cells (IHCs and OHCs,
respectively), aswell as aheterogeneouspopulationof supporting
cells (SCs). IHCs transmit sensory information to neurons via glu-
tamatergic ribbon synapses, while OHCs primarily amplify and
sharpen the sound stimulus (McPherson, 2018). SCs participate
in ion recycling, structural support and repair, and are akin to the
CeThis is an open access article under the CC BY-N
glial cells in the brain (Monzack and Cunningham, 2013; Wan
et al., 2013). The spiral ganglion neurons (SGNs) consist of type
1 and 2 neurons, which transmit information from the IHCs and
OHCs, respectively. Based on threshold and spontaneous rate,
type 1 SGNs are further subclassified into three types (1A, 1B,
and 1C), where type 1C are lost following noise exposure and ag-
ing and are believed to be important for hearing in the presence of
competing noise (Shrestha et al., 2018; Sun et al., 2018). The LW
consists of the stria vascularis (SV) and the spiral ligament. TheSV
contains three cell types (marginal, intermediate, and basal),
which generate and maintain the endocochlear potential (EP) by
secreting potassium ions into the endolymph (Wangemann,
2002). The spiral ligament consists of threecell types (perivascular
endothelial cells, root cells, and fibrocytes), and together with the
SV, function tomaintain the EP. Finally, immune cells play a role in
the inner ear response to damage (Warchol, 2019).
ll Reports 36, 109758, September 28, 2021 ª 2021 The Authors. 1C-ND license (http://creativecommons.org/licenses/by-nc-nd/4.0/).
(legend on next page)
2 Cell Reports 36, 109758, September 28, 2021
Resourcell
OPEN ACCESS
Resourcell
OPEN ACCESS
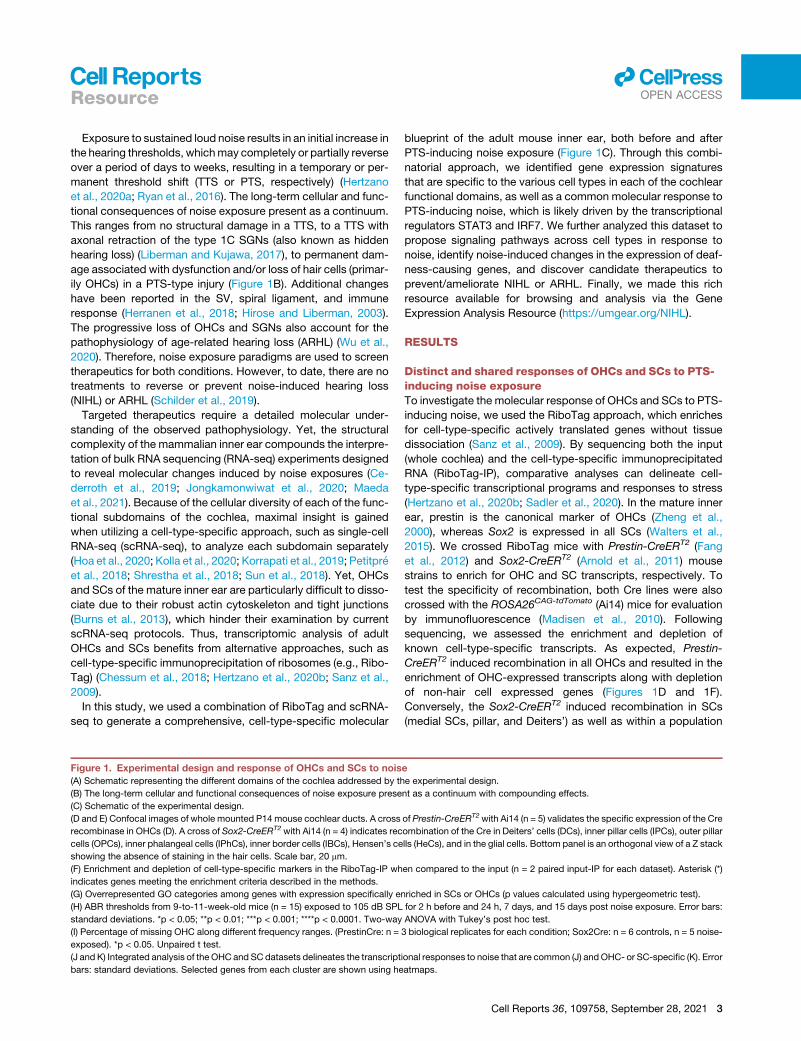
Exposure to sustained loud noise results in an initial increase in
the hearing thresholds, whichmay completely or partially reverse
over a period of days to weeks, resulting in a temporary or per-
manent threshold shift (TTS or PTS, respectively) (Hertzano
et al., 2020a; Ryan et al., 2016). The long-term cellular and func-
tional consequences of noise exposure present as a continuum.
This ranges from no structural damage in a TTS, to a TTS with
axonal retraction of the type 1C SGNs (also known as hidden
hearing loss) (Liberman and Kujawa, 2017), to permanent dam-
age associated with dysfunction and/or loss of hair cells (primar-
ily OHCs) in a PTS-type injury (Figure 1B). Additional changes
have been reported in the SV, spiral ligament, and immune
response (Herranen et al., 2018; Hirose and Liberman, 2003).
The progressive loss of OHCs and SGNs also account for the
pathophysiology of age-related hearing loss (ARHL) (Wu et al.,
2020). Therefore, noise exposure paradigms are used to screen
therapeutics for both conditions. However, to date, there are no
treatments to reverse or prevent noise-induced hearing loss
(NIHL) or ARHL (Schilder et al., 2019).
Targeted therapeutics require a detailed molecular under-
standing of the observed pathophysiology. Yet, the structural
complexity of the mammalian inner ear compounds the interpre-
tation of bulk RNA sequencing (RNA-seq) experiments designed
to reveal molecular changes induced by noise exposures (Ce-
derroth et al., 2019; Jongkamonwiwat et al., 2020; Maeda
et al., 2021). Because of the cellular diversity of each of the func-
tional subdomains of the cochlea, maximal insight is gained
when utilizing a cell-type-specific approach, such as single-cell
RNA-seq (scRNA-seq), to analyze each subdomain separately
(Hoa et al., 2020; Kolla et al., 2020; Korrapati et al., 2019; Petitpre
et al., 2018; Shrestha et al., 2018; Sun et al., 2018). Yet, OHCs
and SCs of the mature inner ear are particularly difficult to disso-
ciate due to their robust actin cytoskeleton and tight junctions
(Burns et al., 2013), which hinder their examination by current
scRNA-seq protocols. Thus, transcriptomic analysis of adult
OHCs and SCs benefits from alternative approaches, such as
cell-type-specific immunoprecipitation of ribosomes (e.g., Ribo-
Tag) (Chessum et al., 2018; Hertzano et al., 2020b; Sanz et al.,
2009).
In this study, we used a combination of RiboTag and scRNA-
seq to generate a comprehensive, cell-type-specific molecular
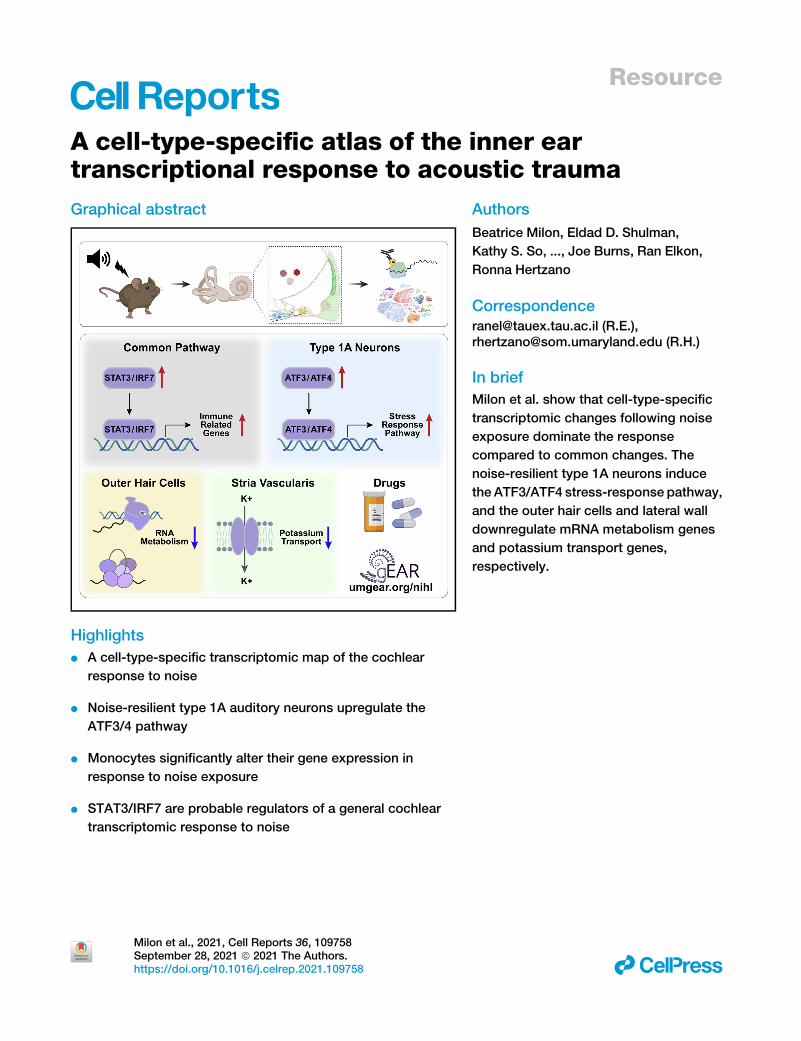
Figure 1. Experimental design and response of OHCs and SCs to nois
(A) Schematic representing the different domains of the cochlea addressed by th
(B) The long-term cellular and functional consequences of noise exposure prese
(C) Schematic of the experimental design.
(D and E) Confocal images of whole mounted P14 mouse cochlear ducts. A cross
recombinase in OHCs (D). A cross of Sox2-CreERT2 with Ai14 (n = 4) indicates rec
cells (OPCs), inner phalangeal cells (IPhCs), inner border cells (IBCs), Hensen’s ce
showing the absence of staining in the hair cells. Scale bar, 20 mm.
(F) Enrichment and depletion of cell-type-specific markers in the RiboTag-IP wh
indicates genes meeting the enrichment criteria described in the methods.
(G) Overrepresented GO categories among genes with expression specifically e
(H) ABR thresholds from 9-to-11-week-old mice (n = 15) exposed to 105 dB SPL
standard deviations. *p < 0.05; **p < 0.01; ***p < 0.001; ****p < 0.0001. Two-way
(I) Percentage of missing OHC along different frequency ranges. (PrestinCre: n =
exposed). *p < 0.05. Unpaired t test.
(J and K) Integrated analysis of the OHC and SC datasets delineates the transcript
bars: standard deviations. Selected genes from each cluster are shown using he
blueprint of the adult mouse inner ear, both before and after
PTS-inducing noise exposure (Figure 1C). Through this combi-
natorial approach, we identified gene expression signatures
that are specific to the various cell types in each of the cochlear
functional domains, as well as a common molecular response to
PTS-inducing noise, which is likely driven by the transcriptional
regulators STAT3 and IRF7. We further analyzed this dataset to
propose signaling pathways across cell types in response to
noise, identify noise-induced changes in the expression of deaf-
ness-causing genes, and discover candidate therapeutics to
prevent/ameliorate NIHL or ARHL. Finally, we made this rich
resource available for browsing and analysis via the Gene
Expression Analysis Resource (https://umgear.org/NIHL).
RESULTS
Distinct and shared responses of OHCs and SCs to PTS-inducing noise exposureTo investigate the molecular response of OHCs and SCs to PTS-
inducing noise, we used the RiboTag approach, which enriches
for cell-type-specific actively translated genes without tissue
dissociation (Sanz et al., 2009). By sequencing both the input
(whole cochlea) and the cell-type-specific immunoprecipitated
RNA (RiboTag-IP), comparative analyses can delineate cell-
type-specific transcriptional programs and responses to stress
(Hertzano et al., 2020b; Sadler et al., 2020). In the mature inner
ear, prestin is the canonical marker of OHCs (Zheng et al.,
2000), whereas Sox2 is expressed in all SCs (Walters et al.,
2015). We crossed RiboTag mice with Prestin-CreERT2 (Fang
et al., 2012) and Sox2-CreERT2 (Arnold et al., 2011) mouse
strains to enrich for OHC and SC transcripts, respectively. To
test the specificity of recombination, both Cre lines were also
crossed with the ROSA26CAG-tdTomato (Ai14) mice for evaluation
by immunofluorescence (Madisen et al., 2010). Following
sequencing, we assessed the enrichment and depletion of
known cell-type-specific transcripts. As expected, Prestin-
CreERT2 induced recombination in all OHCs and resulted in the
enrichment of OHC-expressed transcripts along with depletion
of non-hair cell expressed genes (Figures 1D and 1F).
Conversely, the Sox2-CreERT2 induced recombination in SCs
(medial SCs, pillar, and Deiters’) as well as within a population
e
e experimental design.
nt as a continuum with compounding effects.
of Prestin-CreERT2with Ai14 (n = 5) validates the specific expression of the Cre
ombination of the Cre in Deiters’ cells (DCs), inner pillar cells (IPCs), outer pillar
lls (HeCs), and in the glial cells. Bottom panel is an orthogonal view of a Z stack
en compared to the input (n = 2 paired input-IP for each dataset). Asterisk (*)
nriched in SCs or OHCs (p values calculated using hypergeometric test).
for 2 h before and 24 h, 7 days, and 15 days post noise exposure. Error bars:
ANOVA with Tukey’s post hoc test.
3 biological replicates for each condition; Sox2Cre: n = 6 controls, n = 5 noise-
ional responses to noise that are common (J) andOHC- or SC-specific (K). Error
atmaps.
Cell Reports 36, 109758, September 28, 2021 3
(legend on next page)
4 Cell Reports 36, 109758, September 28, 2021
Resourcell
OPEN ACCESS
Resourcell
OPEN ACCESS
of cells in the spiral ganglion, identified as Schwann cells, based
on the enrichment of Pmp22 in the RNA-seq results (Figures 1E
and 1F). To further establish the utility of this model system, we
compared gene expression levels between the RiboTag-IP and
input samples and detected 436 and 248 genes specifically en-
riched for OHCs and SCs, respectively (Table S1). Gene
Ontology (GO)-term analysis showed that hearing-related genes
were overrepresented in the set of OHC-enriched transcripts
(including the deafness genes Espn, Kcnq4, Loxhd1, Slc26a5,
Strc, Tmc1, Tomt, and Smpx), while the SC-enriched genes
showed significant overrepresentation of genes that function in
neuronal-related activities (Figure 1G).
To characterize the response to noise in OHCs and SCs, adult
mice were exposed to an 8 to 16 kHz noise band at 105 dB SPL
for 2 h, resulting in a PTS across all frequencies (Figures 1H and
1I; Figure S1A). We measured gene expression at 6 h and 24 h
after noise exposure, as well as in unexposed controls. Differen-
tial expression (DE) analysis was used to identify genes with a
significant change in expression in the RiboTag-IP samples after
noise in comparison to the unexposed controls (FDR < 5% and
fully separated expression levels between conditions). 1,947
and 1,796 genes were detected as differentially expressed in
the OHC and SC datasets, respectively (Table S1). To define
the main cell type and kinetic response patterns detected in
this experiment, we next integrated these two datasets and sub-
jected the union of the noise-responding genes to a clustering
analysis. We contrasted the response measured in the OHC
and SC IP samples with that measured in the entire cochlea
(input samples) to delineate specific and shared responses
(Table S2).
This analysis identified four major clusters that had a similar
kinetic pattern across all samples (Figure 1J; Table S2), likely
representing a more general core response to noise. GO-term
analysis found that the cluster of transiently induced genes is en-
riched for regulators of apoptosis (including Jun, Bcl10, and
Tgfb2), and the cluster containing genes with a stronger induc-
tion at 24 h is enriched for immune-related genes (including
Ifr7, Ccl5, and Tlr3). Conversely, our analysis identified four clus-
ters that manifested a response specific to OHC or SC RiboTag-
IP samples (Figure 1K) that likely represent cell-type-specific
responses. GO-term analysis showed that the cluster of genes
specifically repressed in OHCRiboTag-IP samples was enriched
for genes that function inmRNAmetabolic processes (e.g., Sfpq,
Hnrnpu, and Snrrnp48). In contrast, the cluster of genes that
were specifically repressed in SCs was enriched for genes that
function in transmission of nerve impulse (e.g., Grm3, Asic2,
and Cacna1e), while the cluster of genes that were specifically
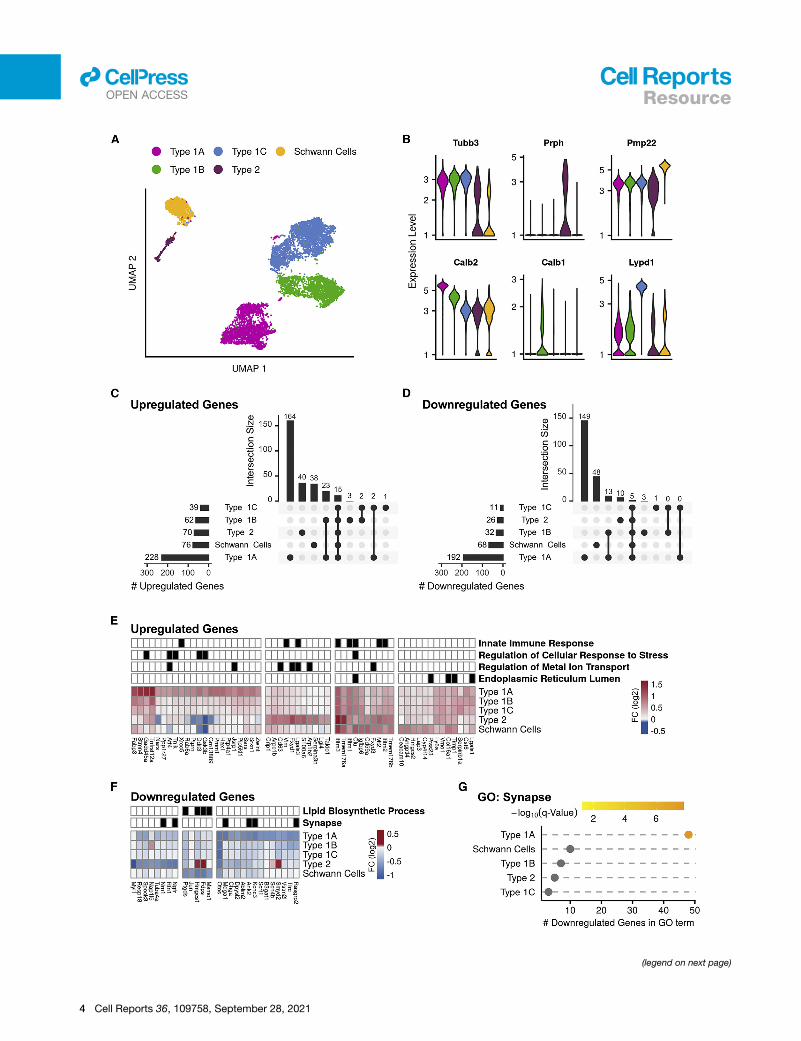
Figure 2. scRNA-seq analysis of the response of the SGNs to PTS-ind
(A) UMAP of the 8,916 SGNs and Schwann cells (n = 4 biological replicates for e
(B) Violin plots for the expression of known marker genes, colored according to
(C and D) Upset plots of upregulated (C) and downregulated (D) DEGs in noise-e
tected in each cell type. Vertical bars: number of DEGs in selected intersections
(E) Hierarchical clustering applied to the set of 56 upregulated genes that showed,
<0.05 (MAST’s statistical test) in at least one of the cell types. The grid above th
pergeometric test) (Table S3).
(F) Same as (E) but for the 27 downregulated genes (Table S3).
(G) The GO term ‘‘synapse’’ is enriched in the downregulated DEGs of type 1A. (
induced in the SC RiboTag-IP samples was enriched for genes
encoding structural proteins involved in cell adhesion andmigra-
tion (e.g., Podxl and Itgb1) (Figure 1K; Table S2). Finally, we
selected 65 genes enriched in the Ribotag-IP of either or both
datasets for validation in independent replicates, including regu-
lators of mRNA metabolism and synaptic signaling-related
genes. NanoString validated the change in gene expression for
43 genes following noise exposure (Figures S1B–S1D; Table S2).
Induction of the ATF3/4 pathways and repression ofgenes involved in neuronal transmission in the type 1ASGNs following noiseSustained exposure to loud noise results in glutamatergic excito-
toxicity, leading to the retraction of type 1C SGN axon nerve
terminals, also known as synaptopathy. To enhance our under-
standing of the SGNs’ common and cell-type-specific re-
sponses to noise, we compared the SGN transcriptomes of adult
mice 24 h after PTS-inducing noise exposure with unexposed
controls using scRNA-seq (Figure S1E). Utilizing a dissection
procedure optimized to enrich for sensory neurons, we obtained
tissue from four biological replicates per condition and pro-
cessed for sequencing using a droplet-based microfluidics plat-
form. We merged the control and noise-exposed datasets using
anchor-based data integration (a computational method that
builds on the identification of multiple pairs of cells where each
pair is composed of one cell from each dataset, which are mutu-
ally most similar to each other [‘‘anchors’’]. Such anchors likely
represent cells in the same biological state across the analyzed
datasets and therefore can guide their merge) (Stuart et al.,
2019). Based on the expression of known marker genes, distinct
cell clusters were identified for types 1A (Calb2), 1B (Calb1), 1C
(Lypd1), and type 2 (Prph) SGNs (Hafidi, 1998), as well as for
Schwann cells (Pmp22) (Amici et al., 2006) (Figures 2A and 2B;
Table S3). Collectively, these clusters, consisted of 8,916 cells
out of the 25,994 cells in this dataset (Figures S2A–S2E).
UMAP visualization of the integrated dataset confirmed that
cell types preserved their identity after noise exposure (Fig-
ure S2F) and that cells did not group according to individual rep-
licates (Figure S2G). Furthermore, marker genes showed similar
expression patterns in cells from control and noise-exposed
samples (Figures S2H–S2J; Table S3), corroborating that the
analysis properly captured cell-type identities in both conditions.
In agreement with the expected SGN composition, 96% and 4%
of the neurons were assigned as type 1 and type 2, respectively
(Perkins and Morest, 1975; Ryugo and Parks, 2003). Type 1
SGNs were further divided into 28%, 32%, and 40% 1A, 1B,
and 1C subtypes, respectively. These different cell types
ucing noise exposure
ach condition).
cell type as in (A).
xposed versus control samples. Horizontal bars: overall number of DEGs de-
between cell types indicated below the bars.
upon noise exposure, a fold-change induction greater than 1.5 and FDRq value
e heatmap displays assignment of genes to enriched GO terms (q < 0.05, hy-
q < 0.05, hypergeometric test).
Cell Reports 36, 109758, September 28, 2021 5
(legend on next page)
6 Cell Reports 36, 109758, September 28, 2021
Resourcell
OPEN ACCESS
Resourcell
OPEN ACCESS
showed similar prevalence in the control and noise-exposed
samples (Figure S2K).
Next, for each separate cell type, we performed DE analysis
comparing noise-exposed and control cells. Collectively, this
analysis identified 321 and 255 differentially expressed genes
(DEGs; FDR < 5%; absolute fold change > 1.2) that were upregu-
lated and downregulated, respectively, upon noise exposure
(Table S3). The majority of these DEGs met the DEG-calling
criteria in only a single cell type: 76% (246) of the upregulated
and 82% (211) of the downregulated genes (Figures 2C and
2D). Markedly, type 1A SGNs showed the strongest response
to noise (228 and 192 up- and downregulated genes, of which
164 and 149 genes were called only in this cell type) (Figures
2C and 2D). A similar number of cells were assigned to type
1A, 1B, and 1CSGNs (Figure S2K), demonstrating that the signif-
icantly higher number of DEGs detected for type 1A is not a mere
result of higher detection power for this cell type. 86 and 50
DEGs were specifically detected in Schwann cells and type 2
SGNs, respectively, while only 8 DEGs were specific to type
1B and 1C SGNs combined. Clustering the DEGs by their
response pattern further delineated cell-type-specific and
shared responses (Figures 2E and 2F). The sets of genes that
were specifically induced in type 1A, type 2, and Schwann cells
were enriched for genes that function in cellular responses to
stress, metal ion transport, and the endoplasmic reticulum
lumen, respectively. Genes that showed a shared induction
across cell types were enriched for innate immune genes (Fig-
ure 2E; Table S3). Genes that were specifically repressed in
type 1A were enriched for genes involved in synapse (e.g.,
Ank2, Kcnc3, and Rasgrp2; Figures 2F and 2G) as well as the
GO term ‘‘glutamatergic synaptic transmission’’ (e.g., Gria2
and Grin1).
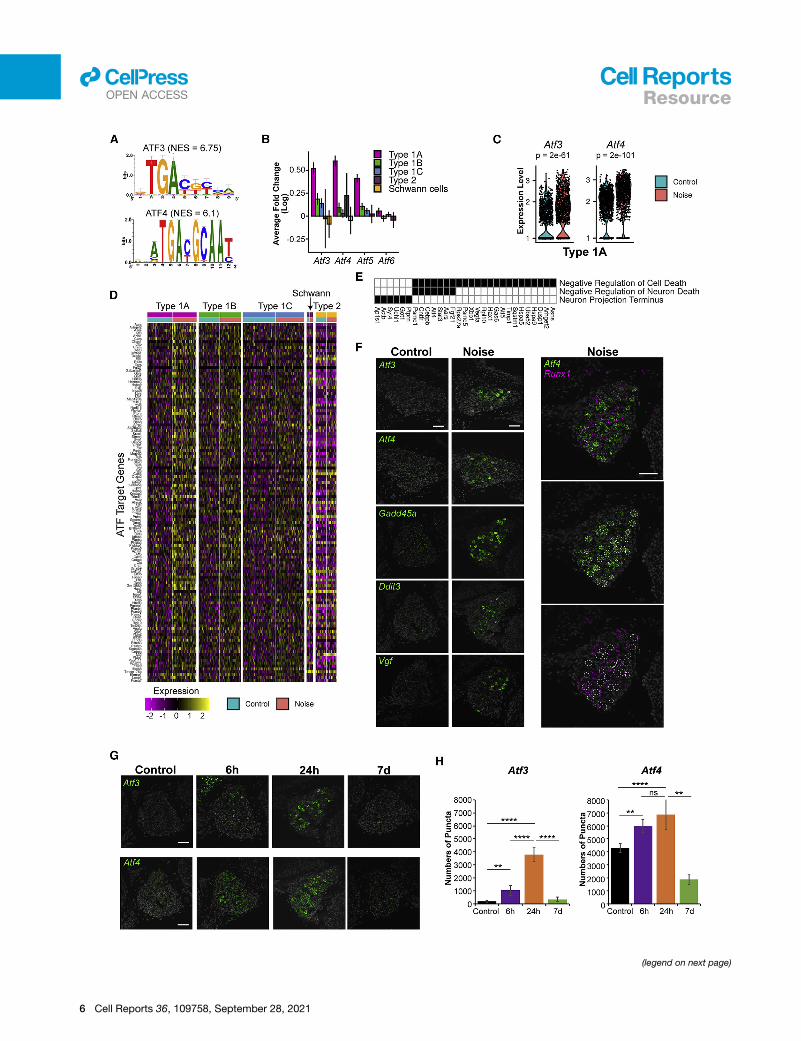
The strong noise-induced transcriptional response elicited by
type 1A SGNs, in contrast to a much weaker response shown by
type 1C, was unexpected, considering that type 1A SGNs are
largely resilient to PTS noise while type 1C are highly susceptible
(Furman et al., 2013; Shrestha et al., 2018). Seeking key regula-
tors of the observed transcriptional response, we applied a cis-
regulatory motif analysis to the promoters of the DEGs. Notably,
this analysis revealed that the promoters of the genes induced in
type 1A SGNs are significantly enriched for the binding motif of
the ATF family of transcription factors (TFs) (Figure 3A; Table
S3), pinpointing members of this family as major mediators of
the type 1A SGN response to noise. Corroborating such a role,
the Atf3, Atf4, and Atf5 genes themselves showed a markedly
high induction in type 1A SGNs in response to noise exposure
(Figures 3B and 3C). Of note, Atf3 and Atf4 are known to be
Figure 3. ATF transcription factors regulate the type 1A transcriptiona
(A) Top scoring enriched motifs on promoters of the genes induced in type 1A S
(B) Several genes from the Aft family display a greater induction in type 1A compa
(C) Violin plots showing Atf3 and Atf4 expression in type 1A control and noise-ex
(D) Heatmap of normalized and scaled expression levels of ATF-predicted target g
(E) Selected GO terms enriched in the ATF-predicted targets from (D) (Table S3)
(F) Representative images of RNAscope labeling for selected ATF-target transcrip
gene expression in type 1A SGNs following noise (n = 3 controls, n = 3 noise-ex
(G) Time course of Atf3 and Atf4 induction following noise exposure. Scale bar,
(H) Quantitative analysis of the RNAscope labeling for Atf3 and Atf4 using QuPath
for each condition). **p < 0.01; ****p < 0.0001; ns not significant. One-way ANOV
induced in neurons following multiple stresses and are associ-
ated with neuronal survival and axonal regeneration (Hunt
et al., 2012; Sun et al., 2013). Consistent with this finding, the
125 genes induced in type 1A and predicted as direct ATF tar-
gets by the motif analysis (Figure 3D) were enriched for the
‘‘negative regulation of cell death’’ GO term (including pro-sur-
vival genes like Fgf21, Cntfr, Hspa5, and Gas6; Figure 3E), sug-
gesting that this pathway confers a protective role in type 1A
cells upon noise exposure. We selected key regulators and ef-
fectors in the ATF-mediated response network (Atf3, Atf4,
Gadd45a, Ddit3 and Vgf) and validated their activation in
response to noise (Figure 3F). Co-staining of noise-exposed spi-
ral ganglia with probes for Atf4 andRunx1—amarker for the type
1B and 1C SGNs (Figure S2J)—showed non-overlapping pat-
terns of induction consistent with the induction of Atf4 in type
1A SGNs only (Figure 3F). Analysis of the ATF-induced transcrip-
tomic response at baseline, 6 h, 24 h, and 7 days post-exposure
showed a maximal response at 24 h with a near-complete reso-
lution by 7 days (Figures 3G and 3H). Staining for Atf3 and Atf4 in
the SV and the organ of Corti reveals that in these cochlear do-
mains, in contrast to the SGNs, the peak of expression following
noise is at 6 h (Figures S3A and S3B). Furthermore, while both
Atf3 and Atf4 expression is highly induced in the SGNs and the
basal cells of the SV (Figure S3A), only Atf4 is detected and
induced in the organ of Corti in a diffuse pattern of expression
(Figure S3B).
An analysis focused on the downregulated genes detected a
weaker, albeit significant, enrichment for the binding signature
of the transcription factor SREBF1 in 39 of the type 1A downre-
gulated genes (Figures S3C–S3F). These genes overrepresented
GO terms related to neuronal transmission, such as synapse and
neuron projection (Figure S3G; Table S3). Here, too, Srebf1 itself
showed a greater suppression of expression upon noise expo-
sure in type 1A cells compared to other SGN cell types (Figures
S3D and S3E), supporting a role for its attenuated activity in
mediating the suppressed transcriptional program observed in
noise-exposed type 1A SGNs.
LW cells downregulate genes related to potassiumtransport following noise exposureThe cochlear LW consists of the SV and spiral ligament, which
function to maintain the EP necessary for the mechanotransduc-
tion of sound. The SV consists of three layers of cells (from
medial to lateral: marginal, intermediate, and basal) that secrete
potassium ions into the endolymph of the scala media via a
network of Na+/K+ transporters (Peixoto Pinheiro et al., 2021).
Importantly, the marginal and intermediate cells of the SV and
l response to noise
GNs. NES, normalized enrichment score.
red to other SGNs. Error bar: 95% confidence interval fromMAST DE analysis.
posed cells. p values calculated using MAST.
enes induced by noise in type 1ASGNs. Rows are genes and columns are cells.
.
ts in the spiral ganglia of control and noise-exposed mice show an increase in
posed). Scale bar, 50 mm.
50 mm.
(see Method details). Error bars: standard deviation (n = 3 biological replicates
A with Tukey’s post hoc test.
Cell Reports 36, 109758, September 28, 2021 7
Resourcell
OPEN ACCESS
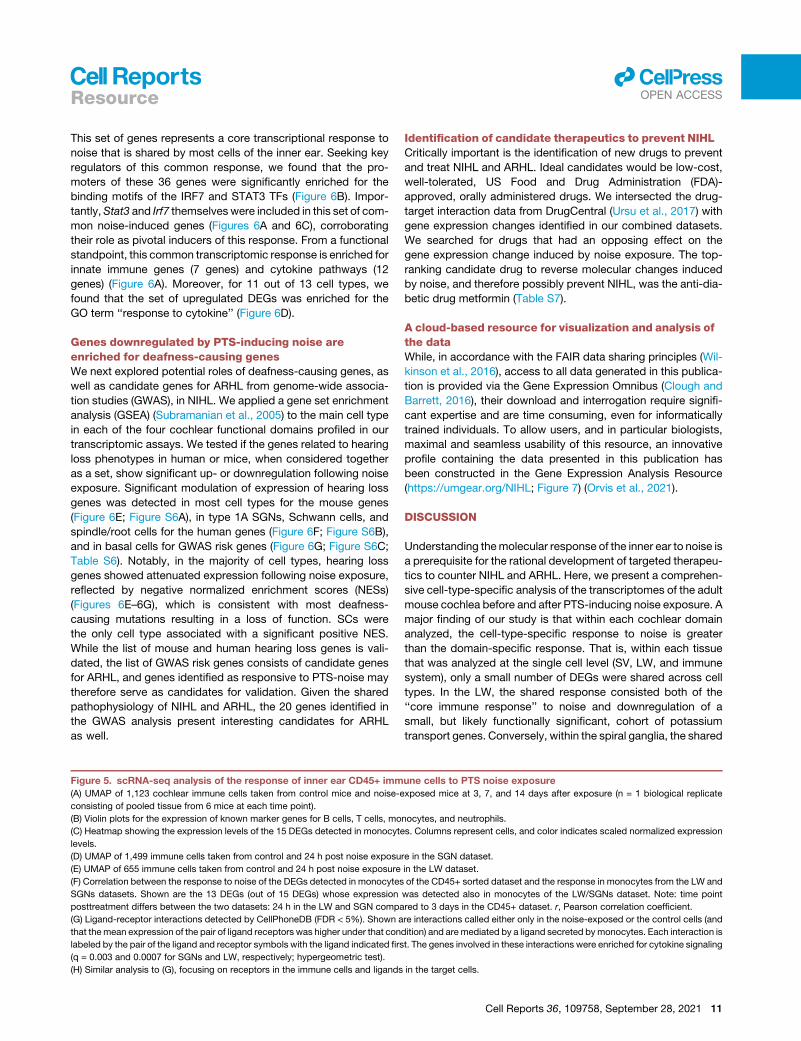
the fibrocytes in the spiral ligament have been shown to endure
structural changes following PTS-inducing noise exposure (Hir-
ose and Liberman, 2003). Using the same scRNA-seq strategy
as before, we explored the noise-induced transcriptional re-
sponses of the LW to understand the molecular underpinnings
of SV and spiral ligament pathology following PTS-inducing
noise. We clustered the 34,341 cells that met quality criteria
and used the expression of known marker genes to identify
clusters corresponding to five of the major cell types in the
LW— marginal cells, intermediate cells, basal cells, fibrocytes,
and spindle/root cells—and re-clustered the 25,599 cells as-
signed to these five cell types (Figures S4A–S4G). As in the
SGN dataset, control and noise cells were integrated using an
anchor-based integration approach. The UMAP showed well-
separated clusters that were markedly enriched for the marker
genes of the respective cell types (Figures 4A and 4B; Figure S4I;
Table S4) (Korrapati et al., 2019). The different cell types de-
tected in the LW showed similar prevalence in the noise-
exposed and control samples (Figure S4H). SV epithelial cells
(marginal, intermediate, and basal) represented 87% of the cells
of the LW, with intermediate cells being the most abundant cell
type (�50%) in this dataset (Figure S4H).
We next performed, for each separate cell type, a DE analysis
comparing noise-exposed and unexposed controls. Collec-
tively, we detected 639 upregulated and 408 downregulated
DEGs, out of which 356 and 279 were called in a single cell
type (Figures 4C and 4D; Table S4). Clustering the DEGs that
showed the strongest induction (fold change [FC] of at least
1.5) delineated both cell-type-specific and shared responses:
genes specifically responsive in intermediate cells were enriched
for genes associated with disease process such as anemia, leu-
kemia, and migraines, while the shared response was enriched
for innate immune response (Figure 4E; Table S4). Notably, a
downregulation response that was shared bymost LW cell types
was significantly enriched for potassium ion transport genes
(Figures 4F and 4G), reflecting the deterioration, upon noise
exposure, in the functioning of the LW in transporting potassium
into the endolymph.
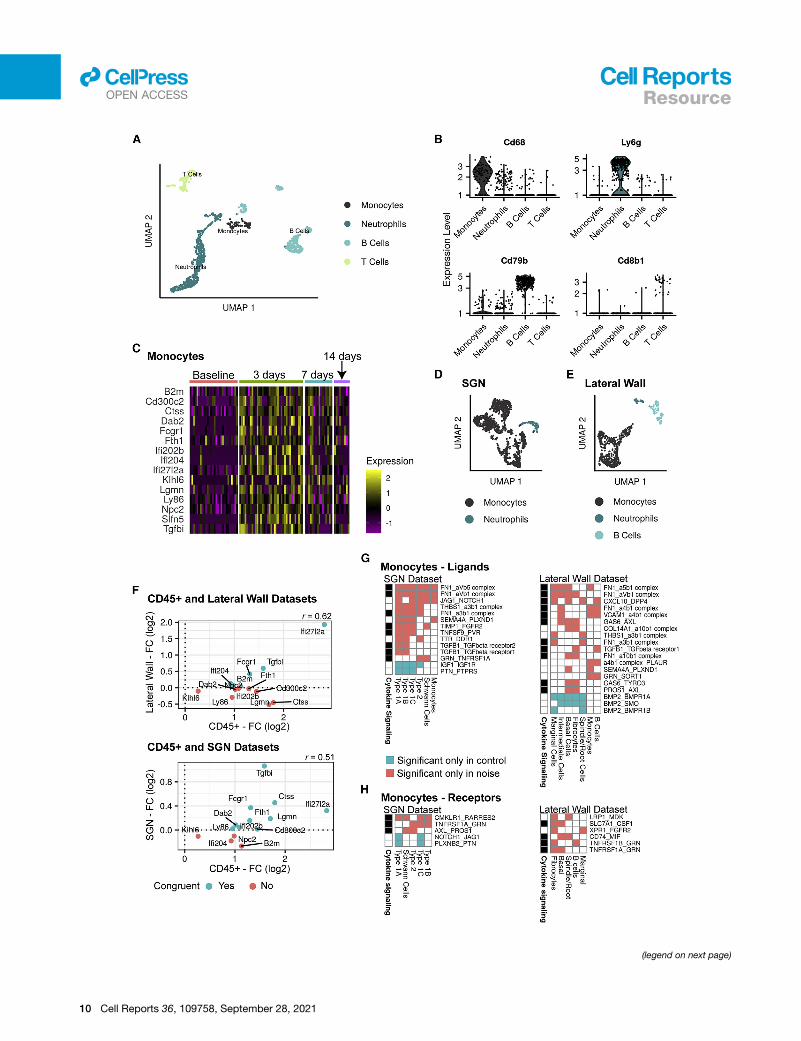
Monocytes are the primary immune cell totranscriptionally respond to PTS-inducing noiseOur data show a robust induction of immune-related genes in the
cochlear sensory epithelium (OHCs and SCs), LW, and SGNs in
response to PTS-inducing noise. To directly measure the molec-
ular response in the cochlear immune cells following noise expo-
sure, cochleae were obtained at three time points after noise
exposure (3, 7, and 14 days), as well as from control mice (Fig-
ure S1F). Flow cytometry was used to select CD45+ immune
cells for scRNA-seq analysis (Figure S1G). UMAP visualization
of the 1,123 cells, which met quality criteria from all four condi-
tions, indicated that cells clustered according to their identity
rather than experimental condition (Figures S5A–S5F). Expres-
sion of canonical marker genes for the major immune cell types
defined clusters of B cells, T cells, monocytes/macrophages,
and neutrophils (Figures 5A and 5B; Figures S5G and S5H; Table
S5). In this dataset, 47% of the cells were identified as neutro-
phils, while 30%, 15%, and 8% were identified as B cells,
T cells, andmonocytes/macrophages, respectively (Figure S5F).
8 Cell Reports 36, 109758, September 28, 2021
In line with recent reports, we observed an increase in neutro-
phils 3 days after noise exposure (Bae et al., 2021; Rai et al.,
2020).
Next, for each of these separate cell types, we carried out DE
analysis, comparing cells from each of the three post-exposure
time points to the unexposed control cells. Notably, all but two
DEGs (detected for 3-day neutrophils and 7-day T cells) were
exclusively detected for monocytes and only for the 3-day time
point, even though, in terms of statistical power, monocytes
were less abundant than the other immune cells (Figure S5F).
Overall, this analysis detected 15 DEGs, all upregulated (Fig-
ure 5C) and enriched for the GO term ‘‘adaptive immune
response’’ (Table S5). Some of these genes (e.g., KlhI6 and
B2m) also showed an increased expression 7 days post noise
exposure, though they did not pass the statistical significance
level for being called DEGs. Most of these genes returned to
baseline expression levels at 14 days post treatment (Figure 5C;
Figure S5I; Table S5).
The observation that, out of the four immune cell types
analyzed, only monocytes elicited a significant transcriptional
response to noise exposure was unexpected. We therefore re-
visited the SGN and LW scRNA-seq datasets described above
and examined the immune cells detected in them. In the SGNs
dataset, we identified clusters representing monocytes and neu-
trophils (Figure 5D; Figures S5J–S5M; Table S5). DE analysis
detected 243 upregulated and 125 downregulated genes in
monocytes and only 3 upregulated and 3 downregulated genes
in neutrophils (Table S5). In the LWdataset, clusters representing
monocytes, neutrophils, and B cells were identified (Figure 5E;
Figures S5N–S5R; Table S5), and here, too, monocytes ap-
peared as the cell type that showed the most vigorous transcrip-
tional response to noise with 306 and 257 upregulated and
downregulated DEGs, respectively. Only 4 DEGs were identified
in B cells and neutrophils (all downregulated in B cells) (Table S5).
Notably, the upregulated DEGs detected in monocytes from the
CD45+ immune cells dataset showed a correlated response in
monocytes of both the LW and SGN datasets (Figure 5F). Over-
all, in these three scRNA-seq datasets, monocytes accounted
for the vast majority of DEGs detected in immune cells.
To explore the potential impact of monocytes on other cell
types of the inner ear mediated by cell-cell communication, we
used the CellPhoneDB tool (Efremova et al., 2020). We detected
an overall increase in communication between monocytes and
SGN and LW cells following noise exposure. Numerous interac-
tions involved in cell adhesion and secretion of chemoattractant
molecules were detected (Figures 5G and 5H).
A common response of the cochlea to PTS-inducingnoise is probably regulated by IRF7 and STAT3The analyses shown to this point indicate that the cochlear
response to PTS-inducing noise is primarily cell-type-specific
within each of the various cochlear domains, where the largest
number of DEGs is specific to individual cell types rather than
the domain. We next sought to identify whether the cochlea
also mounts a molecular response to noise that is shared across
cell types. We identified a set of 36 genes that, following noise,
was upregulated in each of the three major datasets analyzed
(SGN, LW, and RiboTag) in more than one cell type (Figure 6A).
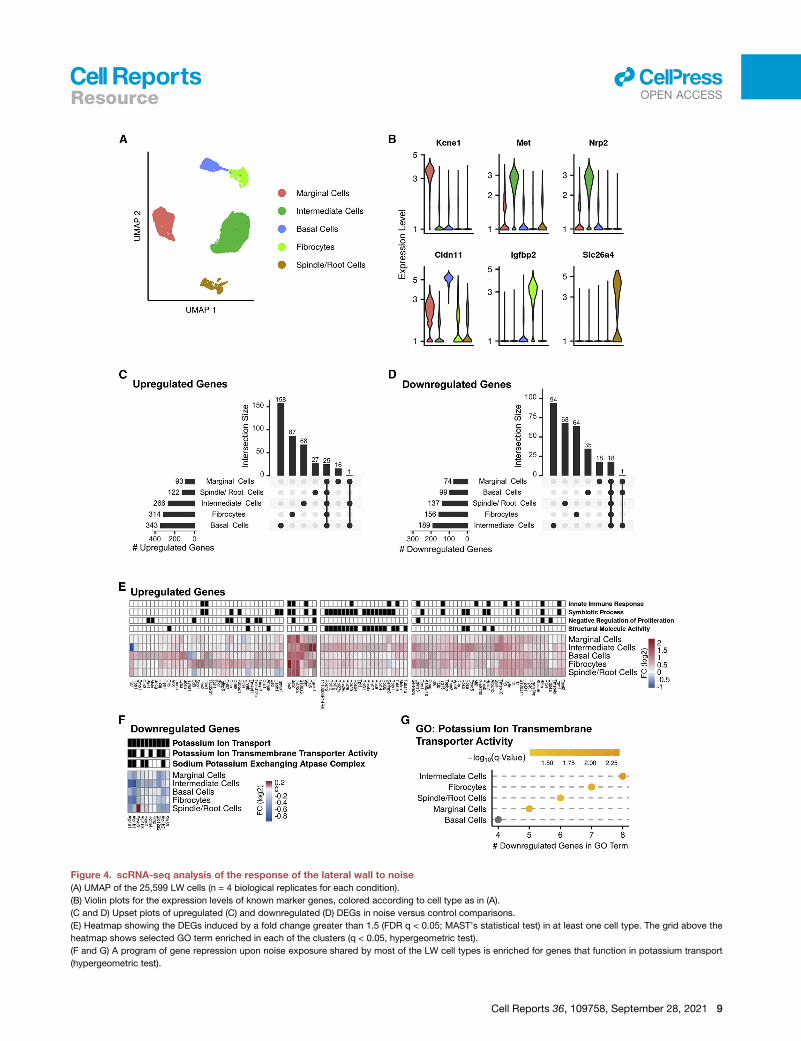
Figure 4. scRNA-seq analysis of the response of the lateral wall to noise
(A) UMAP of the 25,599 LW cells (n = 4 biological replicates for each condition).
(B) Violin plots for the expression levels of known marker genes, colored according to cell type as in (A).
(C and D) Upset plots of upregulated (C) and downregulated (D) DEGs in noise versus control comparisons.
(E) Heatmap showing the DEGs induced by a fold change greater than 1.5 (FDR q < 0.05; MAST’s statistical test) in at least one cell type. The grid above the
heatmap shows selected GO term enriched in each of the clusters (q < 0.05, hypergeometric test).
(F and G) A program of gene repression upon noise exposure shared by most of the LW cell types is enriched for genes that function in potassium transport
(hypergeometric test).
Cell Reports 36, 109758, September 28, 2021 9
Resourcell
OPEN ACCESS
(legend on next page)
10 Cell Reports 36, 109758, September 28, 2021
Resourcell
OPEN ACCESS
Resourcell
OPEN ACCESS
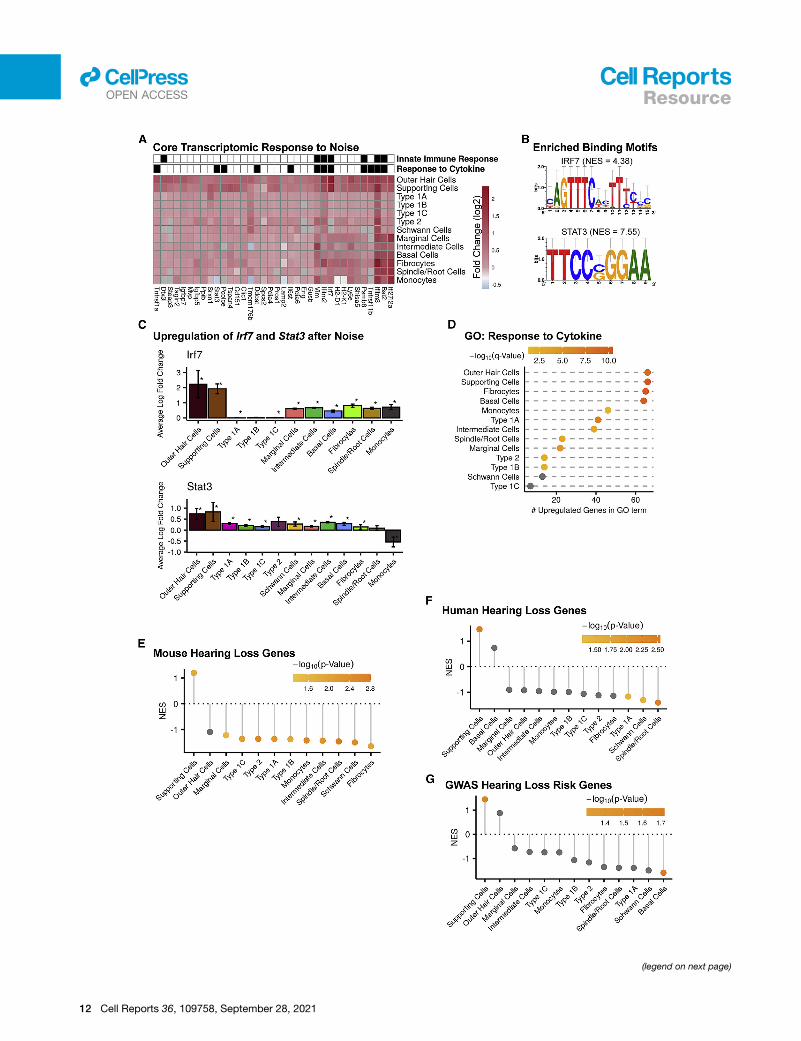
This set of genes represents a core transcriptional response to
noise that is shared by most cells of the inner ear. Seeking key
regulators of this common response, we found that the pro-
moters of these 36 genes were significantly enriched for the
binding motifs of the IRF7 and STAT3 TFs (Figure 6B). Impor-
tantly,Stat3 and Irf7 themselves were included in this set of com-
mon noise-induced genes (Figures 6A and 6C), corroborating
their role as pivotal inducers of this response. From a functional
standpoint, this common transcriptomic response is enriched for
innate immune genes (7 genes) and cytokine pathways (12
genes) (Figure 6A). Moreover, for 11 out of 13 cell types, we
found that the set of upregulated DEGs was enriched for the
GO term ‘‘response to cytokine’’ (Figure 6D).
Genes downregulated by PTS-inducing noise areenriched for deafness-causing genesWe next explored potential roles of deafness-causing genes, as
well as candidate genes for ARHL from genome-wide associa-
tion studies (GWAS), in NIHL. We applied a gene set enrichment
analysis (GSEA) (Subramanian et al., 2005) to the main cell type
in each of the four cochlear functional domains profiled in our
transcriptomic assays. We tested if the genes related to hearing
loss phenotypes in human or mice, when considered together
as a set, show significant up- or downregulation following noise
exposure. Significant modulation of expression of hearing loss
genes was detected in most cell types for the mouse genes
(Figure 6E; Figure S6A), in type 1A SGNs, Schwann cells, and
spindle/root cells for the human genes (Figure 6F; Figure S6B),
and in basal cells for GWAS risk genes (Figure 6G; Figure S6C;
Table S6). Notably, in the majority of cell types, hearing loss
genes showed attenuated expression following noise exposure,
reflected by negative normalized enrichment scores (NESs)
(Figures 6E–6G), which is consistent with most deafness-
causing mutations resulting in a loss of function. SCs were
the only cell type associated with a significant positive NES.
While the list of mouse and human hearing loss genes is vali-
dated, the list of GWAS risk genes consists of candidate genes
for ARHL, and genes identified as responsive to PTS-noise may
therefore serve as candidates for validation. Given the shared
pathophysiology of NIHL and ARHL, the 20 genes identified in
the GWAS analysis present interesting candidates for ARHL
as well.
Figure 5. scRNA-seq analysis of the response of inner ear CD45+ imm
(A) UMAP of 1,123 cochlear immune cells taken from control mice and noise-e
consisting of pooled tissue from 6 mice at each time point).
(B) Violin plots for the expression of known marker genes for B cells, T cells, mo
(C) Heatmap showing the expression levels of the 15 DEGs detected in monocyte
levels.
(D) UMAP of 1,499 immune cells taken from control and 24 h post noise exposu
(E) UMAP of 655 immune cells taken from control and 24 h post noise exposure
(F) Correlation between the response to noise of the DEGs detected in monocytes
SGNs datasets. Shown are the 13 DEGs (out of 15 DEGs) whose expression
posttreatment differs between the two datasets: 24 h in the LW and SGN compa
(G) Ligand-receptor interactions detected by CellPhoneDB (FDR < 5%). Shown a
that themean expression of the pair of ligand receptors was higher under that con
labeled by the pair of the ligand and receptor symbols with the ligand indicated firs
(q = 0.003 and 0.0007 for SGNs and LW, respectively; hypergeometric test).
(H) Similar analysis to (G), focusing on receptors in the immune cells and ligands
Identification of candidate therapeutics to prevent NIHLCritically important is the identification of new drugs to prevent
and treat NIHL and ARHL. Ideal candidates would be low-cost,
well-tolerated, US Food and Drug Administration (FDA)-
approved, orally administered drugs. We intersected the drug-
target interaction data from DrugCentral (Ursu et al., 2017) with
gene expression changes identified in our combined datasets.
We searched for drugs that had an opposing effect on the
gene expression change induced by noise exposure. The top-
ranking candidate drug to reverse molecular changes induced
by noise, and therefore possibly prevent NIHL, was the anti-dia-
betic drug metformin (Table S7).
A cloud-based resource for visualization and analysis ofthe dataWhile, in accordance with the FAIR data sharing principles (Wil-
kinson et al., 2016), access to all data generated in this publica-
tion is provided via the Gene Expression Omnibus (Clough and
Barrett, 2016), their download and interrogation require signifi-
cant expertise and are time consuming, even for informatically
trained individuals. To allow users, and in particular biologists,
maximal and seamless usability of this resource, an innovative
profile containing the data presented in this publication has
been constructed in the Gene Expression Analysis Resource
(https://umgear.org/NIHL; Figure 7) (Orvis et al., 2021).
DISCUSSION
Understanding themolecular response of the inner ear to noise is
a prerequisite for the rational development of targeted therapeu-
tics to counter NIHL and ARHL. Here, we present a comprehen-
sive cell-type-specific analysis of the transcriptomes of the adult
mouse cochlea before and after PTS-inducing noise exposure. A
major finding of our study is that within each cochlear domain
analyzed, the cell-type-specific response to noise is greater
than the domain-specific response. That is, within each tissue
that was analyzed at the single cell level (SV, LW, and immune
system), only a small number of DEGs were shared across cell
types. In the LW, the shared response consisted both of the
‘‘core immune response’’ to noise and downregulation of a
small, but likely functionally significant, cohort of potassium
transport genes. Conversely, within the spiral ganglia, the shared
une cells to PTS noise exposure
xposed mice at 3, 7, and 14 days after exposure (n = 1 biological replicate
nocytes, and neutrophils.
s. Columns represent cells, and color indicates scaled normalized expression
re in the SGN dataset.
in the LW dataset.
of the CD45+ sorted dataset and the response in monocytes from the LW and
was detected also in monocytes of the LW/SGNs dataset. Note: time point
red to 3 days in the CD45+ dataset. r, Pearson correlation coefficient.
re interactions called either only in the noise-exposed or the control cells (and
dition) and are mediated by a ligand secreted bymonocytes. Each interaction is
t. The genes involved in these interactions were enriched for cytokine signaling
in the target cells.
Cell Reports 36, 109758, September 28, 2021 11
(legend on next page)
12 Cell Reports 36, 109758, September 28, 2021
Resourcell
OPEN ACCESS
Resourcell
OPEN ACCESS
molecular response was limited to the ‘‘core immune response’’
with only very few DEGs specifically detected in cells other than
the type 1A SGNs.
An early adverse outcome of noise exposure is the retraction of
the type 1CSGNneuronal projections from the IHCs (Coate et al.,
2019; Fernandez et al., 2015), which is thought to result from glu-
tamatergic excitotoxicity. However, rather than identifying a
type-1C-specific adverse molecular response, we detected a
robust molecular response of the type 1A SGNs to PTS-inducing
noise exposure. This consisted of activation of the ATF3/4
pathway, which is known as the integrated stress response
pathway, and depending on the severity of the traumamay result
in either protective, reparative, or destructive outcomes (Pak-
os-Zebrucka et al., 2016). In parallel to the upregulation of the
ATFpathway, type1ASGNsshowan integrated reductionof syn-
aptic gene expression, which likely protects the neurons from
overexposure to glutamate in the synapse. Indeed, several
studies have shown that selectively inhibiting the glutamatergic
neurotransmission by using antagonists (Duan et al., 2000; Hu
et al., 2020; Kim et al., 2019; Kutzing et al., 2012; Ruel et al.,
2005) or preventing the surface expression of glutamate recep-
tors (Chen et al., 2009) prevents damage due to excitotoxicity.
Similarly, downregulation of Srebp1 (activated by NMDA-recep-
tors) has been documented as part of a protective mechanism
following strokes (Taghibiglou et al., 2009). Finally, the molecular
changes recorded in type1ASGNs in this studymayunderlie long
documented changes in neuronal physiology following acoustic
trauma (Liberman and Kiang, 1978).
From a functional perspective, synaptic rearrangement (Bullen
et al., 2019; Liberman et al., 2015), loss and recovery of CtBP2-
labeled ribbons with juxtaposed AMPA receptors (Fernandez
et al., 2015; Liberman et al., 2015), and full regeneration of lost
synapses (Hickman et al., 2020; Puel et al., 1997, 1998; Ruel
et al., 2007; Shi et al., 2013, 2015) have all been reported in
different rodent species, suggesting that dynamic repair pro-
cesses are likely an important factor in ensuring that connected
neurons function properly after noise exposure. Conversely,
long-term dysfunction of the synapses that remain connected af-
ter noise exposure has also been reported (Bullen et al., 2019;
Shi et al., 2016), which raises the possibility that a portion of
the large transcriptional responses observed in type 1ASGNs re-
flects an irreversible damage response. However, these findings
are inconsistent with direct recordings from single SGN fibers
demonstrating near-normal firing properties (Furman et al.,
2013). Future experiments combining electrophysiology and
Figure 6. A common response to PTS-noise exposure in inner ear cell(A) Heatmap of the set of common upregulated genes. Gray indicates that the gen
detected as upregulated (q < 0.05; fold change > 0;MAST’s or DESeq2 statistical t
each of the two single-cell datasets (SGN and LW) and were members of one of th
genes were enriched for the GO terms ‘‘response to cytokine’’ (q = 0.0008) and
(B) The promoters of the common upregulated genes from (A) were enriched (Rcis
enrichment score).
(C) Upregulation of Irf7 and Stat3 transcripts was observed in most cell types in
RiboTag datasets, respectively). Error bar: 95% confidence.
(D) For 11 out of 13 cell types, the set of upregulated DEGs was enriched for the
(E–G) Plots showing the NES obtained from GSEA for the mouse hearing-loss-ca
hearing-loss-risk genes (G) in each cell type following noise exposure. All cells,
genes following noise exposure.
molecular profiling of single neurons (e.g., using Patch-seq
[Cadwell et al., 2016]) might help to disentangle this complex
pathophysiology. Of note, while type 1B SGNs are also relatively
protected from noise, our data suggest that this likely occurs via
a mechanism that differs from the transcriptionally induced
changes observed in the type 1A SGNs.
Because of the type 1C response, reversal of cochlear synapt-
opathy following noise has been a topic of intense research (Fer-
nandez et al., 2021a; Hashimoto et al., 2019; Seist et al., 2020). A
recently published study showed that treatment of mice with
zoledronic acid after TTS-inducing noise can reverse synaptop-
athy, likely via the inhibition of the Farnesyl pyrophosphate syn-
thase (FDPS) enzyme (Seist et al., 2020). Our study shows that
expression of Fdps in the spiral ganglion is primarily limited to
Schwann cells and type 2 SGNs, with a significant decrease in
expression in Schwann cells following noise. Conversely, we
detect an acute increase in the expression of Fdps in the SCs,
alluding to an alternative mechanism of action or varying roles
for Fdps after TTS- and PTS-inducing noise exposures. The
differing expression pattern of Fdps across cochlear cell types
is an example of a use case for our resource, which allows users
to perform post hoc analyses of published data in addition to
serving as a hypothesis generating tool.
Our data also identify a dominant molecular signature, shared
by many cell types in the cochlea, of an innate immune gene-
related response to noise. Our cell-type-specific approach,
however, allowed for the separation of the molecular changes
of immune cells from the damage-associated molecular pattern
(DAMP)-related genes that are up and downregulated in non-im-
mune cell types (Frye et al., 2019). The significance of the im-
mune response in NIHL is still a topic of investigation. In this
study, we show that the immune-related response to noise is
likely driven by the transcriptional regulators STAT3 and IRF7.
Indeed, inhibition of STAT3 has been shown to provide protec-
tion against NIHL through the reduction of reactive oxygen
species production (Wilson et al., 2014). IRF7, part of the toll-
like receptor pathway, has been shown to increase rapidly after
NIHL and is thought to be part of the innate immune response to
stress (Cai et al., 2014). Additionally, the acute transcriptional
changes noted in monocytes/macrophages after noise trauma
indicate that specific inflammatory mechanisms are involved in
post-noise processes, which may be useful in developing new
therapeutics.
Finally, the importance of identifying candidate therapeutics
to prevent or treat NIHL cannot be overestimated. To date,
se was not detected in the corresponding cell type. Shown are genes that were
est for scRNA-seq or RiboTag datasets, respectively) in at least two cell types in
e common upregulated gene clusters in the RiboTag dataset (Figure 1J). These
‘‘innate immune response’’ (q = 0.04). ‘‘Monocytes’’ refer to LW monocytes.
Target analysis) for the binding motifs of IRF7 and STAT3 TFs (NES, normalized
the inner ear. *q < 0.05 (MAST’s or DESeq2 statistical test for scRNA-seq or
GO term ‘‘response to cytokine’’ (q < 0.05, hypergeometric test).
using genes (E), for the human hearing-loss-causing genes (F), and for GWAS
except for SCs, had a negative NES reflecting downregulation of hearing-loss
Cell Reports 36, 109758, September 28, 2021 13
(legend on next page)
14 Cell Reports 36, 109758, September 28, 2021
Resourcell
OPEN ACCESS
Resourcell
OPEN ACCESS
there are no FDA-approved drugs to prevent or treat hearing
loss. By intersecting the noise-induced gene expression
changes in our combined datasets with DrugCentral (Ursu
et al., 2017), we identified metformin as the top-ranking candi-
date therapeutic (Table S7). Indeed, metformin has been previ-
ously shown to reduce the severity of NIHL in a rat model (Kesici
et al., 2018), has shown promise in prevention of ototoxicity
in vitro (Oishi et al., 2014), and was shown in diabetic patients
to be associated with decreased risk for sudden sensorineural
hearing loss (Chen et al., 2019). Interestingly, the cholesterol
lowering drugs, statins, which target HMG-CoA reductase (an
indirect target of metformin), were also identified in our data
as a candidate therapeutic for NIHL. Statins, similar to metfor-
min, have shown promise in preventing NIHL (Park et al.,
2012) and ototoxicity (Fernandez et al., 2021b). Finally, another
high-ranking group of otoprotective candidates was haloge-
nated compounds used as general inhalation anesthetics.
Concordantly, several studies in mice have shown that treat-
ment with isoflurane can significantly decrease threshold shifts
after PTS-inducing noise (Chung et al., 2007; Kim et al., 2005).
From a translational standpoint, protection by halogenated
compounds may be functionally significant in otologic surgery,
where the tympanic membrane and ossicular chain are manip-
ulated in a supra-physiologic range. Taken together, these find-
ings suggest that transcriptomic data could be used for seeking
new drugs for NIHL.
LIMITATIONS AND FUTURE DIRECTIONS
Although this project represents the most comprehensive cell-
type-specific analysis of the cochlear response to PTS-inducing
noise, consisting of over 100,000 cells profiled and using a
combination of approaches, it suffers from several technical lim-
itations. First, the RiboTag approach, which avoids tissue disso-
ciation that is detrimental for the robust analysis of mature hair
cells and SCs, is only a method of enrichment, requiring infer-
ence of gene expression based on enrichment or depletion of
the transcript compared with the input (Hertzano et al., 2020b).
Furthermore, transgenic mouse models are used to drive Cre-
recombination, which may also alter gene expression. Here,
we used the Sox2-CreERT2 mouse to drive recombination in
SCs, which also results in recombination in glial cells. However,
our dissection enriched for the organ of Corti and avoided most
of the glial cells, and as shown in Figure S7, the DEGs in
Schwann cells and SCs are significantly divergent. Additionally,
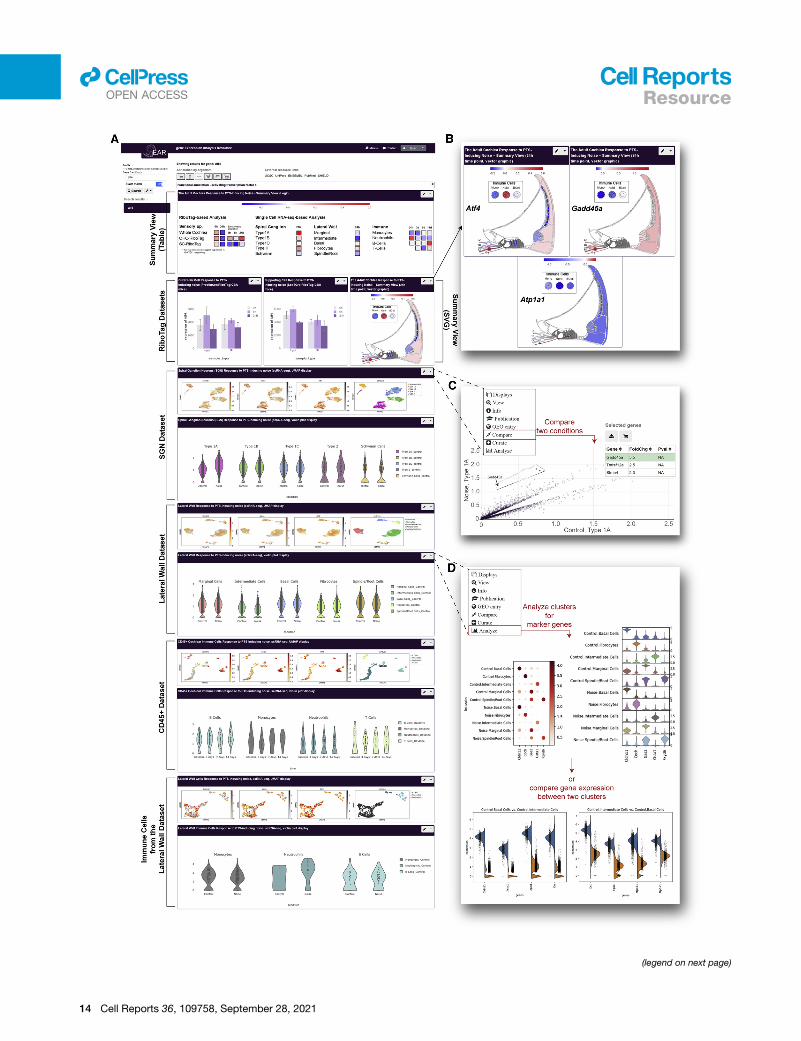
Figure 7. Data sharing, visualization, and analysis via the gEAR (umgeA custom profile was generated in the gEAR to support sharing, visualization,
manuscript (https://umgear.org/NIHL).
(A) Overview of the manuscript profile, which contains two summary views (tabula
RiboTag datasets (bar graphs), and the SGN, LW, and immune cells datasets (U
(B) Examples of the graphic summary view representation for Atf4, Gadd45a, a
exposure mapped onto anatomical sites for intuitive interpretation of the data.
(C and D) The gEAR portal contains several analysis tools allowing users to furth
(C) Example of the ‘‘compare tool,’’ which enables users to compare expression a
1A SGNs between control and noise samples.
(D) The single-cell workbench allows users to perform ‘‘de novo’’ analysis of the
clusters. Here are shownmarker genes for the 5 clusters (before and after noise) o
(bottom).
as the SCs are a heterogeneous population, our approach re-
sults in an averaged expression from the various support cell
types. Finally, due to the lack of appropriate Cre-drivers, this
analysis is missing IHCs, an important sensory cell that directly
interfaces with the SGNs. Conversely, the single-cell analysis
suffers from the disadvantage of dissociation, which may alter
gene expression. It is possible that the differential expression
of some acute response genes is masked by the use of a disso-
ciation-based technique (van den Brink et al., 2017). A minor lim-
itation is that cell-type identity is based on inference from gene
expression. This mainly limits the ability to look at differences
in gene expression along the tonotopic axis of the cochlea.
And lastly, this dataset did not look at sex differences in the
response to noise (Milon et al., 2018) and did not assess changes
in protein levels or post-translational protein modification, which
are not always in direct correlation to gene expression (Jongka-
monwiwat et al., 2020).
Acknowledging these limitations illuminates the path for future
experiments. Single-nucleus RNA-seq has evolved as a method
that can efficiently replace scRNA-seq (Bakken et al., 2018; Kor-
rapati et al., 2019). Spatial transcriptomics can be integratedwith
single-cell transcriptomic methods to confidently, spatially link
gene expression to anatomical location (Kleshchevnikov et al.,
2020). Our data indicate that, despite these advantages, multiple
assays will still be ideally performed, profiling each cochlear
domain separately to assess rare cell populations (e.g., type 2
SGNs, spindle cells, IHCs). Hopefully, spatial transcriptomics
will reach a depth and resolution similar to standard scRNA-
seq approaches and replace them as the gold standard, an
advancement that will significantly reduce the cost of experi-
ments and usage of animals. In summary, this rich resource pro-
vides users with unprecedented access to the transcriptomic
cell-type-specific response to PTS-inducing noise exposure
and could be used as a benchmark for molecular testing of the
response of various cell types in the cochlea to new therapeutics
to treat NIHL.
STAR+METHODS
Detailed methods are provided in the online version of this paper
and include the following:
d KEY RESOURCES TABLE
d RESOURCE AVAILABILITY
ar.org)and ana
r and gra
MAPs a
nd Atp1
er explo
cross an
data or
f the LW
B Lead contact
lysis of the processed transcriptomic data presented as part of this
phic, depicting gene expression as log2 fold change), the OHC and SC
nd violin plots).
a1 showing the (log2) fold change in gene expression following noise
re the data in the cloud.
y two conditions within a single dataset, here showing the DEGs in type
use a ‘‘stored analysis’’ to explore marker genes and compare across
dataset (top) and the top 4 DEGs between intermediate and basal cells
Cell Reports 36, 109758, September 28, 2021 15
16
Resourcell
OPEN ACCESS
B Materials availability
B Data and code availability
d EXPERIMENTAL MODEL AND SUBJECT DETAILS
B Mouse models
d METHOD DETAILS
B Genotyping
B Induction of Cre expression
B Noise exposure
B Auditory physiology
B Ribosome immunoprecipitation and RNA extraction
B Reverse transcription and real-time PCR
B tdTomato expression
B Cytocochleogram
B RNA quantification using nanoString technology
B Flow cytometry for CD45+ immune cells
B Cell dissociation of spiral ganglion neurons
B Cell dissociation of the lateral wall
B In situ hybridization using RNAscope
B Library preparations and sequencing
B Bioinformatic analyses
d QUANTIFICATION AND STATISTICAL ANALYSIS
SUPPLEMENTAL INFORMATION
Supplemental information can be found online at https://doi.org/10.1016/j.
celrep.2021.109758.
ACKNOWLEDGMENTS
The authors would like to thank Hela Azaiez, PhD, and Mr. Mark Wieber for
technical support (R.H.), SciLife for assisting with the scRNA-seq (B.C.), Ms.
Evangelia Tserga for assisting with the collection of tissues for the scRNA-
seq (B.C.), and the Eukaryotic Single Cell Genomics facility at Science for
Life Laboratory in Stockholm (B.C.). This work was funded by NIDCD/NIH
R01DC013817 and R01DC03544, DOD CDMRP MR130240 and RH200052,
Carolyn Frenkil Foundation, and the Hearing Restoration Project (HRP) of
the Hearing Health Foundation (R.H.); the Swedish Medical Research Council
and Horselforskningsfonden (B.C.); the Karolinska Institutet, Tysta Skolan, and
Office of the Assistant Secretary of Defense for Health Affairs, through the
Neurosensory and Rehabilitation under award no. W81XWH-16-1-0032
(B.C. and C.R.C.); and the European Union’s Horizon 2020 research and inno-
vation programme nos. 722046 and 848261 (C.R.C). This work was also sup-
ported by The United States - Israel Binational Science Foundation (2017218;
R.H. and R.E.); The Edmond J. Safra Center for Bioinformatics at Tel Aviv Uni-
versity (E.D.S. and R.E.); and Teva Pharmaceutical Industries, Ltd. and the
Israeli National Forum for BioInnovators (E.D.S.). Some illustrations in the
graphical abstract were created with BioRender (https://biorender.com/).
AUTHOR CONTRIBUTIONS
Conceptualization, K.S.S., G.P., C.R.C., J.B.S., A.T.P., J.B., B.C., and R.H.;
methodology, E.D.S., K.S.S., G.P., J.B.S., A.T.P., D.A.D., J.B., B.C., R.E.,
and R.H.; software, J.O. and R.H.; validation, B.M, E.L.L., B.S., and R.H.;
formal analysis, B.M., E.D.S., G.P., M.S., Y.S., B.C., R.E., and R.H.; investiga-
tion, B.M., E.D.S., K.S.S., E.L.L., G.P., H.S., B.S., S.M., Z.M., Y.O., C.S.,
J.B.S., A.T.P., J.B., B.C., and R.H.; resources, J.O., A.T.P., J.B., B.C., and
R.H.; data curation, B.M., E.D.S., Y.S., G.P., R.E., and R.H.; writing – original
draft, B.M., E.D.S., C.R.C., B.C., R.E., and R.H.; writing – review & editing,
B.M., E.D.S., K.S.S., E.L.L., G.P., C.R.C., J.B.S., D.A.D., J.B., B.C., R.E.,
and R.H.; visualization, B.M., E.D.S., E.L.L., Y.S., J.O., and R.H.; supervision,
C.R.C., D.A.D., A.T.P., J.B., B.C., R.E., and R.H.; project administration, B.C.
and R.H.; funding acquisition, B.C., R.E., and R.H.
Cell Reports 36, 109758, September 28, 2021
DECLARATION OF INTERESTS
K.S.S., J.B.S., G.P., A.T.P., and J.B. are employees of Decibel Therapeutics.
The data presented in this manuscript are registered for pending U.S. Provi-
sional Patent Application, number: 63/151,249, title: ‘‘System and Methods
for Cell Type-Specific Atlas for the Inner Ear Transcriptional Response to
Acoustic Trauma,’’ and UMB docket number: RH-2021-073.
Received: April 23, 2021
Revised: July 29, 2021
Accepted: September 3, 2021
Published: September 28, 2021
REFERENCES
Aibar, S., Gonzalez-Blas, C.B., Moerman, T., Huynh-Thu, V.A., Imrichova, H.,
Hulselmans, G., Rambow, F., Marine, J.C., Geurts, P., Aerts, J., et al. (2017).
SCENIC: single-cell regulatory network inference and clustering. Nat. Methods
14, 1083–1086.
Amici, S.A., Dunn, W.A., Jr., Murphy, A.J., Adams, N.C., Gale, N.W., Valen-
zuela, D.M., Yancopoulos, G.D., and Notterpek, L. (2006). Peripheral myelin
protein 22 is in complex with a6b4 integrin, and its absence alters the Schwann
cell basal lamina. J. Neurosci. 26, 1179–1189.
Arnold, K., Sarkar, A., Yram, M.A., Polo, J.M., Bronson, R., Sengupta, S.,
Seandel, M., Geijsen, N., and Hochedlinger, K. (2011). Sox2(+) adult stem
and progenitor cells are important for tissue regeneration and survival of
mice. Cell Stem Cell 9, 317–329.
Bae, S.H., Yoo, J.E., Choe, Y.H., Kwak, S.H., Choi, J.Y., Jung, J., and Hyun,
Y.-M. (2021). Neutrophils infiltrate into the spiral ligament but not the stria vas-
cularis in the cochlea during lipopolysaccharide-induced inflammation. Thera-
nostics 11, 2522–2533.
Bakken, T.E., Hodge, R.D., Miller, J.A., Yao, Z., Nguyen, T.N., Aevermann, B.,
Barkan, E., Bertagnolli, D., Casper, T., Dee, N., et al. (2018). Single-nucleus
and single-cell transcriptomes compared in matched cortical cell types.
PLoS ONE 13, e0209648.
Bankhead, P., Loughrey, M.B., Fernandez, J.A., Dombrowski, Y., McArt, D.G.,
Dunne, P.D., McQuaid, S., Gray, R.T., Murray, L.J., Coleman, H.G., et al.
(2017). QuPath: Open source software for digital pathology image analysis.
Sci. Rep. 7, 16878.
Bullen, A., Anderson, L., Bakay, W., and Forge, A. (2019). Localized disorgani-
zation of the cochlear inner hair cell synaptic region after noise exposure. Biol.
Open 8, bio038547.
Burns, J.C., Collado, M.S., Oliver, E.R., and Corwin, J.T. (2013). Specializa-
tions of intercellular junctions are associated with the presence and absence
of hair cell regeneration in ears from six vertebrate classes. J. Comp. Neurol.
521, 1430–1448.
Butler, A., Hoffman, P., Smibert, P., Papalexi, E., and Satija, R. (2018). Inte-
grating single-cell transcriptomic data across different conditions, technolo-
gies, and species. Nat. Biotechnol. 36, 411–420.
Cadwell, C.R., Palasantza, A., Jiang, X., Berens, P., Deng, Q., Yilmaz, M., Re-
imer, J., Shen, S., Bethge, M., Tolias, K.F., et al. (2016). Electrophysiological,
transcriptomic and morphologic profiling of single neurons using Patch-seq.
Nat. Biotechnol. 34, 199–203.
Cai, Q., Vethanayagam, R.R., Yang, S., Bard, J., Jamison, J., Cartwright, D.,
Dong, Y., and Hu, B.H. (2014). Molecular profile of cochlear immunity in the
resident cells of the organ of Corti. J. Neuroinflammation 11, 173.
Cederroth, C.R., Canlon, B., and Langguth, B. (2013). Hearing loss and
tinnitus–are funders and industry listening? Nat. Biotechnol. 31, 972–974.
Cederroth, C.R., Park, J.S., Basinou, V., Weger, B.D., Tserga, E., Sarlus, H.,
Magnusson, A.K., Kadri, N., Gachon, F., and Canlon, B. (2019). Circadian
Regulation of Cochlear Sensitivity to Noise by Circulating Glucocorticoids.
Curr. Biol. 29, 2477–2487.e6.
Resourcell
OPEN ACCESS
Chen, Z., Peppi, M., Kujawa, S.G., and Sewell, W.F. (2009). Regulated expres-
sion of surface AMPA receptors reduces excitotoxicity in auditory neurons.
J. Neurophysiol. 102, 1152–1159.
Chen, H.C., Chung, C.H., Lu, C.H., and Chien, W.C. (2019). Metformin de-
creases the risk of sudden sensorineural hearing loss in patients with diabetes
mellitus: A 14-year follow-up study. Diab. Vasc. Dis. Res. 16, 324–327.
Chessum, L., Matern, M.S., Kelly, M.C., Johnson, S.L., Ogawa, Y., Milon, B.,
McMurray, M., Driver, E.C., Parker, A., Song, Y., et al. (2018). Helios is a key
transcriptional regulator of outer hair cell maturation. Nature 563, 696–700.
Chung, J.W., Ahn, J.H., Kim, J.Y., Lee, H.J., Kang, H.H., Lee, Y.K., Kim, J.U.,
and Koo, S.W. (2007). The effect of isoflurane, halothane and pentobarbital on
noise-induced hearing loss in mice. Anesth. Analg. 104, 1404–1408.
Clough, E., and Barrett, T. (2016). The Gene Expression Omnibus database.
Methods in Molecular Biology (Humana Press), pp. 93–110.
Coate, T.M., Scott, M.K., and Gurjar, M. (2019). Current concepts in cochlear
ribbon synapse formation. Synapse 73, e22087.
Dobin, A., Davis, C.A., Schlesinger, F., Drenkow, J., Zaleski, C., Jha, S., Batut,
P., Chaisson,M., andGingeras, T.R. (2013). STAR: ultrafast universal RNA-seq
aligner. Bioinformatics 29, 15–21.
Duan, M., Agerman, K., Ernfors, P., and Canlon, B. (2000). Complementary
roles of neurotrophin 3 and a N-methyl-D-aspartate antagonist in the protec-
tion of noise and aminoglycoside-induced ototoxicity. Proc. Natl. Acad. Sci.
USA 97, 7597–7602.
Durinck, S., Spellman, P.T., Birney, E., and Huber, W. (2009). Mapping identi-
fiers for the integration of genomic datasets with the R/Bioconductor package
biomaRt. Nat. Protoc. 4, 1184–1191.
Efremova, M., Vento-Tormo, M., Teichmann, S.A., and Vento-Tormo, R.
(2020). CellPhoneDB: inferring cell-cell communication from combined
expression of multi-subunit ligand-receptor complexes. Nat. Protoc. 15,
1484–1506.
Fang, J., Zhang, W.-C., Yamashita, T., Gao, J., Zhu, M.-S., and Zuo, J. (2012).
Outer hair cell-specific prestin-CreERT2 knockin mouse lines. Genesis 50,
124–131.
Fernandez, K.A., Jeffers, P.W.C., Lall, K., Liberman, M.C., and Kujawa, S.G.
(2015). Aging after noise exposure: acceleration of cochlear synaptopathy in
‘‘recovered’’ ears. J. Neurosci. 35, 7509–7520.
Fernandez, K.A., Watabe, T., Tong, M., Meng, X., Tani, K., Kujawa, S.G., and
Edge, A.S.B. (2021a). Trk agonist drugs rescue noise-induced hidden hearing
loss. JCI Insight 6, e142572.
Fernandez, K.A., Allen, P., Campbell, M., Page, B., Townes, T., Li, C.M.,
Cheng, H., Garrett, J., Mulquin, M., Clements, A., et al. (2021b). Atorvastatin
is associated with reduced cisplatin-induced hearing loss. J. Clin. Invest.
131, 131.
Finak, G., McDavid, A., Yajima, M., Deng, J., Gersuk, V., Shalek, A.K., Slichter,
C.K., Miller, H.W., McElrath, M.J., Prlic, M., et al. (2015). MAST: a flexible sta-
tistical framework for assessing transcriptional changes and characterizing
heterogeneity in single-cell RNA sequencing data. Genome Biol. 16, 278.
Frye, M.D., Ryan, A.F., and Kurabi, A. (2019). Inflammation associated with
noise-induced hearing loss. J. Acoust. Soc. Am. 146, 4020–4032.
Furman, A.C., Kujawa, S.G., and Liberman, M.C. (2013). Noise-induced
cochlear neuropathy is selective for fibers with low spontaneous rates.
J. Neurophysiol. 110, 577–586.
GBD 2019 Hearing Loss Collaborators (2021). Hearing loss prevalence and
years lived with disability, 1990–2019: Findings from the Global Burden of Dis-
ease Study 2019. Lancet. 397, 996–1009.
Hafemeister, C., and Satija, R. (2019). Normalization and variance stabilization
of single-cell RNA-seq data using regularized negative binomial regression.
Genome Biol. 20, 296.
Hafidi, A. (1998). Peripherin-like immunoreactivity in type II spiral ganglion cell
body and projections. Brain Res. 805, 181–190.
Hait, T.A., Maron-Katz, A., Sagir, D., Amar, D., Ulitsky, I., Linhart, C., Tanay, A.,
Sharan, R., Shiloh, Y., Elkon, R., and Shamir, R. (2019). The EXPANDER Inte-
grated Platform for Transcriptome Analysis. J. Mol. Biol. 431, 2398–2406.
Hashimoto, K., Hickman, T.T., Suzuki, J., Ji, L., Kohrman, D.C., Corfas, G., and
Liberman, M.C. (2019). Protection from noise-induced cochlear synaptopathy
by virally mediated overexpression of NT3. Sci. Rep. 9, 15362.
Herranen, A., Ikaheimo, K., Virkkala, J., and Pirvola, U. (2018). The Stress
Response in the Non-sensory Cells of the Cochlea Under Pathological Condi-
tions-Possible Role in Mediating Noise Vulnerability. J. Assoc. Res. Otolar-
yngol. 19, 637–652.
Hertzano, R., Lipford, E.L., and Depireux, D. (2020a). Noise: Acoustic Trauma
to the Inner Ear. Otolaryngol. Clin. North Am. 53, 531–542.
Hertzano, R., Gwilliam, K., Rose, K.P., Milon, B., and Matern, M.S. (2020b).
Cell Type-Specific Expression Analysis of the Inner Ear: A Technical Report.
Laryngoscope, Published online June 24, 2020. https://doi.org/10.1002/lary.
28765.
Hickman, T.T., Hashimoto, K., Liberman, L.D., and Liberman, M.C. (2020).
Synaptic migration and reorganization after noise exposure suggests regener-
ation in a mature mammalian cochlea. Sci. Rep. 10, 19945.
Hirose, K., and Liberman, M.C. (2003). Lateral wall histopathology and endo-
cochlear potential in the noise-damaged mouse cochlea. J. Assoc. Res. Oto-
laryngol. 4, 339–352.
Hoa, M., Olszewski, R., Li, X., Taukulis, I., Gu, S., DeTorres, A., Lopez, I.A., Lin-
thicum, F.H., Jr., Ishiyama, A., Martin, D., et al. (2020). Characterizing Adult
Cochlear Supporting Cell Transcriptional Diversity Using Single-Cell RNA-
Seq: Validation in the Adult Mouse and Translational Implications for the Adult
Human Cochlea. Front. Mol. Neurosci. 13, 13.
Hu, N., Rutherford, M.A., and Green, S.H. (2020). Protection of cochlear syn-
apses from noise-induced excitotoxic trauma by blockade of Ca2+-permeable
AMPA receptors. Proc. Natl. Acad. Sci. USA 117, 3828–3838.
Huang, W., Sherman, B.T., and Lempicki, R.A. (2009a). Bioinformatics enrich-
ment tools: paths toward the comprehensive functional analysis of large gene
lists. Nucleic Acids Res. 37, 1–13.
Huang, W., Sherman, B.T., and Lempicki, R.A. (2009b). Systematic and inte-
grative analysis of large gene lists using DAVID bioinformatics resources.
Nat. Protoc. 4, 44–57.
Hunt, D., Raivich, G., and Anderson, P.N. (2012). Activating transcription factor
3 and the nervous system. Front. Mol. Neurosci. 5, 7.
Jongkamonwiwat, N., Ramirez, M.A., Edassery, S., Wong, A.C.Y., Yu, J., Ab-
bott, T., Pak, K., Ryan, A.F., and Savas, J.N. (2020). Noise Exposures Causing
Hearing Loss Generate Proteotoxic Stress and Activate the Proteostasis
Network. Cell Rep. 33, 108431.
Kesici, G.G., Ocal, F.C.A., G€urgen, S.G., Erdem, Sx.R., O�g€usx, E., Erbek, H.S.,and Ozl€uo�glu, L.N. (2018). The protective effect of metformin against the
noise-induced hearing loss. Eur. Arch. Otorhinolaryngol. 275, 2957–2966.
Kim, J.U., Lee, H.J., Kang, H.H., Shin, J.W., Ku, S.W., Ahn, J.H., Kim, Y.J., and
Chung, J.W. (2005). Protective effect of isoflurane anesthesia on noise-
induced hearing loss in mice. Laryngoscope 115, 1996–1999.
Kim, K.X., Payne, S., Yang-Hood, A., Li, S.Z., Davis, B., Carlquist, J., V-Ghaf-
fari, B., Gantz, J.A., Kallogjeri, D., Fitzpatrick, J.A.J., et al. (2019). Vesicular glu-
tamatergic transmission in noise-induced loss and repair of cochlear ribbon
synapses. J. Neurosci. 39, 4434–4447.
Kleshchevnikov, V., Shmatko, A., Dann, E., Aivazidis, A., King, H.W., Li, T., Lo-
makin, A., Kedlian, V., Jain, M.S., Park, J.S., et al. (2020). Comprehensive
mapping of tissue cell architecture via integrated single cell and spatial tran-
scriptomics. bioRxiv. https://doi.org/10.1101/2020.11.15.378125.
Kolla, L., Kelly, M.C., Mann, Z.F., Anaya-Rocha, A., Ellis, K., Lemons, A., Pa-
lermo, A.T., So, K.S., Mays, J.C., Orvis, J., et al. (2020). Characterization of
the development of the mouse cochlear epithelium at the single cell level.
Nat. Commun. 11, 2389.
Korrapati, S., Taukulis, I., Olszewski, R., Pyle, M., Gu, S., Singh, R., Griffiths,
C., Martin, D., Boger, E., Morell, R.J., and Hoa, M. (2019). Single Cell and
Cell Reports 36, 109758, September 28, 2021 17
Resourcell
OPEN ACCESS
Single Nucleus RNA-SeqReveal Cellular Heterogeneity andHomeostatic Reg-
ulatory Networks in Adult Mouse Stria Vascularis. Front. Mol. Neurosci. 12,
316.
Kutzing, M.K., Luo, V., and Firestein, B.L. (2012). Protection from glutamate-
induced excitotoxicity by memantine. Ann. Biomed. Eng. 40, 1170–1181.
Liberman, M.C., and Kiang, N.Y. (1978). Acoustic trauma in cats. Cochlear pa-
thology and auditory-nerve activity. Acta Otolaryngol. Suppl. 358, 1–63.
Liberman, M.C., and Kujawa, S.G. (2017). Cochlear synaptopathy in acquired
sensorineural hearing loss: Manifestations and mechanisms. Hear. Res. 349,
138–147.
Liberman, L.D., Suzuki, J., and Liberman, M.C. (2015). Dynamics of cochlear
synaptopathy after acoustic overexposure. J. Assoc. Res. Otolaryngol. 16,
205–219.
Love, M.I., Huber, W., and Anders, S. (2014). Moderated estimation of fold
change and dispersion for RNA-seq data with DESeq2. Genome Biol. 15, 550.
Madisen, L., Zwingman, T.A., Sunkin, S.M., Oh, S.W., Zariwala, H.A., Gu, H.,
Ng, L.L., Palmiter, R.D., Hawrylycz, M.J., Jones, A.R., et al. (2010). A robust
and high-throughput Cre reporting and characterization system for the whole
mouse brain. Nat. Neurosci. 13, 133–140.
Maeda, Y., Kariya, S., Uraguchi, K., Takahara, J., Fujimoto, S., Sugaya, A., and
Nishizaki, K. (2021). Immediate changes in transcription factors and synaptic
transmission in the cochlea following acoustic trauma: A gene transcriptome
study. Neurosci. Res. 165, 6–13.
Mandelboum, S., Manber, Z., Elroy-Stein, O., and Elkon, R. (2019). Recurrent
functional misinterpretation of RNA-seq data caused by sample-specific gene
length bias. PLoS Biol. 17, e3000481.
McPherson, D.R. (2018). Sensory hair cells: An introduction to structure and
physiology. Integr. Comp. Biol. 58, 282–300.
Milon, B., Mitra, S., Song, Y., Margulies, Z., Casserly, R., Drake, V., Mong, J.A.,
Depireux, D.A., and Hertzano, R. (2018). The impact of biological sex on the
response to noise and otoprotective therapies against acoustic injury in
mice. Biol. Sex Differ. 9, 12.
Monzack, E.L., and Cunningham, L.L. (2013). Lead roles for supporting actors:
critical functions of inner ear supporting cells. Hear. Res. 303, 20–29.
M€uller, M., von H€unerbein, K., Hoidis, S., and Smolders, J.W.T. (2005). A phys-
iological place-frequency map of the cochlea in the CBA/J mouse. Hear. Res.
202, 63–73.
Oishi, N., Kendall, A., and Schacht, J. (2014). Metformin protects against
gentamicin-induced hair cell death in vitro but not ototoxicity in vivo. Neurosci.
Lett. 583, 65–69.
Orvis, J., Gottfried, B., Kancherla, J., Adkins, R.S., Song, Y., Dror, A.A., Olley,
D., Rose, K., Chrysostomou, E., Kelly, M.C., et al. (2021). gEAR: Gene Expres-
sion Analysis Resource portal for community-driven, multi-omic data explora-
tion. Nat. Methods 18, 843–844.
Pakos-Zebrucka, K., Koryga, I., Mnich, K., Ljujic, M., Samali, A., and Gorman,
A.M. (2016). The integrated stress response. EMBO Rep. 17, 1374–1395.
Park, J.S., Kim, S.W., Park, K., Choung, Y.H., Jou, I., and Park, S.M. (2012).
Pravastatin attenuates noise-induced cochlear injury in mice. Neuroscience
208, 123–132.
Peixoto Pinheiro, B., Vona, B., Lowenheim, H., R€uttiger, L., Knipper, M., and
Adel, Y. (2021). Age-related hearing loss pertaining to potassium ion channels
in the cochlea and auditory pathway. Pflugers Arch. 473, 823–840.
Perkins, R.E., andMorest, D.K. (1975). A study of cochlear innervation patterns
in cats and rats with the Golgi method andNomarkski Optics. J. Comp. Neurol.
163, 129–158.
Petitpre, C., Wu, H., Sharma, A., Tokarska, A., Fontanet, P., Wang, Y., Helm-
bacher, F., Yackle, K., Silberberg, G., Hadjab, S., and Lallemend, F. (2018).
Neuronal heterogeneity and stereotyped connectivity in the auditory afferent
system. Nat. Commun. 9, 3691.
Puel, J.L., d’Aldin, C., Ruel, J., Ladrech, S., and Pujol, R. (1997). Synaptic
repair mechanisms responsible for functional recovery in various cochlear pa-
thologies. Acta Otolaryngol 117, 214–218.
18 Cell Reports 36, 109758, September 28, 2021
Puel, J.L., Ruel, J., Gervais d’Aldin, C., and Pujol, R. (1998). Excitotoxicity and
repair of cochlear synapses after noise-trauma induced hearing loss. Neurore-
port 9, 2109–2114.
Rai, V., Wood, M.B., Feng, H., Schabla, N.M., Tu, S., and Zuo, J. (2020). The
immune response after noise damage in the cochlea is characterized by a het-
erogeneous mix of adaptive and innate immune cells. Sci. Rep. 10, 15167.
Robertson, N.G., Resendes, B.L., Lin, J.S., Lee, C., Aster, J.C., Adams, J.C.,
and Morton, C.C. (2001). Inner ear localization of mRNA and protein products
of COCH, mutated in the sensorineural deafness and vestibular disorder,
DFNA9. Hum. Mol. Genet. 10, 2493–2500.
Ruel, J., Wang, J., Pujol, R., Hameg, A., Dib, M., and Puel, J.L. (2005). Neuro-
protective effect of riluzole in acute noise-induced hearing loss. Neuroreport
16, 1087–1090.
Ruel, J., Wang, J., Rebillard, G., Eybalin, M., Lloyd, R., Pujol, R., and Puel, J.L.
(2007). Physiology, pharmacology and plasticity at the inner hair cell synaptic
complex. Hear. Res. 227, 19–27.
Ryan, A.F., Kujawa, S.G., Hammill, T., Le Prell, C., and Kil, J. (2016). Temporary
and Permanent Noise-induced Threshold Shifts: A Review of Basic and Clin-
ical Observations. Otol. Neurotol. 37, e271–e275.
Ryugo, D.K., and Parks, T.N. (2003). Primary innervation of the avian and
mammalian cochlear nucleus. Brain Res. Bull. 60, 435–456.
Sadler, E., Ryals, M.M., May, L.A., Martin, D., Welsh, N., Boger, E.T., Morell,
R.J., Hertzano, R., and Cunningham, L.L. (2020). Cell-Specific Transcriptional
Responses to Heat Shock in the Mouse Utricle Epithelium. Front. Cell. Neuro-
sci. 14, 123.
Sanz, E., Yang, L., Su, T., Morris, D.R., McKnight, G.S., and Amieux, P.S.
(2009). Cell-type-specific isolation of ribosome-associated mRNA from com-
plex tissues. Proc. Natl. Acad. Sci. USA 106, 13939–13944.
Schilder, A.G.M., Su, M.P., Blackshaw, H., Lustig, L., Staecker, H., Lenarz, T.,
Safieddine, S., Gomes-Santos, C.S., Holme, R., and Warnecke, A. (2019).
Hearing Protection, Restoration, and Regeneration: An Overview of Emerging
Therapeutics for Inner Ear and Central Hearing Disorders. Otol. Neurotol. 40,
559–570.
Schindelin, J., Arganda-Carreras, I., Frise, E., Kaynig, V., Longair, M., Pietzsch,
T., Preibisch, S., Rueden, C., Saalfeld, S., Schmid, B., et al. (2012). Fiji: an
open-source platform for biological-image analysis. Nat. Methods 9, 676–682.
Seist, R., Tong, M., Landegger, L.D., Vasilijic, S., Hyakusoku, H., Katsumi, S.,
McKenna, C.E., Edge, A.S.B., and Stankovic, K.M. (2020). Regeneration of
Cochlear Synapses by Systemic Administration of a Bisphosphonate. Front.
Mol. Neurosci. 13, 87.
Shi, L., Liu, L., He, T., Guo, X., Yu, Z., Yin, S., andWang, J. (2013). Ribbon syn-
apse plasticity in the cochleae of Guinea pigs after noise-induced silent dam-
age. PLoS ONE 8, e81566.
Shi, L., Liu, K., Wang, H., Zhang, Y., Hong, Z., Wang, M., Wang, X., Jiang, X.,
and Yang, S. (2015). Noise induced reversible changes of cochlear ribbon syn-
apses contribute to temporary hearing loss in mice. Acta Otolaryngol. 135,
1093–1102.
Shi, L., Chang, Y., Li, X., Aiken, S.J., Liu, L., and Wang, J. (2016). Coding def-
icits in noise-induced hidden hearing loss may stem from incomplete repair of
ribbon synapses in the cochlea. Front. Neurosci. 10, 231.
Shrestha, B.R., Chia, C., Wu, L., Kujawa, S.G., Liberman, M.C., and Goodrich,
L.V. (2018). Sensory Neuron Diversity in the Inner Ear Is Shaped by Activity.
Cell 174, 1229–1246.e17.
Song, Y., Milon, B., Ott, S., Zhao, X., Sadzewicz, L., Shetty, A., Boger, E.T., Tal-
lon, L.J., Morell, R.J., Mahurkar, A., and Hertzano, R. (2018). A comparative
analysis of library prep approaches for sequencing low input translatome sam-
ples. BMC Genomics 19, 696.
Stoeckius, M., Zheng, S., Houck-Loomis, B., Hao, S., Yeung, B.Z., Mauck,
W.M., 3rd, Smibert, P., and Satija, R. (2018). Cell Hashing with barcoded anti-
bodies enables multiplexing and doublet detection for single cell genomics.
Genome Biol. 19, 224.
Resourcell
OPEN ACCESS
Stuart, T., Butler, A., Hoffman, P., Hafemeister, C., Papalexi, E., Mauck, W.M.,
3rd, Hao, Y., Stoeckius, M., Smibert, P., and Satija, R. (2019). Comprehensive
Integration of Single-Cell Data. Cell 177, 1888–1902.e21.
Subramanian, A., Tamayo, P., Mootha, V.K., Mukherjee, S., Ebert, B.L., Gil-
lette, M.A., Paulovich, A., Pomeroy, S.L., Golub, T.R., Lander, E.S., and Me-
sirov, J.P. (2005). Gene set enrichment analysis: a knowledge-based approach
for interpreting genome-wide expression profiles. Proc. Natl. Acad. Sci. USA
102, 15545–15550.
Sun, X., Liu, J., Crary, J.F., Malagelada, C., Sulzer, D., Greene, L.A., and Levy,
O.A. (2013). ATF4 protects against neuronal death in cellular Parkinson’s dis-
ease models by maintaining levels of parkin. J. Neurosci. 33, 2398–2407.
Sun, S., Babola, T., Pregernig, G., So, K.S., Nguyen, M., Su, S.M., Palermo,
A.T., Bergles, D.E., Burns, J.C., andM€uller, U. (2018). Hair Cell Mechanotrans-
duction Regulates Spontaneous Activity and Spiral Ganglion Subtype Specifi-
cation in the Auditory System. Cell 174, 1247–1263.e15.
Taghibiglou, C., Martin, H.G.S., Lai, T.W., Cho, T., Prasad, S., Kojic, L., Lu, J.,
Liu, Y., Lo, E., Zhang, S., et al. (2009). Role of NMDA receptor-dependent acti-
vation of SREBP1 in excitotoxic and ischemic neuronal injuries. Nat. Med. 15,
1399–1406.
Ursu, O., Holmes, J., Knockel, J., Bologa, C.G., Yang, J.J., Mathias, S.L.,
Nelson, S.J., and Oprea, T.I. (2017). DrugCentral: online drug compendium.
Nucleic Acids Res. 45 (D1), D932–D939.
van den Brink, S.C., Sage, F., Vertesy, A., Spanjaard, B., Peterson-Maduro, J.,
Baron, C.S., Robin, C., and van Oudenaarden, A. (2017). Single-cell
sequencing reveals dissociation-induced gene expression in tissue subpopu-
lations. Nat. Methods 14, 935–936.
Walters, B.J., Yamashita, T., and Zuo, J. (2015). Sox2-CreER mice are useful
for fate mapping of mature, but not neonatal, cochlear supporting cells in
hair cell regeneration studies. Sci. Rep. 5, 11621.
Wan, G., Corfas, G., and Stone, J.S. (2013). Inner ear supporting cells:
rethinking the silent majority. Semin. Cell Dev. Biol. 24, 448–459.
Wangemann, P. (2002). K+ cycling and the endocochlear potential. Hear. Res.
165, 1–9.
Warchol, M.E. (2019). Interactions between macrophages and the sensory
cells of the inner ear. Cold Spring Harb. Perspect. Med. 9, a033555.
Wilkinson, M.D., Dumontier, M., Aalbersberg, I.J., Appleton, G., Axton, M.,
Baak, A., Blomberg, N., Boiten, J.W., da Silva Santos, L.B., Bourne, P.E.,
et al. (2016). The FAIR Guiding Principles for scientific data management
and stewardship. Sci. Data 3, 160018.
Wilson, T., Omelchenko, I., Foster, S., Zhang, Y., Shi, X., and Nuttall, A.L.
(2014). JAK2/STAT3 inhibition attenuates noise-induced hearing loss. PLoS
ONE 9, e108276.
Wu, P., O’Malley, J.T., de Gruttola, V., and Liberman, M.C. (2020). Age-related
hearing loss is dominated by damage to inner ear sensory cells, not the cellular
battery that powers them. J. Neurosci. 40, 6357–6366.
Yu, G., Wang, L.G., Han, Y., and He, Q.Y. (2012). clusterProfiler: an R package
for comparing biological themes among gene clusters. OMICS 16, 284–287.
Zheng, J., Shen, W., He, D.Z.Z., Long, K.B., Madison, L.D., and Dallos, P.
(2000). Prestin is the motor protein of cochlear outer hair cells. Nature 405,
149–155.
Zheng, G.X.Y., Terry, J.M., Belgrader, P., Ryvkin, P., Bent, Z.W., Wilson, R.,
Ziraldo, S.B., Wheeler, T.D., McDermott, G.P., Zhu, J., et al. (2017). Massively
parallel digital transcriptional profiling of single cells. Nat. Commun. 8, 14049.
Cell Reports 36, 109758, September 28, 2021 19
Resourcell
OPEN ACCESS
STAR+METHODS
KEY RESOURCES TABLE
REAGENT or RESOURCE SOURCE IDENTIFIER
Antibodies
anti-HA.11 BioLegend Cat# 901513; RRID:AB_2565335
anti-prestin Santa-Cruz Biotechnology Cat# sc-22692; RRID:AB_2302038
donkey anti-goat IgG Alexa Fluor� 546 Thermo Fisher Scientific Cat# A-11056; RRID:AB_2534103
CD45-PE (30F11) BioLegend Cat# 103106; RRID:AB_312971
TotalSeqTM A0301-Hashtag1 antibody
(M1/42; 30-F11)
BioLegend Cat# 155801; RRID:AB_2750032
TotalSeqTM A0302-Hashtag2 antibody
(M1/42; 30-F11)
BioLegend Cat# 155803; RRID:AB_2750033
TotalSeqTM A0303-Hashtag3
(M1/42; 30-F11)
BioLegend Cat# 155805; RRID:AB_2750034
TotalSeqTM A0304-Hashtag4
(M1/42; 30-F11)
BioLegend Cat# 155807; RRID:AB_2750035
CD16/CD32 Monoclonal Antibody Thermo Fisher Scientific Cat# 14-0161-82; RRID:AB_467133
Chemicals, peptides, and recombinant proteins
Tamoxifen Sigma-Aldrich Cat# T5648
KetaVed (Ketamine) Covetrus Cat# 048858
Keatminol (Ketamine) Intervet Cat# 511485
AnaSed (Xylazine) Covetrus Cat# 033197
Rompun (Xylazine) Bayer Cat# KP0A43D
Alexa Fluor 488� phalloidin Thermo Fisher Scientific Cat# A12379
AO/PI stain Logos Biosystems Cat# F23001
DynaBeads Dynabeads MyOne Silane Thermo Fisher Scientific Cat# 37002D
SPRI beads Beckman Coulter Cat# B23318
Super Cryoembedding Medium (SCEM) Section-Lab N/A
Critical commercial assays
NEBNext� Ultra Directional RNA Library
Prep Kit for Illumina
New England Biolabs Cat# E7420
nCounter Standard Master Kit NanoString Technologies Cat# NAA-AKIT-048
Chromium single cell 30reagent kit V3 10x Genomics Cat# PN-1000075
Single Cell 30 Reagent Kits v2 10x Genomics Cat# PN-120237
RNAscope Multiplex Fluorescent Reagent
Kit v2
Advanced Cell Diagnostics Cat# 323100
Deposited data
RiboTag raw datasets This paper GEO: GSE168973
SGN and LW raw datasets This paper GEO: GSE168041
CD45+ raw dataset This paper GEO: GSE167078
Analyzed datasets This paper https://umgear.org/p?l=76ae3595
Experimental models: Organisms/strains
Mouse: Ai14 The Jackson Laboratory Stock No: 007914;
RRID:IMSR_JAX:007914
Mouse: RiboTag Kindly provided by Dr. MK Lobo, University
of Maryland Baltimore
RRID:IMSR_JAX:011029
Mouse: Prestin-CreERT2 Kindly provided by Dr J Zuo St. Jude
Children’s Research Hospital
RRID:MGI:5316666
(Continued on next page)
e1 Cell Reports 36, 109758, September 28, 2021
Continued
REAGENT or RESOURCE SOURCE IDENTIFIER
Mouse: Sox2-CreERT2 The Jackson Laboratory Stock No: 017593;
RRID:IMSR_JAX:017593
Mouse: CBA/CaJ The Jackson Laboratory Stock No: 000654;
RRID:IMSR_JAX:000654
Mouse: B6CBAF1/J The Jackson Laboratory Stock No: 100011;
RRID:IMSR_JAX:100011
Mouse: CBA/Ca/Sca Scanbur—*N.B. colony has been
terminated by distributor
Cat# CBSSIMA0
Mouse: Sox2CreERT2/+;RiboTagHA/+;
CBA/CaJ
This paper N/A
Mouse: PrestinCreERT2/+;RiboTagHA/+;
CBA/CaJ
This paper N/A
Oligonucleotides
RNAscope� Probe- Mm-Atf3 Advanced Cell Diagnostics Cat# 426891
RNAscope� Probe- Mm-Atf4 Advanced Cell Diagnostics Cat# 405101
RNAscope� Probe- Mm-Ddit3-C3 Advanced Cell Diagnostics Cat# 317661-C3
RNAscope� Probe- Mm-Gadd45a-C2 Advanced Cell Diagnostics Cat# 460571-C2
RNAscope� Probe- Mm-Runx1-C3 Advanced Cell Diagnostics Cat# 406671-C3
RNAscope� Probe- Mm-Vgf Advanced Cell Diagnostics Cat No. 517421
Oligonucleotides, standard desalting Integrated DNA Technologies Sequences can be found in detailed
methods
Oligonucleotides designed by nanoString Integrated DNA Technologies Sequence IDs can be found in Table S2
Software and algorithms
BioSigRP Tucker-Davis Technologies RRID:SCR_014590
nSolver 4.0 software NanoString Technologies RRID:SCR_003420
Cell Ranger 10x Genomics RRID:SCR_017344
DESeq2 Bioconductor RRID:SCR_015687
DAVID https://david.abcc.ncifcrf.gov/ RRID:SCR_001881
Seurat v3 https://satijalab.org/seurat/ RRID:SCR_016341
MAST Bioconductor RRID:SCR_016340
biomaRt Bioconductor RRID:SCR_019214
Fiji (Schindelin et al., 2012) RRID:SCR_002285
QuPath Bankhead et al., 2017 RRID:SCR_018257
gene Expression Analysis Resource (gEAR) https://umgear.org/ RRID:SCR_017467
BioRender https://biorender.com/ RRID:SCR_018361
Other
RZ6 Processor Tucker-Davis Technologies N/A
RX6 Processor Tucker-Davis Technologies N/A
1/4’’ microphone PCB Piezotronics Model PCB-378C01
1/4’’ microphone Br€uel and Kjær Models 4939 A 011 and 2690 A 0S1
Microphone Knowles Model EK 23103
Acoustic coupler with a pre-amplifier Etymotic Research Model ER-10B+
Chromium Controller 10x Genomics N/A
GemCode Platform 10x Genomics N/A
Resourcell
OPEN ACCESS
RESOURCE AVAILABILITY
Lead contactFurther information and requests for resources and reagents should be directed to and will be fulfilled by the Lead Contact, Ronna
Hertzano ([email protected]).
Cell Reports 36, 109758, September 28, 2021 e2
Resourcell
OPEN ACCESS
Materials availabilityThis study did not generate new unique reagents.
Data and code availabilityThe raw data generated during this study have been deposited in the Gene Expression Omnibus and are available under accession
numbers GEO: GSE168041 (SGN and lateral wall scRNA-seq), GEO: GSE167078 (CD45+ scRNA-seq) and GEO: GSE168973 (Pres-
tin-CreERT2;RiboTag and Sox2-CreERT2;RiboTag). All of the analyzed data are also available for browsing and analysis via the gene
Expression Analysis Resource (umgear.org; https://umgear.org/NIHL).
This paper does not report original code.
Any additional information required to reanalyze the data reported in this paper is available from the lead contact upon request.
EXPERIMENTAL MODEL AND SUBJECT DETAILS
Mouse modelsAll procedures involving animalswere carried out in accordancewith theNational institutes of HealthGuide for theCare andUse of Lab-
oratory Animals and have been approved by the Institutional Animal Care and Use Committee at the University of Maryland, Baltimore
(protocol numbers 0915006, 1015003, 0918005and 0818004), theUSArmyMedical ResearchandMateriel CommandAnimalCare and
Use Review Office (protocol number MR130240.02), the Decibel Therapeutics Institutional Animal Care and Use Committee and the
guidelines and regulations set forth by Karolinska Institutet and ‘‘Stockholm’s Norra Djurforsoksetiska Namnd’’ N46/17. All mice were
housed in temperature and humidity-controlled facilities with a 12-hour-light/dark cycle and with ad libitum access to food and water.
Male Ai14 mice were purchased from the Jackson laboratory (Stock No: 007914). We generated our experimental colonies by
crossing and backcrossing several strains of mice that are already available. RiboTag mice (here referred as Rpl22-HA) generated
by Dr. Paul S. Amieux (University of Washington) (Sanz et al., 2009) were kindly provided by Dr. Mary-Kay Lobo of the Department
of Neurobiology and Anatomy at University of Maryland Baltimore. Prestin-CreERT2 knockin mice were created and kindly provided
by Dr Jian Zuo of Department of Developmental Neurobiology at St. Jude Children’s Research Hospital (Fang et al., 2012). Sox2-
CreERT2 mice were purchased from the Jackson Laboratory (stock No: 017593) (Arnold et al., 2011). Mice homozygous for the
Sox2-CreERT2 allele are not viable and are therefore maintained as heterozygotes. CBA/CaJ mice were purchased from the Jack-
son Laboratory (Stock No: 000654). B6CBAF1/J mice were purchased from The Jackson Laboratory (Stock No: 100011). CBA/Ca/
Sca mice were obtained from Scanbur and cryopreserved in 2011 at the Karolinska Institute Huddinge, and rederived in 2018 for
this study. Crosses involving the Prestin-CreERT2 mouse model were performed as previously described (Chessum et al., 2018).
Sox2CreERT2/+ were crossed to Rpl22HA/HA to generate Sox2CreERT2/+;Rpl22HA/+. This new strain was backcrossed until obtaining
Sox2CreERT2/+;Rpl22HA/HA and the experimental animals were the progeny of a cross between Sox2CreERT2/+;Rpl22HA/HA with
CBA/CaJ mice.
Male and female mice were used for the RiboTag experiments and male mice were used for the scRNA-seq experiments. Prestin-
CreERT2;RiboTag;CBA/CaJ and Sox2-CreERT2;RiboTag;CBA/CaJ mice were 9 to 11 weeks at the time of the experiments for the
RiboTag datasets. CBA/CaJ mice were 9 weeks and 7 to 8 weeks at the time of the experiments for the spiral ganglion dataset
and lateral wall dataset respectively. CBA/Ca/Sca mice were 12 weeks at the time of the experiment for the CD45(+) dataset.
B6CBAF1/J were 10 weeks at the time of the experiment for RNAscope.
METHOD DETAILS
GenotypingGenotyping of Prestin-CreERT2 alleles and Sox2-CreERT2 alleles was performed by PCRwith the following primers: Prestin-Fw 50-CACAAGTTGTGAATGACCTC-30; Prestin-Rv1 50-TAACTGCTAGCATTTCCCTT-30; Prestin-Rv2 50-GTTAAAGAGCGTAATCTGGAA
CA-30; Sox2-Fw 50-TAAAGATATCTCACGTACTG-30; Sox2-Rv 50-TCTCTGACCAGAGTCATCCT-30; Rpl22-Fw 50-GGGAGGCT
TGCTGGATATG-30; Rpl22-Rv 50-TTTCCAGACACAGGCTAAGTACAC-30. Amplification of the prestin alleles results in a wild-type
band of 300 bp and/or a Prestin-Cre band of 230 bp. The primers for the genotyping of Sox2-CreERT2 are located within the Cre re-
combinase gene, resulting in the amplification of 300 bp product in the presence of Cre and no amplification in the wild-type animals.
Genotyping of the RiboTag alleles was performed as described previously (Sanz et al., 2009).
Induction of Cre expressionFor the experiments with the Ai14 reporter mice, intraperitoneal tamoxifen injections were performed at post-natal day 6 (P6) and P7
at a dose of (3mg tamoxifen / 40 g weight). For noise exposure experiments, expression of Cre recombinase was induced by tamox-
ifen injections (3mg tamoxifen / 40 g weight) for two consecutive days between P10 and P15.
Noise exposureMice exposed to noise were between 2 to 4 months old. Mice were placed awake and unrestrained in a compartmentalized cage
made of perforated aluminum sheet placed in a sound-proof chamber. Noise trauma was induced with an octave band of noise
e3 Cell Reports 36, 109758, September 28, 2021
Resourcell
OPEN ACCESS
centered at 11.3kHz (8-16kHz) at 105 dB sound pressure level (SPL) for 2 hours. Sound level was measured to be within 0.5 dB of the
target level throughout the holding cells, with the speaker above themice. All mice were exposed to noise at the same time of the day
(8am) to avoid introducing changes in gene expression due to circadian rhythm (Cederroth et al., 2019). For the experiments involving
CD45+ immune cells, the following modifications were applied: mice were put on a rotating platform and noise trauma was induced
with a broadband noise at 6-12 kHz at intensity of 110 dB SPL for 2h starting at 8 pm.
Auditory physiologyDPOAE and ABR were performed using the BioSigRP software connected to a Tucker-Davis Technologies System hardware. Mice
were anesthetized using an intraperitoneal injection of a Ketamine (100mg/kg) (KetaVed Injection, Covetrus; or Ketaminol, Intervet)
and Xylazine (10-20mg/kg) (AnaSed Injection, Covetrus; or Rompun, Bayer) drug cocktail. When both DPOAE and ABR were per-
formed, DPOAE were measured first, followed by ABR. Mice were placed on a heating pad to maintain body temperature in a
sound-proof chamber. Output stimuli were calibrated at the beginning of each experiment with a one-quarter inch microphone
(PCB Piezotronics model PCB-378C01; or Br€uel and Kjær, 4939 A 011 and 2690 A 0S1) positioned at the location where an exper-
imental animal’s ear would be. For DPOAE, the acoustic coupler was inserted into the ear canal. A microphone (Knowles, EK 23103)
inserted in the acoustic coupler with a pre-amplifier (Etymotic Research, ER-10B+) and connected to a processor (200 kHz sample
rate) measured sound intensity in the ear-canal. Each speaker played one of two primary tones (f1 and f2) and declined stepwise in 5
dB from 80–10 dB SPL (for f2). To avoid distortion of no physiological origin, stimulus levels were kept % 80 dB SPL. The 2f1 � f2
distortion product wasmeasured with f2 = 8, 12, 16, 24 kHz, f2/f1 = 1.25, and stimulus levels L1 = L2 + 10 dB SPL. DPOAE thresholds
were defined as the lowest level of f1 required to produce a DPOAER�5 dB SPL. Recording electrodes were inserted under the skin
at the inferior postauricular area of the left and right ears, a reference was placed at the base of the skull and a ground electrode was
inserted near the base of the tail. ABRwere evoked by frequency-specific tone bursts 2.5ms long (0.5 ms sinusoidal on and off ramp)
at 8, 16, 24, and 32 kHz and response to each tone stimuluswere recorded for 10ms. A total of 512 sweepswere presented at the rate
of 21 sweeps/s, and responses were averaged at each level and frequency tested. For each frequency, sound intensity was
decreased stepwise from 90 dB SPL in 5 dB steps, until threshold was reached. Threshold was defined as the lowest sound intensity
at which the reproducible waves were visually identifiable. Wave 1 amplitude was determined as the difference between the first
wave peak and its subsequent trough. Baseline ABR thresholds were determined 1 week prior to noise exposure (baseline) and after
the noise exposure at 24 h, 8 days, and 15 days. For the experiments involving CD45+ immune cells, the followingmodifications were
applied: recording electrodes were placed at the head vertex (positive), under the right ear pinna (negative) and above the right leg
(ground). ABRs were evoked by tone bursts 5ms long (0.5 ms rise/fall time) of 8, 12, 16 and 24 kHz, presented 33.3 times per second.
Signals were collected via a low-impedance head stage (RA4LI) connected to a pre-amplifier (RA4PA) and digitally sampled with a
processor (200 kHz sample rate). To determine the threshold, responses to 1000 bursts were bandpass filtered at 0.3–3 kHz using
BioSigRP software and averaged. ABR and DPOAE measurements were performed at 5-7 days prior to noise trauma or sham treat-
ment (baseline) and subsequently at sham treatment, 3 days (d), 7d and 14d post noise trauma.
Ribosome immunoprecipitation and RNA extractionSix hours or 24 hours post-noise exposure, PrestinCreERT2/+;Rpl22HA/+;CBA and Sox2CreERT2/+;Rpl22HA/+;CBA mice (9 to 11 week-
old) were euthanized by CO2 asphyxiation followed by cervical dislocation. Temporal bones were harvested, and cochlear ducts
removed and immediately frozen on dry ice. Of note, while recombination occurs in supporting cells and glial cells with the Sox2-
CreERT2 model, our dissection approach excludes the modiolus and thereby enriches for epithelial cells compared with neuronal tis-
sue (as shown by the divergence in DEGs in Figure S7). Tissue from 8 animals (4 males and 4 females) for each biological replicate of
the prestin line and 4 animals (2 males and 2 females) for each biological replicate of the Sox2 line were processed for ribosome
immunoprecipitation (5 mg of purified anti-HA.11, BioLegend) followed by RNA extraction using the RNeasy Plus Micro kit (QIAGEN)
as previously described (Song et al., 2018). RNA quality was determined using an Agilent Technologies Bioanalyzer 2100 RNA pico
chip as per the manufacturer’s instructions (Agilent Technologies). All samples had a RIN score above 8.
Reverse transcription and real-time PCREfficiency of the ribosome immunoprecipitation was assessed by reverse transcription followed by real time PCR. Equal amounts of
RNA from the input and the RiboTag-IP samples were used for reverse transcription using the Maxima First Strand cDNA Synthesis
Kit for RT-qPCR (Thermo Fisher Scientific). The real time PCR was performed on an Applied Biosystems� StepOnePlus Real-Time
PCR System with the Maxima SYBR Green/ROX qPCR Master Mix (Thermo Fisher Scientific) and the following primers: Gapdh-Fw
50-GGAGAAACCTGCCAAGTATGA-30; Gapdh-Rv 50- TCCTCAGTGTAGCCCAAGA-30; Sox2-Fw 50-CCCACCTACAGCATGTCCT
A-30; Sox2-Rv 50-GTGGGAGGAAGAGGTAACCA-30; Slc26a5-Fw 50-GAAAGGCCCATCTTCAGTCATC-30; Slc26a5-Rv 50-GCCACT-
TAGTGATAGGCAGGAAC-30; Pou3f4-Fw 50-CTGCCTCGAATCCCTACAGC-30; Pou3f4-Rv 50-CTGCAAGTAGTCACTTTGGAGAA-30.
tdTomato expressionMice were euthanized and their temporal bones removed, fixed with 4% paraformaldehyde (PFA) (Alfa Aesar) overnight at 4�Cand incubated in EDTA 0.5M until adequate decalcification. Cochlear ducts were dissected, permeabilized with PBS-0.3% Triton
X-100 before addition of Alexa Fluor 488� phalloidin (1:1000, Thermo Fisher Scientific) to stain F-actin. Tissue was mounted on
Cell Reports 36, 109758, September 28, 2021 e4
Resourcell
OPEN ACCESS
slides with ProLong Gold Antifade Mountant (Thermo Fisher Scientific). Images were acquired using a Zeiss 5Live & Zeiss 510 at
the University of Maryland School of Medicine Center for Innovative Biomedical Resources Confocal Microscopy facility – Balti-
more, Maryland.
CytocochleogramFollowing the final ABR recording, micewere euthanized, and their temporal bones removed and fixedwith 4%PFA (Alfa Aesar) over-
night at 4�C. The temporal bones were then immersed into 0.5M EDTA at 4�C until adequate decalcification. Following decalcifica-
tion, the cochlear ducts were dissected to expose the Organ of Corti. Dissected tissues were permeabilized for 1 hour in PBS-0.5%
TWEEN 20 and blocked for 1 hour in permeabilization buffer supplemented with 5% normal donkey serum (Sigma-Aldrich) at room
temperature. Tissues were then incubated with a goat polyclonal anti-prestin (1:200, Santa-Cruz Biotechnology) at 4�C overnight,
followed by incubation with a donkey anti-goat IgG Alexa Fluor� 546 (1:800, Thermo Fisher Scientific). The nuclei were counter-
stained with 300nM of DAPI and the tissue was mounted with the ProLong Gold antifade reagent (Thermo Fisher Scientific). Fluores-
cence images of the outer hair cell were captured using a Nikon Eclipse E600 microscope (20x objective) equipped with an Infinity 3
camera (Lumenera). Following image capture, cochlear frequencies were mapped using the Measure Line ImageJ plugin developed
by the Eaton-Peabody Laboratories at the Massachusetts Eye and Ear (available for download at https://rsbweb.nih.gov/ij/). Outer
hair cells were counted along the basilarmembrane from the apex toward the base between frequency intervals of 1 to 2 kHz. Hair cell
counts were performed up to 53 kHz (the equivalent of 85% from the apex [M€uller et al., 2005]) as up to this frequency intact samples
could be collected from all biological replicates.
RNA quantification using nanoString technologyRNA extraction was performed as described for the ribosome IP, from one additional replicate for each condition. RNA was pro-
cessed for nanoString at the UMSOM Institute for Genome Sciences using the nCounter Standard Master Kit (nanoString) following
themanufacturer’s instructions. Quantification was performed using the nanoString nCounter platform and data were analyzed using
the nSolver 4.0 software. The probe IDs from nanoString are listed in Table S2.
Flow cytometry for CD45+ immune cellsTo prepare single cell suspension, cochleae from n = 6 mice per experimental condition were pooled and digested in 1xAccutase
(Stem Cell Technology) for 20 min in 37�C, washed with staining buffer containing 1% fetal bovine serum (FBS) in PBS, centrifuged
at 400 g for 5 min at 4�C and plated in a 96-well plate. The cells were blocked with CD16/CD32 (1:200, Thermo Fisher Scientific) and
stained with live dead cell marker using Aqua Live/Dead stain kit (1:1000, Amcyan) in the presence of RNase inhibitor (1:400, Prom-
ega) in PBS for 15 min. After subsequent wash, the cells obtained from each condition were stained with a 1:1 mixture of CD45-PE
(1:200, 30F11, Biolegend) and a corresponding TotalSeq antibody (Biolegend) in staining buffer containing RNase inhibitor (1:400) for
30 min. The following antibodies were used for each condition: TotalSeqTM A0301-Hashtag1 antibody (M1/42, 30F11) for Sham
exposed cells, TotalSeqTM A0302-Hashtag2 antibody (M1/42, 30F11) for 3d, TotalSeqTM A0303-Hashtag3 antibody (M1/42,
30F11) for 7d and TotalSeqTM A0304-Hashtag4 antibody (M1/42, 30F11) for 14d post noise. CD45 positive living cells were sorted
on BDFACS ARIA III (BD Biosciences) in 500 mL collecting buffer containing RNase free 1% BSA (Thermo Fischer Scientific) and
RNase inhibitor (1:400). The cells were centrifuged at 400 g for 5 min at 4�C and resuspended in 50 mL collecting buffer.
Cell dissociation of spiral ganglion neuronsDissection and dissociation of SGN-biased samples from naive (n = 4) and noise exposed (n = 4) 9-week-old-male CBA/CaJ was
done as previously described (Sun et al., 2018). Briefly, temporal bones mice were isolated, and the overlying bone and lateral wall
were extracted leaving just the modiolus, with the spiral ganglion, the spiral limbus, inner sulcus, and portions of the organ of Corti
and outer sulcus remaining. Microdissected tissue from each mouse was pooled and processed for dissociation using collage-
nase IV (Thermo Fisher Scientific) and DNase I (Stem Cell Technologies), followed by incubation with papain (Worthington
Biochemical) and mechanical disruption by trituration. After addition of 20% ovomucoid protease inhibitor (Worthington Biochem-
ical), the cell suspension was passed through a 20 mm filter (pluriSelect) to remove debris. The cells were washed twice with PBS
containing 0.04% BSA (PBS/BSA) and resuspended in PBS/BSA solution. An aliquot was used to count the cells on a Luna FL
automated counter using an AO/PI fluorescent cell viability assay (Logos Biosystems). Time from euthanasia to single-cell capture
was �3h.
Cell dissociation of the lateral wallTemporal bones from naive (n = 4) and noise exposed (n = 4) 7-8 wko, male CBA/CaJ mice were isolated in ice-cold Leibovitz’s L-15
medium. Using a #11 scalpel, the bony wall of the cochlea was removed to reveal the cochlear lateral wall. The lateral wall with
attached stria vascularis was extracted from apex to base and separated from the modiolus and other cochlear tissue. Microdis-
sected tissue was then dissociated into single cells using the collagenase IV and papain enzymemixtures as described for the disso-
ciation of SGN tissue. For the lateral wall tissues, however, the total incubation time in papain was extended to 1 hour to ensure
complete tissue dissociation.
e5 Cell Reports 36, 109758, September 28, 2021
Resourcell
OPEN ACCESS
In situ hybridization using RNAscopeTissue for RNAscope was obtained from male and female B6CBAF1/J mice (F1 progeny of a cross between C57BL/6J females and
CBA/J males, Jackson Laboratory, Stock No: 100011). Mice were non-exposed or exposed to noise at 10 weeks of age (n = 2 males
and 1 female for each condition) as described in the ‘‘Noise Exposure.’’ Animals were euthanized by CO2 asphyxiation at 24h post
noise and the inner ears collected. Tissue was incubated in RNase free 4% paraformaldehyde (Alfa Aesar) at 4�C overnight, followed
by decalcification in 150 mM EDTA (Quality Biological) at 4�C for 3 days. Decalcified inner ears were incubated in a sucrose gradient,
embedded in Super CryoembeddingMedium (SCEM) (Section-Lab), flash frozen in liquid nitrogen and kept at�80�Cuntil sectioning.
Twelve mm sections were obtained using a CM 1850 cryostat (Leica). In situ hybridization was performed using the RNAscope Multi-
plex Fluorescent Reagent Kit v2 (Advanced Cell Diagnostics) following the manufacturer’s instructions with the probes listed in the
key resource table. Images of 0.2 mm sections to create a Z stack were taken using a Nikon W1 spinning disk confocal on Nikon Ti2
inverted microscope (40x oil objective) at the University of Maryland School of Medicine Center for Innovative Biomedical Resources
Confocal Microscopy Facility – Baltimore, Maryland. Images were then processed using the Fiji (ImageJ) program (Schindelin et al.,
2012). Quantification of the RNA dots was performed using QuPath version 0.2.3 (Bankhead et al., 2017). The number of neurons was
obtained using the ‘Cell detection’ tool followed by the ‘Subcellular detection’ tools to quantify individual and clustered dots corre-
sponding to RNA molecules.
Library preparations and sequencingRiboTag samples
TheRNA samples were processed for library preparation using the NEBNext�Ultra Directional RNA Library Prep Kit for Illumina (New
England Biolabs). The libraries were sequenced on an HiSeq 4000 Sequencing System (Illumina) with a configuration of 75 base read
length and pair-end reads.
CD45+ immune cell samples
To generate gene expression libraries from single cells, Chromium single cell 30reagent kit v3 (10x Genomics) was used according to
themanufacturer’s instructions. The number of cells were not counted as the cell numbers were low, but a quality check with Tryptan
blue was performed on the remnant cells in the tube after the cell suspension was loaded onto the chip. Briefly, cells were encap-
sulated into droplets, lysed, and reverse transcribed with barcodes (53�C for 45 min; 85�C for 5 min) in a 96-well Thermal cycler
(Thermo Fisher Scientific). After breaking the droplets, barcoded cDNA was purified with Dynabeads MyOne Silane (Thermo Fisher
Scientific) and PCR-amplified in 11 cycles (98�C for 3min; [98�C for 15, 63�C for 20 s, 72�C for 1min] x 11 cycles; 72�C for 1min. Since
the cells were hash tagged, the Hash Tag Oligonucleotides (Integrated DNA Technologies; custom DNA oligos) were added to the
cDNA Amplification Reaction Mix at volume of 1 mL of a 0.2 mM primer mix. Subsequently, the amplified cDNA was fragmented,
ligated with adapters, sample-indexed and selected with SPRI beads (Beckman Coulter) to average 400 bp size for gene expression
library and 180 bp for HTO library. The resulting cDNA library was sequenced on Illumina NovaSeq 6000 platform.
SGN and lateral wall samples
Single cell capture, library preparation, and sequencing were performed as previously described (Sun et al., 2018). A target capture of
10,000 cells per sample was chosen using the high throughput, droplet microfluidics GemCode platform from 10x Genomics with v2
chemistry (Zheng et al., 2017). Each droplet contains a cell and a gel bead hybridized with oligo(dT) primers encoding a unique cell
barcode and unique molecular identifiers (UMIs) in lysis buffer. Following capture, the transcriptomes captured on gel beads are
pooled and reverse transcribed to cDNA. Reverse transcription and PCR amplification of cDNA, as well as the preparation of a library
from 30 ends were conducted according to the manufacturer’s published protocol. We performed 15 cycles of PCR amplification of
cDNA. The librarywas sequencedon an IlluminaNovaSeq6000at theBroad Institute Sequencing Facility. Readswere demultiplexed,
aligned to the GRCm38 mm10 assembly reference genome, and filtered; and cell barcodes and UMIs were quantified using the
Cell Ranger pipeline with default parameters (https://support.10xgenomics.com/single-cell-gene-expression/software/overview/
welcome). Cell Ranger usesSTAR (Dobin et al., 2013) for alignment andmanufacturer’s software for all other steps (Zhenget al., 2017).
Bioinformatic analysesRiboTag datasets
To focus the analysis on genes that were robustly detected, only those which were covered by at least 40 reads in all replicates of any
condition were considered in our analysis. Counts were than transformed to rpkm units, which normalize the reads by transcript
length allowing for cross comparison between genes, and then further normalized using quantile normalization. Enrichment factor
(EF) in the RiboTag-IP samples compared to the input samples was calculated as log2 of the ratio between the corresponding
average levels. To avoid inflation of EF estimates (due to low level in input samples) we set a floor level that was equal to the 10th
percentile of the expression level distribution. All levels below this floor level were set to this level. We found that EFs were system-
atically correlated with transcript length. We used Lowess normalization to correct for this technical effect (Mandelboum et al., 2019).
We defined the set of OHC-enriched genes as those showing (1) OHC-EF greater than 1.5 (that is, genes showing > 2.83 ( = 21.5)
enrichment in the OHC RiboTag-IP compared to the input sample) and (2) greater than 2-fold enrichment in OHCs compared to
SCs (that is, DEF = OHC-EF – SC-EF > 1). 436 genes met these criteria. Using analogous criteria, 248 genes were called as SC-en-
riched genes. Differentially expressed (DE) genes were detected using DESeq2 (Love et al., 2014). In addition to FDR < 5% we
required that DE genes show clear separation in expression level between the two conditions. Specifically, if a gene showed elevated
Cell Reports 36, 109758, September 28, 2021 e6
Resourcell
OPEN ACCESS
expression in condition.A compared to condition.B, we required that the lowest level measured in condition.A is at least 1.2-fold
higher than the highest level measure for that gene in condition.B. This added criterion significantly increases the confidence of
the called DEGs at the cost of decreased sensitivity. We elected to add this criterion to increase the stringency of the results.
Four out of 36 samples (from Sox2-CreERT2;RiboTag;CBA/CaJ: 1 input and IP baseline samples, 1 input and 1 IP 6h samples)
were excluded because of sequencing technical issues. One Prestin-CreERT2;Ribotag;CBA/CaJ baseline IP sample was detected
as an outlier and was excluded from further analyses. Merging resulting OHC and SC datasets we used DESeq20s regularized log
transformation (rlog) on the original count data, followed by quantile normalization. Cluster analysis was applied to the union of
the DEGs detected in either the OHC or SC dataset. It was done using the CLuster Identification via Connectivity Kernels (CLICK)
algorithm (with default parameters) implemented in the EXpression Analyzer and DisplayER (EXPANDER) package (Hait et al.,
2019). In the combined analysis of the OHC and SC datasets, two additional Prestin-CreERT2;RiboTag;CBA/CaJ samples (1 input
and 1 IP at 6h) were excluded as they appeared as outlier in the principal component analysis. Clustering was done on fold-change
levels (in log2), were calculated in each condition relative to its baseline condition. To focus on response pattern (rather than on
magnitude), fold-change levels of each gene (row) were standardized to mean = 0 and SD = 1. For the integrated cluster analysis
of the OHC and SC datasets, to increased homogeneity of the reported clusters, we filtered each cluster to retain only genes whose
pattern was highly correlated (r > 0.8) with the cluster’s mean pattern. Figures 1J and 1K shows the filtered clusters. GO enrichment
analysis was done using Database for Annotation, Visualization and Integrated Discovery (DAVID) (Huang et al., 2009a, 2009b).
SGN scRNA-seq dataset
Using Seurat v3 (Butler et al., 2018), count matrices from all samples were merged into one matrix of 34,776 cells and 22,292 genes.
Dissociation of cochlea cells often results in red blood cells from outside the cochlea contaminating the sample. As these cells highly
express hemoglobin genes (Hba-a1, Hba-a2, Hbb-bh1, Hbb-bs, Hbb-bt), we filtered out the 546 cells (0.02% of the cells) with 1% or
more reads from hemoglobin genes. In addition, we filtered out cells with more than 10% reads frommitochondrial genes and outlier
cells with more than 7,000 or less than 500 detected genes (Figure S2A), remaining with 25,994 cells. We kept the 17,662 genes that
were expressed in at least 20 cells (median genes detected per cell - 2,165). Clustering was carried using sctransform pipeline imple-
ment by Seurat (Hafemeister and Satija, 2019). Briefly, for normalization of gene counts, we used the Pearson residuals from a regu-
larized negative binomial regression adding the sequencing depth of the cells as a covariate. The dimensional reduction of the
expression matrix was achieved by first selecting the 3,000 (sctransform default) most highly variable genes (HVG) (most variable
Person residuals). TheHVG residuals-cells matrix was transformed using principal component analysis (PCA) and the top 25 principal
components were kept. For clustering, Euclidean distances between cells in this dimensionally reduced space were used to
construct a shared nearest neighbor graph. This graph was used to cluster the cells using the modularity optimization algorithm im-
plemented by Seurat. Uniform Manifold Approximation and Projection (UMAP) was used to visualize the dimensionally reduced
space. For analysis of marker genes, e.g., tables, violin plot and UMAP visualizations of expression, we renormalized the gene counts
using Seurat default normalization (log normalization). This normalization divides gene counts for each cell by the total counts for that
cell and multiplies by 10,000. This is then transformed using a natural log (adding a pseudo count of 1). We identified clusters rep-
resenting neuronal and Schwann cells according to known marker genes (Figure S2B). To achieve clustering resolution that allows
proper separation between neuron subtypes in the SGN, we isolated the 9,327 cells assigned to these clusters and repeated dimen-
sional reduction and clustering analysis. The UMAP indicated that cells were clustered largely according to the experimental condi-
tion (noise or control) (Figure S2C). Therefore, to enable clustering that better reflects cell identity, we merged cells from the noise-
exposed and control samples using an anchor-based integration pipeline implemented by Seurat (Stuart et al., 2019). Briefly, Canon-
ical correlation analysis (CCA) was used to transform a set of 2,000 (default) genes that are most variable in both conditions. A graph
constructed based on the top 30CCA components was used to identify and rank anchors – pairs of control-noise cells that aremutual
nearest neighbors. Then the expression of the most variable genes was adjusted using a transformation designed to minimize vari-
ability between pairs in anchors. The adjusted expression levels obtained from integration were used for dimensional reduction, clus-
tering, and UMAP visualization as described above. Following this integration procedure, we were able to identify type 1, type 2 and
Schwann clusters, but we also identified one cluster, which expressed SGN genes (Nefh, Nefl, Tubb3), but was separated from the
other SGN clusters, and showed high expression ofCoch, a gene known to be highly expressed in fibrocytes (Robertson et al., 2001)
(Figures S2D and S2E).We removed the 411 cells of this cluster and repeated the analysis oncemore. The UMAP confirmed that cells
did not cluster according to treatment (Figure S2F) or individual mice (Figure S2G). As above, for inspection of marker gene expres-
sion, we used log normalization (and not the transformed expression values used for data integration). The marker genes showed
similar expression levels in cells from the control and noise-exposed cells demonstrating that these cell types were confidently
defined in both conditions (Figures S2H–S2J). For analysis of immune cells, we revisited the clustering of 25,994 cells that passed
quality criteria. We isolated 1,499 cells from the clusters specifically expressing monocytes/macrophages and neutrophiles marker
genes (Figure S5J). The anchor-based approach described above was used to re-cluster these cells (Figure 5D; Figure S5K).
Lateral wall scRNA-seq dataset
Wemerged the expression data from all eight samples and obtained amatrix with 36,933 cells and 21,470 genes.We kept the 34,341
cells with less than 1% reads from hemoglobin genes (99.9% of the cells), less than 25% reads from mitochondrial genes, and with
1,000 – 6,000 detected genes (median genes detected per cell - 2,872) (Figure S4A). We filtered out genes expressed in less than 20
cells and left with 16,832 genes. Normalization, dimensional reduction, clustering, and data integration were carried as described
above for the SGN dataset. Cell clusters corresponding to basal, intermediate, spindle/root cells, B cells, fibrocyte, monocyte,
e7 Cell Reports 36, 109758, September 28, 2021
Resourcell
OPEN ACCESS
and neutrophils were identified based on the expression of knownmarker genes (Figures S4B and S4C). We then isolated the 26,259
cells of these eight clusters and repeated dimensional reduction and clustering. Final clusters are shown in Figure 4A. For analysis of
immune cells, we revisited the clustering of 34,341 cells that passed quality criteria. We isolated 655 cells from the clusters specif-
ically expressing monocytes/macrophages and neutrophils marker genes (Figure S5N). The anchor-based approach described
above was used to re-cluster these cells (Figure 5E; Figure S5P). Inspecting the results of this analysis showed a cluster of 53 cells
with outlier percentage of reads from mitochondrial genes (average of 9.5% in comparison to 4.1% for the rest of the cells) (Fig-
ure S5O). We removed these cells and repeated the clustering analysis.
CD45+ cells scRNA-seq dataset
Cells were sequenced following a procedure that utilizes cell hashing with barcoded antibodies for multiplexing (Stoeckius et al.,
2018). We used an antibody directed against CD45 to conjugated Hashtag oligonucleotides (HTOs), assigning a distinct HTO to
each of the four conditions (baseline, 3, 7 and 14 days). Subsequently, the transcriptomic RNA and HTOs from cells of all conditions
were separately sequenced. The Cell Ranger Software Suite (Version 3.0.2) was used for de-multiplexing the samples, to perform
barcode processing and single cell 30UMI counting using mouse mm10 as reference genome. Thus, Cell ranger output consisted
of a 31,053 by 1,556 genes-cells matrix and a 4 by 1,556 HTO-cells matrix. We used Seurat utilities for analysis of Cell Hashing data-
sets to assign condition (HTO) for each cell and to identify cell barcodes corresponding to droplets with zero (negatives) or multiple
cells (doublets). As expected, inferred negatives, singlets, and doublets displayed different distributions of UMI counts (Figure S5A);
singlets and doublets appeared well separated in tSNE visualization based on gene expression (Figure S5B); and cells specifically
expressed their assigned HTO (Figure S5C), indicating a proper assignment of HTOs to cells. We filtered out the 152 cells that
were classified as negatives and the 152 that were classified as doublets. Out of the singlets, we kept 1,123 cells with less than
7% reads frommitochondrial genes, andwithmore than 500 and less than 6,000 detected genes (Figure S5D). Normalization, dimen-
sional reduction, and clustering were carried as described above for the other datasets. Cell clusters did not show any gross impact
for condition/HTO identity of the cells (Figure S5E).Wewere not able to differentiate betweenmonocytes andmacrophages based on
marker genes, and therefore refer to these immune cells as monocytes or monocytes/macrophages.
Differential expression for scRNA-seq datasets
Differential expression analysis was done using Model-based Analysis of Single Cell Transcriptomics (MAST) (Finak et al., 2015). It
was applied to each cell cluster separately, comparing the noise-exposed and control cells. The number of detected genes in each
cell was added as a covariate to MAST model. Only genes expressed in at least 10% of the cells in either condition were tested. A
gene was considered differentially expressed if its FDR q-value was less than 0.05 and its absolute fold change was greater than 1.2.
Hierarchical clustering of the DEGs were done using Ward’s method implemented by R hclust function. As hierarchical clustering
cannot be performed with too many missing values (which in our case, resulted from instances where a gene was not sufficiently
expressed in a cell type to obtain a fold change value from MAST analysis), we replaced missing values with a value of 0.
GO-terms enrichment, hearing loss genes, motif and cell communication analyses for scRNA-seq datasets
For GO-term enrichment analysis, the hypergeometric test implemented by the enricher function from clusterProfile R package was
used (Yu et al., 2012). Gene sets were obtained frommsigdbr R package. For each cell type, the tested target set consisted of either
the up- or downregulated DEGs, while the background set consisted of all the genes that were tested by MAST for that cell type. GO
terms with FDR q-value < 0.05 were considered enriched (A cutoff of q-value < 0.1 was used for the analysis of Srebf1 targets [Fig-
ure S3G]). For the gene set enrichment analysis of hearing loss genes, we used the function GSEA from clusterProfile package. For
each cell type, we rank all its genes according to their log fold change (noise versus control), so that upregulated genes are at the top
of the list and downregulated at the bottom. The input to GSEA function was, for each cell type, the ranked list of genes, and one of the
hearing loss genes lists as the gene set. RcisTarget R package (Aibar et al., 2017) was used for motif analysis, using its gene-motif
rankings for mouse genes which is based on sequences 500 bp upstream the TSSs. For analysis of cell-cell signaling, we used Cell-
PhoneDB (Efremova et al., 2020) with default parameters. As CellPhoneDB is based on human genes, we converted themouse genes
to their human ortholog, using biomaRt (Durinck et al., 2009) and keeping only genes with one-to-one Hs-Mm ortholog mapping. Po-
tential communication between cells is detected byCellPhone based on the expression of a receptor by one cell type and its ligand by
another cell type. To identify candidate drugs that could modify the inner ear response to noise, we intersected the drug-target inter-
action data from DrugCentral (Ursu et al., 2017) with the list of the DEGs identified in all cell types. Keeping interactions of FDA-
approved drugs and of high target activity level (TCRD target development levels classified as ‘Tchem’ or ‘Tclin’), we identified
2,936 DEG/cell-drug pairs from 897 drugs. We next sorted the list of DEG/cell-drug pairs by the number of genes targeted per
drug. Finally, we curated this list by counting only drugs in which their effect opposes the gene expression kinetics measured in
response to PTS-inducing noise, in at least 50% of the interactions (Table S7).
QUANTIFICATION AND STATISTICAL ANALYSIS
Comparison of ABR thresholds before and after noise exposure within a group were analyzed by a two-way ANOVA or a Mixed-
effects analysis with Tukey’s post hoc test for multiple comparisons using Prism 9 software (GraphPad, CA) for the different time
points. Comparisons of OHC loss before and after noise were performed using Student’s t test assuming unequal variance using
Microsoft Excel. Statistical details for each experiment can be found in the figure legends. Significance was defined as p < 0.05
and q < 0.05.
Cell Reports 36, 109758, September 28, 2021 e8
Cell Reports, Volume 36
Supplemental information
A cell-type-specific atlas of
the inner ear transcriptional response
to acoustic trauma
Beatrice Milon, Eldad D. Shulman, Kathy S. So, Christopher R. Cederroth, Erika L.Lipford, Michal Sperber, Jonathan B. Sellon, Heela Sarlus, Gabriela Pregernig, BenjaminShuster, Yang Song, Sunayana Mitra, Joshua Orvis, Zachary Margulies, YokoOgawa, Christopher Shults, Didier A. Depireux, Adam T. Palermo, Barbara Canlon, JoeBurns, Ran Elkon, and Ronna Hertzano
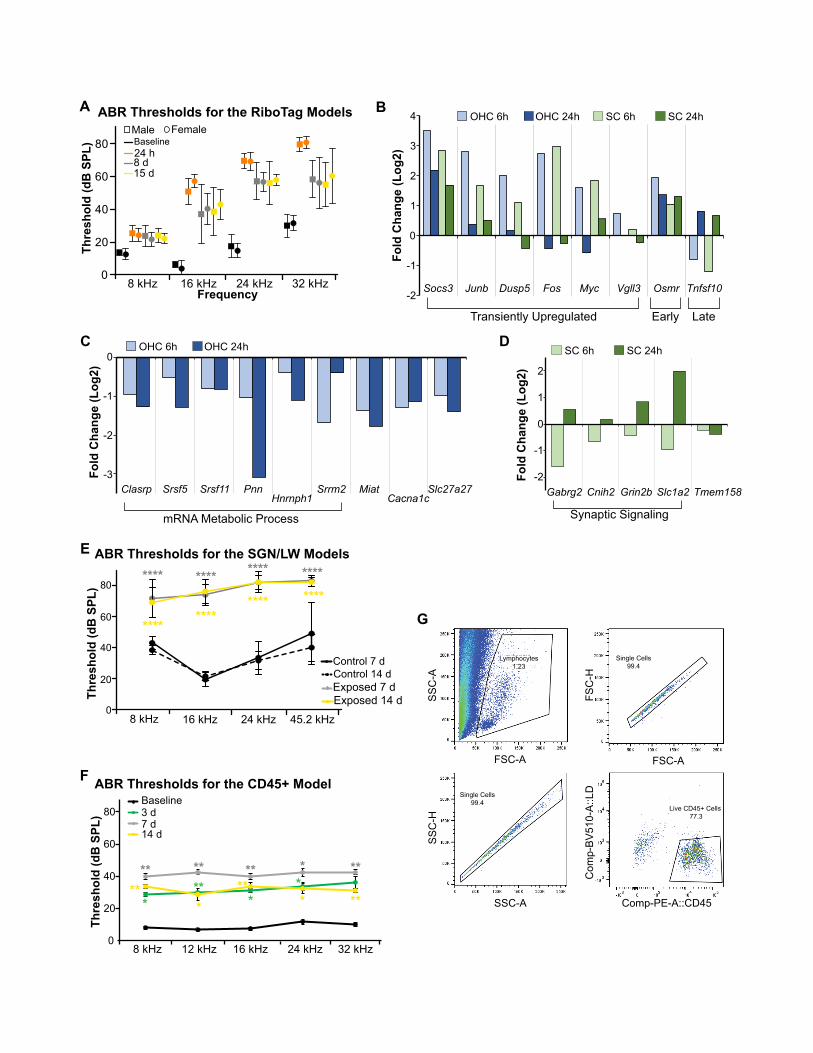
Baseline3 d7 d14 d
80
60
40
20
08 kHz 12 kHz 16 kHz 24 kHz
3
2
1
0
-1
-2 Dusp5 Fos Osmr Tnfsf10
Fold
Cha
nge
(Log
2)1
0
-1
-2Gabrg2 Cnih2
Fold
Cha
nge
(Log
2)
Fold
Cha
nge
(Log
2)
0
-1
-2
A B
C D
E
8 kHz 16 kHz 24 kHz 32 kHz0
20
40
60
80Male FemaleBaseline24 h8 d15 d
Thre
shol
d (d
B S
PL)
Frequency
32 kHz
Thre
shol
d (d
B S
PL)
***
**
** ** ** ***
***
*** **
80
8 kHz 16 kHz 24 kHz 45.2 kHz
60
40
20
0
Thre
shol
d (d
B S
PL)
Control 7 dControl 14 dExposed 7 dExposed 14 d
**** **** **** ****
********
**** ****
FSingle Cells
99.4
Single Cells99.4
Live CD45+ Cells 77.3
Lymphocytes1.23
4
Myc Vgll3Socs3 Junb
Clasrp Srsf5 MiatSrsf11 PnnHnrnph1
Srrm2Cacna1c
-3Slc27a27 Grin2b Slc1a2 Tmem158
2
Synaptic SignalingmRNA Metabolic Process
Transiently Upregulated Early Late
OHC 6h OHC 24h SC 24hSC 6h
OHC 6h OHC 24h SC 24hSC 6h
G
SSC
-ASS
C-H
SSC-A
FSC-A FSC-A
FSC
-HC
omp-
BV51
0-A:
:LD
Comp-PE-A::CD45
ABR Thresholds for the RiboTag Models
ABR Thresholds for the SGN/LW Models
ABR Thresholds for the CD45+ Model
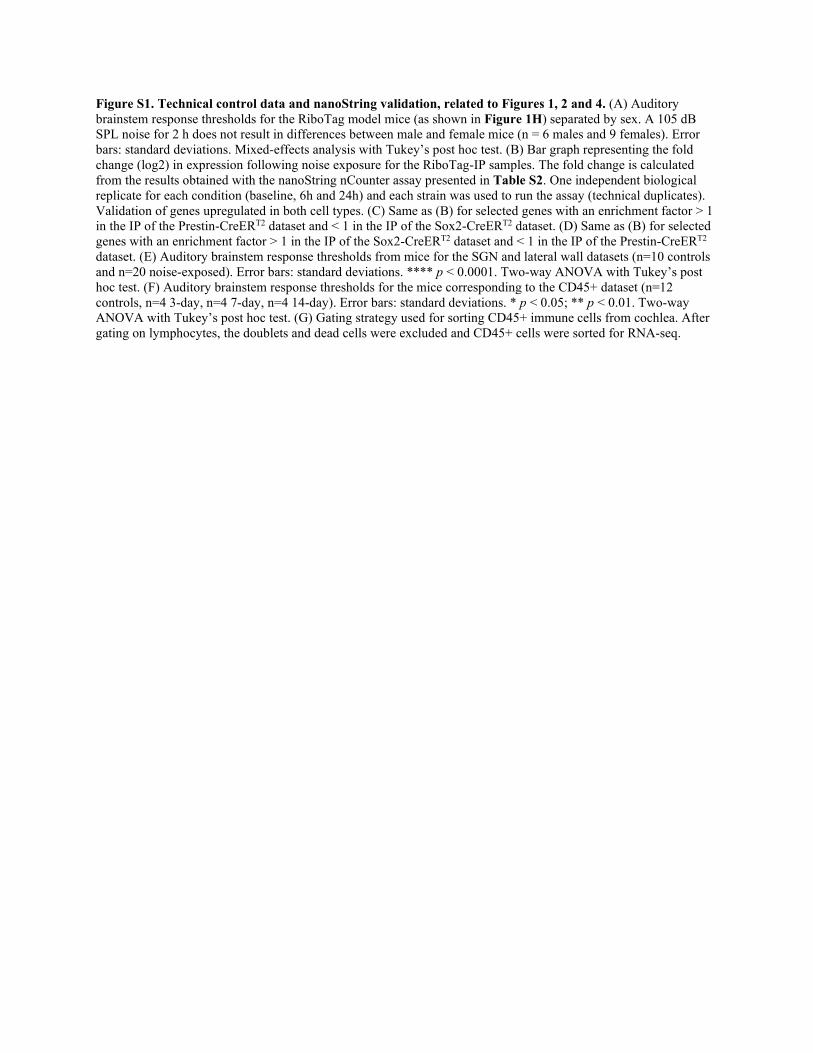
Figure S1. Technical control data and nanoString validation, related to Figures 1, 2 and 4. (A) Auditory brainstem response thresholds for the RiboTag model mice (as shown in Figure 1H) separated by sex. A 105 dB SPL noise for 2 h does not result in differences between male and female mice (n = 6 males and 9 females). Error bars: standard deviations. Mixed-effects analysis with Tukey’s post hoc test. (B) Bar graph representing the fold change (log2) in expression following noise exposure for the RiboTag-IP samples. The fold change is calculated from the results obtained with the nanoString nCounter assay presented in Table S2. One independent biological replicate for each condition (baseline, 6h and 24h) and each strain was used to run the assay (technical duplicates). Validation of genes upregulated in both cell types. (C) Same as (B) for selected genes with an enrichment factor > 1 in the IP of the Prestin-CreERT2 dataset and < 1 in the IP of the Sox2-CreERT2 dataset. (D) Same as (B) for selected genes with an enrichment factor > 1 in the IP of the Sox2-CreERT2 dataset and < 1 in the IP of the Prestin-CreERT2 dataset. (E) Auditory brainstem response thresholds from mice for the SGN and lateral wall datasets (n=10 controls and n=20 noise-exposed). Error bars: standard deviations. **** p < 0.0001. Two-way ANOVA with Tukey’s post hoc test. (F) Auditory brainstem response thresholds for the mice corresponding to the CD45+ dataset (n=12 controls, n=4 3-day, n=4 7-day, n=4 14-day). Error bars: standard deviations. * p < 0.05; ** p < 0.01. Two-way ANOVA with Tukey’s post hoc test. (G) Gating strategy used for sorting CD45+ immune cells from cochlea. After gating on lymphocytes, the doublets and dead cells were excluded and CD45+ cells were sorted for RNA-seq.
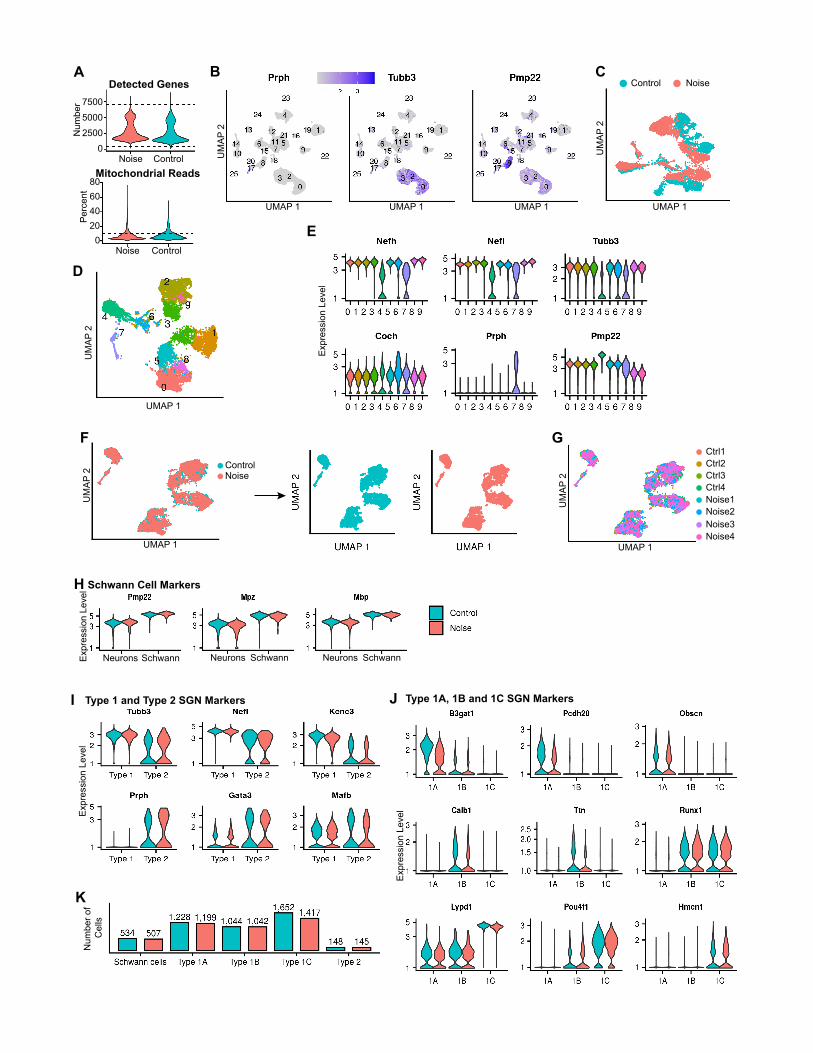
ADetected Genes
750050002500
0
Num
ber
Noise ControlMitochondrial Reads
020406080
Perc
ent
Noise Control
B
UM
AP 2
UMAP 1UMAP 1UMAP 1 UMAP 1
UM
AP 2
CNoiseControl
UMAP 1
UM
AP 2
D
Expr
essi
on L
evel
E
UMAP 1
UM
AP 2
UM
AP 2
UMAP 1
Ctrl1Ctrl2Ctrl3Ctrl4Noise1Noise2Noise3Noise4
GF
NoiseControl
Num
ber o
f C
ells
K
H
I Type 1 and Type 2 SGN Markers Type 1A, 1B and 1C SGN MarkersJ
Schwann Cell Markers
Expr
essi
on L
evel
Neurons Schwann Neurons Schwann Neurons Schwann
Expr
essi
on L
evelEx
pres
sion
Lev
el
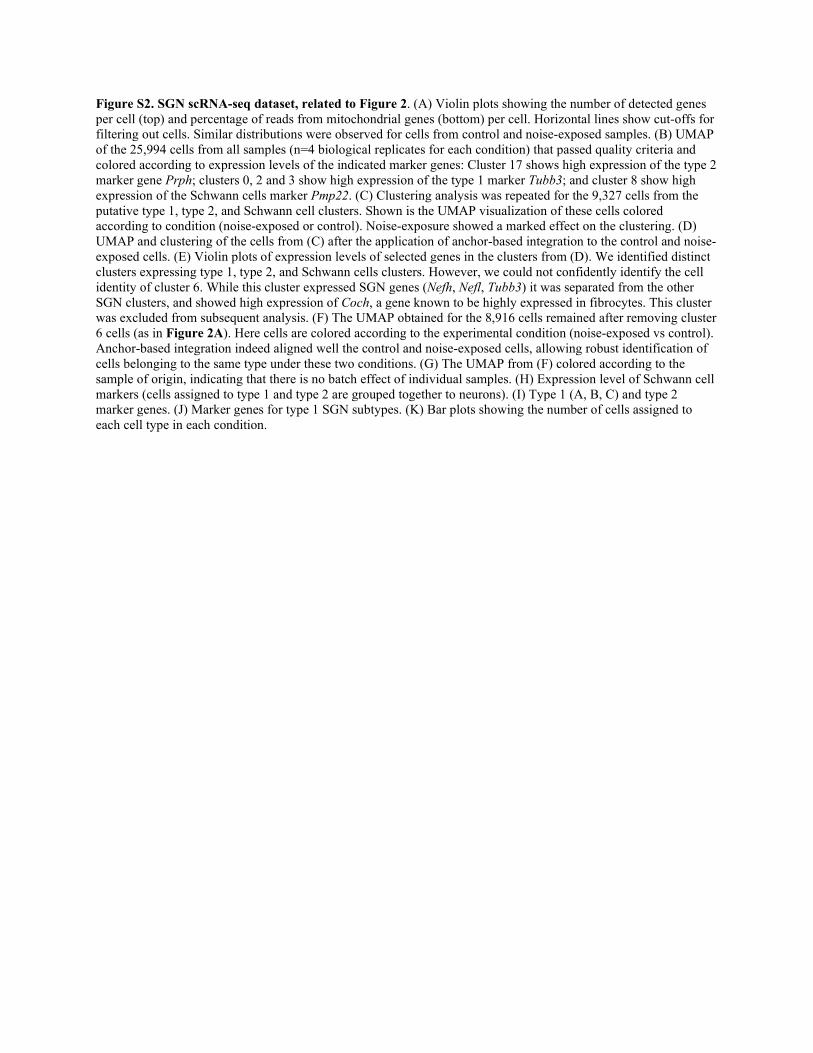
Figure S2. SGN scRNA-seq dataset, related to Figure 2. (A) Violin plots showing the number of detected genes per cell (top) and percentage of reads from mitochondrial genes (bottom) per cell. Horizontal lines show cut-offs for filtering out cells. Similar distributions were observed for cells from control and noise-exposed samples. (B) UMAP of the 25,994 cells from all samples (n=4 biological replicates for each condition) that passed quality criteria and colored according to expression levels of the indicated marker genes: Cluster 17 shows high expression of the type 2 marker gene Prph; clusters 0, 2 and 3 show high expression of the type 1 marker Tubb3; and cluster 8 show high expression of the Schwann cells marker Pmp22. (C) Clustering analysis was repeated for the 9,327 cells from the putative type 1, type 2, and Schwann cell clusters. Shown is the UMAP visualization of these cells colored according to condition (noise-exposed or control). Noise-exposure showed a marked effect on the clustering. (D) UMAP and clustering of the cells from (C) after the application of anchor-based integration to the control and noise-exposed cells. (E) Violin plots of expression levels of selected genes in the clusters from (D). We identified distinct clusters expressing type 1, type 2, and Schwann cells clusters. However, we could not confidently identify the cell identity of cluster 6. While this cluster expressed SGN genes (Nefh, Nefl, Tubb3) it was separated from the other SGN clusters, and showed high expression of Coch, a gene known to be highly expressed in fibrocytes. This cluster was excluded from subsequent analysis. (F) The UMAP obtained for the 8,916 cells remained after removing cluster 6 cells (as in Figure 2A). Here cells are colored according to the experimental condition (noise-exposed vs control). Anchor-based integration indeed aligned well the control and noise-exposed cells, allowing robust identification of cells belonging to the same type under these two conditions. (G) The UMAP from (F) colored according to the sample of origin, indicating that there is no batch effect of individual samples. (H) Expression level of Schwann cell markers (cells assigned to type 1 and type 2 are grouped together to neurons). (I) Type 1 (A, B, C) and type 2 marker genes. (J) Marker genes for type 1 SGN subtypes. (K) Bar plots showing the number of cells assigned to each cell type in each condition.
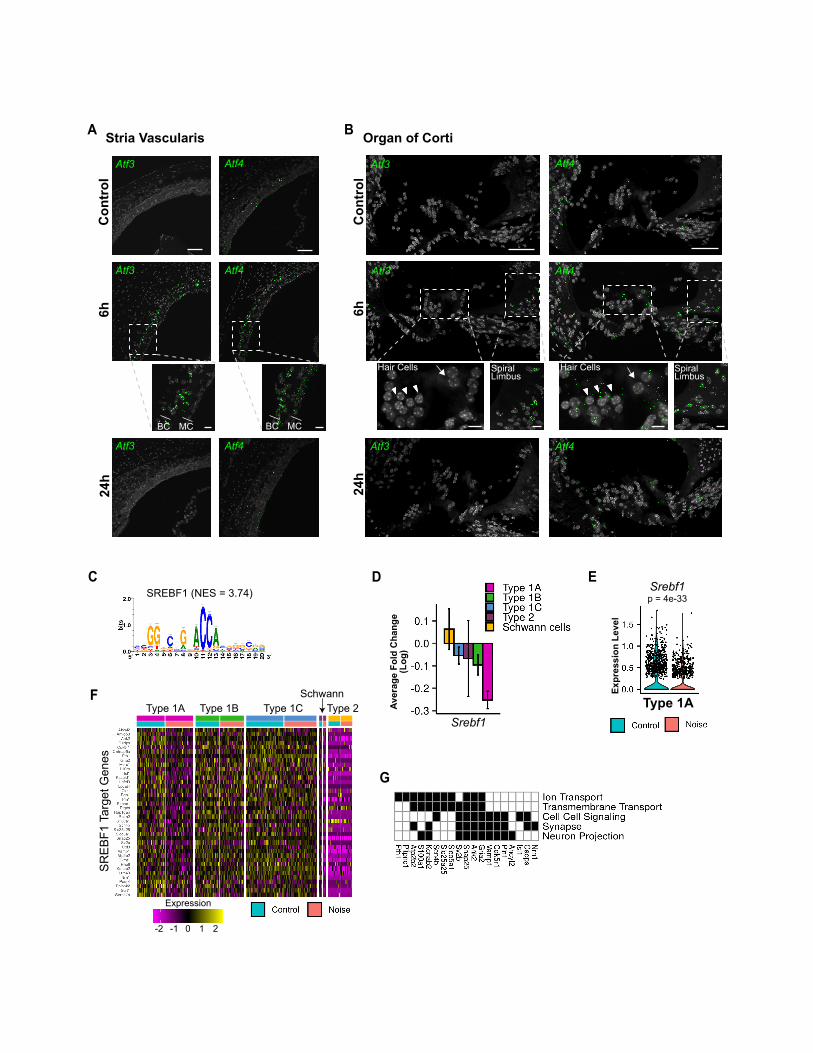
SREBF1 (NES = 3.74)C D
Type 1ASrebf1
Srebf1p = 4e-33
E
G
Type 1A Type 1B Type 1C Type 2SchwannF
SREB
F1 T
arge
t Gen
es
Expression
-2 -1 0 1 2
Expr
essi
on L
evel
Aver
age
Fold
Cha
nge
(Log
)
Atf3
Con
trol
6h24
h
Atf4
A BStria Vascularis Organ of Corti
Atf3
Atf3
Atf4
Atf4
Con
trol
Atf4
6h24
h
Atf3
Atf3
Atf4
Atf3
Atf4
Hair Cells Hair CellsSpiralLimbus
SpiralLimbus
BC MC BC MC
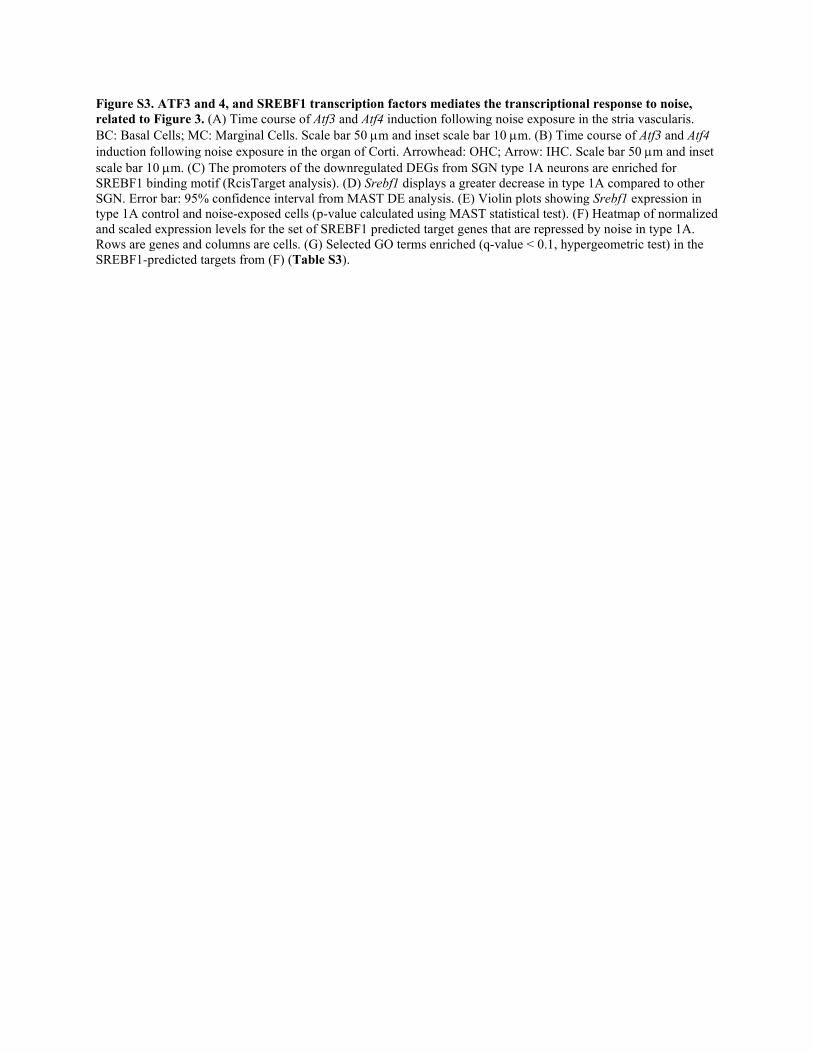
Figure S3. ATF3 and 4, and SREBF1 transcription factors mediates the transcriptional response to noise, related to Figure 3. (A) Time course of Atf3 and Atf4 induction following noise exposure in the stria vascularis. BC: Basal Cells; MC: Marginal Cells. Scale bar 50 µm and inset scale bar 10 µm. (B) Time course of Atf3 and Atf4 induction following noise exposure in the organ of Corti. Arrowhead: OHC; Arrow: IHC. Scale bar 50 µm and inset scale bar 10 µm. (C) The promoters of the downregulated DEGs from SGN type 1A neurons are enriched for SREBF1 binding motif (RcisTarget analysis). (D) Srebf1 displays a greater decrease in type 1A compared to other SGN. Error bar: 95% confidence interval from MAST DE analysis. (E) Violin plots showing Srebf1 expression in type 1A control and noise-exposed cells (p-value calculated using MAST statistical test). (F) Heatmap of normalized and scaled expression levels for the set of SREBF1 predicted target genes that are repressed by noise in type 1A. Rows are genes and columns are cells. (G) Selected GO terms enriched (q-value < 0.1, hypergeometric test) in the SREBF1-predicted targets from (F) (Table S3).
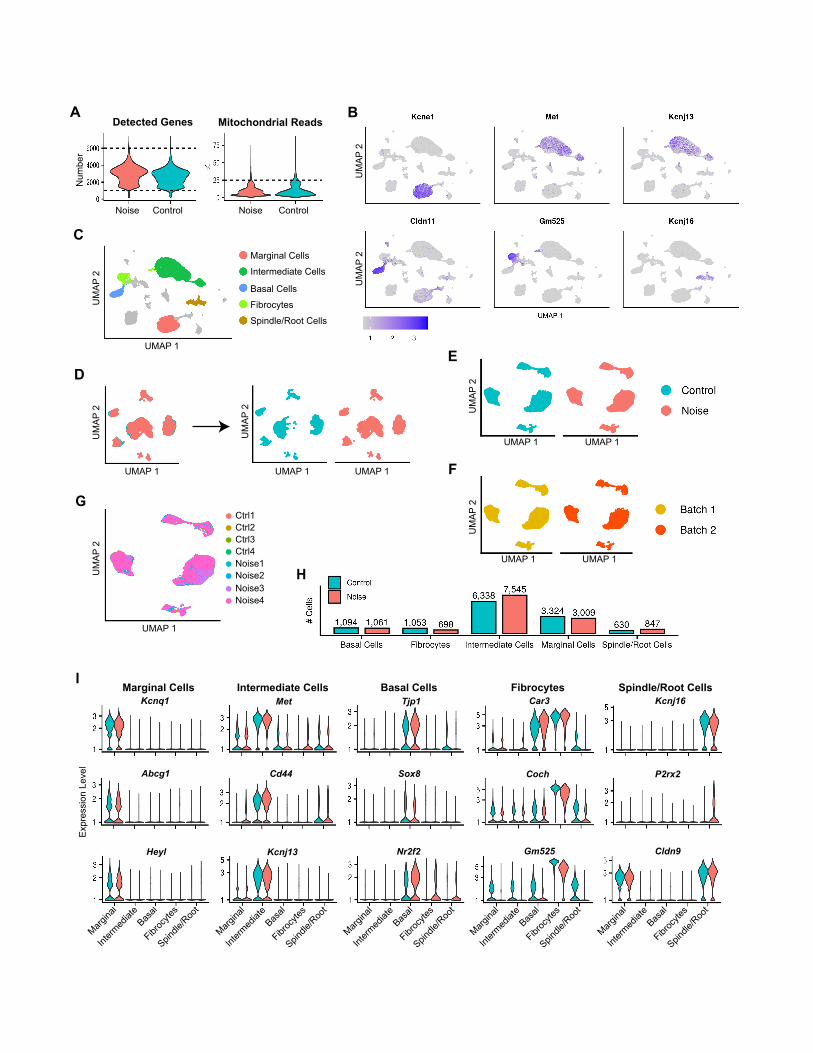
AMitochondrial ReadsDetected Genes
B
C
UMAP 1
UM
AP 2
Marginal Cells
Intermediate Cells
Basal Cells
Fibrocytes
Spindle/Root Cells
Noise Control Noise Control
D
UM
AP 2
UMAP 1
UM
AP 2
UMAP 1 UMAP 1
E
FU
MAP
2U
MAP
2
UMAP 1 UMAP 1
UMAP 1 UMAP 1
GCtrl1Ctrl2Ctrl3Ctrl4Noise1Noise2Noise3Noise4
UMAP 1
UM
AP 2
H
Marginal Cells Intermediate Cells Basal Cells Fibrocytes Spindle/Root Cells
Margina
l
Interm
ediat
eBas
al
Fibroc
ytes
Spindle
/Roo
t
Kcnq1 Met Tjp1
Abcg1 Cd44 Sox8
Heyl Kcnj13 Nr2f2
Car3 Kcnj16
Coch P2rx2
Gm525 Cldn9
Margina
l
Interm
ediat
eBas
al
Fibroc
ytes
Spindle
/Roo
t
Margina
l
Interm
ediat
eBas
al
Fibroc
ytes
Spindle
/Roo
t
Margina
l
Interm
ediat
eBas
al
Fibroc
ytes
Spindle
/Roo
t
Margina
l
Interm
ediat
eBas
al
Fibroc
ytes
Spindle
/Roo
t
Expr
essi
on L
evel
I
UM
AP 2
UM
AP 2
Num
ber
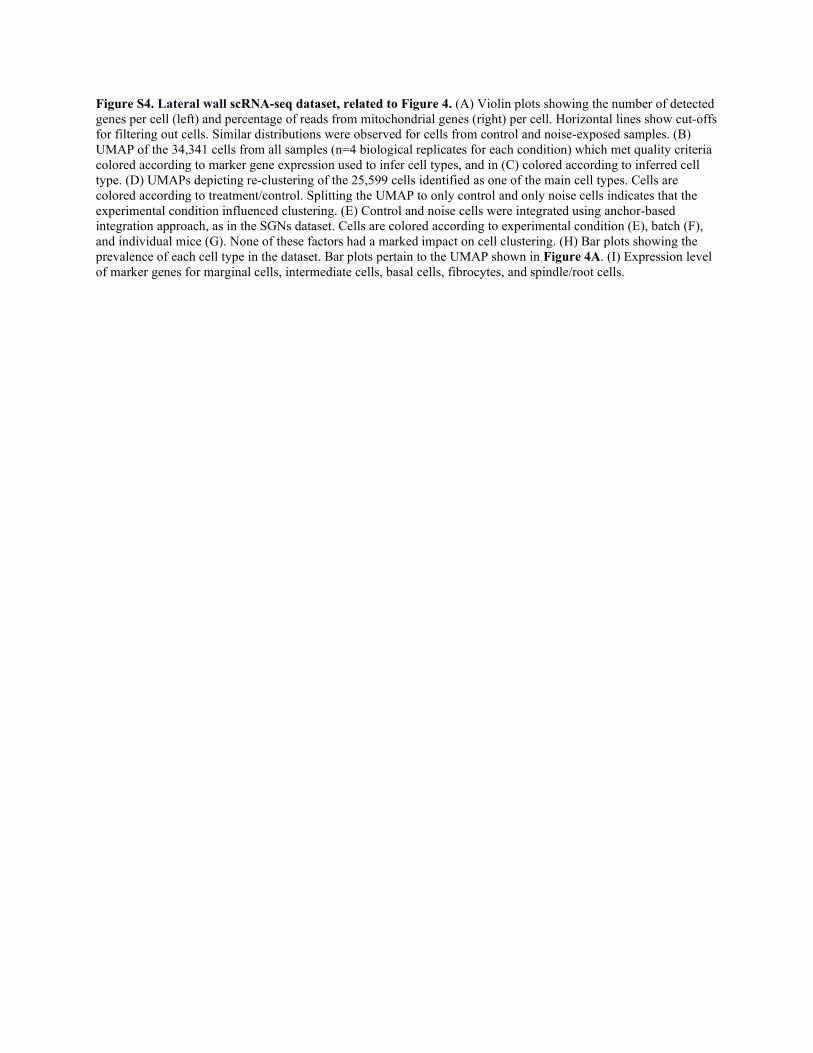
Figure S4. Lateral wall scRNA-seq dataset, related to Figure 4. (A) Violin plots showing the number of detected genes per cell (left) and percentage of reads from mitochondrial genes (right) per cell. Horizontal lines show cut-offs for filtering out cells. Similar distributions were observed for cells from control and noise-exposed samples. (B) UMAP of the 34,341 cells from all samples (n=4 biological replicates for each condition) which met quality criteria colored according to marker gene expression used to infer cell types, and in (C) colored according to inferred cell type. (D) UMAPs depicting re-clustering of the 25,599 cells identified as one of the main cell types. Cells are colored according to treatment/control. Splitting the UMAP to only control and only noise cells indicates that the experimental condition influenced clustering. (E) Control and noise cells were integrated using anchor-based integration approach, as in the SGNs dataset. Cells are colored according to experimental condition (E), batch (F), and individual mice (G). None of these factors had a marked impact on cell clustering. (H) Bar plots showing the prevalence of each cell type in the dataset. Bar plots pertain to the UMAP shown in Figure 4A. (I) Expression level of marker genes for marginal cells, intermediate cells, basal cells, fibrocytes, and spindle/root cells.
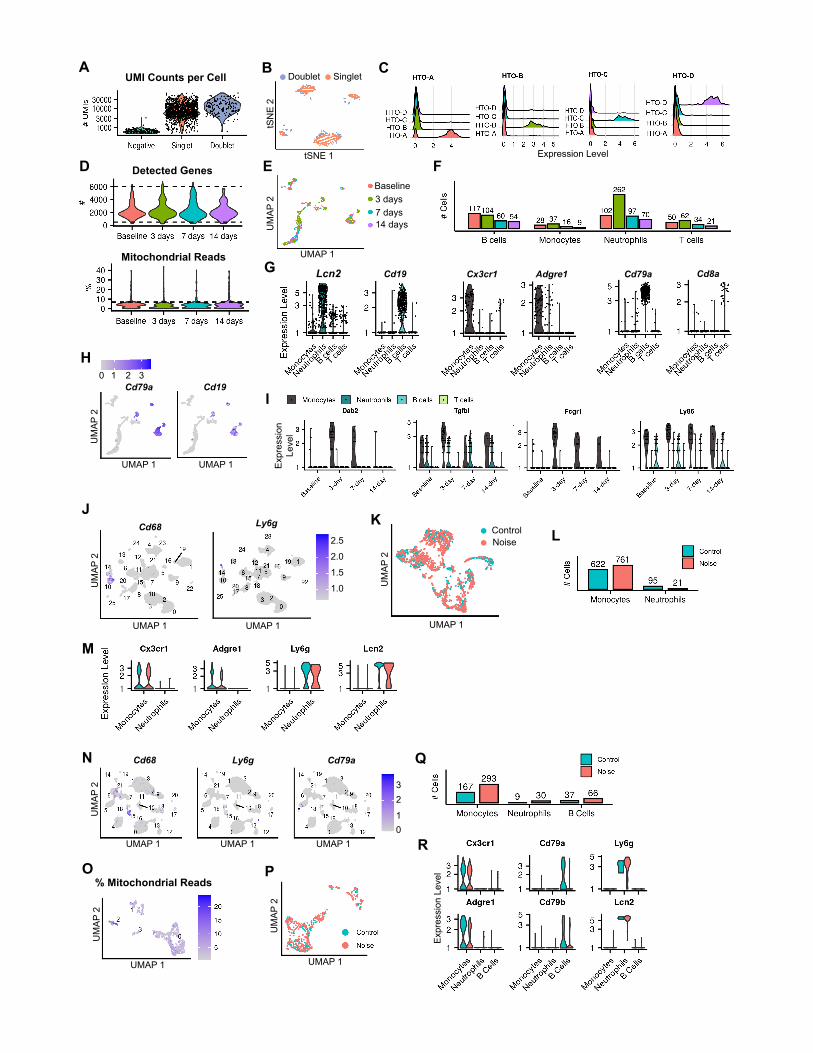
A B C
D E F
G
H
I
JK
L
M
N
O P
Q
R
UMAP 1U
MAP
2
tSNE 1
tSN
E 2
Doublet SingletUMI Counts per Cell
Expression Level
Detected Genes
Mitochondrial ReadsLcn2 Cd19 Cx3cr1 Adgre1 Cd79a Cd8a
Cd79a
UM
AP 2
Cd19
UMAP 1 UMAP 1
0 1 2 3
Expr
essi
onLe
vel
UMAP 1
Cd68 Ly6g
UM
AP 2
UMAP 1
UM
AP 2
UMAP 1
ControlNoise
Cd68 Ly6g Cd79a
UM
AP 2
UMAP 1 UMAP 1 UMAP 101
23
UM
AP 2
UMAP 1
Expr
essi
on L
evel% Mitochondrial Reads
UM
AP 2
UMAP 1
2.5
2.0
1.5
1.0
Baseline3 days7 days14 days
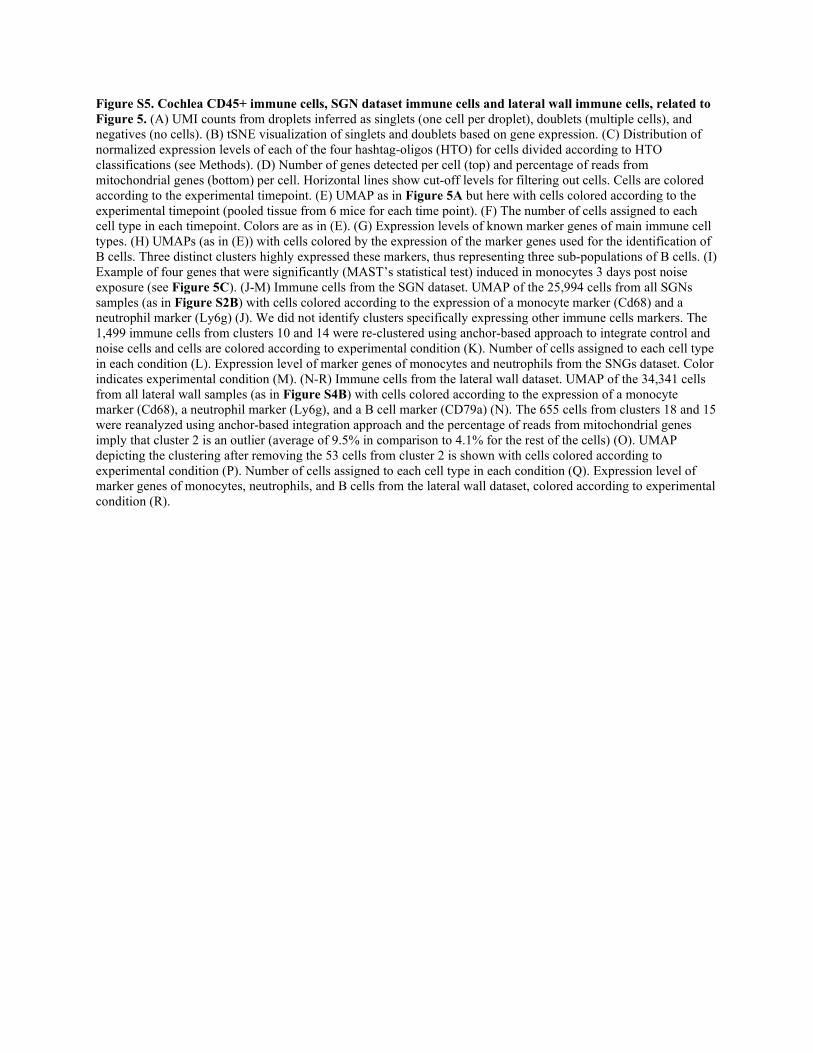
Figure S5. Cochlea CD45+ immune cells, SGN dataset immune cells and lateral wall immune cells, related to Figure 5. (A) UMI counts from droplets inferred as singlets (one cell per droplet), doublets (multiple cells), and negatives (no cells). (B) tSNE visualization of singlets and doublets based on gene expression. (C) Distribution of normalized expression levels of each of the four hashtag-oligos (HTO) for cells divided according to HTO classifications (see Methods). (D) Number of genes detected per cell (top) and percentage of reads from mitochondrial genes (bottom) per cell. Horizontal lines show cut-off levels for filtering out cells. Cells are colored according to the experimental timepoint. (E) UMAP as in Figure 5A but here with cells colored according to the experimental timepoint (pooled tissue from 6 mice for each time point). (F) The number of cells assigned to each cell type in each timepoint. Colors are as in (E). (G) Expression levels of known marker genes of main immune cell types. (H) UMAPs (as in (E)) with cells colored by the expression of the marker genes used for the identification of B cells. Three distinct clusters highly expressed these markers, thus representing three sub-populations of B cells. (I) Example of four genes that were significantly (MAST’s statistical test) induced in monocytes 3 days post noise exposure (see Figure 5C). (J-M) Immune cells from the SGN dataset. UMAP of the 25,994 cells from all SGNs samples (as in Figure S2B) with cells colored according to the expression of a monocyte marker (Cd68) and a neutrophil marker (Ly6g) (J). We did not identify clusters specifically expressing other immune cells markers. The 1,499 immune cells from clusters 10 and 14 were re-clustered using anchor-based approach to integrate control and noise cells and cells are colored according to experimental condition (K). Number of cells assigned to each cell type in each condition (L). Expression level of marker genes of monocytes and neutrophils from the SNGs dataset. Color indicates experimental condition (M). (N-R) Immune cells from the lateral wall dataset. UMAP of the 34,341 cells from all lateral wall samples (as in Figure S4B) with cells colored according to the expression of a monocyte marker (Cd68), a neutrophil marker (Ly6g), and a B cell marker (CD79a) (N). The 655 cells from clusters 18 and 15 were reanalyzed using anchor-based integration approach and the percentage of reads from mitochondrial genes imply that cluster 2 is an outlier (average of 9.5% in comparison to 4.1% for the rest of the cells) (O). UMAP depicting the clustering after removing the 53 cells from cluster 2 is shown with cells colored according to experimental condition (P). Number of cells assigned to each cell type in each condition (Q). Expression level of marker genes of monocytes, neutrophils, and B cells from the lateral wall dataset, colored according to experimental condition (R).
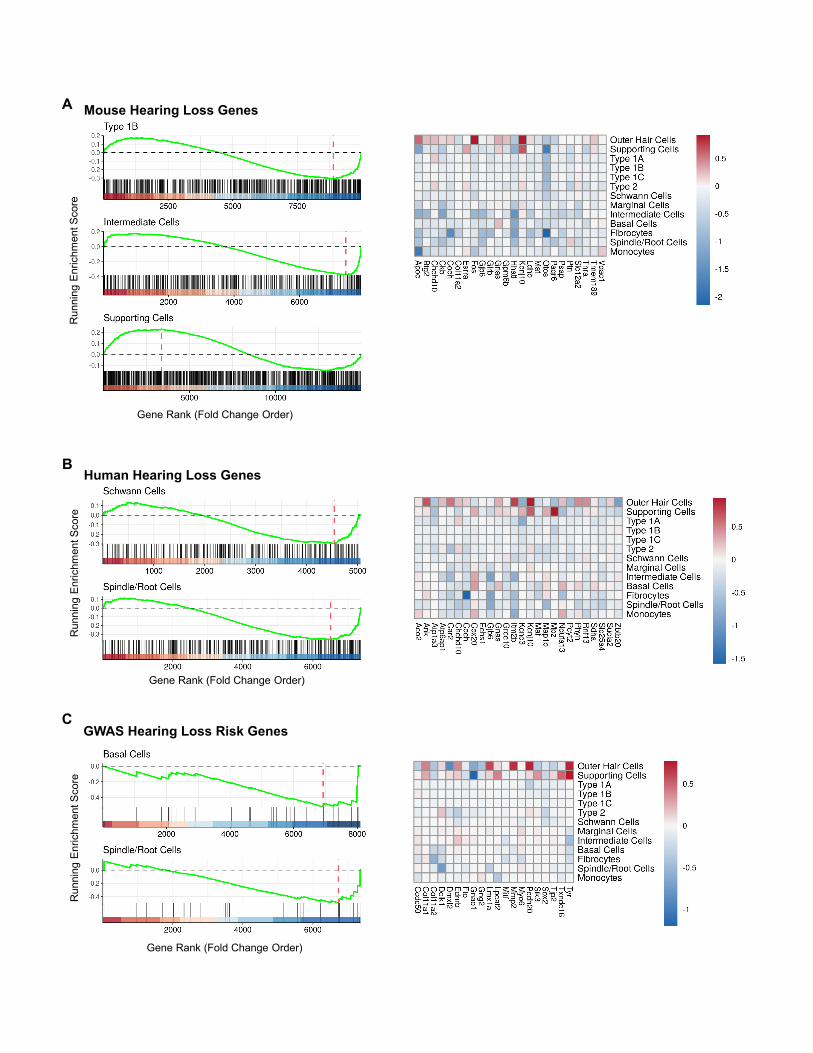
Run
ning
Enr
ichm
ent S
core
Gene Rank (Fold Change Order)
A Mouse Hearing Loss Genes
Run
ning
Enr
ichm
ent S
core
Gene Rank (Fold Change Order)
Human Hearing Loss GenesB
CGWAS Hearing Loss Risk Genes
Run
ning
Enr
ichm
ent S
core
Gene Rank (Fold Change Order)
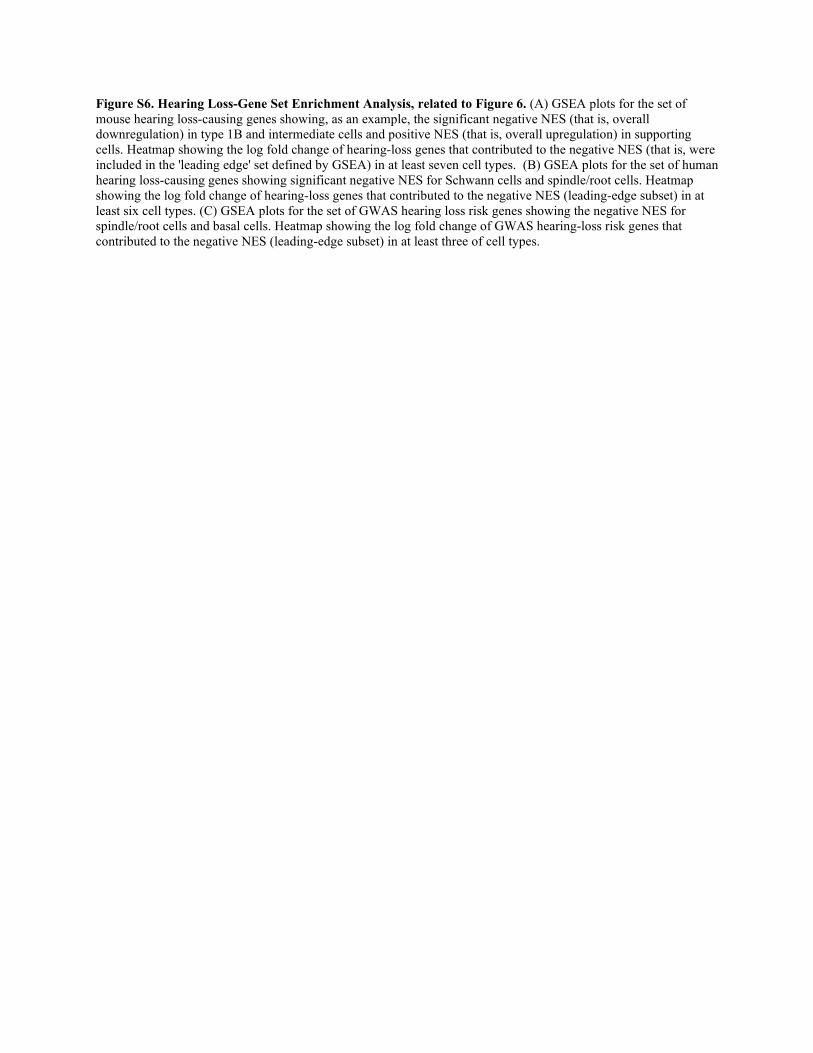
Figure S6. Hearing Loss-Gene Set Enrichment Analysis, related to Figure 6. (A) GSEA plots for the set of mouse hearing loss-causing genes showing, as an example, the significant negative NES (that is, overall downregulation) in type 1B and intermediate cells and positive NES (that is, overall upregulation) in supporting cells. Heatmap showing the log fold change of hearing-loss genes that contributed to the negative NES (that is, were included in the 'leading edge' set defined by GSEA) in at least seven cell types. (B) GSEA plots for the set of human hearing loss-causing genes showing significant negative NES for Schwann cells and spindle/root cells. Heatmap showing the log fold change of hearing-loss genes that contributed to the negative NES (leading-edge subset) in at least six cell types. (C) GSEA plots for the set of GWAS hearing loss risk genes showing the negative NES for spindle/root cells and basal cells. Heatmap showing the log fold change of GWAS hearing-loss risk genes that contributed to the negative NES (leading-edge subset) in at least three of cell types.
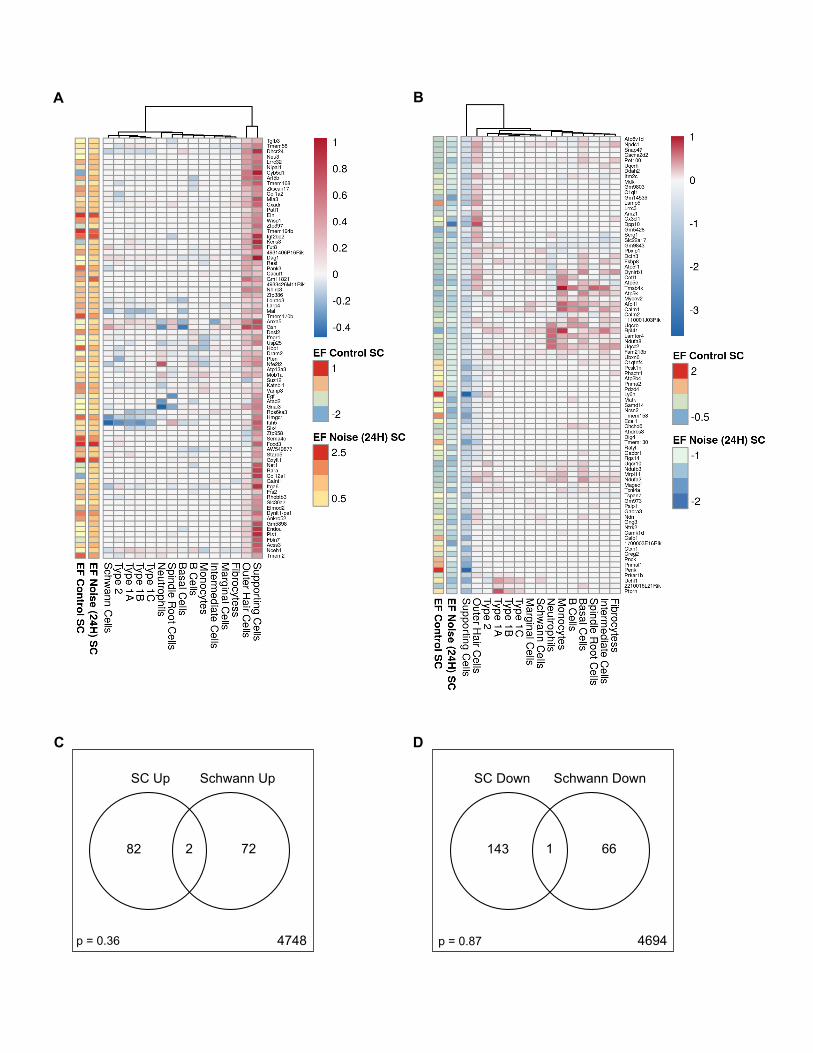
A B
C D
p = 0.36 p = 0.87
82 2 72
4748
SC Up Schwann Up
143 1 66
4694
SC Down Schwann Down
Figure S7. Comparison of DEGs detected in the Sox2-CreERT2;RiboTag dataset with the Schwann cells from the SGN scRNA-seq dataset, related to Figures 1, 2 and STAR Methods. (A) Heatmap for the fold change of genes in the SC-UP gene cluster, whose enrichment factor (EF) in the 24h post noise condition is larger than 0. The two left columns represent the EF of genes in the control and noise conditions. (B) Heatmap for the fold change of genes in the SC-DOWN gene cluster, whose enrichment factor (EF) in the 24h post noise condition is less than 0. The two left columns represent the EF of genes in the control and noise conditions. (C) Venn diagram for the intersections between the genes in the SC upregulated cluster (Table S2) and those that are differentially upregulated in Schwann cells (Table S3). The overlap consisted of only two genes (Ogn, Gsn) and was not significant (p-value calculated using hypergeometric test). (D) Venn diagram for the intersections between the genes in the SC downregulated cluster (Table S2) and those that are differentially downregulated in Schwann cells (Table S3). The overlap consisted of only one gene (Gpm6a) and was not significant (p-value calculated using hypergeometric test).
Related Documents