A CD Determination of the a-Helix Contents of the Coat Proteins of Four Filamentous Bacteriophages: fd, IKe, Pfl, and Pf3 BEATRICE A. CLACK and DONALD M. GRAY, Program in Molecular and Cell Biology, Mail Stop FO 31, The University of Texas at Dallas, P.O. Box 830688, Richardson, Texas 75083-0688 Synopsis The CD spectra of four filamentous bacteriophages-fd, IKe, Pfl, and Pf3- were analyzed to determine the a-helix contents of their major coat proteins. Measured spectra included the 192-nm band so that analyses could be carried out over the full wavelength range of the reference spectra for protein secondary structures available (a) from globular proteins [J. T. Yang, C.3. C. Wu, and H. M. Martinez (1986) Methods in Enzymology 130,208-2691 and (b) from poly(L-lysine) [N. Greenfield and G. D. Fasman (1960) Biochemistry 8, 4108-41161. Extended analyses were also performed with the addition of the spectrum of a model p-turn to the Greenfield and Fasman reference set, with the spectrum of a short a-helix in the Yang et al. reference set, and with an estimate of the spectrum of Trp added to both reference sets. The reference set based on the simple poly(L-lysine) polypeptide, plus a spectrum of a model P-turn or of Trp, gave reasonably good fits to the measured spectra for all four phages and yielded the largest percentages of a-helix. The ++ss I phages-fd and IKe-had large percentages of a-helix of 98 i 2 and 97 i 58, respectively, while the two class I1 phages-Pfl and Pf3- had similar but smaller a-helix contents of 83 6 and 84 i 2, respectively. While these a-helix contents were within the ranges previously reported from CD spectra of these phages in solution, they were more precise, and they indicated that the coat proteins of the intact phages have CD spectra that are probably modeled better by the reference spectra of polypeptides than by those of globular proteins. INTRODUCTION The structures of the filamentous bacteriophages have recently been thor- oughly reviewed by Day et al.' Fd, IKe, Pfl, and Pf3 each contain one copy of circular, single-stranded DNA enclosed in a coat of approximately 2300 (Pf3) to 7000 (Pfl) overlapping subunits of the major coat protein. Results from x-ray diffraction studies of the intact phages have shown that the phages can be divided into two structural classes based on the arrangement of the major coat proteins along the length of the phage; one distinguishing feature of these classes is that the coats of class I viruses are five-start helices while those of class I1 viruses are one-start helices.',' Fd and IKe are in class I, and Pfl and Pf3 are representatives of class 11. The major coat protein is a small structural protein ranging from 44 (Pf3) to 53 (IKe) amino acid residues in length.' The major coat proteins each consist of an acidic N-terminal region, a hydrophobic central region, and a basic carboxy-terminal region.', The interpretation of x-ray diffraction re- sults has relied on the assumption that the major coat proteins are close to 100% a-helical in secondary structure. In class I phages, the coat protein is Biopolymers, Vol. 28, 1861-1873 (1989) 0 1989 John Wiley & Sons, Inc. CCC 0o06-3525/89/111861-13$04.00

Welcome message from author
This document is posted to help you gain knowledge. Please leave a comment to let me know what you think about it! Share it to your friends and learn new things together.
Transcript
A CD Determination of the a-Helix Contents of the Coat Proteins of Four Filamentous
Bacteriophages: fd, IKe, Pfl, and Pf3
BEATRICE A. CLACK and DONALD M. GRAY, Program in Molecular and Cell Biology, Mail Stop FO 31, The University of Texas
at Dallas, P.O. Box 830688, Richardson, Texas 75083-0688
Synopsis
The CD spectra of four filamentous bacteriophages-fd, IKe, Pfl, and Pf3- were analyzed to determine the a-helix contents of their major coat proteins. Measured spectra included the 192-nm band so that analyses could be carried out over the full wavelength range of the reference spectra for protein secondary structures available (a) from globular proteins [J. T. Yang, C.3. C. Wu, and H. M. Martinez (1986) Methods in Enzymology 130,208-2691 and (b) from poly(L-lysine) [N. Greenfield and G. D. Fasman (1960) Biochemistry 8, 4108-41161. Extended analyses were also performed with the addition of the spectrum of a model p-turn to the Greenfield and Fasman reference set, with the spectrum of a short a-helix in the Yang et al. reference set, and with an estimate of the spectrum of Trp added to both reference sets. The reference set based on the simple poly(L-lysine) polypeptide, plus a spectrum of a model P-turn or of Trp, gave reasonably good fits to the measured spectra for all four phages and yielded the largest percentages of a-helix. The ++ss I phages-fd and IKe-had large percentages of a-helix of 98 i 2 and 97 i 58, respectively, while the two class I1 phages-Pfl and Pf3- had similar but smaller a-helix contents of 83 6 and 84 i 2, respectively. While these a-helix contents were within the ranges previously reported from CD spectra of these phages in solution, they were more precise, and they indicated that the coat proteins of the intact phages have CD spectra that are probably modeled better by the reference spectra of polypeptides than by those of globular proteins.
INTRODUCTION
The structures of the filamentous bacteriophages have recently been thor- oughly reviewed by Day et al.' Fd, IKe, Pfl, and Pf3 each contain one copy of circular, single-stranded DNA enclosed in a coat of approximately 2300 (Pf3) to 7000 (Pfl) overlapping subunits of the major coat protein. Results from x-ray diffraction studies of the intact phages have shown that the phages can be divided into two structural classes based on the arrangement of the major coat proteins along the length of the phage; one distinguishing feature of these classes is that the coats of class I viruses are five-start helices while those of class I1 viruses are one-start helices.',' Fd and IKe are in class I, and Pfl and Pf3 are representatives of class 11.
The major coat protein is a small structural protein ranging from 44 (Pf3) to 53 (IKe) amino acid residues in length.' The major coat proteins each consist of an acidic N-terminal region, a hydrophobic central region, and a basic carboxy-terminal region.', The interpretation of x-ray diffraction re- sults has relied on the assumption that the major coat proteins are close to 100% a-helical in secondary structure. In class I phages, the coat protein is
Biopolymers, Vol. 28, 1861-1873 (1989) 0 1989 John Wiley & Sons, Inc. CCC 0o06-3525/89/111861-13$04.00
1862 CLACK AND GRAY
considered one continuous a-helix. For class I1 phages, two models have been proposed. One model depicts the coat protein as a bent a-helical rod,4 while in the second model it is one continuous a-helical Nuclear magnetic resonance results on Pfl support the model of a bent rod for the coat protein.6
Results from Raman and CD studies show convincing evidence that the secondary structures of the coat proteins of fd, IKe, Pfl, and Pf3 are all high in a-helix content, although there are indications from the Raman data that these phages may differ as much as 10-20% in their percentages of a-helix. The most recent Raman work by Thomas et al.7 gives the order of a-helicity of the phages as Pfl (100%) > IKe (90%) > fd (80 k 10%) > Pf3 (7540%). A higher value of 98% for the percentage of the fd a-helix content has been recently reported from resonance Raman spectroscopy.8 CD studies have given a range of 80-100% for all four of these phages, '~~ and in one report the a-helix content of Pf3 was estimated to be as high as 90% from CD measure- ments."
The measured values for the a-helix contents for these filamentous phages have generally been higher than those predicted from the amino acid se- quences." Using the Gamier et a1.I2 as well as the Chou and Fasman13 methods, Finer-Moore et al." found that neither method predicted more than 33% a-helix for any of the class I1 phages. Although both methods predicted higher a-helix contents for the class I than for the class I1 phages, only the Gamier et a1.12 method gave values (80 and 70%, respectively) close to those measured for fd and IKe. Predicted values were 40 and 51% for fd and IKe, respectively, from the Chou and Fasman13 method.
Two important caveats have come from the work by Day and his co-workers on the CD analysis of the secondary structures of the filamentous phage coat proteins. First, the CD spectra in the wavelength region normally dominated by the a-helix may have contributions from aromatic amino acids, especially T ~ P . ~ This is the case for fd phage (but not for Pfl, which lacks T ~ I ) . ~ Second, the phage coat protein secondary structure can depend on the phage concen- tration so that, as shown for Pf3, the a-helix content is stabilized a t high phage concentrations." Thus, virus concentrations used for Raman studies (= 100 mg/mL) could lead to different results than those obtained from phage solutions used for CD work (= 0.1-0.3 mg/mL).
While the qualitative results from past CD studies are not in doubt, there does not appear to have been a systematic quantitative analysis of filamen- tous phage CD spectra. Although precautions must be exercised, the a-helix secondary structure is the one that should be most accurately estimated by such an ana1y~is.l~ Here we report that high percentages of a-helix were obtained from quantitative analyses of the CD spectra of fd, IKe, Pfl, and Pf3 phages, when the analyses were based on the poly(L-lysine) reference set of Greenfield and Fasman.I5 Moreover, the CD analyses indicated that neither Pf1 nor Pf3 has as high a percentage of a-helix as does fd or IKe phage.
MATERIALS AND METHODS
Growth and Purification of Phage
Four filamentous phages were used in this study. Fd phage has been used in previous work16; its host was Escherichia coli strain Ton 1101. IKe and its
a-HELIX CONTENTS OF COAT PROTEINS 1863
E . coli host JE2571/N3 were obtained from Dr. D. E. Bradley (Memorial University of Newfoundland, St. John's, Newfoundland). Pf3 and its host Pseudomonas aeruginosa strain PA01 (RP1) were both obtained from Dr. L. A. Day (Public Health Research Institute of the City of New York, New York, NY). Pfl and its host P. aeruginosa strain K were provided by Dr. D. A. Marvin (University of Cambridge, Cambridge, England).
The phages were grown on their respective hosts in a medium containing (per liter) 32 g tryptone, 20 g yeast extract, 5 g NaC1, and either 1 g Tris HCl (for fd, IKe, and Pfl) or 0.44 g CaC1, (for Pf3). The hosts were grown in a 10 L fennenter to cell densities of approximately 3 x lo8 cells/mL. Phages were then added a t multiplicities of 1-3 for Pfl and Pf3, and at a multiplicity of about 10 for fd and IKe. For a typical isolation, 2 h after infection the bacterial cells were pelleted by centrifugation at 6000 X g for 30 min, and the supernatant with the phage was collected. To precipitate the phage, solid NaCl was added to the supernatant to give a final concentration of 0.5M, and the solution was allowed to stand at 4°C for a t least 8 h, after which polyethylene glycol was added to give 3% (w/v). After standing 6 h longer a t 4"C, the solution was centrifuged at 14,000 x g for 40 min to pellet the phage. The pellet was resuspended in 0.1M Tris HC1, pH 8.1, in the case of fd, IKe, and Pfl, and in 0.015M sodium citrate, pH 8.4, in the case of Pf3, to give a total volume of up to 500 mL. The precipitation procedure was then repeated. The resuspended volume of phage after both rounds of precipitation was about 100 mL. The fd, IKe, and Pfl phages were then purified by equilibrium sedimentation in a self-forming CsCl gradient [starting with 40% (w/v) ultrapure grade CsCl from BRL and centrifuging a t 15OC in an SW27 rotor for 72 h at 60,000 x g]. The Pf3 phage were similarly purified, except that the centrifugation was at 4°C on a self-forming Nycodenz gradient [starting with 30% (w/v) ultrapure grade Nycodenz from Accurate Chem. and Scientific Corp.]. The phages were finally dialyzed at 4°C into 0.002M Na+ (phosphate), pH 7.0.
Absorption and CD Measurements
Ultraviolet absorption spectra were measured using a Cary-Varian model 118C spectrophotometer. CD spectra were obtained using a Jasco J500A circular dichrometer calibrated with d-10-camphorsulfonic acid as in previous work.17 The ellipticity a t 290.5 nm was within 2% of the value of 0.336" recommended by Chen and Yang,18 and the ratio of the magnitudes of the peaks a t 192.5 and 290.5 nm was -2.05 k 0.03, close to the value of -2.00 obtained by Chen and Yang." CD spectra were measured using a spectral band width of 1 nm, a time constant of 4 s, and a scan speed of 1 nm/min. Digitized data were obtained every 0.1 nm with a Jasco DP-500 N data processor, the data were smoothed twice with a sliding 7-point third-order polynomial, and every tenth point was transferred to a Hewlett Packard 98163 computer. The data at 1-nm intervals were then smoothed by a sliding 13-point quadratic-cubic fun~tion. '~ Measured CD spectra of the phages were plotted as c L - c R in units of L . mo1-l . cm-l, per mol of amino acid residue. Each spectrum was the average of three measurements (two measurements in the case of Pf3) made on different days with different dilutions of the same phage stock. The phage concentrations used for the analyzed CD measure- ments ranged from 0.13 to 0.28 mg/mL.
1864 CLACK AND GRAY
Concentrations of the phage solutions were determined from absorbance measurements and published extinction coefficients (without scattering correc- tions) in units of mg-' . cm2 of 3.84 a t 269 nm for fd,20 3.5 at 265 nm for IKe,7 2.07 a t 270 nm for Pf1,'l and 4.5 a t 262 nm for Pf3.22 Reported errors are about 1.5% for the extinction coefficients of fd and Pf1,20,21 and we assumed that concentrations for all the phages could be determined accurately to within a few percent. Extinction coefficients were converted from mg-l . cm2 to molar values, taking into account the number of amino acid residues and the molecular weight per coat protein subunit for each phage.7 The derived molar extinction coefficients (in units of L * mol-' . cm-l) were 457 at 269 nm for fd, 417 at 265 nm for IKe, 221 a t 270 nm for Pfl, and 550 a t 262 nm for Pf3. Sample temperatures during the optical measurements were controlled at 20°C with an accuracy of k0.5"C using a Neslab programmable circulating water bath.
Analyses of CD Spectra
The CD spectra of the phages were fitted with two sets of reference spectra using a program based on linear-programming techniques (written by Dr. F. S. Allen, Chemistry Department, University of New Mexico, Albuquerque, and translated to an IBM PC version by Russell Pierce, Jr., Plano, TX). The fits were with respect to spectral shape only; that is, the sum of the reference spectra was not constrained to be 1.0. However, the fractions of the reference spectra were constrained to be positive. One set of reference spectra was that published by Greenfield and Fasman15 and consisted of three spectra for poly(L-lysine) structures of 100% a-helix, 100% P-sheet, and 100% random structure. A second set was that obtained from Yang and his c o - ~ o r k e r s . ~ ~ - ~ ~ The latter set was based on spectra of 15 globular proteins and consisted of four extracted reference spectra for P-sheet, P-turn, random coil, and infinitely long a-helical structures. Analyses were also performed in which the spectrum of a model P-turn [the tetrapeptide, N-Cbz-Gly-L-Ser-(OBut)-L-Ser-Gly-O- stearate] 26 and/or the negative of the spectrum of N-acetyl-L-tryptophan amideZ7 were added to the poly(L-lysine) reference set. This Trp contribution was also added to the reference set of Yang et al. 25 The spectral influence of the length of the a-helix was explored using the globular protein reference set and the wavelength-dependent function originally published by Chen et aLZ3
Each measured spectrum was represented by 31 data points (250-190 nm at 2-nm intervals) for the analyses using the reference set of Greenfield and Fasman15 and 26 data points (240-190 nm a t 2-nm intervals) for the analyses using the reference set of Yang et al.25 A standard deviation (a) for the fit of a calculated to a measured spectrum was defined as follows:
a = ( [CDm( A ) - CDc( A ) ] '/( N - l))0.5
where CDm(A) and CDc(A) were the molar CD values of measured and calculated spectra, respectively, a t N wavelengths A. A similar equation was used to calculate the measurement error (taking the differences at each wavelength between the measured and averaged spectra).
&-HELIX CONTENTS OF COAT PROTEINS 1865
A third set of analyses was performed using the five inverse CD spectra published by Compton and Johnson.28 These inverse spectra are based on spectra of 15 globular proteins and one polypeptide. They can be used to estimate the a-helix, parallel and antiparallel P-sheet, p-turn, and random secondary structures of an unknown protein by simple dot product multiplica- tion of the unknown protein CD spectrum with each of the inverse spectra. The results are essentially the same as when an unknown spectrum is ana- lyzed by fitting with the orthonormal basis spectra from which the inverse spectra were derived29; in the latter case, however, the fractions of the basis spectra have to be multiplied by their constituent secondary structures to obtain the total fractions of individual types of secondary structure.
We performed the Compton and Johnson28 dot product analysis on our spectra using their inverse spectra and our phage CD spectra over the range of 184-260 nm. Unfortunately, the sums of the fractions of component secondary structures were intolerably high using this analysis. The sums ranged from 1.5 to 2.3, whereas the sums from the other reference sets were much closer to 1.0 (see below). We concluded that the analyses with the Compton and Johnson reference set were invalid, and the results are not presented in this paper. Presumably the reference proteins used by Johnson and his c o - w o r k e r ~ ~ ~ , ~ ~ have CD components that differ from those in our phage CD spectra. We did not employ the technique of " variable selection" described by Johnson3' that can resolve such problems.
RESULTS
CD Spectra
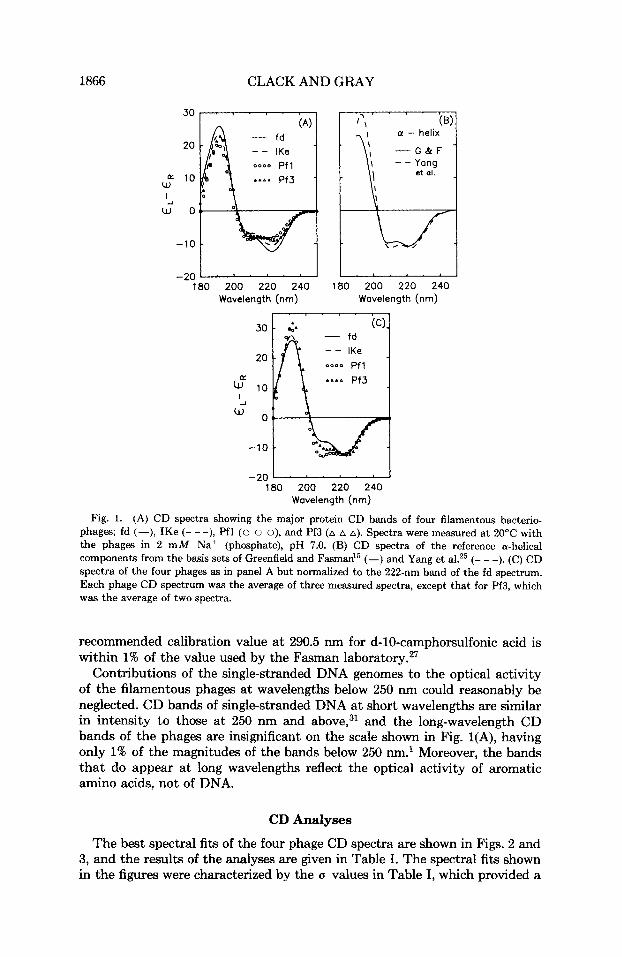
The CD spectra of the four phages-fd, IKe, Pfl, and Pf3-are shown down to 180 nm in Fig. 1(A). All the spectra had CD bands at 222, 208, and 192 nm, characteristic of the well-known n -+ T*, parallel T -+ T*, and per- pendicular T + T* bands of a -he l ice~ . '~ ,~~ The reference spectra of a-helices from poly(L-lysine) and globular proteins are shown in Fig. 1(B) for compari- son. While i t was obvious that the CD spectra of the filamentous phages had a large component from the a-helical secondary structure, i t was also obvious that the relative magnitudes of these three CD bands were not the same as those of the reference a-helices. The different shapes of the CD spectra of the phages are compared in Fig. l(C), which shows all the CD spectra normalized to the 222-nm band of the fd spectrum. The spectra of the class I1 viruses differed from each other as well as from the spectra of the class I viruses, especially with respect to the relative magnitudes of the negative CD bands. However, the CD spectra of the two class I viruses were nearly identical in shape to each other.
Our phage CD spectra were close in shape to those published by Day et al.,' but were less in magnitude by about 10% (fd), 20% (IKe and Pfl), and 25% (Pf3). As shown by the analyses below, the magnitudes of our spectra were consistent with those of the reference sets of Greenfield and Fasman15 and Yang et al.,25 since analyses with these reference sets did not generally result in sums of components less than 1.0. It is important to point out that we used the same CD calibration value as did Chen and Yang," and that their
1866 CLACK AND GRAY
30
20
10 W
w o '2
-10
-20 180 200 220 240 180 200 220 240
Wavelength (nm) Wavelength (nrn)
2
I
cu -10
-20 - 180 200 220 240
Wavelength (nm)
Fig. 1. (A) CD spectra showing the major protein CD bands of four filamentous bacterio- phages; fd (-), IKe (- - -), Pfl (0 o 0), and Pf3 (A A A). Spectra were measured at 20°C with the phages in 2 mM Na+ (phosphate), pH 7.0. (B) CD spectra of the reference a-helical components from the basis sets of Greenfield and Fasman" (-) and Yang et al.25 (- - -). (C) CD spectra of the four phages as in panel A but normalized to the 222-nm band of the fd spectrum. Each phage CD spectrum was the average of three measured spectra, except that for Pf3, which was the average of two spectra.
recommended calibration value at 290.5 nm for d-10-camphorsulfonic acid is within 1% of the value used by the Fasman l ab~ra to ry .~~
Contributions of the single-stranded DNA genomes to the optical activity of the filamentous phages at wavelengths below 250 nm could reasonably be neglected. CD bands of single-stranded DNA at short wavelengths are similar in intensity to those at 250 nm and above,31 and the long-wavelength CD bands of the phages are insignificant on the scale shown in Fig. 1(A), having only 1% of the magnitudes of the bands below 250 nm.' Moreover, the bands that do appear at long wavelengths reflect the optical activity of aromatic amino acids, not of DNA.
CD Analyses
The best spectral fits of the four phage CD spectra are shown in Figs. 2 and 3, and the results of the analyses are given in Table I. The spectral fits shown in the figures were characterized by the u values in Table I, which provided a
a-HELIX CONTENTS OF COAT PROTEINS 1867
30
20
= 10 W
U J O
-10
30
20
10 0: w
w 5 0
-10
-- 190 200 210 220 230 240 190 ZOO 210 220 230 240
Wavelength (nm) Wavelength (nm)
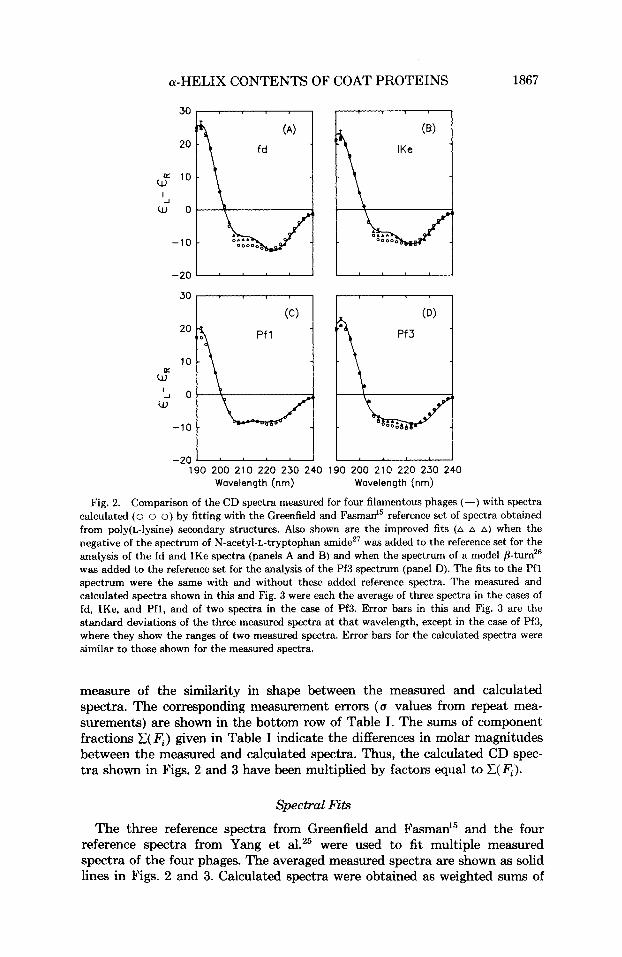
Fig. 2. Comparison of the CD spectra measured for four filamentous phages (-) with spectra calculated (0 o 0) by fitting with the Greenfield and Fasman” reference set of spectra obtained from poly(L-lysine) secondary structures. Also shown are the improved fits (A A A) when the negative of the spectrum of N-acetyl-L-tryptophan amideZ7 was added to the reference set for the analysis of the fd and IKe spectra (panels A and B) and when the spectrum of a model @turnz6 was added to the reference set for the analysis of the Pf3 spectrum (panel D). The fits to the Pfl spectrum were the same with and without these added reference spectra. The measured and calculated spectra shown in this and Fig. 3 were each the average of three spectra in the cases of fd, IKe, and Pfl, and of two spectra in the case of Pf3. Error bars in this and Fig. 3 are the standard deviations of the three measured spectra at that wavelength, except in the case of Pf3, where they show the ranges of two measured spectra. Error bars for the calculated spectra were similar to those shown for the measured spectra.
measure of the similarity in shape between the measured and calculated spectra. The corresponding measurement errors (a values from repeat mea- surements) are shown in the bottom row of Table I. The sums of component fractions C(F,) given in Table I indicate the differences in molar magnitudes between the measured and calculated spectra. Thus, the calculated CD spec- tra shown in Figs. 2 and 3 have been multiplied by factors equal to C(F,).
Spectral Fits
The three reference spectra from Greenfield and Fasman15 and the four reference spectra from Yang et al.25 were used to fit multiple measured spectra of the four phages. The averaged measured spectra are shown as solid lines in Figs. 2 and 3. Calculated spectra were obtained as weighted sums of
1868 CLACK AND GRAY
,
30
20
10
'2
w o
-10
-20 190 200 210 220 230 240 190 200 210 220 230 240
Wavelength (nrn) Wavelength (nm)
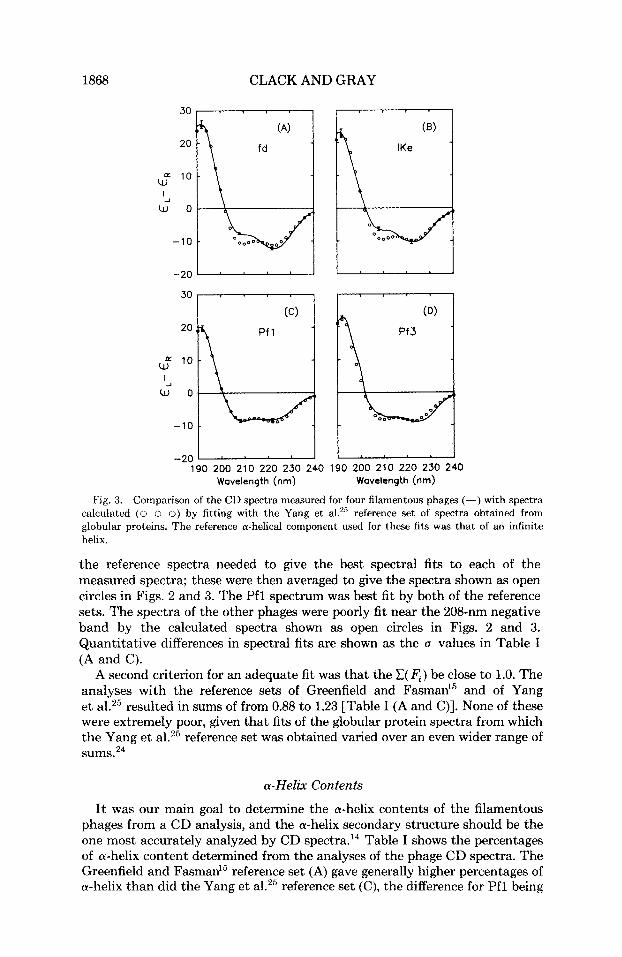
Fig. 3. Comparison of the CD spectra measured for four filamentous phages (-) with spectra calculated (0 o 0) by fitting with the Yang et aLZ5 reference set of spectra obtained from globular proteins. The reference a-helical component used for these fits was that of an infinite helix.
the reference spectra needed to give the best spectral fits to each of the measured spectra; these were then averaged to give the spectra shown as open circles in Figs. 2 and 3. The Pfl spectrum was best fit by both of the reference sets. The spectra of the other phages were poorly fit near the 208-nm negative band by the calculated spectra shown as open circles in Figs. 2 and 3. Quantitative differences in spectral fits are shown as the (I values in Table I (A and C).
A second criterion for an adequate fit was that the C( F , ) be close to 1.0. The analyses with the reference sets of Greenfield and Fasman15 and of Yang et al.25 resulted in sums of from 0.88 to 1.23 [Table I (A and C)]. None of these were extremely poor, given that fits of the globular protein spectra from which the Yang et a1.25 reference set was obtained varied over an even wider range of sums.24
a-Helix Contents
It was our main goal to determine the a-helix contents of the filamentous phages from a CD analysis, and the a-helix secondary structure should be the one most accurately analyzed by CD spectra.14 Table I shows the percentages of a-helix content determined from the analyses of the phage CD spectra. The Greenfield and Fasman15 reference set (A) gave generally higher percentages of a-helix than did the Yang et al.25 reference set (C) , the difference for Pfl being
a-HELIX CONTENTS OF COAT PROTEINS 1869
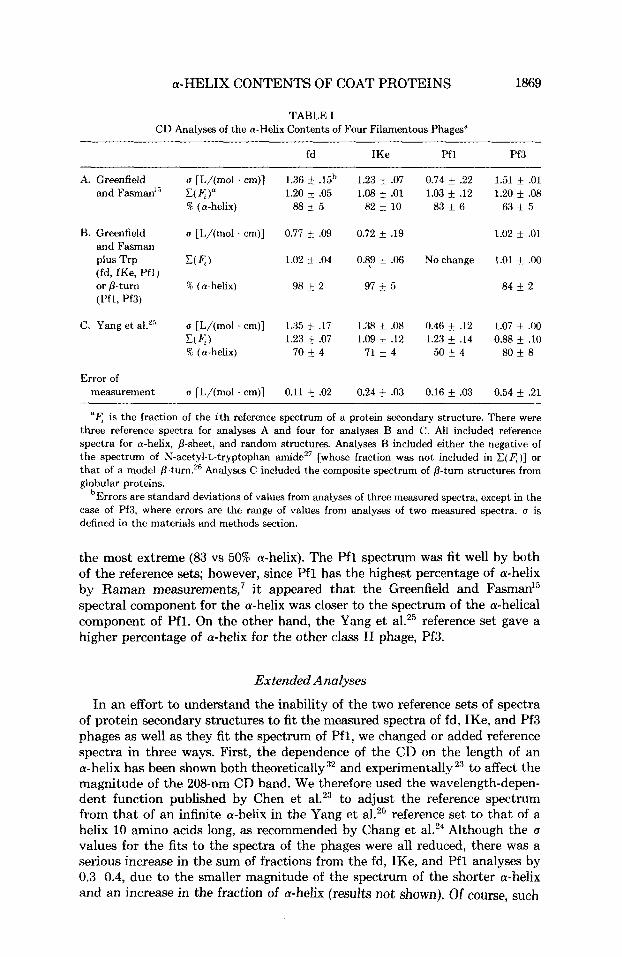
TABLE I CD Analyses of the a-Helix Contents of Four Filamentous Phages"
fd IKe Pfl Pf3
A. Greenfield and FasmanIs
B. Greenfield and Fasman plus Trp (fd, IKe, Pfl) or p-turn (Pfl, Pf3)
C. Yang et aLZ5
Error of measurement
u [L/(mol . cm)] V4)" 1.20 i .05 % (a-helix) 88 i 5
1.36 * .15b
u [L/(mol . cm)] 0.77 & .09
UC) 1.02 -C .04
'% (a-helix) 98 & 2
u [L/(mol. cm)] 1.35 .17 CCC) 1.23 & .07 96 (a-helix) 70 k 4
0 [L/(mol . cm)] 0.11 .02
1.23 I .07 1.08 i .01
82 f 10
0.72 f .19
0.8,9 f .06
97 f 5
1.38 f .08 1.09 * .12
71 f 4
0.24 f .03
0.74 f .22 1.03 f .12
83 f 6
1.51 * .O1 1.20 i .08
63 i 5
1.02 i .01
Nochange 1.01 f .00
84 f 2
0.46 i .12 1.23 f .14
50 f 4
1.07 f .OO 0.88 i .I0
80 f 8
0.16 f .03 0.54 i .21
' 4 is the fraction of the i th reference spectrum of a protein secondary structure. There were three reference spectra for analyses A and four for analyses B and C. All included reference spectra for a-helix, p-sheet, and random structures. Analyses B included either the negative of the spectrum of N-acetyl-L-tryptophan amideZ7 [whose fraction was not included in C ( 4 ) ] or that of a model Analyses C included the composite spectrum of P-turn structures from globular proteins.
bErrors are standard deviations of values from analyses of three measured spectra, except in the case of Pf3, where errors are the range of values from analyses of two measured spectra. u is defined in the materials and methods section.
the most extreme (83 vs 50% a-helix). The Pfl spectrum was fit well by both of the reference sets; however, since Pfl has the highest percentage of a-helix by Raman measurements,' i t appeared that the Greenfield and Fasman15 spectral component for the a-helix was closer to the spectrum of the a-helical component of Pfl. On the other hand, the Yang et al.25 reference set gave a higher percentage of a-helix for the other class I1 phage, Pf3.
Extended Analyses
In an effort to understand the inability of the two reference sets of spectra of protein secondary structures to fit the measured spectra of fd, IKe, and Pf3 phages as well as they fit the spectrum of Pfl, we changed or added reference spectra in three ways. First, the dependence of the CD on the length of an a-helix has been shown both theoretically3' and experimentallyz3 to affect the magnitude of the 208-nm CD band. We therefore used the wavelength-depen- dent function published by Chen et al.z3 to adjust the reference spectrum from that of an infinite a-helix in the Yang et al.25 reference set to that of a helix 10 amino acids long, as recommended by Chang et al.24 Although the u values for the fits to the spectra of the phages were all reduced, there was a serious increase in the sum of fractions from the fd, IKe, and Pfl analyses by 0.3-0.4, due to the smaller magnitude of the spectrum of the shorter a-helix and an increase in the fraction of a-helix (results not shown). Of course, such
1870 CLACK AND GRAY
analyses should not have been an improvement, since the coat proteins of the filamentous phages are thought to consist of one or two extended a-helices.’
Second, we added the spectrum of a model p-turn to the Greenfield and Fasman15 reference set, since there were spectra of just three simple secondary structures in the original set. The spectrum of a model tetrapeptide [N-Cbz- Gly-Ser-(OBut )-L-Ser-Gly-O-stearate] published by Kawai and FasmanZ6 was suggested by Dr. G. D. Fasman as a possible addition to the poly(L-lysine) reference set. The inclusion of this reference component led to a marked improvement in both the u and C(F,) for the fit to the Pf3 spectrum; this improved fit is shown as the spectrum plotted as triangles in Fig. 2D, and the results of the analysis are given in Table I (B). The a-helix content for Pf3 was increased to 84%, which was slightly larger than that obtained using the Yang et al.25 reference set. The addition of the fi-turn reference spectrum did not change the fit to or analysis of the Pfl spectrum, and it made only marginal changes in the fits to the fd and IKe spectra without a t all accounting for the reduced 208-nm band in the spectra of these class I phages.
Third, an estimate of the spectrum of Trp was added to the reference sets. Day and Wisemang found that the 208-nm CD band of fd increased in negative magnitude relative to the 222-nm band upon oxidation of Trp with N-bromosuccinimide. This implies that there is a positive contribution of Trp to the CD of the phage, which reduces the measured magnitude of the negative 208-nm band of the a-helical secondary structure. The measured CD spectra of the model Trp derivative N-acetyl-L-tryptophan amide27 and of a Trp-containing d i ~ e p t i d e ~ ~ are actually negative below about 220 nm. How- ever, rotation of the asymmetrical indole side chain of tryptophan can reverse the sign of its CD bands.14 Thus, we used the negative of the measured spectrum published by Adler et al.27 for N-acetyl-L-tryptophan amide as an estimate of a possible Trp contribution to the CD of the phage, and it was added to the reference sets.
The addition of this possible Trp contribution to the reference sets resulted in improved fits to the spectra of fd and IKe phages using both reference sets; all the u values were in the range of 0.65-0.80. The spectral fits with the Greenfield and Fasman15 reference set are shown in Fig. 2 (panels A and B, spectra plotted as triangles). We found it particularly interesting that the fractions of a-helix obtained for fd and IKe using the Greenfield and Fasrnanl5 reference set together with the Trp component were essentially unchanged (regardless of whether the P-turn component was also included), although the percentages of a-helix increased to nearly 100% [Table I (B)]. These un- changed fractions contrasted with decreases by 10-1496 in the fractions of ci-helix obtained for fd and IKe when the Trp component was used together with the reference set of Yang et al.25 (results not shown). This indicated that the a-helix reference spectrum in the Greenfield and Fasman15 set was more unique than that in the Yang et al.25 set in being able to fit large portions of the fd and IKe spectra regardless of the remainder of the reference set.
There is no Trp in the Pfl coat protein, and as expected, none of the Trp spectrum was used when analyses of the Pfl CD spectrum were performed with the possible Trp component added to either reference set. That is, results from analyses of the Pfl spectrum were identical with or without the Possible Trp component. The addition of the Trp component improved the fits to the pf3 spectrum, but in the case of the analysis with the Greenfield and J ? M x ~ ~ ’ ~
a-HELIX CONTENTS OF COAT PROTEINS 1871
set the decrease in u was less than one-half as much as when the spectrum of a model p-turn was added (results not shown).
CONCLUSIONS
1. We have performed quantitative CD analyses for the a-helix contents of four filamentous phages (fd, IKe, Pfl, and Pf3). We found that the a-helix CD component of the phages appeared to be closer to the a-helix CD spectrum from the reference set based on poly(L-lysine) than to that from the reference set based on globular proteins. The analyses with the Greenfield and Fasman15 reference set plus the spectrum of a model p-turn gave higher estimates than provided by the Yang et al.25 reference set of the percentages of a-helical secondary structures of all four phages. In additional analyses, we substituted the spectrum of the a-helical form of poly(L-glutamic acid)" for that of poly(L-lysine) in the Greenfield and Fasman15 reference set plus the p-turn spectrum; these analyses gave 43-44% a-helix for the class I phages and 64-65% a-helix for the class I1 phages. Moreover, the C(F,) for the class I phages were high, averaging 1.7-2.0. This further indicated that the spectrum of the poly(L-lysine) a-helix was especially appropriate for the analyses of the phage CD spectra.
2. Relying on the analyses with the Greenfield and Fasman15 reference set, with the inclusion of the spectrum of a model /?-turn for the analysis of the Pf3 spectrum and an estimate of the spectrum of Trp for the analyses of the fd and IKe spectra, we concluded that the class I phages have close to 100% a-helix (98 f 2 for fd and 97 k 5% for IKe), while the class I1 phages both have less a-helix content (83 A- 6% for Pfl and 84 k 2% for Pf3). Therefore, with the dilute phage concentrations used for the CD measurements, the a-helix content of Pfl was about 83% and was lower than that of fd. This result disagreed with the relative a-helix contents of these phage determined using Raman ~pectroscopy,~ which indicated that fd had about 20% less a-helix content than Pfl.
3. Since sample concentration can affect the a-helix content of some filamentous phages," and Raman studies are typically performed a t much higher concentrations ( = 100 mg/mL) than those we used ( = 0.1-0.3 mg/mL), we measured the CD spectra of samples of each phage differing by at least 100-fold in concentration (0.2-2.2 mg/mL for fd, 0.02-1.9 mg/mL for IKe, 0.03-3.7 mg/mL for Pfl, and 0.02-1.2 mg/mL for Pf3). Spectra were mea- sured from 250 to a t least 195 nm in cells of 0.012 and 2.0-cm path lengths. Over this wavelength range and within these ranges of concentrations, no significant differences were seen in magnitudes or shapes of the phage CD spectra (not shown). Because the concentration of these samples were still a t least a factor of 30 less than that routinely used for Raman measurements, i t remains a question as to whether differences in concentration would a t least partially explain the different percentages of a-helix obtained by CD and Raman techniques. There is a recent report from resonance Raman measure- ments that fd phage samples a t a relatively dilute concentration of 2 mg/mL have 98% a-helix content? with which our CD analyses are in agreement.
4. The percentages of a-helix measured for filamentous phages are high compared with those predicted from the primary sequences" (see the intro- duction). In one regard our results do appear to be in agreement with the
1872 CLACK AND GRAY
predicted percentages: predictive methods and our CD analyses both give a-helix contents that are higher for the class I phages than for the class I1 phages.
5. A final point is that CD spectra of simple reference compounds can account for the observed CD spectral shapes of the filamentous phages. There was no reason to invoke the presence of unusual CD contributions, such as from the regular macromolecular organization of many a-helices in the phage structures. Although the inclusion of an estimate for a possible positive Trp CD component largely accounted for the reduced negative 208-nm CD band in the spectra of fd and IKe phages, this should not be taken as proof that Trp indeed is the source of the somewhat unusual shapes of these phage CD spectra. Rather i t is an example of the type of CD contribution that could be the explanation. Our confidence in the analyses was enhanced by the fact that the fractions of a-helix contents for fd and IKe determined with the Greenfield and Fasman15 reference set did not depend on the inclusion or omission of the possible Trp contribution.
Note added in proof: We are working with Dr. L. A. Day, Public Health Research Institute of the City of New York, to resolve the differences in magnitudes of the phage CD spectra measured in our two laboratories.
This work was performed by B. A. C. in partial fulfillment of the requirements for the Ph.D. in the Program in Molecular and Cell Biology at the University of Texas at Dallas. Support was provided by NIH Research Grant GM 19060 and Grant AT-503,from the Robert A. Welch Foundation. Marilyn R. Vaughan provided help and expertise in performing the phage infections.
References 1. Day, L. A., Marzec, C. J., Reisberg, S. A. & Casadevall, A. (1988) Ann. Reu. Biophys.
2. Makowski, L. (1984) in Biological Macromolecules and Assemblies. Vol 1: Virus Structures,
3. Putterman, D. G., Casadevall, A., Boyle, P. D., Yang, H. L, Frangione, B. & Day, L. A.
4. Makowski, L., Caspar, D. L. D. & Marvin, D. A. (1980) J. Mol. Biol. 140, 149-181. 5. Bryan, R. K., Bansal, M., Folkhard, W., Nave, C. & Marvin, D. A. (1983) Proc. Natl. Acad.
6. Cross, T. A., Tsang, P. & Opella, S. J. (1983) Biochemistry 22, 721-726. 7. Thomas, G. J., Jr., Prescott, B. & Day, L. A. (1983) J. Mol. Biol. 166, 321-356. 8. Grygon, C. A., Perno, J. R., Fodor, S. P. A. & Spiro, T. G. (1988) BioTechniques 6, 50-55. 9. Day, L. A. & Wiseman, R. L. (1978) in The Single-Stranded DNA Phages, Denhardt, D. T.,
Dressler, D. & Ray, D. S., Eds., Cold Spring Harbor Laboratory, Cold Spring Harbor, pp.
Biophys. Chem. 17, 509-539.
Jumak, F. A. & McPherson, A., Eds., John Wiley & Sons, New York, pp. 203-253.
(1984) Proc. Natl. Acad. Sci. USA 81, 699-703.
Sci. USA 80,4728-4731.
605-625. 10. Thomas, G. J. & Day, L. A. (1981) Proc. Natl. Acad. Sci. USA 78, 2962-2966. 11. Finer-Moore, J., Stroud, R. M., F'rescott, B. & Thomas, G. J., Jr. (1984) J. Biomol. Strut .
12. Gamier, J., Osguthorpe, D. J. & Robson, B. (1978) J. Mol. Biol. 120, 97-120. 13. Chou, P. Y. & Fasman, G. (1978) Ada Enzymol. 47, 45-148. 14. Woody, R. W. (1985) The Peptides 7, 15-114. 15. Greenfield, N. & Fasman, G. D. (1969) Biochemistry 8,4108-4116. 16. Gray, D. M., Gray, C. W. & Carlson, R. D. (1982) Biochemistry 21, 2702-2713. 17. Antao, V. P., Gray, D. M. & Ratliff, R. L. (1988) Nucleic Acids Res. 16, 719-738. 18. Chen, G. C. & Yang, J. T. (1977) Anal. Lett. 10, 1195-1207. 19. Savitzky, A. & Golay, M. J. E. (1964) Anal. Chem. 36, 1627-1639.
Dynam. 2,93-100.
(Y-HELIX CONTENTS OF COAT PROTEINS 1873 20. Berkowitz, S. A. & Day, L. A. (1976) J. Mol. Biol. 102, 531-547. 21. Wiseman, R. L., Berkowitz, S. A. & Day, L. A. (1976) J. Mol. B i d 102, 549-561. 22. Casadevall, A. & Day, L. A. (1983) Biochemistry 22, 4831-4842. 23. Chen, Y. H., Yang, J. T. & Chau, K. H. (1974) Biochemistry 13, 3350-3359. 24. Chang, C. T., Wu, C. S. & Yang, J. T. (1978) Anal. Biochem. 91, 13-31. 25. Yang, J. T., Wu, C.-S. C. & Martinez, H. M. (1986) Methods Enzymol. 130, 208-269. 26. Kawai, M. & Fasman, G. (1978) J. Am. Chem. SOC. 100, 3630-3632. 27. Adler, A. J., Greenfield, N. J. & Fasman, G. D. (1973) Methods E m y m l . 27, 675-735. 28. Compton, L. A. &Johnson, W. C., Jr. (1986) Anal. Biochem. 155, 155-167. 29. Hennessey, J. P. & Johnson, W. C., Jr. (1981) Biochemistry 20, 1085-1094. 30. Johnson, W. C., Jr. (1988) Ann. Rev. Biophys. C h m . 17, 145-166. 31. Lewis, D. G. &Johnson, W. C., Jr. (1974) J. Mol. Bwl. 86,91-96. 32. Madison, V. & Schellman, J. (1972) Biopolymers 11, 1041-1076. 33. Brahms, S. & Brahms, J. (1980) J . Mol. Biol. 138, 149-178.
Received October 21, 1988 Accepted January 5,1989
Related Documents