A CAUSAL-COMPARATIVE STUDY INVESTIGATING DIFFERENCES IN CULTURAL INTELLIGENCE LEVELS OF COLLEGE FACULTY by Annik A. Miller Liberty University A Dissertation Presented in Partial Fulfillment Of the Requirements for the Degree Doctor of Education Liberty University 2020

Welcome message from author
This document is posted to help you gain knowledge. Please leave a comment to let me know what you think about it! Share it to your friends and learn new things together.
Transcript
A CAUSAL-COMPARATIVE STUDY INVESTIGATING DIFFERENCES IN CULTURAL
INTELLIGENCE LEVELS OF COLLEGE FACULTY
by
Annik A. Miller
Liberty University
A Dissertation Presented in Partial Fulfillment
Of the Requirements for the Degree
Doctor of Education
Liberty University
2020
2
A CAUSAL-COMPARATIVE STUDY INVESTIGATING DIFFERENCES IN CULTURAL
INTELLIGENCE LEVELS OF COLLEGE FACULTY
by
Annik A. Miller
Liberty University
A Dissertation Presented in Partial Fulfillment
Of the Requirements for the Degree
Doctor of Education
Liberty University, Lynchburg, VA
2020
APPROVED BY:
Eric G. Lovik, Ph. D. Chair
Ellen Lowrie Black, Ed. D., Committee Member
Orlando Lobaina, Ed. D., Committee Member

3
ABSTRACT
In this age of globalization, colleges need to ensure that their students be able to function
effectively across cultures upon graduation. This ability is referred to as Cultural Intelligence
(CQ) and is comprised of four subfactors: Metacognitive, Cognitive, Motivational, and
Behavioral CQ. Faculty play an important role in getting students exposed to the cross-cultural
experiences and thoughts needed to develop CQ, yet little is known about the faculty’s CQ
levels. The purpose of this study with a quantitative causal-comparative cross-sectional research
design was to determine if the undergraduate faculty members in this convenience sample have
differing levels of CQ between academic units within a large faith-based university in the
southeastern United States. The independent variable was the academic units in which the
faculty teach and the continuous dependent variables of CQ were measured with the Expanded
Cultural Intelligence Scale. A one-way analysis of variance (ANOVA) was conducted with the
Composite CQ scores of faculty as the dependent variable, and a multivariate analysis of
variance (MANOVA) was conducted, using the CQ scores of faculty on the four factors of CQ
as dependent variables. The results of this study indicate there are statistically significant
differences between the faculty of several academic units on the Composite, Cognitive,
Metacognitive, and Behavioral CQ scores but not Motivational CQ scores. The findings provide
valuable information to determine whether CQ training during faculty development should be
provided to all faculty across the board or with discipline-specific variations.
Keywords: Cultural intelligence, CQ, cognitive CQ, metacognitive CQ, motivational CQ,
behavioral CQ, faculty development

4
Dedication
This dissertation is dedicated to my family without whom I would not have made it
through the grueling process. First to my parents Henri and Charlotte who instilled in us the gift
of common sense and the value of self-discipline and hard work. Then to my husband Ron and
children Amanda, Briana, and Colin who stuck by me through thick and thin. They encouraged
me when I doubted myself, they made me laugh when I needed a distraction, and they picked up
the slack when I didn’t have time to make dinner. Hopefully, I’ve been able to show you that we
are never too old to learn. And finally, to my nephew Jeremy, who showed me that us country-
bumpkins can earn a doctorate, and my sister Brigitte who dragged me on adventures to restore
my sanity.
Above all, it is dedicated to God who gave me the strength, guidance, and wisdom to
persevere through the doctoral process. No doubt Cultural Intelligence is part of His perfect plan
of what heaven will be like: “After this I looked and there before me was a great multitude that
no one could count, from every nation, tribe, people and language, standing before the throne
and in front of the Lamb” (Rev. 7:9, NIV).

5
Acknowledgments
This dissertation would not have been possible without the tireless guidance and
encouragement from my chair Dr. Eric Lovik and committee members Dr. Ellen Lowrie Black
and Dr. Orlando Lobaina.
Thank you also to Dr. Cindy Spaulding for leading me to the topic of Cultural
Intelligence when my previous topic went off the rails. I will be happy to return the inspirational
penny you handed out in EDUC 919 to keep us motivated to persevere till the end.
For their daily encouragement, I am grateful to my colleagues in the Department of
Modern Languages. You are always good for a laugh, but also true personification of godliness
and Cultural Intelligence.
Dr. Black, I am honored to have been prayed over by your mother and you and am happy
that I was able to defend my dissertation on a day that commemorates your father. Everyone
who has benefited from your teaching in an intensive no doubt remembers the seemingly
impossible task you gave us: to summarize our whole paper in ten words, then three, then one. If
you’ll indulge me, I’ll use two very short words: All nations!

6
Table of Contents
ABSTRACT .....................................................................................................................................3
Dedication ........................................................................................................................................4
Acknowledgments............................................................................................................................5
List of Tables .................................................................................................................................10
List of Figures ................................................................................................................................11
List of Abbreviations .....................................................................................................................12
CHAPTER ONE: INTRODUCTION ............................................................................................13
Overview ............................................................................................................................13
Background ........................................................................................................................14
Historical Context ..................................................................................................14
Conceptual Context ................................................................................................15
Societal Context .....................................................................................................16
Problem Statement .............................................................................................................17
Purpose Statement ..............................................................................................................19
Significance of the Study ...................................................................................................19
Research Question .............................................................................................................20
Definitions..........................................................................................................................21
CHAPTER TWO: LITERATURE REVIEW ................................................................................22
Overview ............................................................................................................................22
Theoretical Framework ......................................................................................................23
Defining Culture ....................................................................................................23
Defining Intelligence .............................................................................................25

7
Distinctiveness of Cultural Intelligence .................................................................28
Learning Theories ..................................................................................................35
Related Literature...............................................................................................................38
What Is Globalization? ..........................................................................................39
Antecedents of Cultural Intelligence .....................................................................39
Confounding Variables and Boundary Conditions ................................................43
Benefits of Higher CQ in the Workforce ...............................................................45
Criticism of CQ ......................................................................................................48
The Role of Colleges in Developing CQ ...............................................................50
Faculty Development .............................................................................................56
Differences in Cross-Cultural Thinking and Interactions among Disciplines .......58
Summary ............................................................................................................................61
CHAPTER THREE: METHODS ..................................................................................................64
Overview ............................................................................................................................64
Design ................................................................................................................................64
Research Question .............................................................................................................66
Hypotheses .........................................................................................................................66
Participants and Setting......................................................................................................67
Instrumentation ..................................................................................................................68
Procedures ..........................................................................................................................73
Data Analysis .....................................................................................................................75
CHAPTER FOUR: FINDINGS .....................................................................................................78
Overview ............................................................................................................................78

8
Research Question .............................................................................................................78
Null Hypotheses .................................................................................................................78
General Descriptive Statistics ............................................................................................79
Hypothesis One: Composite CQ Score ..............................................................................81
Descriptive Statistics ..............................................................................................82
Assumptions Testing for ANOVA.........................................................................83
Results ....................................................................................................................86
Descriptive Statistics: Hypotheses Two through Five .......................................................87
Descriptive Statistics: Four Factors .......................................................................87
Descriptive Statistics: Cognitive CQ .....................................................................88
Descriptive Statistics: Metacognitive CQ ..............................................................89
Descriptive Statistics: Motivational CQ ................................................................90
Descriptive Statistics: Behavioral CQ ...................................................................91
Assumptions Testing: Hypotheses Two through Five .......................................................92
Results ................................................................................................................................97
Summary of the Results ...................................................................................................100
CHAPTER FIVE: CONCLUSIONS ...........................................................................................101
Overview ..........................................................................................................................101
Findings............................................................................................................................101
Discussion of Results ...........................................................................................103
Reflections on Groupings ....................................................................................105
Knowledge Gained from Outliers ........................................................................106
Implications for Practice ..................................................................................................109

9
Limitations .......................................................................................................................110
Recommendations for Future Research ...........................................................................111
REFERENCES ............................................................................................................................115
APPENDICES .............................................................................................................................140
Appendix A: Demographic Questions .............................................................................140
Appendix B: IRB Approval .............................................................................................143
Appendix C: Informed Consent Form .............................................................................144
Appendix D: Recruitment Email .....................................................................................146
Appendix E: Recruitment Email Follow-Up 1 ................................................................147
Appendix F: Recruitment Email Follow-Up 2.................................................................148
Appendix G: Permission to Use E-CQS ..........................................................................149
Appendix H: Permission to Use Open Doors Graphics ...................................................150

10
List of Tables
Table 1: Example Items from the Expanded Cultural Intelligence Scale………………….…….72
Table 2: Demographic Information ……………………………………………………………...80
Table 3: Descriptive Statistics: Composite CQ Scores by Group……………………………..…83
Table 4: Levene’s Test of Equality of Variance: Composite CQ Scores………………….……..84
Table 5: Kolmogorov-Smirnov Test of Normality…………………………………………...…..85
Table 6: ANOVA: Composite CQ Score……………………………………………………...….87
Table 7: Descriptive Statistics: CQ Scores by Factor…………………………………….……....88
Table 8: Descriptive Statistics: Cognitive CQ Scores by Group………………………………….89
Table 9: Descriptive Statistics: Metacognitive CQ Scores by Group…………………….……….90
Table 10: Descriptive Statistics: Motivational CQ Scores by Group………………………….....91
Table 11: Descriptive Statistics: Behavioral CQ Scores by Group ……………………………...92
Table 12: Kolmogorov-Smirnov Test of Normality by Groups on Each Factor………………...94
Table 13: Pearson Product-Moment Correlation……………………………………….……..….96
Table 14: Levene’s Test of Equality of Variance: Four factors of CQ………………..………... 96
Table 15: Multivariate Results for Four CQ Factors…………………………………………….97
Table 16: ANOVA Results for Four CQ Factors ………………..………………………………97

11
List of Figures
Figure 1: Increase in international students in the United States between 1953 and 2016…51
Figure 2: Increase in U.S. students studying abroad between 1989 and 2015………………52
Figure 3: Boxplots of composite CQ scores by group………………………………………84
Figure 4: Q-Plot of Group 5 composite CQ scores…………………………………………85
Figure 5: Bar graph of mean composite CQ scores by group………………………………86
Figure 6: Boxplots of four factors of CQ scores by group…………….…………………….93
12
List of Abbreviations
American Council on the Teaching of Foreign Languages (ACTFL)
Analysis of Variance (ANOVA)
Cultural Intelligence (CQ)
Cultural Intelligence Scale (CQS)
English as a Second Language (ESL)
Expanded Cultural Intelligence Scale (E-CQS)
Experiential Learning Theory (ELT)
Institutional Review Board (IRB)
Multivariate Analysis of Variance (MANOVA)
Second Language (L2)
Statistical Package for the Social Sciences (SPSS)

13
CHAPTER ONE: INTRODUCTION
Overview
When traveling abroad many tourists are eager to break the stereotype of the “Ugly
American” (Burdick & Lederer, 1958) and show sensitivity when interacting with people in
other countries. This “capability of an individual to function effectively in situations
characterized by cultural diversity” is called Cultural Intelligence (Ang & Van Dyne, 2009, p. 3).
Cultural Intelligence (CQ) is comprised of four facets: Cognitive, Metacognitive, Motivational,
and Behavioral CQ (Earley & Ang, 2003). Its relevance extends well beyond mere public
relations concerns, as being culturally intelligent rose to become a top five requirement of
college graduates over a decade ago (Yankelovich, 2005). As a result of the increased
internationalization of higher education, students need to develop intercultural competence while
still in school in order to interact with peers and professors. More importantly, 78% of
employers surveyed considered intercultural skills to be an essential attribute in their prospective
employees, and thus a skill all students should develop before seeking employment (Hart
Research Associates, 2015). In order to compete in the global arena, university administrators
must be able to show that they are preparing students for this global workforce, both in terms of
attracting international student revenue and graduating culturally intelligent students (Griffith,
Wolfeld, Armon, Rios, & Liu, 2016). Just 10 years ago, fewer than 10% of college graduates
were deemed globally prepared (National Leadership Council for Liberal Education and
America’s Promise [NLCLEAP], 2007). It is, therefore, not surprising that the Association of
American Colleges and Universities (2011) now lists the ability to work and communicate
effectively across cultures as an essential outcome of higher education. Goh’s statement that
“how culturally intelligent our students become is a function of a teacher’s own level of cultural

14
intelligence” (2012, p. 402) indicates that the role of faculty goes beyond being purveyors of
content knowledge. Faculty play an integral part in providing CQ building opportunities for
students across the curriculum. To do that effectively, they have to first be aware of their own
CQ (Goh, 2012; Lopes-Murphy, 2014), and those lacking in CQ should be provided appropriate
training during faculty development sessions. Yet little is known about the CQ makeup of
faculty across disciplines, leaving faculty development specialists without data to make informed
decisions on how and to whom they should provide CQ training.
Background
Just a few decades ago, working with people from other cultures was a concern only for
expatriates. Thanks to advances in travel and technology, however, we now live in an
increasingly globalized world, where most people have to interact with businesses, customers,
suppliers, coworkers, or visitors from different cultures. The ability to function effectively
across cultures is therefore crucial for success in all international dealings (West, 2012).
Historical Context
Attention to culture has ebbed and flowed over the years. After a post-World War II lull,
cross-cultural psychologists regained interest in the topic of culture upon the publication of
several seminal works by Triandis (1981), Hofstede (1984, 1994), and Markus and Kitayama
(1991). Their work on the differences in values such as individualism-collectivism, power
distance, uncertainty avoidances, and masculine-feminine sparked new research to explain how
culture and behavior influence each other (Ang, Van Dyne, & Rockstuhl, 2015). The tragic
events of September 11, 2001 caused Earley and Ang to reflect upon the “fundamental failure of
people to understand one another’s culture and needs” (2003, p. xi). Instead of merely wanting
to understand differences, they saw the need to help individuals bridge these cultural differences.

15
The concept of intercultural competence generated a number of studies and produced over 30
models of intercultural competence and some 300 personal characteristics associated with it,
encompassing worldviews and attitudes as well as capabilities and traits resulting in a lack of
theoretical precision without cohesive framework (Ang, Van Dyne, et al., 2015; Holt & Seki,
2012; Leung, Ang, & Tan, 2014; Spitzberg & Chagnon, 2009).
Conceptual Context
Earley and Ang (2003) based their theory of Cultural Intelligence upon Sternberg and
Detterman’s (1986) premise that intelligence is not a reflection of just one factor, but is a
multidimensional construct. Unsatisfied with the traditional view of academic intelligence and
the instrument used to measure the corresponding intelligence quotient (IQ), some theorists
focused on nonacademic intelligences (i.e., adaptive behaviors) necessary to successfully
navigate the real world outside of the school setting (Earley & Ang, 2003). These theorists
viewed social intelligence as an important factor to understand why some individuals are better
able to get along with others (R. L. Thorndike, 1936; R. L. Thorndike & Stein, 1937; Walker &
Foley, 1973). Later, Salovey and Mayer (1990) highlighted the concept of emotional
intelligence, the ability to understand emotions and guide one’s actions accordingly. While
social intelligence explains successful interaction within one’s culture, Earley and Ang (2003)
determined that these theories still left unexplained the differing abilities individuals possess to
adjust across different cultures. Again following Sternberg’s (1986) theory, Earley and Ang
(2003) conceptualized Cultural Intelligence as a dimension of intelligence that includes not just a
cognitive dimension (cognition and metacognition), but also a motivational and behavioral
dimension.

16
Earley and Ang (2003) also conceptualized Cultural Intelligence as a malleable form of
intelligence that is developed through exposure to an intercultural environment. Thus, social
learning theory (Bandura, 1977b) and bioecological theory (Bronfenbrenner & Ceci, 1994)
feature prominently in their understanding of how to develop CQ. Kolb’s (1984) experiential
learning theory provided the foundation to explain how individuals use their intercultural
experiences to create knowledge. Bronfenbrenner and Ceci,(1994) contend that the extent of
development based on interaction with the environment depends on motivation. Thus Earley and
Ang emphasized the role of motivation, especially its self-efficacy component (Bandura, 1977a),
to explain an individual’s effectiveness in handling difficult cross-cultural situations.
Societal Context
Cultural Intelligence is not just a theoretical issue, as the lack of CQ has far-reaching
implications in society. Due to its potential impact on the bottom line, the field of business has
shown a lot of interest in the CQ concept. Research has shown, for instance, that CQ has a
positive impact on dealings in complex cultural interactions in international business (Alon &
Higgins, 2005; Earley & Ang, 2003; Livermore, 2015), for military personnel (Davis, 2009;
Rockstuhl, Seiler, Ang, Van Dyne, & Annen, 2011), and for adaptation and task performance in
diverse settings (Cho & Morris, 2015; Jyoti & Kour, 2015; Konanahalli et al., 2014). Improving
CQ levels has become an integral part of the training given to business and military leaders,
expatriate workers and their families, as well as participants in study abroad or mission trips
(Ang et al., 2007; Crowne, 2008, 2013; Earley & Ang, 2003; Harrison & Brower, 2011; Ward &
Kennedy, 1993).
Because CQ is considered a malleable trait (Van Dyne et al., 2012), it naturally is of
interest to education also. The increasing diversity inside classrooms means all teachers have to

17
adapt their teaching to reach their culturally and linguistically diverse students (G. Li, 2013).
Beyond relating to their students and purveying knowledge, however, college faculty are also
charged with preparing their students to be effective in a globalized world when they leave
school. To that end, research supports the importance of providing students repeated
opportunities to think and interact cross-culturally (Billings, 2006; Crowne, 2008; Egan &
Bendick, 2008; Karnyshev & Kostin, 2010; Lopes-Murphy, 2014; Lovvorn & Chen, 2011;
MacNab, 2012; McCrea & Yin, 2012; West, 2012; William & Nagy, 2012). Many students,
however, are unable to do this through study abroad or mission trips, due to money or time
constraints. Developing the CQ level of all students, therefore, needs to occur across the
curriculum in the classroom and not be limited to just disciplines associated with teaching culture
(Karnyshev & Kostin, 2010; West, 2012).
As repeated exposure to cross-cultural experiences is needed, understanding the cultural
level of all faculty is relevant (Crowne, 2008; Lopes-Murphy, 2014; Lovvorn & Chen, 2011;
Tuleja, 2014). There are disciplines where teaching and comparing cultures is an integral part of
the subject matter. Disciplines such as foreign languages, anthropology, or global studies
prepare students for effective cross-cultural engagement (American Council on the Teaching of
Foreign Languages [ACTFL], n.d.; Byram, 1997; Choudhury, 2013; National Standards in
Foreign Language Education Project, 2006). Faculty in those departments, having trained in
language and/or culture, might thus be expected to have higher CQ levels than faculty in other
subject matters that offer little exposure to cross-cultural thought or experiences.
Problem Statement
Possessing intercultural knowledge and competence has been identified as one of twelve
“Essential Learning Outcomes” (NLCLEAP, 2007, p. 12) for college learning in the 21st century.

18
Having ineffective expatriate employees who fail to understand the nuances of their host culture
is costly to companies. Schein (1985) explains that culture is how groups of people solve
common problems and reconcile their dilemmas, but the simplicity of this definition belies
culture’s complex nature. Trompenaars and Hampden-Turner (1997) liken the concept of culture
to an onion with its multiple layers. The visible products of culture, such as buildings or roads,
merely form the outside visible layer which covers a less visible layer of norms and values.
Assumptions about existence constitute the core of the onion from which the layers grow. Being
aware of cultural differences and being able to adapt to different cues is essential to effectively
communicate or conduct business with people of other cultures. For this reason, Earley and Ang
(2003) developed a framework called Cultural Intelligence or CQ to explain why some
individuals are better at adapting to other cultures. Their conceptualization of CQ includes a
cognitive dimension that combines Metacognitive CQ and Cognitive CQ, a motivational
dimension, and a behavioral dimension. In order to be effective, all four facets of CQ need to
work in unison. Building CQ in students cannot be limited to imparting declarative knowledge
in isolated chunks but should occur across the curriculum (Crowne, 2008; Karnyshev & Kostin,
2010; Lovvorn & Chen, 2011; Tuleja, 2014; West, 2012). It is, therefore, incumbent upon
faculty across all disciplines to consistently expose students to cross-cultural thinking and
interactions (Goh, 2012; Lopes-Murphy, 2014), but little is known about CQ levels of faculty
and potential variations among them. Colleges offer faculty development seminars to improve
the knowledge and skills of their faculty so they can better meet the learning needs of their
students (Elliott, 2014). Providers of professional development must make important decisions
on the most effective use of the limited days of training they can offer faculty at the beginning of
every semester (Desimone & Garet, 2015). They need to weigh which topics need to be directed

19
at the faculty as a whole and which are better offered to specific departments. The problem is
that there is no research indicating whether there are differences in the CQ levels of
undergraduate faculty between academic units to indicate who would benefit most from CQ
training.
Purpose Statement
The purpose of this quantitative causal-comparative study was to determine if there is a
difference in Cultural Intelligence levels of undergraduate college faculty of individual academic
units at a faith-based university. CQ is considered malleable and the four factors can be
improved independently through learning, training, and experience (Van Dyne et al., 2012). The
independent variable is the academic unit in which the undergraduate faculty teach at this faith-
based university (Liberal Arts, Behavioral Sciences, Business, Divinity, Sciences and
Technology, Fine and Performing Arts, and Government). The dependent variable, Cultural
Intelligence, is defined as the ability to function effectively in culturally diverse situations as
measured by the participants’ score on the Expanded Cultural Intelligence Scale (E-CQS; Van
Dyne et al., 2012).
Significance of the Study
This study will contribute to the emerging body of knowledge on the relatively recent
concept of Cultural Intelligence (Earley & Ang, 2003). As faculty play an integral part in
developing students’ CQ (Goh, 2012; Lopes-Murphy, 2014), it is important to understand their
CQ profile in order to equip them to infuse culturally intelligent practices into the curriculum and
better prepare students for global work and service. Though the Composite CQ score is
important, Earley and Ang (2003) emphasize that each of the four components represents a
different capability. The data gathered through this study were used to investigate differences in

20
Composite CQ, as well as the individual factors (Metacognitive, Cognitive, Motivational, and
Behavioral CQ), and help determine whether faculty in certain disciplines share similar CQ
traits. Whether data reveal significant differences in CQ between disciplines or not, the findings
can inform the decisions faculty development providers make about the appropriate way to
deliver CQ training (Desimone & Garet, 2015; Elliott, 2014). The absence of significant
differences between some units indicates that faculty in those schools may benefit equally from
CQ training, whereas lower levels in other units within the university indicate a need to target
efforts toward them. This information allows for discipline-specific training on how faculty can
integrate intercultural learning activities into their courses that keep students actively engaged
and stimulated (Barker & Mak, 2013). Dar, Jabeen, Jadoon, and Dar’s (2016) findings indicate
that “faculty members at all levels are aware of the current dynamic changes in the field of
teaching and they are keen to learn the state of art teaching techniques and methodologies for
effective teachings” (p. 332). CQ would seem especially important at a faith-based university
(Taylor, Van Zandt, & Menjares, 2013) where students from all disciplines are sent into the
world to be the hands of Christ and need CQ, not merely to make money, but to serve others and
affect lives. This requires the ability to interact effectively across cultures (MacNab & Worthley,
2012). The findings of this study indicate a need for other universities to likewise query their
faculty on their CQ level to help guide future faculty development seminars.
Research Question
RQ1: Do the undergraduate faculty in individual academic units in a major university
have different levels of Cultural Intelligence when compared to other units, as measured by the
Expanded Cultural Intelligence Scale?

21
Definitions
1. Behavioral CQ - Behavioral CQ refers to an individual’s flexibility to implement
appropriate verbal and nonverbal actions during multicultural encounters (Earley &
Ang, 2003).
2. Cognitive CQ - This aspect of CQ refers to the knowledge about countries and culture-
specific norms and practices, and how it informs the way people think or act differently
(Van Dyne, Ang, & Koh, 2008).
3. Cultural Intelligence (CQ) - Cultural Intelligence is the ability to function effectively in
cross-cultural interactions (Van Dyne et al., 2008).
4. Culture - The patterned way of thinking that results from the assimilation and
interaction of values and environmental responses (Hofstede, 1984).
5. Faculty Development - “An intentional set of educational activities designed to equip
faculty to grow in their professionalism” (McKee & Tew, 2013, p. 13).
6. Globalization - The significant impact that events and decisions occurring in one part of
the world have on communities in other parts of the world (McGrew, 1992).
7. Metacognitive CQ - Metacognitive CQ is an individual’s active awareness of
differences between cultures that comes from knowledge and awareness, and the ability
to adjust mental maps accordingly (Van Dyne et al., 2008).
8. Motivational CQ - Motivational CQ refers to the capability (interest and confidence) to
focus attention on cultural differences (Van Dyne et al., 2008).

22
CHAPTER TWO: LITERATURE REVIEW
Overview
Language is intertwined with culture; each is necessary to understand the other. In fact,
philosopher Ludwig Wittgenstein (1953) described language as a social practice that needs to be
observed in order to communicate with a given social tribe. He considered words as part of a
language game that have meaning only for those familiar with the game and its rules
(Wittgenstein, 1953). Even among people of a social tribe who share the same cultural context, a
person with high cognitive and social intelligence is better equipped to understand and react to
another person than those with low levels (Kihlstrom & Cantor, 2000). The rules of the game
change again, however, when people have to interact across cultures with people who do not
share the same references. Though they may know the words to communicate in the other
language, they may not know all the cultural rules needed to successfully play the game. As the
number of international travelers and expatriates has increased, it has become increasingly
important to understand why some individuals are more successful at adapting to their new
environment than others. Earley and Ang (2003) coined the term Cultural Intelligence (CQ)
when they investigated what allowed some people to use the available information in unfamiliar
settings to develop a new attributional and perceptual frame more quickly than others. They
explained that “each individual brings to a situation a somewhat different mix of CQ abilities,
which are often influenced by one’s values, learning history, interest, and goals” (Earley & Ang,
2003, p. 190). Though this statement highlights that each person has a unique CQ profile, it also
indicates that similar learning history, interests, and goals could lead to congruent CQ skills.
Livermore (2015) summarized the relevance of high levels of CQ in these words:

23
Having a high CQ doesn’t mean exhibiting flawless behavior in cross-cultural settings.
Instead, it is personified by people with a strong sense of their own cultural identity. They
know who they are and what they believe, but they’re equally interested to discover that
in others. And individuals with high CQ have an integrated view of the world that
appreciates both the similarities and differences among people. (p. 8)
This review of literature first examines the theoretical framework of the concept of CQ
and the existing body of knowledge on its antecedents and consequences. Then, it explores the
literature related to the shared learning history of faculty and the role of faculty development in
improving CQ.
Theoretical Framework
Cultural Intelligence is a relatively new dimension of intelligence, conceptualized
roughly 15 years ago by Earley and Ang (2003) to explain what allowed some individuals to
adapt better to different cultures than others. This section delves into an understanding of what
CQ is and how it fits into the conceptualization of intelligence. As CQ is considered a malleable
trait (Earley & Ang, 2003), relevant learning theories that form the framework for developing
CQ will also be addressed.
Defining Culture
Borders may define the limits of a country, but they cannot keep issues such as political,
ecological, or environmental developments from reaching beyond the confines of those borders.
Many confrontations occur between individuals or nations because their cultures think, feel, and
act differently (Hofstede, Hofstede, & Minkov, 2010). The rapid globalization of the past
century has led to unprecedented interconnectedness between people around the world, and as a
result, to increased opportunities for conflict. Elie Wiesel stated that cultural hatred has always

24
been the major source of human conflicts (Wiesel & Heffner, 2009), yet little is still known
about the psychological outcomes of the globalization phenomenon (Chiu, Gries, Torelli, &
Cheng, 2011). Ginges and Atran (2013) were able to shed light on one area of globalized
conflict: the importance of understanding the sacred values of other cultures. Sacred values are
things or ideas that are considered as moral imperatives rather than an ordinary preference, and
their link to emotions makes them resistant to material tradeoffs. Intractable conflicts
surrounding sacred values are therefore not served by business negotiations but may respond to
symbolic concessions that show recognition of core values (Ginges & Atran, 2013). Though
such conflicts can occur within a country, such knowledge takes on increased significance in a
globalized world.
Interest in the concept of culture dates as far back as the fifth century BC, when historian
Herodotus commented that humans evaluated and preferred other cultures based on the standards
of their own culture. Yet anthropologists, the scientists who study the characteristics, cultural
development, and social customs of humankind, have yet to reach an agreement on how to define
culture, in spite of centuries of effort (Spencer-Oatey, 2012). In their review of the concept of
culture, Kroeber and Kluckhohn (1952) listed no fewer than 164 definitions of the term. Arnold
(1932) used the term culture to define artistic or intellectual products. The implication was that
only a small portion of any social group possesses this “high” culture. In reaction to this narrow
aesthetic view, Tylor (1874) proposed a more scientific view, defining culture as “that complex
whole which includes knowledge, belief, art, morals, law, custom, and any other capabilities and
habits acquired by man as a member of society” (p. 1). According to this broader perspective,
everyone has culture by virtue of belonging to a social group, yet the level of culture was defined
on an evolutionary progression from savage to barbaric to civilized. Against this social

25
evolutionist view of culture as a universal character of a single group rated on a qualitative
continuum, Boas (1940) focused on the uniqueness of varied cultures of people and societies.
According to him, culture should not be viewed as high or low, nor savage or civilized.
Trying to encompass the depth of the concept, Spencer-Oatey (2008) proposed this definition:
Culture is a fuzzy set of basic assumptions and values, orientations to life, beliefs,
policies, procedures and behavioural conventions that are shared by a group of people,
and that influence (but do not determine) each member’s behaviour and his/her
interpretations of the ‘meaning’ of other people’s behaviour. (p. 3)
She highlights the fact that culture is manifested at several layers (observable artifacts, values,
and underlying assumptions), affects behavior and our interpretation of behavior, and, though
associated with social groups, it is both an individual and a social construct.
Another important element of culture is that it is not genetic but learned from each
individual’s social environment. It is thus related to but distinct from both human nature, the
universal elements all human beings have in common, and individual personality, which is based
upon inherited traits modified by collective programming and unique personal experiences.
Hofstede et al. (2010) envision the three levels of uniqueness in human mental programming as a
pyramid with inherited and universal human nature at its base. To this is added the middle layer
of culture, which is learned and specific to each individual’s group, and topped off by
personality, which is both inherited and learned.
Defining Intelligence
Mirroring the complex concept of culture, the only point on which experts in psychology
and philosophy agree is that there is “no agreed-upon definition of intelligence,” reflecting the
lack of worked-out theory of intelligence (Lanz, 2000, p. 19). At the 1921 Symposium on

26
Intelligence, 14 prominent educational researchers debated the concept of intelligence and how
to measure it. They provided differing views on intelligence as a mental ability, a sensory
capacity, a range of knowledge, a range of cognitive processes, or even noncognitive traits such
as perseverance (E. L. Thorndike, 1921). A similar symposium, organized by Sternberg and
Detterman 65 years later, gathered 20 intelligence researchers. Again, no consensus was reached
beyond the belief that intelligence is complex, with many facets and levels (Sternberg &
Detterman, 1986). Earley and Ang (2003) summarized the prevailing framework: “Broadly,
intelligence is theorized and measured as an intravindividual attribute, or as a characteristic of
the context or environment, or an attribute located at the interaction between an individual and
his or her context/environment” (p. 27).
Some researchers, however, noticed that the type of intelligent behavior that translates
into academic success does not always equate to success in daily life. Sternberg (1997)
classified these forms of intelligences as nonacademic. Thorndike focused on social intelligence,
which he viewed as necessary for individuals to understand others and to act wisely in human
relations (R. L. Thorndike, 1936; R. L. Thorndike & Stein, 1937). Walker and Foley (1973)
measured social intelligence as a cognitive construct, but also in terms of behavioral outcome.
According to Kihlstrom and Cantor (2000), social intelligence is comprised of both declarative
and procedural knowledge. Declarative knowledge involves conscious memory, and represents
factual knowledge, such as social events or abstract social concepts. Procedural knowledge, on
the other hand, involves the unconscious memory needed to apply social knowledge when
performing a task. Salovey and Mayer (1990) focused on people’s ability to monitor emotions
(both others’ and their own) to guide their thinking and behavior, and described their construct of
emotional intelligence as overlapping Gardner’s (1983) concept of intrapersonal intelligence.

27
They considered it a form of intelligence because it consists of a series of mental abilities. As
such, it is distinct from a mere behavioral preference, such as extraversion, which is not a mental
ability but a trait, even though extraversion may lead to social competence (Mayer & Salovey,
1993). Gardner (1983, 1993, 1999) proposed a theory that individuals have varied forms of
intelligences. He defined intelligence as an individual’s “ability to solve problems, or to create
products, that are valued within one or more cultural settings” (1983, p. x). Unhappy with the
narrow focus on linguistic, logical-mathematical, and spatial intelligences, he suggested humans
exhibit a collection of seven intelligences: verbal, logical, spatial, musical, kinesthetic,
interpersonal, and intrapersonal (Gardner, 1983). He later added naturalistic intelligence to the
list (Gardner, 1999). These intelligences relate to things, such as the arts, spiritualism, and
relating to oneself, others, or nature, that cannot be measured by conventional tests.
These varied views of what constitutes intelligence expanded the construct beyond what
was referred to as the g factor, which influences an individual’s performance on cognitive ability
tests (Spearman, 1927). The views reflected the belief that intelligence involves other
dimensions beyond the cognitive, such as a behavioral or motivational component. Sternberg
(1983) also added the observation that measures of intelligence were culturally-bound, stating:
“similar mental skills might be involved in two different cultures, but the cultural instantiations
of these skills, and hence the proper vehicles for assessing them, might be totally different” (p.
44). The fact that these measures of intelligence were only relevant within the specific culture
that determines its norms prompted Earley and Ang (2003) to explore the concept of a Cultural
Intelligence and how to measure it.

28
Distinctiveness of Cultural Intelligence
Sternberg and Detterman’s (1986) perspective that intelligence was multidimensional
opened the door to expanding the concept of cognitive intelligence, as defined by the Intelligence
Quotient, with the additional dimensions of social intelligence (Thorndike & Stein, 1937),
emotional intelligence (Mayer & Salovey, 1993), and practical intelligence (Sternberg, 1997).
The cultural competency models existing at the time, such as the Culture-Specific Assimilator,
focused on country-specific knowledge or abilities (Ang et al., 2007), and none of the
frameworks addressed the ability to solve cross-cultural problems (Ng, Van Dyne, & Ang,
2012). Intrigued by the varying levels of success among expatriates, Earley and Ang (2003)
wanted to understand why some people are better able to handle culturally diverse situations.
They introduced the concept of Cultural Intelligence (CQ), based on Sternberg and Detterman’s
(1986) framework of multiple loci of intelligence. This framework placed metacognition,
cognition, and motivation in the category of mental capabilities, but viewed actions as behavioral
capabilities. The CQ concept also integrates Triandis’s (1972) model that assesses the
relationship between psychological process, values, and social environment.
A series of studies (Ang & Van Dyne, 2009; Ang, Van Dyne, & Koh, 2006; Ang et al.,
2007; Earley & Ang, 2003; Van Dyne et al., 2008, 2012) were used to define CQ as an aggregate
multidimensional construct that is made up of four qualitatively different, yet related, facets
involving cognition (Metacognitive CQ and Cognitive CQ), motivation (Motivational CQ), and
behavior (Behavioral CQ).
Metacognitive CQ. Livingston (2003) defined metacognition as “higher order thinking
which involves active control over the cognitive processes engaged in learning” (p. 3). The
concept can be subdivided into metacognitive knowledge and metacognitive experiences to

29
encompass the processes used to acquire and understand knowledge, using strategies to regulate
cognitive activities (Flavell, 1979, 1987). Metacognition includes awareness of self, others, and
situations (Triandis, 2006), thus Metacognitive CQ is an individual’s active awareness of
differences as he or she interacts with people of other cultures (Earley & Ang, 2003). It allows
individuals to think critically, put together new patterns, and adjust mental maps accordingly, in
order to adapt to new cultures.
According to Earley and Ang (2003), Metacognitive CQ is the abstract reasoning used to
process cultural knowledge and experiences to guide future interactions. In a later return to flesh
out the theoretical aspect of CQ, Van Dyne et al. (2012) further subdivided Metacognitive CQ
into three essential components: planning, awareness, and checking. Planning is the advance
preparation individuals undergo before an intercultural encounter. By thinking about their
objectives and anticipating how they might respond to various novel situations, individuals can
develop appropriate plans of actions. In contrast to planning, which focuses on anticipation,
awareness describes how cognizant individuals are about the differences in mental processes and
cultural habits between themselves and other cultures in real time. It allows them to make sense
of others and situations in various cultural contexts. This real-time input may reveal that the
expectations from the planning phase do not match actual occurrences, thus checking is required
to review assumptions and adjust mental maps. Due to the dynamic nature of CQ, all three sub-
dimensions of Metacognitive CQ are needed to function effectively across cultures, as
individuals with high Metacognitive CQ continuously break down culture-bounded habits and
thinking, and develop appropriate strategies (Earley & Ang, 2003; Van Dyne et al., 2012).
Metacognition is critical to building CQ because “much of what is required in a new culture is

30
putting together patterns into a coherent picture, even if one does not know what this coherent
picture might look like” (Earley & Peterson, 2004, p. 107).
Cognitive CQ. The knowledge about cultural institutions, norms, and practices in
different settings is important, as it shapes decision-making and performance in cross-cultural
interactions (Ang & Van Dyne, 2009). Literature on cultural anthropology (Brown, 1991;
Murdock, 1987) and cross-cultural training (Bhawuk & Brislin, 2000) shaped Earley and Ang’s
(2003) concept of Cognitive CQ. It concerns declarative knowledge, as well as the procedural
knowledge to adapt behavior.
Earley and Ang (2003) defined two types of Cognitive CQ: culture-general and context-
specific knowledge. Knowledge of objective cultural components such as economic, legal,
political, linguistic, social, and religious systems, is considered culture-general, and so is
knowledge of subjective culture norms and values such as gender role expectations,
individualism-collectivism, or uncertainty avoidance (Ang et al., 2007; Hofstede, 2001). Besides
knowledge of norms and practices, another feature of Cognitive CQ is understanding reasoning
and decision-making. Earley and Ang stated that “a fundamental requirement of the
international sojourner is one of data gathering and construction of new social realities” (2003, p.
114). They explained that travelers use all their senses to experience and observe their new
environment and identify or create cognitive and metacognitive strategies to deal with the new
culture. Understanding that people have different approaches to reasoning allows someone to
understand another’s decision-making process, thus “to take the perspective of locals” (Earley &
Ang, 2003, p. 115). For example, a person who operates from a categorical/analytical
orientation needs to be aware that an affective/intuitive-reasoning person has a different basis for
making decisions.

31
While this universal cultural knowledge is needed to make broad comparisons across
cultures from an etic (outsider) perspective, context-specific knowledge provides an emic
(insider) view of a specific domain. This knowledge is needed to understand how culture
universals manifest themselves in a specific geographic area or demographic subgroup (Morris,
Leung, Ames, & Lickel, 1999). Individuals with high Cognitive CQ combine both types of
knowledge to operate effectively in their specific domain (Earley & Ang, 2003).
Motivational CQ. Kanfer and Heggestad (1997) defined motivation as providing
“agentic control of affect, cognition and behavior that facilitate goal achievement” (p. 39).
Motivational CQ is the interest and confidence to focus attention on learning about cultural
differences and effectively navigating in that unfamiliar environment (Ang & Van Dyne, 2009).
Even though culturally diverse settings are marked by additional obstacles that cause uncertainty
and anxiety, existing models of intelligence, even ones focusing on contextually based capacities
such as the Triarchic Model (Sternberg, 1984), the Multiple Intelligence model (Gardner, 1983),
or Emotional Intelligence (Mayer & Salovey, 1993), seemed to overlook “a person’s motivation
to engage the world around them” (Earley & Ang, 2003, p. 124). Some researchers do not
consider motivation a requirement in their conceptualization of CQ, viewing it as an ability to
interact effectively, not a “willingness to behave in a particular way” (Thomas et al., 2015, p.
1101). For Earley and Ang (2003), however, motivation is a key driver of the energy and effort
needed to interact in culturally diverse situations. Their understanding of the differences in
people’s motive was shaped by theories on values (Ajzen, 1991; Rokeach, 1973; Triandis, 1972),
categorization (Tajfel & Turner, 1986), and status (Hughes, 1971; Mulder, 1977). Based on
Ryan and Deci’s (2000) self-determination theory, Bandura’s (2002) social cognitive theory, and
Eccles and Wigfield’s (2002) expectancy-value theory, Earley and Ang further subdivided

32
Motivational CQ into three subdimensions that provide the desire and confidence needed to
interact in challenging situations: intrinsic interest, extrinsic interest, and self-efficacy.
Intrinsic interest allows individuals to recognize the inherent satisfaction of experiencing
diverse cultures and the joy of working with people from different backgrounds (Ryan & Deci,
2000). Van Dyne et al. (2012) explain that “intrinsic benefits of intercultural experience are
important because they are self-generated and not dependent on others or on the situation” (p.
304). Extrinsic interest allows a person to value the tangible benefits they may receive from
culturally diverse experiences (Ryan & Deci, 2000). Though cross-cultural work environments
may be challenging, extrinsic benefits, such as opportunities for promotion or increased
reputation and employability, provide incentives for individuals to persevere through those
difficulties (Van Dyne et al., 2012). Self-efficacy to adjust is the confidence individuals have in
their ability to adjust to new cultures, interact with locals, or work in culturally diverse settings
(Bandura, 1977b, 2002; Eccles & Wigfield, 2002). Combined with intrinsic motivation, this
confidence allows individuals to feel efficacious and choose to engage in activities (Latham &
Locke, 2007). Extrinsic interest provides tangible benefits, intrinsic interest gives personal
satisfaction, and self-efficacy leads to confidence; together these types of motivation allow
individuals to be attracted to intercultural situations and sustain the energy needed to overcome
challenges (Earley & Ang, 2003).
Behavioral CQ. Earley and Ang (2003) defined Behavioral CQ as the ability to
appropriately adapt verbal and nonverbal actions in encounters with people from another culture.
What is considered appropriate in communication varies greatly across cultures. This element of
CQ allows individuals to regulate their behavior to minimize misperceptions in their dealings
with others and is especially important as behavior is visible to others, while thoughts or

33
motivation are not (Van Dyne et al., 2012). Earley and Ang based their concept on the work of
cultural anthropologist Edward Hall, who developed effective cross-cultural training for the
Foreign Service. After using a training method that focused heavily on imparting declarative
knowledge to Foreign Service servicemen, Hall (1959) noticed that this extensive macrocultural
knowledge did not translate into the ability to conduct themselves appropriately in their daily
interactions with locals. This realization caused him to add training in social skills such as
greetings, gestures, or small talk. He referred to this hidden dimension of intercultural
communication in informal settings as “the silent language” in his book by the same name (Hall,
1959). Thus, echoing Hall’s (1959, 1993) view of the importance of this behavioral component,
Earley and Ang (2003) stated:
Culturally intelligent people must at all times be mindful of self-presentation, that is the
impression they make, and how these behaviors can affect how locals perceive them.
Self-presentation therefore represents the sine qua non of the behavioral component of
cultural intelligence. (p. 156)
Though leaving an impression of being socially inept may not be of great consequence on short
trips, expatriates who engage locals on a long-term basis may find themselves ostracized. Earley
and Ang thus likened this handicap of individuals with little concern for self-presentation living
in a foreign culture to the behavioral deficits that people with autism experience in their own
culture. They coined the term cultural autism to describe this similar lack of awareness of
salient cues, the unusual speech patterns, or the absence of connection that affects individuals
with low Behavioral CQ living in unfamiliar cultures.
Earley and Ang’s (2003) concept of Behavioral CQ includes three components: verbal
behavior, nonverbal behavior, and speech acts. Verbal behavior refers to the ability to flex

34
vocalization (i.e., to adapt one’s speed, volume, tone, formality, or inflection) as appropriate to
the other culture. An awareness of when to speak, be silent, or take turns is also part of this sub-
dimension. Nonverbal behavior is the ability to adjust body language, facial expressions,
gestures, and appearance to achieve the desired communication. Various cultures have differing
norms for how much eye contact to use, what distance to maintain, whether to touch while
greeting, or how formally to dress. The subdimension of speech acts relates to an individual’s
flexibility when communicating specific messages. For instance, when issuing invitations,
apologies, disagreement, or gratitude, it is important to know the appropriate timing and the right
words, but also how directly or forcefully to proceed within a given culture. Human behavior
tends to rely on habits, but individuals with high Behavioral CQ are able to adjust their behavior
to the cultural context. The nuanced understanding of and respect for differing norms required to
interact effectively in intercultural encounters demands a complex flexibility in all three sub-
dimensions of Behavioral CQ (Van Dyne et al., 2012).
Alternate terminology. According to Earley and Ang’s (2003) conceptualization of
Cultural Intelligence, metacognition and cognition are considered the mental dimension of CQ
that is complemented by the motivational and behavioral dimensions; the four individual facets
are distinct but linked components of CQ. Other researchers have described the same concepts
using different terms. Egan and Bendick (2008) summarized the concepts as “using the head
(cognitive and metacognitive); heart (motivation); and body (behavioral)” (p. 391). Livermore
(2015) used the terms CQ Knowledge, Strategy, Drive, and Action to refer to the same four
factors and stressed that the capabilities are interrelated, with all four needed to be effective in
cross-cultural interactions. For example, it is irrelevant in practical terms that individuals know

35
how to relate across cultures if they have no desire to do so, or that they can analyze a situation if
they cannot solve the problem.
Earley and Ang’s (2003) theory of Cultural Intelligence thus organized and integrated
disparate prior research on intercultural competencies into one cohesive framework (Ng et al.,
2012). The later addition of the Cultural Intelligence Scale (Ang et al., 2007) provided a
validated instrument to study the construct. The ensuing rapid growth in research in the field led
to new insights into this malleable trait and how to raise CQ and improve adaptation to foreign
environments (Ng et al., 2012). This research provided a basis for a more refined theoretical
conceptualization with more focus on the subdimensions and the development of the Expanded
Cultural Intelligence Scale (E-CQS) that measures those subdimensions (Van Dyne et al., 2012).
Learning Theories
Earley and Ang (2003) defined Cultural Intelligence as a malleable trait which can be
increased through life experiences and cross-cultural training. In order to be successful in their
cross-cultural encounters, individuals have to learn from their experiences and implement change
in their social interactions. Therefore, Earley and Ang identified the concepts of social,
bioecological, and experiential learning as relevant learning theories.
Bandura’s social learning theory. Bandura (1977b) investigated how people’s social
experiences influence their behavior and development. He theorized that children observe
individuals around them and attempt to imitate some of them (models). Based on the
reinforcement or punishment children receive, whether externally or internally, they adopt their
models’ behaviors, values, or attitudes. Unlike behaviorists who believed that behavior can be
reduced to the association between stimulus and response (Watson, 1928), Bandura saw a
reciprocal interaction between environment, cognition, and behavior. His theory considered the

36
effect of attention, memory, and motivation on learning. Bandura (1977a) also proposed that
self-efficacy could influence both social learning and the development of cultural competence.
The functional value of self-efficacy is that it allows an individual to adapt and relate to others in
intercultural settings (Bandura, 2002). Earley and Ang (2003) and Earley and Peterson (2004)
extended that thought to suggest that self-efficacy also is an antecedent to the development of
CQ. This assertion was sustained by MacNab and Worthley’s (2012) study that indicated that
participants’ general self-efficacy was significantly related to learning Cultural Intelligence.
Earley and Ang’s research indicated that any training to develop CQ needed to go beyond mere
cognitive training that imparts the necessary declarative and procedural knowledge. In order to
encompass the metacognitive, motivational, and behavioral aspects of cross-cultural interactions,
CQ training needs to incorporate elements of social learning and self-efficacy (Bandura, 1977a,
1977b), as well as experiential learning (D. A. Kolb, 1984).
Kolb’s experiential learning theory (ELT). Research on the effect of CQ on cross-
cultural success is particularly prominent in the business world, thus business educators have
integrated the CQ model into their traditional curriculum (MacNab & Worthley, 2012). Drawing
his theory of ELT from John Dewey’s (1938) work which stresses the importance of linking
observation and action, Kolb (1984) described it as “the process whereby knowledge is created
through the transformation of experience” (p. 41). In Kolb’s ELT model, the learner effectively
transforms experience into learning by experiencing, reflecting, thinking, and acting (A. Y. Kolb
& Kolb, 2005; D. A. Kolb, 1984).
Some empirical evidence supports the position that life experiences have an influence on
Cultural Intelligence (Chao, Takeuchi, & Farh, 2017; MacNab & Worthley, 2012; Ng, Van
Dyne, & Ang, 2009). Ng et al. (2009) proposed a model that views Cultural Intelligence as a

37
moderator that allows international leaders to engage the four stages of experiential learning
(experience, reflect, conceptualize, and experiment) to turn international work assignments into
learning outcomes. They view CQ as learning capabilities whose motivational and behavioral
components enhance an individual’s ability to translate international experiences into learning.
As supplements to didactic programs, experiential approaches through intensive cultural
experiences have become increasingly important to the development of global leaders, since 80%
of global leaders surveyed indicated that living and working in other countries was the most
significant contributor to their leadership capabilities (Gregersen, Morrison, & Black, 1998).
More importantly from a business perspective, research showed that companies do better
financially when run by a CEO with international experience (Carpenter, Sanders, & Gregersen,
2001; Daily, Certo, & Dalton, 2000; Sambharya, 1996). Ng et al. (2009) view ELT as
particularly relevant to learning from complex international experiences because it is a holistic
and continuous “process of adapting to the world that requires the integrated functioning of the
total person, which includes thinking, feeling, perceiving, and behaving, as well as interactions
between the person and the environment” (p. 513).
Bronfenbrenner and Ceci’s bioecological theory. Earley and Ang (2003) used insights
form this bioecological theory to define Cultural Intelligence. Inspired by Vygotsky’s research
(1978) on how humans learn in social contexts and how the social environment affects learning,
Bronfenbrenner and Ceci (1994) centered their bioecological model on understanding human
development (both in children and adults) based on the interaction between the person and
environment. There are three tenets of the bioecological theory that Earley and Ang used as a
framework for CQ: (1) individuals have multiple innate capabilities; (2) interactions with various
ecological contexts determine how these capabilities develop; and (3) the extent of this

38
development is affected by motivation (Bronfenbrenner & Ceci, 1994). Based on these tenets,
Earley and Ang conceptualized CQ as a malleable form of intelligence developed through
exposure to different cultural contexts, a process in which Motivational CQ plays a crucial role
(Ang, Van Dyne, et al., 2015).
Related Literature
To establish the need for this study, it is necessary to investigate beyond the
conceptualized view of CQ and look at its manifestation in education and the workforce.
Globalization has emerged as a key concept in the business field, as companies seek to improve
profitability by extending their presence across their continent or even the world. People
working in multinational corporations expect to have dealings across borders, but nowadays,
even small-sized businesses have to interact with employees, suppliers, customers, or
competitors from other cultures (Crowne, 2008). Research has established that people with a
high level of Cultural Intelligence are better at transformational leadership (Alon & Higgins,
2005; Ang et al., 2006; Earley & Ang, 2003) but just 15 years ago 85% of Fortune 500
companies stated they had an inadequate number of effective global managers (Manning, 2003).
Since the role of education is to prepare students for the workforce, it is important to examine
how higher education can equip students for a globalized world. Faculty are important
contributors to the development of CQ in students (Goh, 2012). It is thus important to gather
information to assess the CQ level of faculty and determine if differences among them are
random or whether some faculty are better equipped to train their students in CQ based on their
common life experiences or the training they received to become subject matter experts.

39
What Is Globalization?
Though the New York Times mistakenly credited Theodore Levitt with coining the term
globalization in the obituary they printed upon his death in 2006, the term has been in use since
the 1930s, long before Levitt helped popularize its use to describe a process that was changing
the world in fundamental ways (James & Steger, 2014). McGrew (1992) defined globalization
as the significant impact that events and decisions occurring in one part of the world have on
communities in other parts of the world. Advances in technology have allowed new contacts
among people, corporations, and governments, affecting not just what they do, but how they see
themselves, and what they want (Woods, 1998). Friedman (2000) compared the new system of
globalization with the Cold War system in the sense that it “has its own rules and logic that today
directly or indirectly influence the politics, environment, geopolitics and economics of virtually
every country in the world” (p. ix). Nowadays, employers do not care simply about job
applicants’ professional qualifications, but want to know about their international credentials as
well (Berdan, 2012). Holmes and O’Neill phrased it well: “As people become citizens of the
world for the purpose of work, education, and business, they are required to span boundaries of
language, ethnicity, and nationality” (2012, p. 707). Colleges need to prepare students for this
globalized market.
Antecedents of Cultural Intelligence
Based on the research on intelligence that integrates findings in psychology and
sociology, CQ is viewed as a learned capability (Livermore, 2015). Interestingly, there has been
more interest in researching the outcomes of CQ rather than its antecedents (Ott & Michailova,
2016). It is theorized that Cultural Intelligence develops naturally through the experience of
other cultures or through educational interventions (Earley & Ang, 2003; Thomas et al., 2008).

40
Some researchers have shown a connection between CQ and personality traits (MacNab &
Worthley, 2012), and others with cross-cultural and experiential training (Lenartowicz, Johnson,
& Konopaske, 2014), while some highlight differences between the effect of international
experience in work and nonwork situation on CQ (Lee & Sukoco, 2010; Lee, Veasna, & Sukoco,
2014; Tarique & Takeuchi, 2008). A few studies attempted to identify a difference in CQ
between males and females, but no reliable data point to a difference based on gender.
Because CQ is such desirable attribute among business professionals, Barakat, Lorenz,
Ramsey, and Cretoiu (2015) used the Business Cultural Intelligence Quotient (Alon, Boulanger,
Myers, & Taras, 2016), a new measure developed specially to evaluate the importance of
specific antecedents of CQ to business professionals across five countries.
Personality traits. Traits and states have long been the object of psychological research
trying to explain individual differences. Personality traits are considered to be the enduring and
stable disposition of a person regardless of the situation or context (Allport & Odbert, 1936).
Though different terms have been used, the Big Five personality traits are now commonly
referred to as Openness, Conscientiousness, Extraversion, Agreeableness, and Neuroticism
(McCrae & Costa, 1999). States, on the other hand, are a reflection of a person’s adaptation to
specific situations and are thus responsible for temporary emotional changes (Hamaker,
Nesselroade, & Molenaar, 2007).
Digman (1990), summarizing research findings at the time on the five-factor model of
personality structure, concluded that personality traits are genetically determined and stable
through adulthood, and account for most of the variability between people. Yet, he also
wondered what could explain the remaining variance. Conceptually, an individual’s trait score
would represent a mean over time removed from situational influences. Yet, “when individuals

41
are measured at a given occasion it is likely that variation in both trait and state contribute to the
variation in observed behavior” (Hamaker et al., 2007). Traits and states are thus often
confounded, which makes disentangling their effect on variances in behavior challenging.
Ang et al.’s (2006) meta-analytic review indicated that Big Five predicted job-related
outcomes, but there was no meaningful research to indicate that personality traits predict how
individuals adapt to a foreign environment. Unlike stable personality traits, though, CQ is
considered malleable, thus the two are conceptually different (Earley & Ang, 2003). As
personality traits affect an individual’s experience of and behavior in a given situation, some
aspects of personality may, however, have an impact on the development of CQ. Ang et al.’s
research indicated, for example, that the trait of high consciousness of people who value
planning and order is positively related to Metacognitive CQ, while agreeableness is related to
Behavioral CQ, and extraversion to Cognitive, Motivational, and Behavioral CQ. Their research
further showed that the personality trait openness to experience, which makes a person
adventurous, imaginative, and creative (Costa & McCrae, 1992), has a positive effect on all four
factors of CQ. Data to determine the second most important predictor of CQ is split, with one
study pointing at extraversion (Şahin, Gürbüz, Köksal, & Ercan, 2013) and another at
conscientiousness (Ang et al., 2007). Though Ang et al. (2006) found predictive value in
personality traits when they examined the connection between personality and CQ, they also
demonstrated the discriminant validity of the four-factor structure of CQ from the Big Five
personality traits.
International experience and cultural exposure. International experience is another
important antecedent to CQ, though research shows differences between work versus nonwork
experiences (Takeuchi, Tesluk, Yun, & Lepak, 2005). Shannon and Begley (2008) assessed the

42
number of countries individuals worked in and determined that international work experience
predicts Metacognitive and Motivational CQ, while Crowne (2008) determined it predicts all but
Motivational CQ. Li and Mobley (2010) also found that learning styles have a moderating effect
on the relationship between CQ and international experience, as the relationship was stronger for
individuals with divergent learning styles. Since much of the focus on expatriate adjustment is
driven by business needs to improve the effectiveness of their workers, most of the research
studied work experience as antecedents of CQ (Ng et al., 2009).
Of particular interest to this study, which is focused on improving student CQ, were
Crowne’s (2008, 2013) studies which measured the impact of cultural exposure on students. She
investigated differences in CQ based on the breadth, depth, and type of experience individuals
encountered. Not surprisingly, the data indicate that individuals who had been abroad for work
or education had higher levels of CQ than those who had not. Mere vacationing abroad did not
seem to increase CQ levels. The data also revealed that the more countries international
sojourners visited and the more engaged they were in the local culture, the higher their CQ levels
were, indicating that breadth and depth of experience also matters.
Koo Moon, Choi, and Jung (2012) found that international nonwork experience, more so
than work experience, predicted CQ. Wood and St. Peters (2014), however, determined that
short-term cross-cultural study tours improved the Metacognitive, Cognitive, and Motivational
CQ, but not the Behavioral CQ of working professionals in an MBA program during an
experientially oriented tour, even though they were only 11-12 days in length. Alon et al. (2018)
determined that mid- to long-term work experiences achieved higher CQ levels. An international
experience program designed with experiential learning showed that participants’ time of

43
interaction with people of different cultures predicted the increase in their CQ level, showing the
value of pretrip training (MacNab, Brislin, & Worthley, 2012).
Other antecedents of CQ. As indicated above, the antecedents of CQ have received
little attention as opposed to its outcomes. Ang, Rockstuhl, and Tan (2015) stated, “Besides
personality traits and international experiences, few antecedents of Cultural Intelligence have
been studied. Exceptions include foreign language skills and global identity – both of which
relate positively to cultural intelligence” (p. 436). Though foreign language skills may seem a
logical antecedent of CQ, they cannot be claimed as a nomologic element of CQ. Regrettably,
the authors did not cite the sources for their claim and none of the seminal research on CQ
contained data on the effect of languages on CQ. An additional search of databases combining
the terms “cultural intelligence” and “foreign language” revealed no publications on the topic.
Confounding Variables and Boundary Conditions
In light of the lack of research on antecedents of CQ, it is not surprising that little
information is to be found in existing empirical studies to identify confounding variables either.
Age, gender, country of origin, education level, and contextual factors occasionally appeared in
some literature, but not all may be a concern in every study.
Absence of gender differences. Some research has been conducted on the difference of
CQ levels between gender, but findings were contradictory as Nasiri and Ghadiri (2016) found
no statistically significant difference between males and females, while Azizi, Fatemi,
Pishghadam, and Ghapanchi (2015) concluded that males had significantly higher levels of CQ.
Both studies, however, were conducted in Iran where gender differences cannot be generalized to
a Western society. Additionally, in light of Earley and Ang’s (2003) concept of how an
individual’s CQ level is shaped through exposure to and education about other cultures and

44
moderated by personality traits, the gender differences Azizi et al. (2015) found would most
likely be due to the tremendous differences in education and life experiences between men and
women in Iran, rather than due to gender. Azizi et al.’s findings echoed Engle and Nehrt’s
(2012), which indicated there was no gender difference among their respondents.
Age. Engle and Nehrt (2012) recommend further research on the topic of age as they
uncovered an interesting dichotomy in the results. Their data indicate that the older participants
had higher levels of CQ than the younger ones. This can be expected since increased age allows
for greater experience and more potential exposure to cross-cultural interactions. Surprisingly,
however, they found that the lowest scores overall were found in the older group, and some of
the highest scores in the younger group.
Country of origin. In a study comparing the CQ level of students in France and in the
United States, Engle and Nehrt (2012) found that the French students had higher levels of CQ.
They attributed this to the fact that the French respondents had a higher likelihood of having
traveled abroad or been in contact with people of other cultures visiting France than their
American counterparts.
Education level. The interpretation of test scores in cross-cultural studies is always
concerned with bias and equivalence, thus Van de Vijver and Tanzer (2004) reviewed some
potential issues. They pointed out that differing education levels could affect test results from
different cultures. As CQ has a strong cognitive component, a higher education level could
indeed equate to more knowledge of other cultures. This concern is validated by Heckman and
Kautz’s (2012) findings that higher levels of education may lead to greater interest in learning
about other people and cultures. This study, however, tested the CQ level of college faculty who

45
all must have a master’s degree at the very least. The educational gap is rather limited, thus not
likely to be a confounding factor in this study.
Boundary conditions. Inconsistent research results about the effect of international
experience on CQ have increased attention to boundary conditions that may strengthen or
weaken the effect, such as the individual’s character traits, self-efficacy, belonging to majority
rather than minority group, cultural capital received from parents, or whether it was their first or
subsequent experience (Ang, Rockstuhl, et al., 2015). Subsidiary support and cultural distance
of the home country from the host country were found to weaken the effect of Motivational CQ
on work adjustment (G. Chen, Kirkman, Kim, Farh, & Tangirala, 2010).
The main goal of this study was to determine if there are any significant differences in the
CQ level of faculty between academic units. These confounding variables are relevant to the
goal of determining which faculty groups ought to receive CQ training. Beyond determining the
existence of differences between units, however, looking deeper at existing patterns may allow
some additional insight into some of these open questions regarding antecedents. Thus, the
questionnaire for this study included questions related to participants’ demographics and
background to see if some of the prior findings are supported.
Benefits of Higher CQ in the Workforce
Thanks to modern transportation and communication, the world is becoming more
interconnected and college graduates in many fields can expect to travel or even live abroad for
business, pleasure, or mission work. Research conducted on behalf of the Association of
American Colleges and Universities among employers showed that 65% of business executives
and 73% of hiring managers rated the ability to solve problems with people of different
backgrounds as a very important quality among graduates, yet only 36% and 43% respectively
46
rated recent graduates as well prepared for the task (Hart Research Associates, 2018). Clearly,
these future employees need to be prepared to engage people of other cultures effectively, and
CQ was shown to have a positive impact on cultural decision-making and judgment (Ang et al.,
2007). Research also indicated that CQ is linked to job performance (Barakat et al., 2015),
success in complex cultural situations for members of the Armed Forces (Davis, 2009; Rockstuhl
et al., 2011) and in international business (Alon & Higgins, 2005; Earley & Ang, 2003; Imai &
Gelfand, 2010; Livermore, 2015), reduces stress for international travelers (Ramsey, Leonel, &
Gomes, 2011), promotes transformational leadership (Ansari, Radmehr, & Shalikar, 2012), and
affects adaptation to and task performance in diverse settings (Cho & Morris, 2015; Jyoti &
Kour, 2015; Konanahalli et al., 2014). The research on the effect of CQ delves mostly into its
psychological or performance outcomes.
Psychological outcomes of CQ. Much of the research on the psychological impact of
living abroad focuses on the key outcome of cultural adjustment. This category is further
subdivided into general adjustment to living conditions in a new culture, work adjustment, and
interaction adjustment to interacting with the locals (Ng et al., 2012). Multiple studies
demonstrated the impact of Motivational and Behavioral CQ on cultural adjustments (Ang et al.,
2007; Templer, Tay, & Chandrasekar, 2006; Williams, 2008). In a more recent study to look at
boundary conditions that may strengthen or weaken the effect of CQ, G. Chen et al. (2010)
determined that the Motivational CQ of expatriates had a stronger effect on their work
adjustment when the there was a greater distance in culture as well as subsidiary support from
their location. This consideration indicates the need to further investigate factors that can have a
moderating effect on the benefit of CQ for cultural adjustment.

47
Emotional exhaustion is another psychological outcome of interest for international firms
because it can interfere with employees’ work. Several studies revealed that higher CQ levels
led to lower levels of emotional exhaustion in international business travelers (Tay, Rossi, &
Westman, 2010; Tay, Westman, & Chia, 2008). Finally, interpersonal trust was found to be
higher when the focal person had higher Metacognitive and Cognitive CQ and the partner had
higher Behavioral CQ (Chua & Morris, 2009; Rockstuhl & Ng, 2008). Additionally, these
studies confirmed that CQ only affects interpersonal trust when the individuals involved come
from culturally different backgrounds, not when they belong to homogenous groups.
Performance outcomes of CQ. The effects of CQ on individual-level outcomes have
been documented in various studies and indicate a distinction between general job performance,
such as tasks and adaptive performance, and performance in specific domains, such as leadership
or negotiation (Ng et al., 2012). Ang et al. (2007) were able to tie higher Metacognitive and
Behavioral CQ in foreign professionals with higher performance ratings by their supervisors,
while G. Chen et al. (2010) found expatriates’ job performance to be positively affected by
Motivational CQ. Contextual factors, however, are important to consider as G. Chen et al.
showed that levels of subsidiary support and cultural distance had an indirect effect on how
much Motivational CQ affected performance. X. P. Chen, Liu, and Portnoy (2011) determined
that real estate agents with higher Motivational CQ also achieved higher sales rates in
transactions with customers from another culture. Global leadership is also positively affected
by CQ with studies indicating that CQ increased the effect of leadership on innovation (K.
Groves & Feyerherm, 2011) and improved cross-border leadership effectiveness in Swiss
military leaders (Rockstuhl et al., 2011).

48
The importance of CQ in the tourism industry has also recently received some attention.
This is not surprising considering that an integral part of working in tourism is the
communication with customers from all parts of the world. To study the link between worker
CQ and customer satisfaction in the hospitality industry in India, Arora and Rohmetra (2010)
first validated the Cultural Intelligence Scale (CQS) in this industry and the Indian setting. Their
data indicate that the CQ level of employees in the hospitality industry had a positive influence
on their productivity, as well as on the satisfaction level of customers. Looking at the opposite
end of the interaction, Frías-Jamilena, Sabiote-Ortiz, Martín-Santana, and Beerli-Palacio (2018)
investigated the CQ of tourists. Their study revealed that the prior experiences of tourists in a
destination country had an impact on their CQ, which in turn influenced the perceived value of
the destination. These studies addressed both psychological and performance outcomes.
Criticism of CQ
CQ’s current prominence in the business world has prompted some criticism. Blasco,
Feldt, and Jakobsen (2012) claim that CQ has not been tested enough to be considered more than
a hypothesis. They challenge the established CQ approach which aims to regulate behaviors in
order to avoid cultural failures or conflicts, arguing instead that individuals can reflect on those
failures and learn from them. They also express concern that CQ could not easily be adapted to
effective cultural training for business. Their article, however, was not empirical but merely a
discussion to raise questions to be addressed on CQ. Crowne (2009) states that CQ is
interrelated with both social intelligence and emotional intelligence and should not be viewed in
isolation. Therefore, she urges researchers to study the three constructs together. Her article,
however, was theoretical and her findings would need to be confirmed through empirical
research.
49
In their review of CQ research, Ott and Michailova (2016) point out the still existing
theoretical gaps regarding CQ. They noted that research into CQ started with a number of
conceptual papers and a few empirical papers, followed by a phase with increased focus on
empirical research. Based on this newly gained knowledge, they feel a return to theoretical
development of CQ would have been warranted but has not occurred. For example, there is still
little theory to explain why CQ should influence the adjustment, performance, or outcomes for
expatriates (Ott & Michailova, 2016).
Some recent studies that focus more on the measurement of CQ aimed to replicate Ang et
al.’s (2007) testing of the CQS. Bücker, Furrer, and Lin (2015) and Bücker, Furrer, and Peeters
Weem (2016) took issue with Ang and Van Dyne’s (2009) claim that “the four-dimensional
structure is clear, robust, meaningful, and stable across samples, time, and countries” (Bücker et
al., 2015, p. 262). Their article points out that the studies to validate the CQS were conducted
with participants who had limited international exposure. Thus, they attempted to confirm the
external validity of the scale by administering it to a different demographic group with more
extensive international experience. Their findings led them to conclude that a two-dimensional
model may be more appropriate than the CQS’ current four-factor model because of concerns
about the discriminant validity of the four factors. Since Bücker et al.’s (2015, 2016) research is
quite recent and not replicated, whereas Van Dyne et al. (2012) used confirmatory factor analysis
to demonstrate discriminant validity of the subdimensions within each of the four CQ factors,
this study used Ang et al.’s (2007) four-factor scale that has been the instrument in numerous
studies (Ang et al., 2006; A. S. Chen, Lin, & Sawangpattanakul, 2011; Ghonsooly & Shalchy,
2013; Ghonsooly, Sharififar, Sistani, & Ghahari, 2013; Khodadady & Yazdi, 2014; Kurpis &

50
Hunter, 2017; Lee & Sukoco, 2010; MacNab & Worthley, 2012; Rafieyan, Golerazeghi, &
Orang, 2015; Rockstuhl et al., 2011).
The Role of Colleges in Developing CQ
Nowadays, K-12 teacher training programs include pedagogy to prepare future teachers
to engage the diverse classroom (Banks, 2008; Fehr & Agnello, 2012; Gay, 2000). At the
college level, however, there has been a significant decline in instructors that have previous high
school teaching experience. As a result, most professors are subject matter experts but not
trained educators and may thus lack formal education in cultural differences (Elliott, 2014).
Now more than ever, college faculty also need to be culturally competent. First, they need to be
able to connect with their diverse students who may come from all over the world to get a
college degree in the United States. The Institute of International Education (2016), which tracks
international student enrollment trends with support from the U.S. Department of State, reports
that the number of international students has multiplied 30-fold, rising from 33,833 in 1953/54 to
1,043,839 in 2015/16 (see Figure 1). Between 2006 and 2014 alone, the United States
experienced a 56% increase in the number of international college students. This 30.5 million
dollar influx into the U.S. economy (Institute of International Education, 2016) certainly
provides an incentive, in addition to the diversification of the classroom, to prepare faculty to
provide a welcoming learning environment for students from other countries and cultures.

51
Beyond being able to connect with an increasingly diverse student body, college faculty
also need to develop the Cultural Intelligence of their domestic student to prepare them for the
workforce. To this end they need to provide students repeated opportunities to think and interact
cross-culturally (Billings, 2006; Crowne, 2008; Egan & Bendick, 2008; Karnyshev & Kostin,
2010; Lopes-Murphy, 2014; Lovvorn & Chen, 2011; MacNab, 2012; McCrea & Yin, 2012;
West, 2012; William & Nagy, 2012). Colleges can expose their students to such experiences
through study or mission trips abroad which have been shown to raise CQ levels (Crowne, 2008;
Haygood, 2016; Hechanova-Alampay, Beehr, Christiansen, & Van Horn, 2002; Tarique &
Takeuchi, 2008; Ward & Kennedy, 1993), but little is known about the lasting impact of such
trips. Thus, even before entering the workforce, students need to be prepared to interact with
people of other cultures to be successful in the increasing number of study-abroad experiences.
Just like the number of international students, the number of U.S. students studying abroad has
Figure 1. Increase in international students in the United States between 1953 and 2016.
Adapted with permission from "International Student Enrollment Trends, 1948/49-2015/16" by
The Institute of International Education, 2016, Open Doors Report on International Educational
Exchange, retrieved from http://www.iie.org/opendoors. Copyright 2017 by Open Doors.

52
increased drastically, rising from under 70,000 in 1989/90 to over 313,000 in 2014 (see Figure
2).
The literature on what contributes to Cultural Intelligence in postsecondary education is
limited, with research on CQ emanating mostly from the business field (Crowne, 2008; Egan &
Bendick, 2008; Lovvorn & Chen, 2011; McCrea & Yin, 2012). Cultural Intelligence is
considered to be malleable (Earley & Ang, 2003) and therefore the purview of postsecondary
education when preparing students for the workforce. Yet, data from just 10 years ago showed
basic standards for global preparedness were met by fewer than 10% of college graduates
(NLCLEAP, 2007). To emphasize the importance of this concern, Griffith et al. (2016) state, “If
higher education institutions are to remain relevant, they must take charge of their
internationalization and produce graduates who will excel in the global work arena” (p. 2). To
show how globally minded they are, universities often promote academic programs such as study
abroad or international internships, or humanitarian trips such as volunteering opportunities or
mission trips. These universities have made diversity learning a priority and developed plans to
Figure 2. Increase in U.S. students studying abroad between 1989 and 2015. Adapted with
permission from "International Student Enrollment Trends, 1948/49-2015/16" by The
Institute of International Education, 2016, Open Doors Report on International Educational
Exchange, retrieved from http://www.iie.org/opendoors. Copyright 2017 by Open Doors.

53
improve intercultural awareness and communication (Dezure, Lattuca, Huggett, Smith, &
Conrad, 2014). Some studies show the benefit of such experiences (Black & Duhon, 2006;
Gullekson, Tucker, Coombs, & Wright, 2011; Haygood, 2016) while others point to their
limitations (Lanz, 2000; Sherriff et al., 2012; Simonelli, 2000). Crowne (2008) noted the limited
influence that mere vacationing abroad has when compared to extended living abroad for work
or study. Though living abroad has the potential to improve CQ, participants should already
have a certain level of Cultural Intelligence to avoid potentially embarrassing or even dangerous
situations (Livermore, 2015).
Through trips abroad. Educational trips abroad are positively correlated with Cognitive
CQ. More trips, for either educational or professional purposes, lead to higher Cognitive CQ
(Crowne, 2008, 2013; Engle & Crowne, 2014), but Crowne also points out the need for
additional study to determine how training in the target country compares to training received in
the home country. Also, not surprisingly, the length of stay in country is correlated to
Metacognitive and Cognitive CQ (Tarique & Takeuchi, 2008). Some aspects of study-abroad
trips have been researched, such as adjustment (Hechanova-Alampay et al., 2002; Ward &
Kennedy, 1993), intercultural adjustment based on personality traits (Savicki, Downing-
Burnette, Heller, Binder, & Sutinger, 2004), or short-term mission trips (Haygood, 2016), but not
their lasting impact or the best training practices to prepare for them.
As many colleges encourage students to participate in foreign immersion programs,
Lokkesmoe, Kuchinke, and Ardichvili (2016) decided to investigate the efficacy of such
programs in increasing cross-cultural awareness. They concluded that “cross-cultural
development requires carefully designed interventions, feedback and mentoring/coaching.
Simply sending individuals on overseas assignments, no matter how well prepared and supported

54
by the institution, does not guarantee the development of multi-cultural attitudes and cognitive
frames of mind” (Lokkesmoe et al., 2016, p. 155). Engle conducted several studies on the topic
of short-term international trips. One study suggested that Cultural Intelligence can be
developed significantly even on short-term international trips (Engle & Crowne, 2014). An
important question that emanated from that study was whether the country to which individuals
travel makes a difference in the development of CQ. The American Institute for Foreign Studies
(2013) indicates that 57% of U.S. students reported traveling to English-speaking countries. It is,
therefore, relevant to determine if traveling to a country that is significantly different from one’s
native country provides greater opportunity to improve one’s CQ. Thus, Engle (Engle & Nash,
2016) followed up with a study investigating whether there were differences between U.S.
citizens who traveled to English-speaking countries and those who went to countries that are not
part of the Anglo cultural cluster. Results suggested that individuals in the non-Anglo cultural
cluster group experienced greater CQ development in all four components of CQ than those who
traveled to an Anglo cultural cluster (Engle & Nash, 2016).
In the classroom. Though trips abroad are important to developing CQ, it is not an
option for many students, due to time and financial constraints. Even for students who can
travel, research has shown that their CQ level in the adjustment phase (i.e., going into the trip)
was correlated to their post-study-abroad tests (Crowne, 2008, 2013; Harrison & Brower, 2011;
Nguyen, 2010). Earley & Peterson (2004) stated that CQ can be improved through cultural
training and not just international experiences. Thus, it is essential to investigate how colleges
can improve CQ for all students through the daily interactions in the classroom.
Lopes-Murphy (2014) conducted a review of literature to identify experiences that have a
demonstrated impact on CQ in the classroom. Cognitive CQ can be enhanced through

55
pedagogies, such as classroom discussions and instructional materials that promote awareness
and knowledge of cultural differences, while Metacognitive CQ benefits from face-to-face
cultural interactions (McCrea & Yin, 2012). Metacognitive CQ can be improved through
mindfulness training which is defined as “reflectively paying attention through monitoring
personal feelings, thoughts, and actions” (Tuleja, 2014, p. 7). This training in mindfulness,
called reflective practice in the field of education, should take place as part of the regular
curriculum but in a purposeful and intentional manner, through lectures and discussions. Kurpis
and Hunter’s (2017) study showed the benefits of an experiential learning theory (ELT) activity
pairing marketing students with foreign English as a Second Language (ESL) students.
Activities that make students reflect on their encounters and modify their behavior accordingly
are also beneficial. These activities can include place-based education that incorporates local
history, culture, and people, or interviews with individuals who speak another language
(Lovvorn & Chen, 2011; MacNab, 2012; William & Nagy, 2012). Reflection and group
discussions after the encounters are an integral part of the process (McCrea & Yin, 2012).
Including personal experiences of the teacher and the students, student involvement in
community-based activities, and abundant contact with individuals from different cultures are
strategies that have shown to increase Motivational CQ (Billings, 2006). Classroom projects that
focus on cultural differences can encourage students to further investigate cultural diversity
(Egan & Bendick, 2008). Behavioral CQ can be developed through classroom-staged activities,
such as role modeling, that encourage students to reflect on whether their verbal and nonverbal
behavior was appropriate when interacting with other cultures (Lopes-Murphy, 2014).
Though Dezure et al. (2014) highlighted the need to improve CQ in college students,
there is limited research to confirm which teaching practices are effective. Lopes-Murphy

56
(2014) provided a number of promising recommendations on how to interweave practices to
promote CQ into postsecondary experiences. Due to the importance of CQ for the future
workforce, the focus is on how to infuse this intentional teaching toward CQ (Egan & Bendick,
2008) across all disciplines, because single cross-cultural experiences are not effective (Crowne,
2008; Lopes-Murphy, 2014; Lovvorn & Chen, 2011; Tuleja, 2014), nor should they be limited to
some disciplines (Karnyshev & Kostin, 2010; West, 2012).
Faculty Development
Faculty development in higher education has evolved over the years to address different
challenges in an attempt to “forestall faculty obsolescence” (Camblin & Steger, 2000, p. 1).
McKee and Tew (2013) defined faculty development as “an intentional set of educational
activities designed to equip faculty to grow in their professionalism with the result of being
partners in advancing all segments of the institution” (p. 13). While it is still an ongoing and
systematic process, it has shifted from assisting faculty in advancing their subject matter mastery
to emphasizing teaching and increasing student learning (Elliott, 2014). Increased legislative
attention on institutions of higher education has contributed to a new focus on accountability for
student learning outcomes. Combined with a decrease in the number of college faculty equipped
with teacher training and prior experience teaching at the high school level (Cohen, Brawer, &
Kisker, 2013), this attention has prompted faculty development professionals to provide teachers
the “tools necessary to meeting the learning needs of their students” (Murray, 2002, p. 51). The
results of Dar et al.’s (2016) study indicated a positive relationship between faculty training and
performance, and ultimately the performance of the university overall.
There are several reasons to develop the cultural competency of faculty. University
campuses, following the pattern of K-12 schools, are becoming increasingly diverse, but the

57
faculty is rarely as ethnically diverse as the student body (Broido, 2004). Thus, many institutions
seek to help their predominantly white faculty develop the cultural competency needed to relate
to their diverse students (Torres, Howard-Hamilton, & Cooper, 2003). Due to the lack of
successful models to improve cultural competency in faculty (Gurin, Dey, Hurtado, & Gurin,
2002; Pottshoff, Dinsmore, & Moore, 2001), Taylor et al. (2013) developed a pilot model to
achieve that goal. Their model was designed for a Christian institution and, thus, was mindful to
blend not only the cognitive and affective, but also the spiritual dimension.
Cultural competency, however, is often too narrowly defined in terms of racial or gender
diversity within this country (McNeil & Pozzi, 2011) to suit the purpose of this study. When CQ
is mentioned in the context of professional development research, it usually aims to sensitize
teachers dealing with their increasingly culturally and linguistically diverse student population
(G. Li, 2013). As this study took place at a faith-based university that seeks to equip students in
all majors to be effective Christian ambassadors in all the world, it was important to keep not
only the aforementioned spiritual component in mind, but also the broader view of CQ in terms
of worldwide cross-cultural interactions, not just diversity within the country.
Griffer and Perlis (2007) stated that “the development of cultural intelligence begins with
a study of self” (p. 29) and recommended faculty training begin with such a study of self. Each
institution should gather data to be able to determine the CQ makeup of its faculty since students
need to be exposed to CQ training in all their courses. Thus, it is imperative that all faculty be
proficient in CQ, not just in their subject matter. This is an important step in allowing faculty
development professionals to make informed decisions on how to equip faculty to fulfill their
integral role in developing students’ CQ (Goh, 2012; Lopes-Murphy, 2014).
58
Differences in Cross-Cultural Thinking and Interactions among Disciplines
Before professors became experts in their subjects, they were students of the subject. No
study has been conducted to determine whether there is a difference in CQ levels among faculty
and whether potential differences are merely a reflection of individual variations or related to the
discipline they teach. It is, therefore, necessary to examine from a theoretical perspective how
some subjects are learned. As Earley and Ang (2003) stated that an individual’s interests, goals,
and learning history affect the development of their CQ, faculty in foreign languages, for
instance, due to their consistent exposure to the cross-cultural thinking and interactions, could
potentially share similar levels of CQ. Examining the components required to excel in a
discipline allows some preliminary inferences about faculty CQ level.
Cross-cultural thinking and interactions in foreign languages. More than half of
baccalaureate-granting institutions in the United States require courses in a language other than
English for graduation (Geisler et al., 2007). Students often rate their foreign language courses
as the most difficult subjects (Onwuegbuzie, Bailey, & Daley, 2000). Every foreign language
teacher can attest that achievement varies greatly between students and there is extensive
research over the past three decades to identify factors that contribute to or hinder learning.
Traditional predictors of academic success seem to be only moderate predictors of success in
foreign language learning (Cochran, McCallum, & Bell, 2010). Students who do so well in
learning a foreign language that they decide to become subject matter experts in it and obtain a
graduate degree so they can teach it can be considered to share common interests, goals, and
learning experiences.
Foreign languages teaching and culture. “Culture can be thought of as patterned ways
of thinking, feeling, and reacting to various situations and actions. Culture is gained and shared

59
among people” (Earley, Ang, & Tan, 2006, p. 21). One of the main differences researchers point
out between cultures, for example, is the concept of individualism that marks Western cultures
and contrasts with the collectivism of Asian and South American cultures (Greenfield, 2000;
Triandis, 1996, 2001). Earley et al. (2006) further explain that there are universal parts of CQ
across people of all cultures such as the ability to think about new situations and to problem-
solve, though there are differences among people based on their innate abilities and their unique
experiences or motivation. This would seem to indicate that differences in CQ are individual
variations, unless one considers the joint experience all passionate language learners share. The
social importance of second language (L2) learning lies in understanding foreign cultures and
fostering acceptance of speakers of foreign languages (Byram, 1997). The ACTFL (n.d.) and the
National Standards in Foreign Language Education Project (2006) broadened their learning
objectives from merely language learning to include the study of culture because understanding
culture was deemed essential to language mastery. Learning and reflecting about culture as well
as developing a desire and the skills to interact with people of the target language simply are an
integral part of the foreign language curriculum. They are elements that help build Cognitive,
Metacognitive, Motivational, and Behavioral CQ.
CQ and foreign language achievement. CQ is not tied to a specific culture nor to
learning a foreign language (Livermore, 2015). In fact, Tujela (2014) explains:
Simply having cultural knowledge—however notable this is—is not a predictor of
competence. For example, even being fluent in another language is no replacement for
being sensitive to people’s beliefs and behaviors, although it is a step in the right
direction. (p. 9)

60
From a broader perspective, Gupta & Govindarajan (2002) encourage raising students’
awareness of cultural differences so they can be prepared for immersion experiences such as the
above-mentioned study abroad, mission trips, or internship opportunities. Foreign language
classes can prepare students both linguistically and culturally for those experiences. While
knowing a foreign language is not a prerequisite for CQ (Livermore, 2015), foreign language
faculty have gone through intensive study of the language and the culture of at least two
languages, and possibly more. Their daily interactions with their modern language colleagues
also provide ample exposure and opportunities to appreciate additional cultures. Although no
data could be found to determine whether foreign language teachers have higher CQ levels than
faculty in other departments, these considerations indicate they may exist and are worth
exploring.
Many students learning a foreign language in America may never have the opportunity to
travel abroad due to distance and financial reasons (Mercer, 2011). The L2 classroom
experience, led by faculty with high levels of cultural awareness, offers many opportunities to
explore different cultures and to interact cross-culturally. There is some research on the
connection between students’ CQ and their foreign language achievement. A few studies have
indicated a correlation between CQ and foreign language listening comprehension, but there is
no agreement on which factor is a predictor of the other. Ghonsooly et al. (2013) suggested that
students’ increased levels of interpersonal and Cultural Intelligence led to better listening
comprehension, but their findings contradicted the conclusions reached by Ang et al. (2006) and
Karma and Vedina (2009). Regarding the connection between CQ and writing ability, Peivandi
(2011) found that Cognitive and Motivational CQ were the best predictors of writing ability, and
Ghonsooly and Shalchy’s (2013) data indicated a significant correlation between Cultural

61
intelligence and Cognitive CQ in regard to writing ability and fluency in particular. The
connection of CQ and pragmatic comprehension in another language was also explored.
Pragmatic comprehension is “the ability to recognize a mismatch between the literal utterance
and the intention of the utterance” (Taguchi, 2005, p. 547). Rafieyan et al. (2015) found there is
a strong positive relationship between pragmatic comprehension ability and Cultural
Intelligence. Most of this research, however, focuses on the effect of CQ on L2 performance, not
whether learning a foreign language has an effect on CQ.
Cross-cultural thinking and interactions in other disciplines. Using a combination of
the search terms CQ and other disciplines yielded very mixed results. As indicated above, much
research on CQ is conducted in the field of business, thus business education is replete with
research on the importance of CQ. Searches across all available databases in the university
online library in other fields such as science, mathematics, or music produced no search results
that addressed both search terms concurrently. This statement is not made with any negative
implications in mind; it is merely to point out that cultural awareness is not considered as integral
to the acquisition of the knowledge and skills needed to be successful in those disciplines. This
is another indication that there are grounds for investigating the existence of potential differences
among disciplines.
Summary
Research has shown that “infusion of culturally intelligent practices in postsecondary
education will enable the academic curriculum to become more comprehensively
internationalized and culturally intelligent and create the level of learning that will best prepare
college students for an intricate global community” (Lopes-Murphy, 2014, p. 293). Ghonsooly
and Shalchy (2013) remarked that learners in their home country of Iran have low exposure to a

62
different culture which hurts their CQ level. Therefore, they encouraged teachers and textbooks
to increase attention to teaching cultural points to improve the students’ cultural competence.
This comment reflecting on their participants’ lack of exposure to Anglophone culture can
similarly be applied in the United States, where students in many states have limited exposure to
foreign cultures, in great part due to the country’s geographic size and location.
All four facets of CQ are needed together to function effectively, but each facet can be
enhanced individually through education, travel, and intercultural experiences (Van Dyne et al.,
2012). To better measure the components of CQ, Van Dyne et al. further subdivided the four
factors (metacognition, cognition, motivation, and behavior) into 11 subdimensions when they
developed the Expanded Cultural Intelligence Scale (E-CQS). Metacognitive CQ contains the
three subdimensions of planning, awareness, and checking; Cognitive CQ contains the two
subdimensions of culture-general knowledge and context-specific knowledge; Motivational CQ
contains the three subdimensions of intrinsic interest, extrinsic interest, and self-efficacy to
adjust; and Behavioral CQ contains the three subdimensions of verbal behavior, nonverbal
behavior, and speech acts. Much of the research on CQ has focused on the outcome or the
predictions that could be made from CQ levels in regard to academic achievement in certain
subjects or on cultural adaptation, or business success abroad. Many of the interactions to
improve students’ CQ levels, however, occur in the classroom through traditional instruction
(Earley & Peterson, 2004) and are dependent on the faculty (Goh, 2012). The example provided
above of what it took for foreign language faculty to become subject matter experts overlaps
with the elements of training to improve an individual’s CQ. There is, therefore, theoretical
reason to believe that the CQ levels of foreign language faculty, as well as other disciplines
focused on teaching knowledge and awareness of culture such as Teaching English as a Second
63
Language, Anthropology, or Global Studies, would be higher than for faculty in others
disciplines which are not predicated on comparing cultures, such as science or math. There is,
however, no study found comparing the CQ levels of faculty across disciplines. Earley and Ang
(2003) very clearly established that the goal of exploring Cultural Intelligence was not to label
some groups of people as smarter than others. Neither is it the intention of this study to do so; it
merely seeks to determine whether some college faculty have common CQ traits. This
knowledge provides valuable insight for shaping faculty development. Knowledge gained from
this study can help determine whether all faculty would benefit equally from CQ training or
whether activities should be tailored to the specific CQ needs of the various departments. At a
Christian university, this is of particular importance as McNeil and Pozzi (2011) stated, “We
would argue that developing multicultural skills and competencies would be critical to the
success of any movement within the church for multiracial or multiethnic Christianity” (p. 93).
A faculty equipped with high levels of CQ is more adept at shaping tomorrow’s workforce to be
globally effective across cultures, whether its students become businessmen, teachers,
mathematicians, engineers, entertainers, politicians, healers, or missionaries.

64
CHAPTER THREE: METHODS
Overview
College faculty play an important role in the development of the Cultural Intelligence
(CQ) of their students, a trait considered essential to the successful engagement of college
graduates in a globalized world (NLCLEAP, 2007; Yankelovich, 2005). In order to expose their
students repeatedly to cross-cultural interactions and thoughts, however, faculty need to be aware
of their own CQ (Goh, 2012; Lopes-Murphy, 2014). Yet, little is known about potential
variations in CQ among faculty. The purpose of this causal-comparative study was to determine
if there are differences between units (academic schools or departments) in the Cultural
Intelligence levels of undergraduate college faculty at a faith-based university. Findings from
this study can inform administrative decisions regarding the need for CQ training during
professional development at institutions of higher education, what kind of CQ training to
provide, and whether to include all faculty or only target specific groups. The researcher used an
ex post facto causal-comparative research design to address the gap in knowledge about the CQ
profile of undergraduate college faculty. This chapter describes the method for the study,
including design, research question, null hypotheses, participants, setting, and instrumentation, as
well as data collection and analysis procedures.
Design
A quantitative, causal-comparative research design with one collection point was used to
determine if faculty have differing levels of CQ between academic units within one university in
the Southeastern United States. A causal-comparative design was selected because no
intervention was administered, and participants could not be randomly selected nor assigned to
groups (Gall, Gall, & Borg, 2007). Based on contemporary theories of intelligence (Sternberg,

65
1986), Earley and Ang (2003) defined the construct of Cultural Intelligence (CQ) as an
individual’s effectiveness in managing interactions with people of different cultures. CQ is
considered a learned capability whose facets can be enhanced through “active engagement in
education, travel, international assignments, and other intercultural experiences” (Van Dyne et
al., 2012, p. 297). The review of literature indicated that faculty in some disciplines could have
higher levels of CQ because their training to become subject matter experts included more of
these CQ-boosting experiences.
The categorical independent variable was the unit (academic school or department) in
which faculty teach. At this institution, there are a total of 16 schools: Aeronautics, Applied
Studies & Academic Success (CASAS), Art & Sciences (CAS), Behavioral Sciences (SBS),
Business (SOB), Communication & Digital Content (SCDC), Divinity (SOD), Education (SOE),
Engineering, Health Sciences (SHS), Government (SOG), Music, Nursing, and Visual &
Performing Arts. As the main focus of the Schools of Law and Medicine is graduate students,
these two schools were not included in the survey. To avoid fragmenting into 14 groups to
perform the data analysis, the schools were placed into seven groups.
The continuous dependent variable of CQ was measured with the Expanded Cultural
Intelligence Scale (Van Dyne et al., 2012). The Composite CQ score of faculty as well as the
four components of CQ (Metacognition, Cognition, Motivation, and Behavior) were analyzed to
determine which of the factors are in need of training.
Limitations of a causal-comparative design are that the research allows only inferences,
not claims of cause and effect, and the findings have limited generalizability to other
populations. Yet, in spite of the limitations of its non-experimental nature, ex post facto group
comparison research is valuable to understand educational phenomena (Gall et al., 2007). The

66
purpose of this study was not to determine the cause or effect of CQ differences, but to provide a
better understanding of the existing CQ profile of faculty in order to guide faculty development
providers in their decisions on how to allocate time and resources.
Research Question
The research question for this study was:
RQ: Do the undergraduate faculty in individual academic units in a major university
have different levels of Cultural Intelligence when compared to other units, as measured by the
Expanded Cultural Intelligence Scale?
Hypotheses
This study considered the following null hypotheses:
H01: There will be no statistically significant difference in the Composite Cultural
Intelligence scores of undergraduate faculty in individual academic units in a major university
when compared to other units, as measured by the Expanded Cultural Intelligence Scale.
H02: There will be no statistically significant difference in the Cognitive Cultural
Intelligence scores of undergraduate faculty in individual academic units in a major university
when compared to other units, as measured by the Expanded Cultural Intelligence Scale.
H03: There will be no statistically significant difference in the Metacognitive Cultural
Intelligence scores of undergraduate faculty in individual academic units in a major university
when compared to other units, as measured by the Expanded Cultural Intelligence Scale.
H04: There will be no statistically significant difference in the Motivational Cultural
Intelligence scores of undergraduate faculty in individual academic units in a major university
when compared to other units, as measured by the Expanded Cultural Intelligence Scale.

67
H05: There will be no statistically significant difference in the Behavioral Cultural
Intelligence scores of undergraduate faculty in individual academic units in a major university
when compared to other units, as measured by the Expanded Cultural Intelligence Scale.
Participants and Setting
This study was conducted at a large not for profit, faith-based university in the
Southeastern United States. As the ultimate reason for optimizing CQ training during faculty
development is to ensure college students are equipped to function globally upon graduation, the
population of interest for this study was undergraduate college faculty. Faculty who teach at the
graduate level only were not included. Additional information was collected in the demographic
questionnaire that accompanied the CQS to help explain potential differences.
This convenience sample consisted of a total of 1,762 faculty members teaching
undergraduate courses residentially and/or online at this institution. Of these 1,762 faculty
contacted, 418 responded to the Qualtrics survey, which represents a 23.8% response rate. After
removing incomplete survey responses, a total of 349 participants remained. Of the respondents,
205 respondents were male and 144 female, representing a roughly 59 to 41 male to female ratio.
There were 13 participants in the 20-29 age range, 77 in the 30-39 range, 92 in the 40-49 range,
92 in the 50-59 range, 63 in the 60-69 range, and 12 above 70. Fifteen participants listed their
ethnicity as African American, one as American Indian, seven as Asian, 308 as Caucasian, 10 as
Hispanic or Latino, and eight as other (six as mixed and two chose not to indicate). Of the
participants, 199 participants work as Instructors, 67 as Assistant Professors, 43 as Associate
Professors, 39 as Professors, and one failed to enter a rank.
Nonrandom, convenience sampling was used as participants are part of an existing
population at this university (Gall et al., 2007). Participants cannot be randomly assigned to

68
groups as they belong to preexisting groups (the schools where they teach). Some schools are
comprised of a wider range of disciplines (such as Arts & Sciences which includes such diverse
departments as English, Modern Languages, Mathematics, or Family and Consumer Science)
than others, such as Nursing or Engineering, which are more singularly focused. According to
Gall et al. (2007), at least 15 participants in each group are needed in causal-comparative
research, and Warner (2013) recommends a minimum of 20 cases per cell to ensure the
robustness of the univariate F tests.
In causal-comparative studies, homogeneity among groups is desirable to rule out that
other differences may obscure the relationships under investigation (Gall et al., 2007).
Therefore, this study gathered demographic information, along with data on the independent
variable (school or department) and the dependent variable (CQ level). In regard to the
independent variable, participants were asked to indicate not merely in what school and
department they teach but also which degrees they have earned and in which discipline(s). This
information was used to ensure participants who teach courses for two different schools are
placed in the group which most closely matches their degree, in order to ensure independence of
observation. The demographic information was also expected to contribute to a better
understanding of potential differences that are indicative of individual characteristics of
participants rather than representative of the school for which faculty teach. The information can
also provide additional insight into the less researched antecedents and confounding variables of
CQ.
Instrumentation
A published instrument, the Expanded Cultural Intelligence Scale (Van Dyne et al.,
2012), and a demographic questionnaire were administered to participants in this study. Ang et

69
al. (2007) developed the CQS, an initial 20-question instrument to measure an individual’s levels
of Cultural Intelligence, but later fine-tuned it to provide additional focus on the 11 sub-
dimensions. This study used this version updated in 2018 called the E-CQS which contains 39
questions. The questionnaire was used to gather data on the demographic makeup of participants
such as gender, age, ethnicity, nationality, educational background, academic unit, and
intercultural, international and foreign language experiences. The information concerning the
school for which participants teach determined to which group they belong (the independent
variable). As the accreditation process through the Southern Association of Colleges and
Schools Commission on Colleges (2012) requires that faculty be credentialed for the specific
courses they teach, it is unlikely that professors teach in a school for which they did not develop
their subject matter expertise through degrees. It can, therefore, be assumed that the current
school in which faculty teach is an indication of the training they received, but not that it
represents the sum total of their subject matter expertise, as some professors have earned
multiple degrees in various disciplines. As indicated above, living abroad has an impact on CQ
levels (Crowne, 2009, 2013; Imai & Gelfand, 2010; Lee & Sukoco, 2010; Ramalu, Rose, Kumar,
& Uli, 2010; Takeuchi et al., 2005; Tarique & Takeuchi, 2008). Thus, the researcher gathered
the additional information about faculty background to determine whether existing differences in
CQ levels are truly indicative of group differences rather than reflecting participants’ individual
traits or experiences. The remaining demographic information was gathered to identify potential
confounding variables that may be a threat to the internal validity of causal-comparative studies
(Brewer & Kuhn, 2010; Coryn & Hobson, 2010).
Data for the dependent variables, the Metacognitive, Cognitive, Motivational, and
Behavioral CQ scores as well as the Composite score, were collected via the Expanded Cultural
70
Intelligence Scale (Van Dyne et al., 2012). This 39-item scale asks participants to rate how
strongly they agree or disagree with cultural belief statements on a Likert-type scale ranging
from 1 to 7 (1 = strongly disagree; 2 = disagree; 3 = more or less disagree; 4 = undecided; 5 =
more or less agree; 6 = agree; 7 = strongly agree). Only positively worded items are used on the
scale. There are nine items each respectively measuring Motivational CQ (three for extrinsic,
three for intrinsic, and three for self-efficacy to adjust), Metacognitive CQ (three for planning,
three for awareness, and three for checking), and Behavioral CQ (three for verbal behavior, three
for nonverbal behavior, and three for speech acts) with scores ranging from 9 to 63 in each
dimension. There are 12 items measuring Cognitive CQ (seven each for culture-general and five
for context-specific knowledge), with scores ranging from 12 to 84. The Composite CQ scores
can range between 39 and 273.
Ang et al. (2007) developed 53 items for the initial pool, which they reduced to 40 items
before testing for factor validity. They retained the 20 items with the best psychometric
properties: four Metacognitive, six Cognitive, five Motivational, and five Behavioral items.
Confirmatory factor analysis (CFA) showed good fit for the four-factor model: χ2 (164 df) =
822.26, NNFI = .91, CFI = .92, SRMR = .06, and RMSEA = .08 (p < .05). Data analysis
demonstrated high internal consistency and provided a Composite reliability score of 0.70 (0.72
for Metacognitive CQ, 0.86 for Cognitive CQ, 0.76 for Motivational CQ, and 0.83 for
Behavioral CQ). To ensure generalizability, Ang et al. (2007) cross validated the results to
establish that the four-factor model’s validity and reliability hold across samples, times, and
countries. They then conducted three substantive studies to “demonstrate a systematic pattern of
relationships between dimensions of CQ and specific intercultural effectiveness outcomes” (Ang
et al., 2007, p. 29). This four-factor model has an extensive track record as it was used in many

71
studies such as Ang et al., 2006; A. S. Chen et al., 2011; Ghonsooly and Shalchy, 2013;
Ghonsooly et al., 2013; Khodadady and Yazdi, 2014; Kurpis and Hunter, 2017; Lee and Sukoco,
2010; MacNab and Worthley, 2012; Rafieyan et al., 2015; and Rockstuhl et al., 2011. After
numerous studies used the CQS to gather data, the authors of the instrument revised it to
integrate the newly gained knowledge and offer a more focused theoretical framework. They
proposed the Expanded Cultural Intelligence Scale(E-CQS) which comprises 37 items and
allows for better investigation of the 11 subfactors of the four factors (Van Dyne et al., 2012).
They collected data from 286 individuals from more than 30 countries and performed
confirmatory factor analysis that demonstrated discriminant validity of the subdimensions. The
11-factor model demonstrated significantly better fit than the four-factor model and acceptable
reliabilities in validation studies (Metacognitive CQ = .77-.83; Cognitive CQ = .76-.85;
Motivational CQ = .76-.82; and Behavioral CQ = .75-.79). They later added one question to the
Cognitive CQ factor: “I know the rules (e.g., vocabulary, grammar) of other languages” to
complement the question about speaking and understanding many languages. They also divided
the Cognitive CQ question, “I can describe similarities and differences in legal, economic, and
political systems across cultures,” into two distinct questions: “I can describe similarities and
differences in political systems across cultures,” and “I can describe the legal and economic
systems of other cultures.” This resulted in the survey version comprising 39 questions that was
used for this study. Table 1 shows examples of the questions from the 11 subscales.

72
Table 1
Example Items from the Expanded Cultural Intelligence Scale
Four Facets 11 Sub-facets Example Questions
Motivational CQ
(9 questions)
Intrinsic Motivation (3) “I truly enjoy interacting with people from
different cultures.”
Extrinsic Motivation (3) “I value the credibility I would gain from
developing global networks and culturally
diverse connections.”
Self-Efficacy to Adjust
(3)
“I am sure I can handle the stress of
interacting with people from cultures that are
new to me.”
Cognitive CQ
(12 questions)
Culture-General
Knowledge (7)
“I can describe differences in family systems
and the varied role expectations for men and
women across cultures.”
Context-Specific
Knowledge (5)
“I can describe how to put people from
different cultures at ease.”
Metacognitive CQ
(9 questions)
Planning (3) “I develop action plans before interacting
with people from a different culture.”
Awareness (3) “I am conscious of how other people’s
cultural background may influence their
thoughts, feelings, and actions.”
Checking (3) “I adjust my cultural knowledge after a
cultural misunderstanding.”
Behavioral CQ
(9 questions)
Speech Acts (3) “I change how I make requests of others
depending on their cultural background.”
Verbal behavior (3) “I change my use of pause and silence to suit
different cultural situations.”
Nonverbal
Behavior (3)
“I change my nonverbal behaviors (hand
gestures, head movements) to fit the cultural
situation.”
Some later replication studies (Bücker et al., 2015, 2016) noted a concern about the
discriminant validity of the four-factor model and advocated for a two-factor model of the CQS,
combining metacognition and cognition into one and behavior and motivation into another
dimension. As this two-factor model has not yet been replicated, this study remained with
Earley and Ang’s (2003) more established conceptualization of CQ as having four dimensions

73
(Metacognitive, Cognitive, Motivational, and Behavioral). To gain more detailed insight into
possible differences at the subfactor level, however, the E-CQS was used.
Procedures
The scale and questionnaire were entered into a Qualtrics© XM survey and submitted to
the Institutional Review Board (IRB) for approval (see Appendix B). The institution also
required additional approval from Human Resource and Marketing for the use of a Qualtrics
survey. After securing all required approvals, the researcher administered the survey during the
fall semester.
As the study uses a self-report scale and questionnaire, some thought needed to be given
to minimizing the effect of biases. In their discussion of common method biases in questionnaire
research, Podsakoff, MacKensie, Lee, and Podsakoff (2003) indicated that the concept of social
desirability can induce respondents to behave in a more culturally acceptable way and cause a
variance artifactually. Some preventive measures to minimize socially desirable responding and
increase accuracy were taken to assure participants of the anonymity of their responses and to
administer the questionnaire via computer rather than face to face (Podsakoff et al., 2003).
Using a self-report instrument is a cause for concern for Conway and Lance (2010), but several
studies indicated that the results of the self-report CQS are strongly correlated with other report
measures, as well as with measures provided by supervisors of interactional adjustment (Ang et
al., 2007; Van Dyne et al., 2008). Bücker et al. (2015) recommended administering the
instrument before collecting the demographic data. This study thus implemented the same
procedure to prevent potential priming effect by the questionnaire items (Podsakoff et al., 2003).
Another potential bias can result from the difference between respondents and non-
respondents in surveys research, even though research indicates little correlation between

74
response rates and nonresponse bias (R. M. Groves, 2006). Holbrook, Krosnick, and Pfent
(2007) explained that “response rates are a function of two different aspects of the interaction
with respondents: contacting respondents and gaining their cooperation” (p. 501). To maximize
participation, the E-CQS and the demographic questionnaire were launched in the middle of the
semester to avoid the beginning or end of a semester, which tend to be the most stressful times
for faculty. With the administration’s approval, the link to the Qualtrics survey was emailed to
all faculty email addresses provided by the institution’s Analytics and Data office.
Permission to use the E-CQS did not need to be requested as the Cultural Intelligence
Center granted it for academic research purposes, but the researcher requested it out of courtesy
to the authors (see Appendix G). The scale and questionnaire (see Appendix A) were converted
into computerized versions in the online survey tool Qualtrics© XM (Qualtrics, Provo, UT). As
mentioned above, the E-CQS items appeared before the demographic questions to avoid priming
bias. The email included a brief explanation of the survey and its purpose, information on the
time investment (10-15 minutes), and a link to the survey (see Appendix D). It also contained a
statement that submission of the survey constitutes assent to use the collected data for the
purpose of this study. The researcher also provided assurance that the data were collected
anonymously and that findings will be published in group form only to prevent potential
identification of participants. Incentives have been shown to increase response rates (Gall et al.,
2007), so participants were informed of their chance to win one $300 Visa gift card by
participating in the study. Qualtrics was set to prevent ballot stuffing and the collection of any
personal information and contact association of survey participants. Email addresses were
requested for participants wishing to be entered in the drawing for the gift cards; however, before
asking participants to enter their email address, the survey sent them to a second survey to create
75
a data list completely separate from the survey responses to maintain anonymity. According to
Heberlein and Baumgartner (1978), two or three follow-ups seem to be the most effective
number. Two email follow-ups were sent out to all nonparticipants in one-week increments after
the initial request (see Appendices E & F).
The survey closed three weeks after the initial invitation to participate. The researcher
accessed all the data gathered in Qualtrics, downloaded it in a Comma-Separated Values (CSV)
format, and secured it on a password-protected computer. After removing 66 surveys that had
been opened but not completed, the data were coded. Nineteen participants indicated that they
teach in more than one school. As ANOVA and MANOVA require independence of
observation, these participants were assigned to the school that best matches the degrees they
earned. As there are no negatively worded items on the E-CQS, no reverse coding was
necessary. The data set was then entered into SPSS 25 and scanned once more for errors and
incomplete entries before data analysis. The email addresses of the 266 participants who
requested to be entered in the drawing for the gift card were exported from Qualtrics into Excel.
The winner was selected by using a random selection formula.
Data Analysis
Descriptive statistics, a one-way analysis of variance (ANOVA), and a one-way
multivariate analysis of variance (MANOVA) were computed in SPSS 25. The mean, standard
deviation, and minimum and maximum scores were computed for each group on the dependent
variables (Composite score, Metacognitive CQ, Cognitive CQ, Motivation CQ, and Behavioral
CQ scores). Knowing whether faculty in various disciplines differ in regard to their Composite
CQ score determines whether faculty in some schools may benefit from more CQ training than
others. A more detailed understanding of the overall response pattern, however, is also valuable,
76
as it can inform whether different schools require additional training in all aspects of CQ or in a
tailored combination of the Metacognitive, Cognitive, Behavioral, or Motivational facets of CQ.
The four factors of CQ were used as the dependent variables for data analysis. Since the
Composite score is computed from the four factors, however, it could not be processed along
with the four factors in the MANOVA without skewing the data. Therefore, a one-way ANOVA
was performed to determine if null hypothesis one could be rejected, and a MANOVA was used
for null hypotheses two through five. The ANOVA is an appropriate test to determine whether
groups differ on one dependent variable, and the MANOVA is appropriate for more than one
dependent variable (Gall et al., 2007; Warner, 2013). In this situation conducting one
MANOVA was deemed preferable to multiple ANOVA because the four factors of the E-CQS
(Ang et al., 2007) which are the dependent variables represent different measurements of the
same underlying construct, not separate constructs (Warner, 2013).
The use of the ANOVA and MANOVA assumes a continuous dependent variable, a
categorical independent variable with two or more independent groups, and independence of
observation. Both tests require normal distribution, homogeneity of variances, and the absence
of significant outliers (Warner, 2013). The assumption of normality was assessed using the
Kolmogorov-Smirnov test and Q-Plots. The assumption of equal variance was assessed with a
Levene’s test of equality of variance, and boxplots were examined to determine whether there
were outliers.
The additional assumptions tested for the MANOVA were multivariate normal
distribution, homogeneity of variances-covariance matrices, and absence of multicollinearity
(Tabachnick & Fidell, 2007; Warner, 2013). The assumption of absence of multivariate outliers
was assessed using Mahalanobis distance values. The assumption of multicollinearity was

77
assessed using a Pearson product-moment correlation coefficient. The assumption of linear
relationship was assessed with a scatterplot matrix and the homogeneity of variance-covariance
with a Box’s M test.
The effect size was computed using η2 to indicate the proportion of the Y variance that is
predictable from group membership (Warner, 2013). Calculations with G*Power 3.1.9.2
calculator indicate that a minimum sample size of 299 is needed to meet the minimum criteria for
a medium effect size and alpha of 0.05 to reach a statistical power level of 0.80 (Faul, Erdfelder,
Lang, & Buchner, 2007). For findings indicating that the difference between groups is
statistically significant (p < .05), the null hypotheses were rejected and post hoc analyses for
pairwise comparison were conducted. To limit the risk of Type I error when using a large
number of groups, a Tukey honestly significant difference (HSD) test was used. Tukey HSD has
more statistical power than some other post hoc tests if all pairwise comparisons are made
(Warner, 2013). In accordance with IRB instructions, the researcher will delete all data files for
this research stored on the password-protected computer. The results of the data analysis are
presented in Chapter 4.
78
CHAPTER FOUR: FINDINGS
Overview
The purpose of the study was to determine whether undergraduate faculty in each
academic unit of a university have differing levels of Cultural Intelligence (CQ) from the faculty
members in other units. The researcher used an ex post facto causal-comparative research
design. A one-way analysis of variance and a multivariate analysis of variance with seven
independent groups were used to compare the CQ level of undergraduate faculty in each
academic unit on each dependent variable (Composite, Cognitive, Metacognitive, Motivational,
and Behavioral CQ scores). This chapter outlines the assumptions testing, descriptive statistics,
and results of the data analysis.
Research Question
This quantitative study was designed to address the following research question:
RQ: Do the undergraduate faculty in individual academic units in a major university
have different levels of Cultural Intelligence when compared to other units, as measured by the
Expanded Cultural Intelligence Scale?
Null Hypotheses
The null hypotheses for this study were:
H01: There will be no statistically significant difference in the Composite Cultural
Intelligence scores of undergraduate faculty in individual academic units in a major university
when compared to other units, as measured by the Expanded Cultural Intelligence Scale.
H02: There will be no statistically significant difference in the Cognitive Cultural
Intelligence scores of undergraduate faculty in individual academic units in a major university
when compared to other units, as measured by the Expanded Cultural Intelligence Scale.

79
H03: There will be no statistically significant difference in the Metacognitive Cultural
Intelligence scores of undergraduate faculty in individual academic units in a major university
when compared to other units, as measured by the Expanded Cultural Intelligence Scale.
H04: There will be no statistically significant difference in the Motivational Cultural
Intelligence scores of undergraduate faculty in individual academic units in a major university
when compared to other units, as measured by the Expanded Cultural Intelligence Scale.
H05: There will be no statistically significant difference in the Behavioral Cultural
Intelligence scores of undergraduate faculty in individual academic units in a major university
when compared to other units, as measured by the Expanded Cultural Intelligence Scale.
General Descriptive Statistics
The scores faculty received on the Expanded Cultural Intelligence Scale (E-CQS)
constituted the dependent variables for the ANOVA and MANOVA. The independent variable
was the academic unit in which the faculty teach. As some schools within the university are
smaller or had few respondents to the study, it was necessary to group some schools together in
the following academic units:
• Group 1 (n = 83) - Liberal Arts, composed of the College of Arts & Sciences (n = 76) and
College of Applied Studies & Academic Success (n = 8),
• Group 2 (n = 52) - Behavioral Sciences, composed of the School of Behavioral Sciences
(n = 35) and School of Education (n = 17),
• Group 3 - School of Business (n = 36),
• Group 4 - School of Divinity (n = 60),

80
• Group 5 (n = 49) - Sciences and Technology, composed of the School of Aeronautics (n
= 7), School of Engineering (n = 2), School of Health Sciences (n = 28), and School of
Nursing (n = 12),
• Group 6 (n = 31) - Fine & Performing Arts, composed of the School of Music (n = 12),
School of Communication and Digital Content (n = 11), and School of Visual &
Performing Arts (n = 8),
• Group 7 - School of Government (n = 37).
Table 2 shows the details of the participants’ demographic information. The request to
participate was sent via email to all 1,761 undergraduate faculty at the institution. Of the 418
surveys returned, 69 surveys were discarded because the participants either did not complete all
the questions on the E-CQS or failed to provide the information needed to assign them to a group
(the school in which they teach). Thus, 349 were retained for data analysis. A majority of the
participants were male (n = 205) and Caucasian (n = 304). The ages ranged from the 20s to
above 70, with the majority of participants between the ages of 40 and 59 (n = 184).
Table 2
Demographic Information
Variables n %
Gender
Male
Female
205
144
58.7
41.3
Age Range
20-29
30-39
40-49
50-59
60-79
70 and above
13
77
92
92
63
12
3.7
22.1
26.4
26.4
18.1
3.4

81
Table 2 (continued)
Ethnicity
African American
American Indian
Asian
Caucasian
Hispanic or Latino
Other
15
1
7
304
10
12
4.3
.3
2.0
87.1
2.9
3.4
Rank
Instructor
Assistant Professor
Associate Professor
Professor
Missing
199
67
43
39
1
57
19.2
12.3
11.2
.3
Cross-Cultural Interactions
Little experience
Moderately experienced
Very experienced
Missing
74
151
123
1
21.2
43.4
35.3
.3
Time outside US expressed in
Days
Months
Years
Decades
Missing
72
130
103
14
1
20.6
37.2
29.5
4.0
.3
Number of Foreign Languages Learned
0
1
2
3
4 or more
Missing
111
120
59
29
29
1
31.8
34.4
16.9
8.3
8.4
.3
Of the 349 participants, 300 lived their entire childhood and adolescence in the United
States and 29 never left the country. Regarding cross-cultural interactions, 78% indicated they
were moderately to very experienced which seems to coincide with the number of participants
who spent considerable time outside the US. Close to one third of participants reported not
having learned any foreign languages.
Hypothesis One: Composite CQ Score
Since the Composite score is a combination of the four factors of Cultural Intelligence, it

82
cannot be included as one of the dependent variables for the MANOVA without skewing the
results. A one-way analysis of variance (ANOVA) was therefore conducted on the Composite
CQ score for all groups to evaluate the null hypothesis that there is no statistically significant
difference in the Composite score of faculty in individual academic units when compared to
other units, as measured by the E-CQS (Van Dyne et al., 2012). The four factors were
subsequently analyzed with a multiple analysis of variance (MANOVA) to evaluate hypotheses
two through five.
Descriptive Statistics
With a total of 39 questions and a minimum of one point and a maximum of seven for
each question, participants could earn a Composite score ranging between 39 and 273 points (M
= 199.36, SD = 34.89). No participant scored the minimum possible score of 39, as the lowest
score earned was 106. Two participants earned the highest possible Composite score of 273.
One was from the School of Music and the other from the School of Government.
The descriptive statistics disaggregated by academic groups are presented as mean ±
standard deviation in Table 3. The academic units, ranked in order of their Composite CQ scores
from highest to lowest, were Group 4/Divinity (n = 60, M = 210.3, SD = 32.9), Group
3/Business (n = 36, M = 203.7, SD = 33.1), Group 7/Government (n = 37, M = 202.4, SD =
38.1), Group 2/Behavioral Sciences (n = 52, M = 199.5, SD = 28.8), Group 6/Fine & Performing
Arts (n = 31, M = 198.7, SD = 35.5), Group 1/Liberal Arts (n = 83, M = 198.9, SD = 35.0), and
Group 5/Sciences & Technology (n = 50, M = 181.7, SD = 36.1).

83
Table 3
Descriptive Statistics: Composite CQ Scores by Group
Academic Unit n M SD Minimum Maximum
1. Liberal Arts 83 198.964 35.010 106 268
2. Behavioral Sciences 52 199.519 28.812 121 252
3. Business 36 203.722 33.122 145 265
4. Divinity 60 210.316 32.960 135 264
5. Sciences & Technology 50 181.680 36.106 120 256
6. Fine & Performing Arts 31 198.709 35.537 124 273
7. Government 37 202.432 38.187 142 273
Total 349 199.358 34.884 106 273
Assumptions Testing for ANOVA
A one-way ANOVA requires one continuous dependent variable (the Composite CQ
score), one categorical independent variable with two or more independent groups (Academic
units; k = 7), and independence of observation (Warner, 2013). As mentioned above,
participants who teach for two different schools were included only in the group that most
closely represents their subject matter of expertise determined by the degrees they earned, to
ensure independence of observation. These three assumptions of ANOVA were thus met at the
design level of this study. Before using the one-way ANOVA, the data set was tested for three
additional assumptions: outliers, normality, and homogeneity of variances (Warner, 2013). An
inspection of the boxplots revealed that one datapoint in Group 6 is an outlier, but it is not an
extreme outlier and was thus retained for data analysis (see Figure 3).

84
A Levene’s test of equality of variance was used (see Table 4) and the assumption of
equal variance was considered met (p = 0.22).
Table 4
Levene’s Test of Equality of Variance: Composite CQ Scores
Levene Statistic df1 df2 Sig.
1.377 6 342 0.223
Note. df = degrees of freedom
The researcher conducted a Kolmogorov-Smirnov test of normality (N > 50). If the p-
values for each group are greater than the threshold alpha p < 0.05, the assumption of normality
can be considered met (Warner, 2013). The test indicated that the Composite CQ scores for all
groups except Group 5 follow a normal distribution, as shown in Table 5.
Figure 3. Boxplots of composite CQ scores by group.

85
Table 5
Kolmogorov-Smirnov Test of Normality
Academic Unit Statistic df Sig.
Composite CQ Score 1. Liberal Arts 0.053 83 0.200
2. Behavioral Sciences 0.082 52 0.200
3. Business 0.143 36 0.060
4. Divinity 0.111 60 0.064
5. Sciences & Technology 0.143 50 0.013
6. Fine & Performing Arts 0.124 31 0.200
7. Government 0.135 37 0.86
Note. df = degrees of freedom
A Q-Plot of Group 5, however, shows that the data are approximately normally aligned
along the diagonal line (see Figure 4). Since the ANOVA is considered robust against a
violation of this assumption if sample sizes are reasonable (N ≥ 25), the researcher proceeded
with the ANOVA.
Figure 4. Q-Plot of Group 5 composite CQ scores.

86
Results
A one-way ANOVA was conducted to determine whether differences exist in the
Composite CQ score of faculty in individual academic units when compared to others. Figure 5
gives a visual indication of the differences, especially between Groups 4 and 5. This was later
confirmed by a Tukey post hoc analysis to perform pairwise comparisons.
The Composite CQ scores of faculty are statistically significantly different between
academic groups, F(6, 342) = 3.408, p = .003 (see Table 6) using α = 0.5. According to Warner
(2013), the critical value of F is 2.09 (α = 0.5, df1 = 6, df2 > 120). Because F > F-critical and p
< .05, the null was rejected. For effect size, η2 was used to indicate the proportion of the
Composite CQ score variance that is predictable from group membership (Warner, 2013). The
data show the partial eta squared (η2 = 0.056) reflects a medium effect size with 5% of the
variance being attributable to group membership (Warner, 2013, p. 208).
Figure 5. Bar graph of mean composite CQ scores by group.
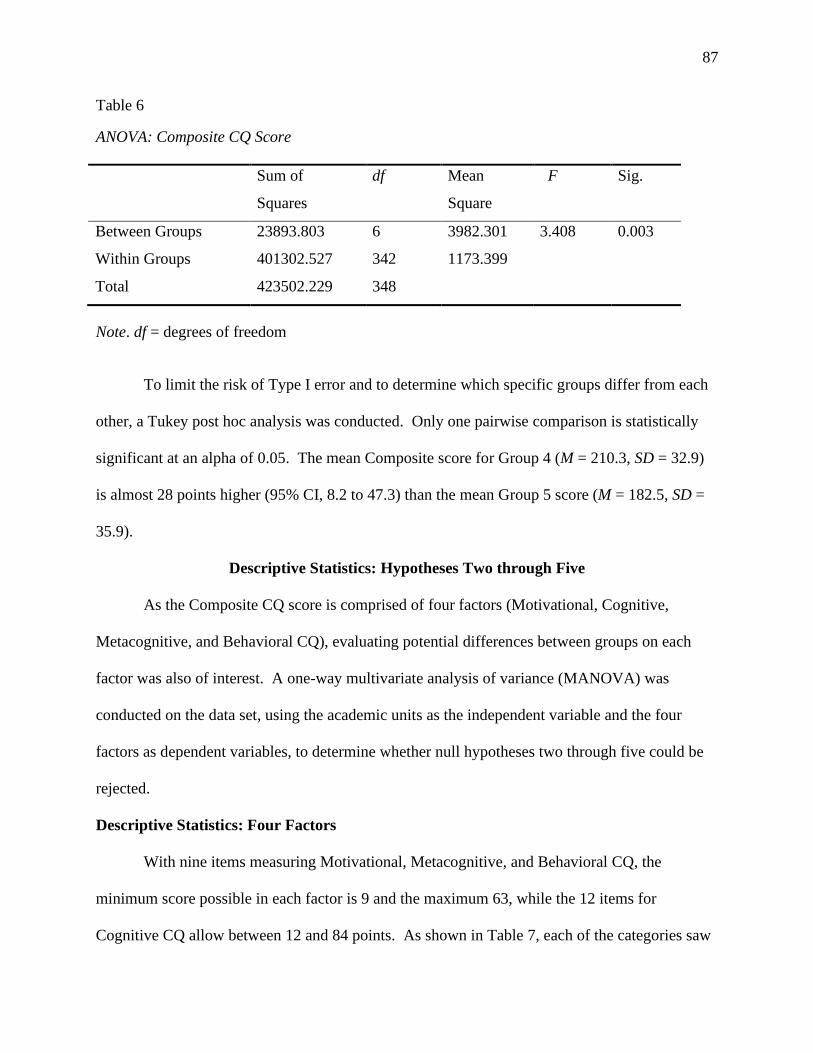
87
Table 6
ANOVA: Composite CQ Score
Sum of
Squares
df Mean
Square
F Sig.
Between Groups 23893.803 6 3982.301 3.408 0.003
Within Groups 401302.527 342 1173.399
Total 423502.229 348
Note. df = degrees of freedom
To limit the risk of Type I error and to determine which specific groups differ from each
other, a Tukey post hoc analysis was conducted. Only one pairwise comparison is statistically
significant at an alpha of 0.05. The mean Composite score for Group 4 (M = 210.3, SD = 32.9)
is almost 28 points higher (95% CI, 8.2 to 47.3) than the mean Group 5 score (M = 182.5, SD =
35.9).
Descriptive Statistics: Hypotheses Two through Five
As the Composite CQ score is comprised of four factors (Motivational, Cognitive,
Metacognitive, and Behavioral CQ), evaluating potential differences between groups on each
factor was also of interest. A one-way multivariate analysis of variance (MANOVA) was
conducted on the data set, using the academic units as the independent variable and the four
factors as dependent variables, to determine whether null hypotheses two through five could be
rejected.
Descriptive Statistics: Four Factors
With nine items measuring Motivational, Metacognitive, and Behavioral CQ, the
minimum score possible in each factor is 9 and the maximum 63, while the 12 items for
Cognitive CQ allow between 12 and 84 points. As shown in Table 7, each of the categories saw
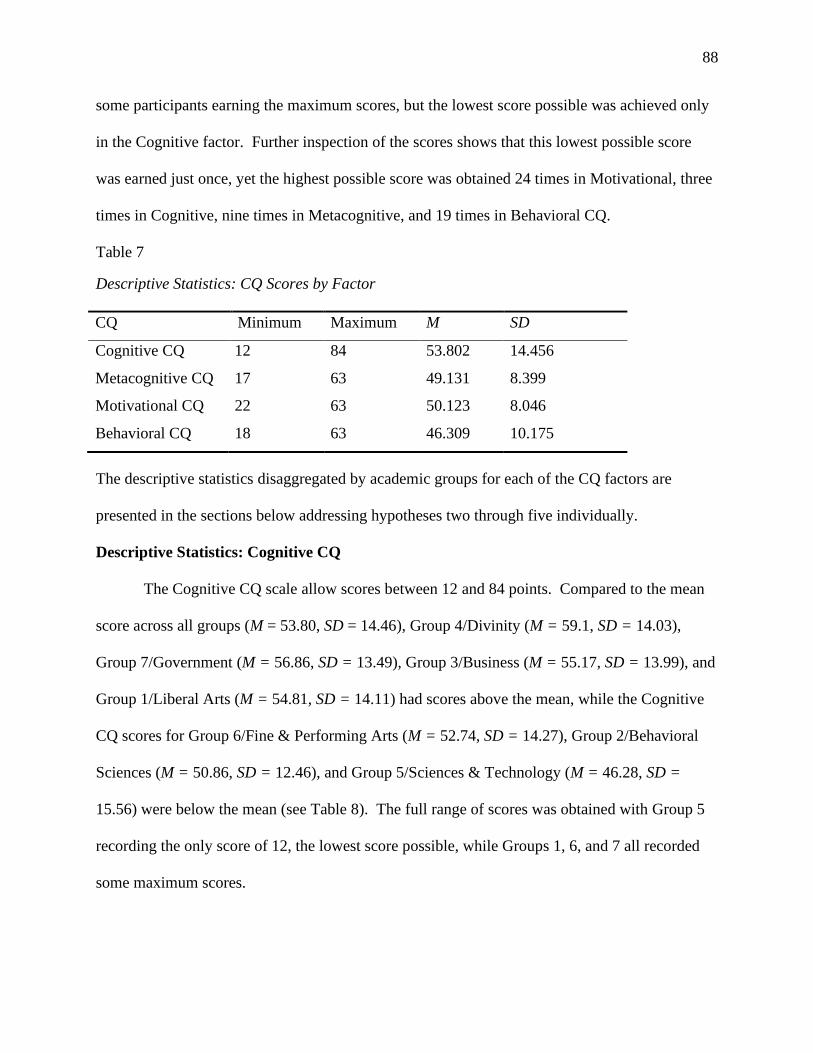
88
some participants earning the maximum scores, but the lowest score possible was achieved only
in the Cognitive factor. Further inspection of the scores shows that this lowest possible score
was earned just once, yet the highest possible score was obtained 24 times in Motivational, three
times in Cognitive, nine times in Metacognitive, and 19 times in Behavioral CQ.
Table 7
Descriptive Statistics: CQ Scores by Factor
CQ Minimum Maximum M SD
Cognitive CQ 12 84 53.802 14.456
Metacognitive CQ 17 63 49.131 8.399
Motivational CQ 22 63 50.123 8.046
Behavioral CQ 18 63 46.309 10.175
The descriptive statistics disaggregated by academic groups for each of the CQ factors are
presented in the sections below addressing hypotheses two through five individually.
Descriptive Statistics: Cognitive CQ
The Cognitive CQ scale allow scores between 12 and 84 points. Compared to the mean
score across all groups (M = 53.80, SD = 14.46), Group 4/Divinity (M = 59.1, SD = 14.03),
Group 7/Government (M = 56.86, SD = 13.49), Group 3/Business (M = 55.17, SD = 13.99), and
Group 1/Liberal Arts (M = 54.81, SD = 14.11) had scores above the mean, while the Cognitive
CQ scores for Group 6/Fine & Performing Arts (M = 52.74, SD = 14.27), Group 2/Behavioral
Sciences (M = 50.86, SD = 12.46), and Group 5/Sciences & Technology (M = 46.28, SD =
15.56) were below the mean (see Table 8). The full range of scores was obtained with Group 5
recording the only score of 12, the lowest score possible, while Groups 1, 6, and 7 all recorded
some maximum scores.

89
Table 8
Descriptive Statistics: Cognitive CQ Scores by Group
Academic Unit n M SD Minimum Maximum
1. Liberal Arts 83 54.807 14.114 24 84
2. Behavioral Sciences 52 50.865 12.462 20 81
3. Business 36 55.167 13.989 22 79
4. Divinity 60 59.067 14.032 25 82
5. Sciences & Technology 50 46.280 15.564 12 79
6. Fine & Performing Arts 31 52.742 14.273 31 84
7. Government 37 56.865 13.487 31 84
Descriptive Statistics: Metacognitive CQ
The Metacognitive CQ scale allows scores between 9 and 63 points. No group recorded
the lowest number of points possible, but all groups recorded at least one maximum score of 63,
except for Group 1 which scored a maximum of 62 points. Compared to the mean score across
all groups (M = 49.13, SD = 8.40), Group 4/Divinity (M = 51.05, SD = 7.26), Group
2/Behavioral Sciences (M = 50.60, SD = 7.36), Group 6/Fine & Performing Arts (M = 50.26, SD
= 8.85), Group 3/Business (M = 50.083, SD = 7.83), and Group 7/Government (M = 49.21, SD
= 9.53) had scores above the mean, while Group 1/Liberal Arts (M = 48.34, SD = 7.70) and
Group 5/Sciences & Technology (M = 44.68, SD = 9.72) were below the mean (see Table 9).

90
Table 9
Descriptive Statistics: Metacognitive CQ Scores by Group
Academic Unit n M SD Minimum Maximum
1. Liberal Arts 83 48.638 7.701 22 62
2. Behavioral Sciences 52 50.596 7.357 31 63
3. Business 36 50.083 7.835 38 63
4. Divinity 60 51.050 7.263 33 63
5. Sciences & Technology 50 44.680 9.721 17 63
6. Fine & Performing Arts 31 50.258 8.854 22 63
7. Government 37 49.216 9.531 27 63
Descriptive Statistics: Motivational CQ
Just like the Metacognitive factor, the Motivational factor scores may range between 9
and 63 points. No group came close to the lowest number of points as the minimum score
ranged from 22 for Group 4 to 36 for Group 3. All groups recorded at least one maximum score
of 63. Compared to the mean score across all groups (M = 50.12, SD = 8.05), Group 3/Business
(M = 52.11, SD = 7.88), Group 4/Divinity (M = 51.62, SD = 8.26), and Group 6/Fine &
Performing Arts (M = 50.13, SD = 8.29), had scores above the mean while Group 1/Liberal Arts
(M = 49.98, SD = 8.36), Group 7/Government (M = 49.92, SD = 8.02), Group 2/Behavioral
Sciences (M = 48.92, SD = 6.83), and Group 5/Sciences & Technology (M = 48.02, SD = 7.92)
were below the mean (see Table 10).

91
Table 10
Descriptive Statistics: Motivational CQ Scores by Group
Academic Unit n M SD Minimum Maximum
1. Liberal Arts 83 49.976 8.358 32 63
2. Behavioral Sciences 52 48.923 6.827 29 63
3. Business 36 52.111 7.880 36 63
4. Divinity 60 51.616 8.256 22 63
5. Sciences & Technology 50 48.020 7.924 29 63
6. Fine & Performing Arts 31 50.133 8.287 27 63
7. Government 37 49.916 8.023 34 63
Descriptive Statistics: Behavioral CQ
The scores for the Behavioral factor of CQ may range between 9 and 63 points. No
group came close to the lowest number of points as the minimum score ranged from 18 for
Group 6 to 31 for Group 4. All groups recorded at least one maximum score of 63. Compared to
the mean score across all groups (M = 46.30, SD = 10.17), Group 2/Behavioral Sciences (M =
49.13, SD = 7.76), Group 4/Divinity (M = 48.58, SD = 8.88), and Group 3/Business (M = 46.36,
SD = 10.54) had scores above the mean while Group 7/Government (M = 46.08, SD = 11.11),
Group 1/Liberal Arts (M = 45.54, SD = 9.96), Group 6/Fine & Performing Arts (M = 45.16, SD
= 12.52), and Group 5/Sciences & Technology (M = 42.70, SD = 10.75) were below the mean
(see Table 11).
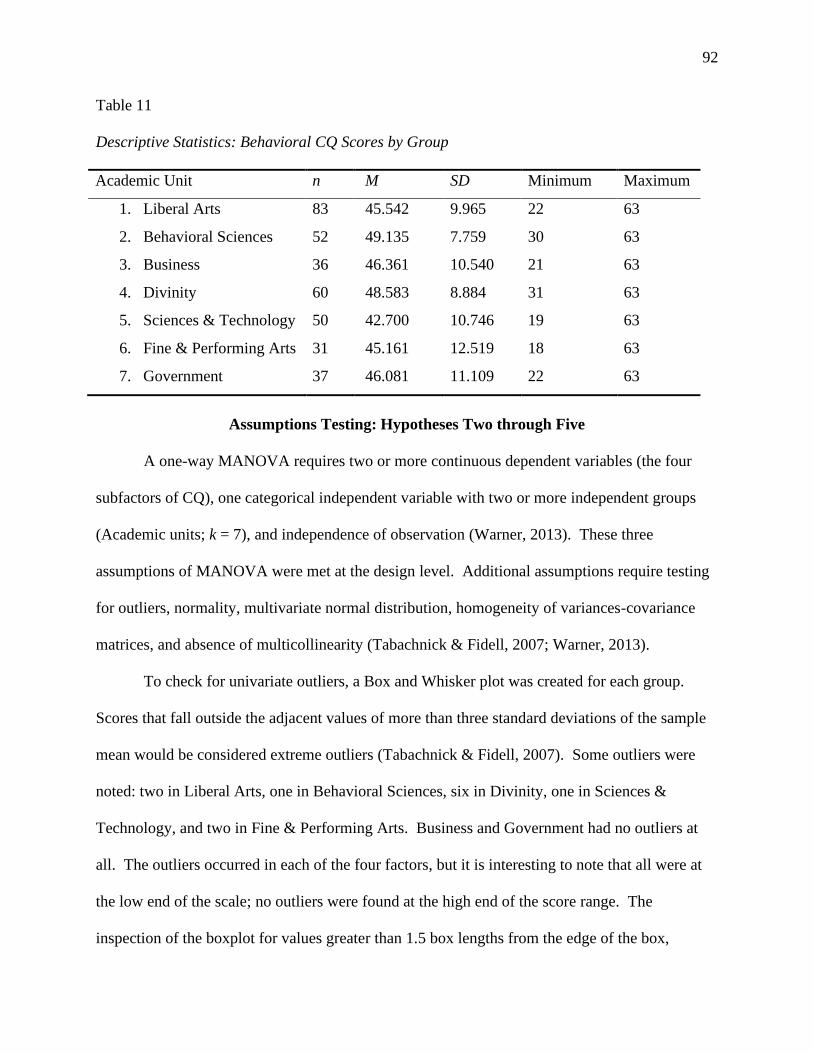
92
Table 11
Descriptive Statistics: Behavioral CQ Scores by Group
Academic Unit n M SD Minimum Maximum
1. Liberal Arts 83 45.542 9.965 22 63
2. Behavioral Sciences 52 49.135 7.759 30 63
3. Business 36 46.361 10.540 21 63
4. Divinity 60 48.583 8.884 31 63
5. Sciences & Technology 50 42.700 10.746 19 63
6. Fine & Performing Arts 31 45.161 12.519 18 63
7. Government 37 46.081 11.109 22 63
Assumptions Testing: Hypotheses Two through Five
A one-way MANOVA requires two or more continuous dependent variables (the four
subfactors of CQ), one categorical independent variable with two or more independent groups
(Academic units; k = 7), and independence of observation (Warner, 2013). These three
assumptions of MANOVA were met at the design level. Additional assumptions require testing
for outliers, normality, multivariate normal distribution, homogeneity of variances-covariance
matrices, and absence of multicollinearity (Tabachnick & Fidell, 2007; Warner, 2013).
To check for univariate outliers, a Box and Whisker plot was created for each group.
Scores that fall outside the adjacent values of more than three standard deviations of the sample
mean would be considered extreme outliers (Tabachnick & Fidell, 2007). Some outliers were
noted: two in Liberal Arts, one in Behavioral Sciences, six in Divinity, one in Sciences &
Technology, and two in Fine & Performing Arts. Business and Government had no outliers at
all. The outliers occurred in each of the four factors, but it is interesting to note that all were at
the low end of the scale; no outliers were found at the high end of the score range. The
inspection of the boxplot for values greater than 1.5 box lengths from the edge of the box,
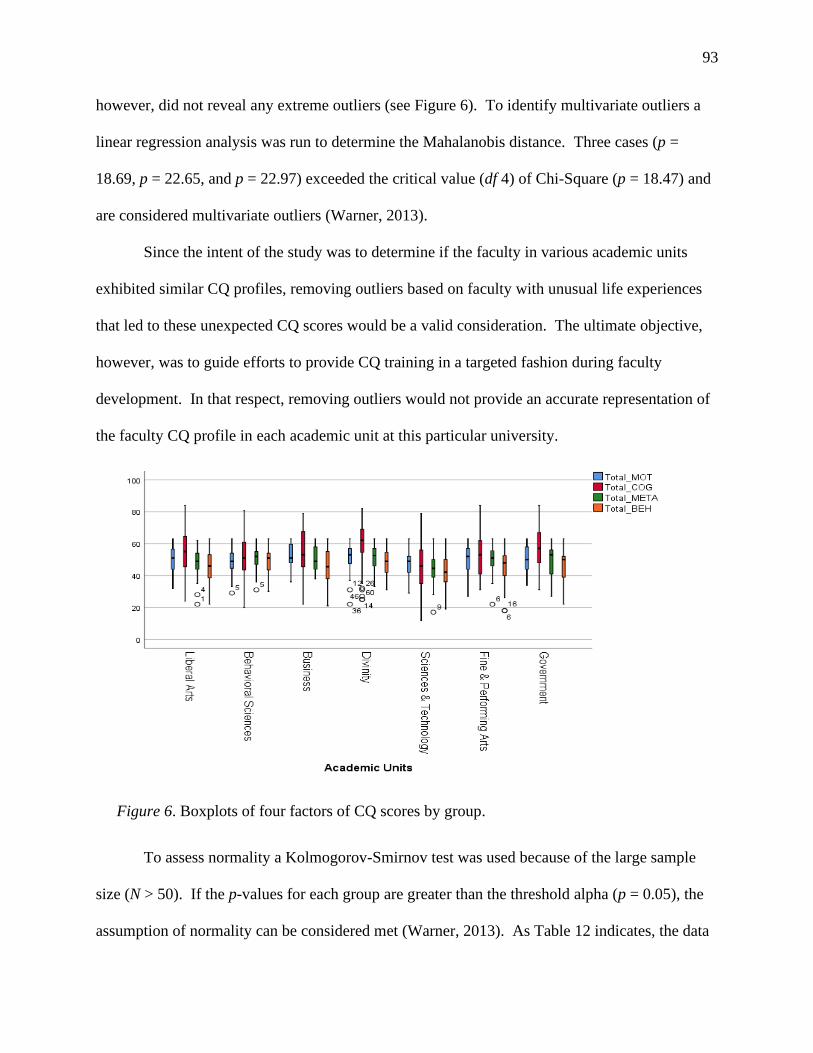
93
however, did not reveal any extreme outliers (see Figure 6). To identify multivariate outliers a
linear regression analysis was run to determine the Mahalanobis distance. Three cases (p =
18.69, p = 22.65, and p = 22.97) exceeded the critical value (df 4) of Chi-Square (p = 18.47) and
are considered multivariate outliers (Warner, 2013).
Since the intent of the study was to determine if the faculty in various academic units
exhibited similar CQ profiles, removing outliers based on faculty with unusual life experiences
that led to these unexpected CQ scores would be a valid consideration. The ultimate objective,
however, was to guide efforts to provide CQ training in a targeted fashion during faculty
development. In that respect, removing outliers would not provide an accurate representation of
the faculty CQ profile in each academic unit at this particular university.
To assess normality a Kolmogorov-Smirnov test was used because of the large sample
size (N > 50). If the p-values for each group are greater than the threshold alpha (p = 0.05), the
assumption of normality can be considered met (Warner, 2013). As Table 12 indicates, the data
Figure 6. Boxplots of four factors of CQ scores by group.
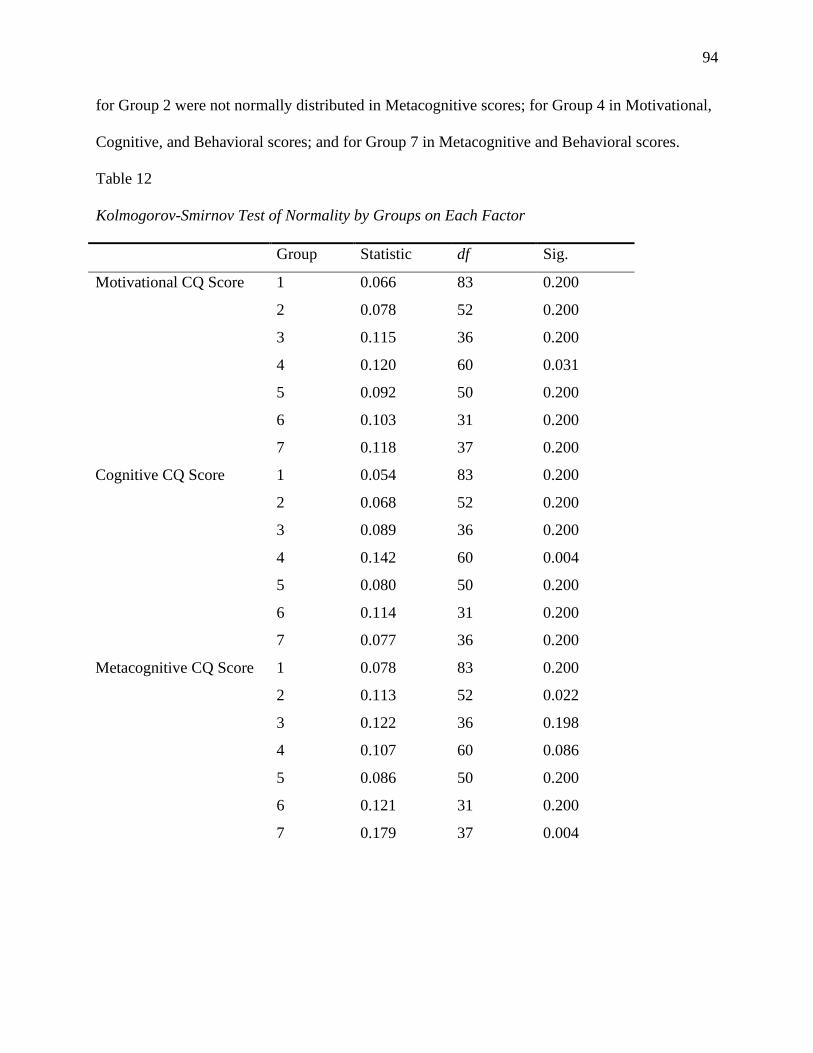
94
for Group 2 were not normally distributed in Metacognitive scores; for Group 4 in Motivational,
Cognitive, and Behavioral scores; and for Group 7 in Metacognitive and Behavioral scores.
Table 12
Kolmogorov-Smirnov Test of Normality by Groups on Each Factor
Group Statistic df Sig.
Motivational CQ Score 1 0.066 83 0.200
2 0.078 52 0.200
3 0.115 36 0.200
4 0.120 60 0.031
5 0.092 50 0.200
6 0.103 31 0.200
7 0.118 37 0.200
Cognitive CQ Score 1 0.054 83 0.200
2 0.068 52 0.200
3 0.089 36 0.200
4 0.142 60 0.004
5 0.080 50 0.200
6 0.114 31 0.200
7 0.077 36 0.200
Metacognitive CQ Score 1 0.078 83 0.200
2 0.113 52 0.022
3 0.122 36 0.198
4 0.107 60 0.086
5 0.086 50 0.200
6 0.121 31 0.200
7 0.179 37 0.004

95
Table 12 (continued)
Behavioral CQ Score 1 0.067 83 0.200
2 0.114 52 0.088
3 0.099 36 0.200
4 0.100 60 0.031
5 0.081 50 0.200
6 0.103 31 0.200
7 0.151 37 0.032
Note. df = degrees of freedom
Due to these violations to normality, the researcher first attempted to use a log
transformation to attempt to bring outliers closer to the mean and reduce the problem of unequal
variance. Warner (2013) describes this technique as mostly used to bring high-end outliers
closer to the mean. As indicated above, the outliers were all at the lower end; thus, the log
transformation yielded no usable results. The non-parametric Kruskal-Wallis H test, which does
not rely on normal distribution, was also considered. The test, however, does require that the
data have a similar distribution pattern across all groups, which was not the case for this data set.
Since the MANOVA is considered robust to violations of normality if the group numbers are
large enough (n > 20), the researcher proceeded with the remaining assumptions testing.
To use MANOVA, the dependent variables should be moderately but not too highly
correlated. A Pearson product-moment correlation coefficient was used to measure the strength
of the linear association between the variables, with r > .8 indicating possible multicollinearity
(Tabachnick & Fidell, 2007). There was no multicollinearity on any of the factors (see Table
13).

96
Table 13
Pearson Product-Moment Correlation
Motivational Cognitive Metacognitive Behavioral
Motivational 1 0.611 0534 0.536
Cognitive 0.611 1 0.620 0.613
Metacognitive 0.534 0.620 1 0.796
Behavioral 0.536 0.613 0.796 1
In a scatterplot matrix for each group, the classic cigar shape was detected on the
scatterplots of each variable for each academic unit. Thus, the assumption of linear relationship
between dependent variables was considered met. The assumption of homogeneity of variance-
covariance matrices was assessed using a Box’s M test. This assumption was considered met (p
= .178). To test equal variance between groups, Levene’s test of equality of variance was
performed with a threshold alpha of p = 0.01 due to the large N as recommended by Warner
(2013). The test was not statistically significant on any of the dependent variables (p = .485, p =
.488, p = .249, and p = .057) and the assumption of homogeneity of variances was also
considered met (see Table 14).
Table 14
Levene’s Test of Equality of Variance: Four Factors of CQ
CQ Factor Levene Statistic df1 df2 Sig.
Motivational 0.914 6 342 0.485
Cognitive 0.526 6 342 0.488
Metacognitive 0.535 6 342 0.249
Behavioral 2.067 6 342 0.57
Note. df = degrees of freedom

97
Results
A one-way MANOVA was conducted on the four factor scores for all groups to evaluate
the null hypothesis that there is no statistically significant difference in the CQ scores of faculty
in individual academic units when compared to other units. There was a statistically significant
difference, at an alpha of 0.05, between the academic units on the combined dependent
variables, F(24, 1183) = 2.577, p < .001; Wilks' Λ = .837, partial η2 = .043 (see Table 15).
Table 15
Multivariate Results for Four CQ Factors
Variable Wilks’ Λ df F Sig. Partial η2
Groups .837 24 2.577 0.000 0.43
Error 1183.84
Note. df = degrees of freedom
Table 16
ANOVA Results for Four CQ Factors
Variable df MS F Sig. Partial η2
Cognitive
Score 6 912.219 4.639 0.000 0.075
Error 342 196.643
Metacognitive
Score 6 235.929 3.487 0.002 0.058
Error 342 67.656
Motivational
Score 6 96.727 1.507 0.175 0.026
Error 342 64.179
Behavioral
Score 6 244.735 2.422 0.026 0.041
Error 342 101.056

98
Examination of the analysis of each factor indicated the following results:
H02: There was a statistically significant difference in Cognitive CQ scores between the faculty
from different academic units, F(6, 342) = 4.639, p < .001, partial η2 = .075 (see Table 16).
According to Warner (2013), the critical value of F is 2.09 (α = .5, df1 = 6, df2 > 120). Because
F > F-critical and p < .05, the null was rejected. For effect size, η2 was used to indicate the
proportion of the Cognitive CQ score variance that is predictable from group membership
(Warner, 2013). The data show the partial eta squared (η2 = .075) reflects a medium effect size
with 7% of the variance being attributable to group membership (Warner, 2013, p. 208).
Post hoc comparisons using Tukey HSD were conducted to reduce the risk of Type I
error and to determine which pairwise comparisons were significant at an alpha of 0.05. The test
indicated there is a statistically significant difference in Cognitive scores between Group 5 and
Groups 1, 4, and 7, as well as between Group 4 and Group 2. The Cognitive score for Group 5
(M = 46.3, SD = 15.6) is 12.8 points lower (95% CI, 4.8 to 20.7) than Group 4 (M = 59.1, SD =
14.3), 10.6 points lower (95% CI, -6.5 to 10.9) than Group 7 (M = 56.9, SD = 13.5), and 8.5
points lower (95% CI, -2.8 to 11.3) than Group 1 (M = 54.8, SD = 12.114). The Cognitive score
of Group 2 (M = 50.9, SD = 12.5) is 8.2 points lower (95% CI, -16.1 to -.3) than Group 4 (M =
59.1, SD = 14.3).
H03: There was a statistically significant difference in the Metacognitive CQ scores between the
faculty from different academic units, F(6, 342) =3.487, p = .002, partial η2 = .058 (see Table
16). According to Warner (2013), the critical value of F is 2.09 (α = 0.5, df1 = 6, df2 > 120).
Because F > F-critical and p < .05, the null was rejected. For effect size, η2 was used to indicate
the proportion of the Metacognitive CQ score variance that is predictable from group
membership (Warner, 2013). The data show the partial eta squared (η2 = 0.058) reflects a

99
medium effect size with almost 6% of the variance being attributable to group membership
(Warner, 2013, p. 208).
Post hoc comparisons using Tukey HSD were conducted to determine which pairwise
comparisons were significant at an alpha of 0.05. The test indicated there is a statistically
significant difference in the Metacognitive scores of faculty in Group 5 when compared to
Groups 2, 3, 4, and 6. The Metacognitive score for Group 5 (M = 44.7, SD = 9.7) is 6.3 points
lower (95% CI, - 11.0 to -1.7) than Group 4 (M = 51.0, SD = 7.3), 5.9 points lower (95% CI, -
10.7 to -1.0) than Group 2 (M = 50.6, SD = 7.4), 5.6 points lower (95% CI, - 11.2 to -.01) than
Group 6 (M = 50.3, SD = 8.9), and 5.4 points lower (95% CI, - 10.7 to -.1) than Group 3 (M =
50.1, SD = 7.8).
H04: There was no statistically significant difference in the Motivational CQ scores between the
faculty from different academic units, F(6, 342) = 1.507, p = .175, partial η2 = .026 (see Table
16). Therefore, null hypothesis four could not be rejected and no pairwise comparison was
conducted.
H05: There was a statistically significant difference in the Behavioral CQ scores between the
faculty from different academic units, F(6, 342) = 2.422, p = .026; partial η2 = .041 (see Table
16). According to Warner (2013), the critical value of F is 2.09 (α = .5, df1 = 6, df2 > 120).
Because F > F-critical and p < .05, the null was rejected. For effect size, η2 was used to indicate
the proportion of the Behavioral CQ score variance that is predictable from group membership
(Warner, 2013). The data show the partial eta squared (η2 = .041) reflects a medium effect size
with 4% of the variance being attributable to group membership (Warner, 2013, p. 208).
Post hoc comparisons using Tukey HSD were conducted to limit the risk of Type I error
and to determine which pairwise comparisons were significant at an alpha of 0.05. The test
100
indicated there is a statistically significant difference in the Behavioral scores of faculty in Group
5 when compared to Groups 2 and 4. The Behavioral score for Group 5 (M = 42.7, SD = 10.7) is
6.4 points lower (95% CI, -12.3 to -5.3) than Group 2 (M = 49.1, SD = 7.8), and 5.9 points lower
(95% CI, -11.6 to -0.2) than Group 4 (M = 48.6, SD = 8.9).
Summary of the Results
The purpose of this study was to determine if the faculty in one academic unit have
different levels of Cultural Intelligence when compared with other units. The Composite CQ
scores, as well as the four CQ factors (Cognitive, Metacognitive, Motivational, and Behavioral)
as measured by the Expanded Cultural Intelligence Scale (ECQS) were analyzed to understand
whether all academic units require the same amount or type of CQ training. The analysis
revealed that there is no statistically significant difference between academic units in
Motivational scores. There are, however, statistically significant differences in Composite,
Cognitive, Metacognitive, and Behavioral scores. Pairwise comparisons indicated Group 5
(Sciences & Technology) consistently scored significantly lower across the board, except in
Motivational CQ. It was lower in Composite CQ than Group 4 (Divinity); lower in Cognitive
CQ than Groups 1 (Liberal Arts), 4, and 7 (Government); and lower in Metacognitive CQ than
Groups 2 (Behavioral Sciences), 3 (Business), 4, and 6 (Fine & Performing Arts). The only
statistically significant pairwise comparison that did not involve Group 5 was the significantly
lower score recorded by Group 2 compared to Group 4 in Cognitive CQ.

101
CHAPTER FIVE: CONCLUSIONS
Overview
This quantitative causal-comparative study examined the Cultural Intelligence (CQ) of
faculty in various academic units of a university in order to determine whether they exhibit
differing levels of CQ from the faculty in other units. The study compared the group means of
faculty using their Composite, Metacognitive, Cognitive, Motivational, or Behavioral scores on
the Expanded Cultural Intelligence Scale (Van Dyne et al., 2012) as the dependent variables. A
one-way ANOVA was performed on the Composite score and a MANOVA on the four factors
of CQ. The participants were divided into seven groups based on the academic unit in which
they teach. The current study is significant because the findings indicate there are differences
between groups. This chapter will discuss findings, implications for practice, limitations, and
recommendations for future research.
Findings
An increasingly important competence today is knowing how to relate to people of
different cultures (Dusi, Messetti, & Steinbach, 2014). Cultural Intelligence is now considered
an essential attribute college graduates need before entering the globalized workforce
(Association of American Colleges and Universities, 2011; Berdan, 2012; Griffith et al., 2016;
Hart Research Associates, 2015). The purpose of this study was to better understand the CQ
makeup of faculty who are charged with helping students develop CQ. This information can
inform decisions about how to best allocate time and resources during faculty development by
determining whether all academic units within a university need training or which specific units
may need additional training in some or all components of CQ. As no prior research existed to

102
investigate faculty CQ, this initial study was conducted to determine whether any differences
existed between the various academic units.
For this study, the researcher contacted all undergraduate faculty at this institution and
asked them to take the E-CQS as well as provide some additional answers to a demographic
questionnaire. Out of 1,761 faculty members contacted, 349 participants completed all the
questions required to be included in the data analysis: all questions on the E-CQS, as well as
indicating in which school they teach so they could be assigned to a group. To reduce the
number of groups to a manageable size and avoid having to exclude some schools with small
faculty or too few participants, several schools were grouped together. The following groups
were thus used for data analysis: Group 1- Liberal Arts was made up of the College of Arts &
Sciences and the College of Applied Studies & Academic Success; Group 2 - Behavioral
Sciences combined the School of Behavioral Sciences and the School of Education; Group 5 -
Sciences and Technology included the School of Aeronautics, School of Engineering, School of
Health Sciences, and School of Nursing; Group 6 - Fine & Performing Arts was composed of
the School of Music, School of Communication and Digital Content, and School of Visual &
Performing Arts. Three schools had enough participants to remain distinct academic units:
Group 3 - School of Business, Group 4 - School of Divinity, and Group 7 - School of
Government. A one-way analysis of variance was then conducted on the Composite CQ score
and a one-way MANOVA on the four factors: Metacognitive, Cognitive, Motivational, and
Behavioral CQ scores for each group. Data analysis revealed statistically significant differences
in Composite, Metacognitive, Cognitive, and Behavioral CQ between some academic units, but
not in Motivational CQ.

103
Discussion of Results
The results of the ANOVA and MANOVA conducted to compare the CQ levels of
faculty in individual academic units indicated that there were statistically significant differences
between groups on the Composite score as well as the Cognitive, Metacognitive, and Behavioral
CQ scores but not on Motivational CQ. Pairwise comparisons showed Group 5 (Sciences &
Technology) scores to be significantly lower than a number of other groups in all aspects of CQ
except Motivational CQ.
As no study has ever investigated the differences in CQ levels of faculty, the results of
this study neither support nor contradict prior findings but invite additional study. The School of
Divinity ranked in the top two of mean scores on every dependent variable. It ranked number
one in Composite, Cognitive, and Metacognitive CQ and number two in Motivational and
Behavioral. This indicates that the shared educational and personal experiences of faculty in this
group contribute to the acquisition of knowledge about cultural differences and the awareness of
their own self-conceptions and mental functioning (Earley & Ang, 2003). On the opposite
spectrum, Group 5 consistently ranked the lowest on all five dependent variables. As would be
expected from disciplines centered on Science and Technology, the faculty in these schools do
not seem to have benefited from the same exposure to cultural experiences in the course of their
academic training. By extension, their students probably also lack those opportunities and would
benefit from intentional inclusion of such experiences into their curriculum.
Group 2/Behavioral Sciences seems to be aptly named as it ranked highest of all groups
in Behavioral CQ and second in Metacognitive CQ. It was interesting to note, however, that the
group ranked below the mean in Cognitive and Motivational CQ. Their training clearly imparted
on them the awareness of self and mental functioning related to metacognition as well as the aim

104
to regulate their social behavior to reduce misperceptions related to Behavioral CQ (Earley &
Ang, 2003). Group 7/Government, on the other hand, ranked above the mean in Cognitive and
Metacognitive CQ, congruent with the amount of knowledge about other countries required from
government majors, but below the mean in Motivational and Behavioral. Their educational path
possibly prepared them more for comparative studies of governments but not the intent to live in
other cultures. Not surprisingly, Group 3/Business consistently ranked above the mean on all
five dependent variables and was ranked number one in Motivational CQ. As shown in the
review of literature, the vast majority of studies on CQ originate in the field of business. It is,
therefore, no surprise that faculty in the School of Business would be highly aware of Cultural
Intelligence. Because of the importance of CQ on the bottom line for international businesses
(Alon & Higgins, 2005; Ansari et al., 2012; Barakat et al., 2015; Carpenter et al., 2001; Cho &
Morris, 2015; Daily et al., 2000; Imai & Gelfand, 2010; Jyoti & Kour, 2015; Konanahalli et al.,
2014; Livermore, 2015), courses in business seem to incorporate the teaching of knowledge of
other cultures but also sensitize students to the “motivation to engage the world around them”
(Earley & Ang, 2003, p. 124).
In order to better understand some of the differences between individuals or groups, the
researcher asked participants to answer some questions about their personal experiences with
other cultures. When Earley and Ang (2003) defined Cultural Intelligence, they did so as a
construct determined by an interaction between genetic and environmental factors. Just like
academic intelligence is widely acknowledged as being influenced by childhood experiences,
parenting, and education, they determined that CQ is likewise affected by these elements, not
just by an individual’s genes. Since CQ is a malleable trait and has been linked to personal and
educational experiences (Earley & Ang, 2003), this study asked questions about the participants’

105
experience with other cultures, the number of countries they have visited, the number of
countries they have lived in, and their level of experience with other languages. Based on
indicators from previous studies on CQ these elements all influence CQ in an individual (Alon et
al., 2018; Crowne, 2008, 2013; Koo Moon et al., 2012; Lenartowicz et al., 2014; Ng et al., 2009;
Presbitero, 2019; Shannon & Begley, 2008; Takeuchi et al., 2005). Seventy-four participants
indicated they had little experience interacting with people from other countries, 152 said they
were moderately experienced, and 123 answered very experienced. Twenty-nine participants
stated they had never been outside the United States, and of the remaining participants, 202 had
only visited but never lived more than two months in other countries. Those who lived abroad (n
= 117) indicated they lived in anywhere between one and 22 other countries, with three countries
having the highest frequency (n = 19) and one country the second highest frequency (n = 13).
Though the majority of faculty have not lived in another country, they are very well-travelled
with answers about the number of countries visited by an individual listed as anywhere between
one and 70 countries. Of the 320 participants who indicated they had been abroad, more than
one third (n = 116) had been to more than ten different countries and 14 have visited more than
30 countries each.
Reflections on Groupings
Ideally, analyses of group differences are performed on groups that are fairly
homogenous (Warner, 2013). While some schools within a university are fairly homogenous in
terms of the educational path their faculty followed to become credentialed to teach the content,
other schools such as Liberal Arts have a wide range of content and backgrounds. “In many
quantitative studies, it is desirable to break groups into subgroups for further analysis” (Gall et
al., 2007, p. 176); therefore, it would have been preferable to be able to subdivide such a diverse

106
school into its individual departments, but this would have resulted in group sizes much smaller
than the required 30. In fact, with the small number of faculty or the small number of
respondents, some schools had to be combined. The faculty were divided into seven groups
based on the schools in which they teach: Group 1 - Liberal Arts (College of Arts & Sciences
and College of Applied Studies & Academic Success), Group 2 - Behavioral Sciences (School of
Behavioral Sciences and School of Education), Group 3 - School of Business, Group 4 - School
of Divinity, Group 5 - Sciences and Technology (School of Aeronautics, School of Engineering,
School of Health Sciences, and School of Nursing), Group 6 - Fine & Performing Arts (School
of Music, School of Communication and Digital Content, and School of Visual & Performing
Arts), and Group 7 - School of Government. Another concern in an analysis based on group
mean is the uneven group size: Group 1 (n = 83), Group 2 (n = 52), Group 3 (n = 36), Group 4 (n
= 60), Group 5 (n = 50), Group 6 (n = 31), Group 7 (n = 37). The new groupings and uneven
group sizes may have affected the results.
Knowledge Gained from Outliers
As noted in the results from Chapter 4, it was interesting to note that all outliers in any of
the scores across all groups occurred on the low end. The lowest number of points it was
possible to score on each factor was earned just once (a Cognitive CQ score of 12), yet the
highest possible score was reached 24 times for Motivational, three times for Cognitive, nine
times for Metacognitive, and 19 times for Behavioral CQ. Not a single group or factor included
a datapoint that was an outlier above the mean. This study was conducted with college faculty, a
population that has a higher than normal level of education, since all are required to have at least
a master’s degree to teach at the postsecondary level, and 200 have earned a terminal degree.
This population would be likely to have a higher level of Cognitive and Metacognitive CQ than

107
the general population, though Motivational and Behavioral CQ would not necessarily be
influenced by educational level. Earley and Ang (2003) stated that personal and cultural values,
efficacy expectations, and goal setting affect motivation while the desire to minimize
misperceptions impacts the ability to manage one’s social behavior. To better understand the
low scores of these outliers, the researcher looked at the answers that participants provided to the
additional questions included with the E-CQS in the survey.
Two outliers were noted in Group 1/Liberal Arts, both in the Metacognitive CQ category.
One was about 2.5 and the other 3.3 standard deviations from the group mean. One participant
had been abroad, while the other had spent a matter of days visiting two countries. Both had just
a beginning level of foreign language learning. Group 2/Behavioral Sciences recorded just one
outlier. This datapoint was an outlier in both Motivational and Metacognitive CQ by 2.9 and 2.5
standard deviations from the mean respectively. This participant had not spent any time outside
the United States and had just a beginning-level knowledge of one foreign language.
Group 4/Divinity registered the highest number of outliers with two in Motivational and
five in Cognitive CQ (with one datapoint being an outlier in both). Of the five outliers, four did
not have any foreign language knowledge. One participant indicated having learned four foreign
languages but listed the proficiency in each as “n/a,” leading the researcher to believe that the
selection of the number of foreign languages learned may have been in error. The remaining
outlier listed beginning-level proficiency in one foreign language. Only one of these participants
had lived in another country, but all had visited between two and eight foreign countries. The
number of outliers in this one group may indicate a wider range of personal or educational
experiences among the faculty in this school than in other groups.

108
Only one participant in Group 5/Sciences & Technology was an outlier in Metacognitive
CQ by a standard deviation of 2.8 below the group mean. This participant had learned one
foreign language at a beginning level and had never been abroad. Of the two outliers in Group
6/Fine & Performing Arts, one participant was the sole outlier among the Composite CQ scores
across all groups. The mean scores in Composite, Motivational, Cognitive, Metacognitive, and
Behavioral CQ for Group 6 were all very close to the overall mean. For this one outlier,
however, the scores were within one standard deviation below the mean on Motivational and
Cognitive, but more than two standard deviations below the mean on Metacognitive and
Behavioral. From the participant’s answers on the questionnaire, it was determined that this
individual had never lived abroad and spent only days visiting two foreign countries. The
participant had learned only one foreign language to a beginning-level proficiency. The second
outlier found in Group 6 was only an outlier in the Behavioral CQ with a score more than two
standard deviations below the mean. This participant has never lived abroad nor learned another
language but has spent over a month visiting two foreign countries.
Business and Government had no outliers at all. It is relevant to note that the two schools
without any outliers were two groups consisting of one single school each, not a combination of
schools. This raises the concern that the need to combine several schools into groups may have
introduced an element that could distort the group mean. In the School of Engineering only two
faculty members responded, but there is no way to determine whether this lack of participation is
due to its faculty’s perception that Cultural Intelligence is irrelevant to the engineering or merely
to a busy schedule. It is, therefore, impossible to have an accurate evaluation of the average CQ
of faculty in that school and their inclusion in the Group 5 may have skewed the data for the
other schools included in this group.

109
Implications for Practice
Developing Cultural Intelligence starts with a study of self (Griffer & Perlis, 2007),
which applies to the institutional level as well as the individual. The analysis of the data
gathered from this study revealed that there are statistically some significant differences between
academic units at this university. A frequent complaint of faculty is the wasting of time during
faculty development on presentations or training that is not applicable to them or not conducive
to improving teaching in their specific discipline. Yet faculty are eager to learn new and more
effective teaching methodologies (Dar et al., 2016). The findings of this study indicate the need
to consider administering different levels and types of CQ training to various units within this
institution. The implications, however, extend to every institution of higher learning that aims to
prepare students for today’s workforce. This would ensure faculty development includes
targeted training to raise the faculty CQ of each individual group, but also pedagogical tools they
can in turn use to raise the CQ level of their students using activities that are appropriate to their
discipline. Due to the grouping needs addressed above, however, the study may need to be
replicated with all faculty and not merely volunteer participants before decisions are made on
training needs by school.
Beyond implications for faculty development, this study also provides some ideas for
integrating additional elements into the educational experience of students. The investigation of
outliers provided some insight into the antecedents of CQ among faculty, supporting the limited
prior research indicating a link between CQ levels and foreign language learning, exposure to
cultural knowledge and experiences, and opportunities to live and study abroad (Alon et al.,
2018; Crowne, 2008, 2013; Koo Moon et al., 2012; M. Li & Mobley, 2010; Shannon & Begley,
2008; Takeuchi et al., 2005; Wood & St. Peters, 2014).
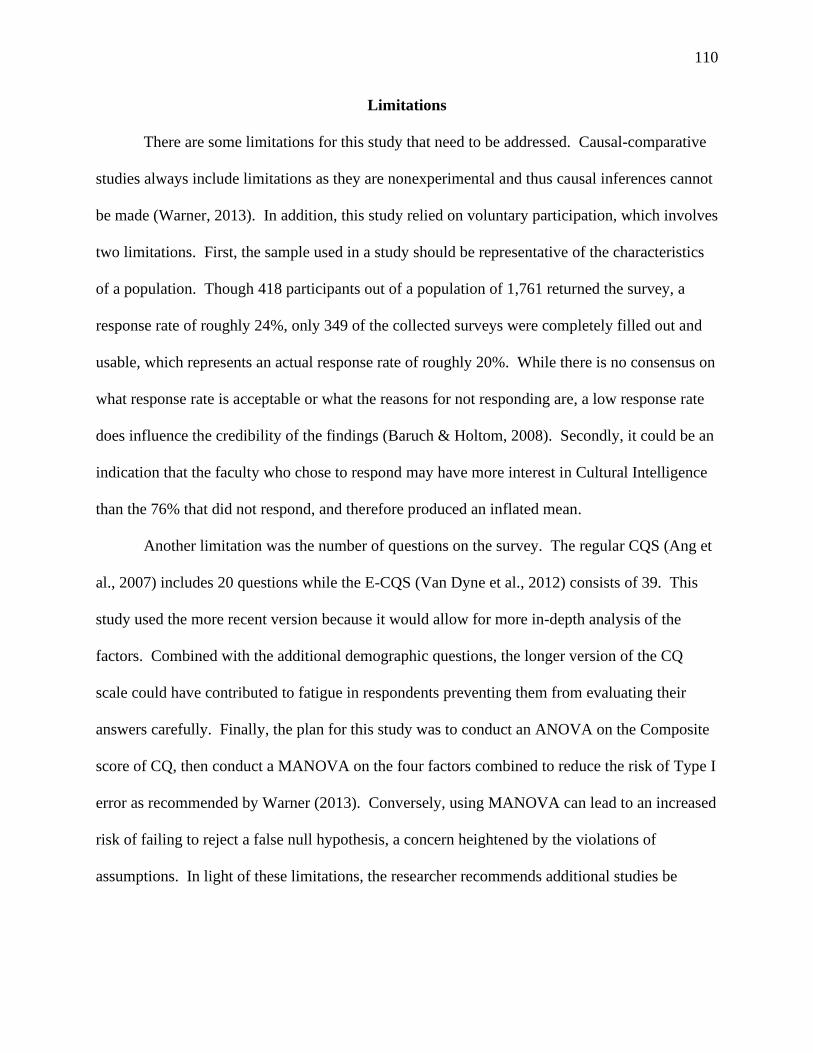
110
Limitations
There are some limitations for this study that need to be addressed. Causal-comparative
studies always include limitations as they are nonexperimental and thus causal inferences cannot
be made (Warner, 2013). In addition, this study relied on voluntary participation, which involves
two limitations. First, the sample used in a study should be representative of the characteristics
of a population. Though 418 participants out of a population of 1,761 returned the survey, a
response rate of roughly 24%, only 349 of the collected surveys were completely filled out and
usable, which represents an actual response rate of roughly 20%. While there is no consensus on
what response rate is acceptable or what the reasons for not responding are, a low response rate
does influence the credibility of the findings (Baruch & Holtom, 2008). Secondly, it could be an
indication that the faculty who chose to respond may have more interest in Cultural Intelligence
than the 76% that did not respond, and therefore produced an inflated mean.
Another limitation was the number of questions on the survey. The regular CQS (Ang et
al., 2007) includes 20 questions while the E-CQS (Van Dyne et al., 2012) consists of 39. This
study used the more recent version because it would allow for more in-depth analysis of the
factors. Combined with the additional demographic questions, the longer version of the CQ
scale could have contributed to fatigue in respondents preventing them from evaluating their
answers carefully. Finally, the plan for this study was to conduct an ANOVA on the Composite
score of CQ, then conduct a MANOVA on the four factors combined to reduce the risk of Type I
error as recommended by Warner (2013). Conversely, using MANOVA can lead to an increased
risk of failing to reject a false null hypothesis, a concern heightened by the violations of
assumptions. In light of these limitations, the researcher recommends additional studies be

111
conducted on the CQ of faculty before decisions are reached about the type and amount of CQ
training that is required for various academic units.
Recommendations for Future Research
As indicated above, this study is the first to look at the CQ makeup of faculty. It should
be replicated in a similar setting to confirm the results. Ideally, a study into the difference of
faculty CQ across departments would include enough participants in each to break down each
school into individual department, creating groups that are more homogenous. A group such as
Liberal Arts includes too many departments with very diverse characteristics to yield accurate
results when aggregated.
Taylor et al. (2013) considered culturally competent faculty of such importance to a faith-
based institution that they created a pilot program to develop it from a cognitive, affective, and
spiritual perspective. No doubt one can expect differences in the faculty between a faith-based
and a secular university. To determine whether the faith-based setting for this study had an
impact on the results, it would therefore also be informative to replicate the study at a secular
university because each institution’s theology, climate, culture, and population guide its efforts
to develop culturally competent faculty (McNeil & Pozzi, 2011).
With the prevalence of online education, some additional angles of research to consider
are whether there are differences in CQ between online and residential faculty. More
importantly, researching the perception of online students of the Cultural Intelligence of the
online faculty and course designers would provide valuable insight to improve courses. As
online students are much more diverse than traditional residential students, Cultural Intelligence
is particularly relevant to making them feel welcome in their learning environment.

112
It is possible that continuing to compare CQ scores across groups of faculty may yield
limited benefits beyond knowing whether to offer Cultural Intelligence training to all the faculty
or only to the departments in need. Antecedents of CQ, however, is an area that greatly needs
additional research. Much research has been done about the benefits of having high CQ levels in
a variety of settings, but in order to help students develop CQ, it is imperative to find out more
about what factors actually contribute to higher levels of CQ. Due to their diversity in
background and experiences, faculty and students can be an excellent source of knowledge on
possible antecedents of CQ. With better understanding of what leads to higher levels of CQ,
more attention can then be given to what strategies are effective in providing those experiences
in a targeted fashion in the classroom.
In their recent study on the antecedents of business CQ in professionals, Alon et al.
(2018) summarized how learning a foreign language provides exposure to the culture associated
with it:
Language trainers transfer traditions, literature, cultural values, and assumptions to
individuals, who then benefit from enhanced cultural knowledge and intercultural skills.
Speaking a foreign language fluently cannot be achieved without adapting to how native
speakers think, as the individual learns to adapt to the structure and rationale of the
foreign language. (p. 239)
This relationship between learning a language and CQ has been mentioned in theoretical terms in
many studies, but before Alon et al. (2018) only one empirical study investigated the relationship
between language skills and CQ. It determined that learning new languages was related to
Cognitive and Behavioral CQ among university students in Ireland (Shannon & Begley, 2008).

113
When investigating the outliers, which were all recorded at the low end of the scale on
the four factors, the researcher looked at the answers that participants provided on their foreign
language experience and on the amount of time spent in other countries. The participants whose
scores constituted outliers in this study all reported very little foreign language knowledge or
living abroad experience. This seems to indicate there is a clear need to further investigate travel
experience along with foreign language learning as antecedents of CQ. It would also help
confirm Alon et al.’s claim that the “key antecedents are, in order of importance from high to
low, the number of countries lived in for six months or more, education level, and number of
languages spoken” (2018, p. 247). Future research should thus investigate what kind of language
learning is most effective. Is it preferable to learn several languages to an intermediate level of
proficiency or to learn one to advanced proficiency? Is there a difference in the CQ gained from
learning a language that is very different from one’s native language (English and Arabic or
Chinese, for instance) compared to learning a language that is closely related (Spanish and
Portuguese, for instance)? As previous studies reported conflicting information about whether
short-term trips to other countries are effective in building CQ, additional studies on the effect of
the length of a stay in another country would also be warranted.
Finally, there has been a lot of research on the type of training that is most effective.
Lenartowicz, Johnson, and Konopaske’s (2014) article proposing improvements to existing
programs provides some guidance to companies on how to train their employees to be effective
in cross-cultural business environments. This is important to businesses as it impacts their
bottom line, but it would seem postsecondary institutions could significantly contribute to the
solution by ensuring graduating students are prepared with adequate CQ before they reach the
workforce. Beyond the above-mentioned language learning and trips abroad, CQ development

114
should be integrated across the curriculum. Yet, there is limited research to indicate which
teaching practices are effective in the classroom beyond some promising recommendations made
by Lopes-Murphy (2014). Additional research on this topic would help faculty better implement
strategies to build CQ into their curriculum.

115
REFERENCES
Ajzen, I. (1991). The theory of planned behavior. Organizational Behavior and Human Decision
Processes, 50(2), 179–211.
Allport, G. W., & Odbert, H. S. (1936). Trait-names: A psycho-lexical study. Psychological
Monographs (Vol. 47).
Alon, I., Boulanger, M., Elston, J. A., Galanaki, E., Martínez de Ibarreta, C., Meyers, J., …
Vélez-Calle, A. (2018). Business cultural intelligence quotient: A five-country study.
Thunderbird International Business Review, 60(3), 237–250.
https://doi.org/10.1002/tie.21826
Alon, I., Boulanger, M., Myers, J., & Taras, V. (2016). The development and validation of the
business cultural intelligence quotient. Cross Cultural and Strategic Management, 23(1),
78–100.
Alon, I., & Higgins, J. M. (2005). Global leadership success through emotional and cultural
intelligences. Business Horizons, 48(6), 501–512.
American Council on the Teaching of Foreign Languages [ACTFL]. (n.d.). Standards for foreign
language learning: Preparing for the 21st century. Retrieved from
http://www.actfl.org/sites/default/files/pdfs/public/StandardsforFLLexecsumm_rev.pdf
American Institute for Foreign Studies. (2013). AIFS study abroad outcomes report. American
Institute for Foreign Studies.
Ang, S., Rockstuhl, T., & Tan, M. L. (2015). Cultural intelligence and competencies.
International Encyclopedia of the Social & Behavioral Sciences, 5, 433–439.
Ang, S., & Van Dyne, L. (2009). Handbook of cultural intelligence: Theory, measurement, and
applications. Armonk, GB: Routledge.
116
Ang, S., Van Dyne, L., & Koh, C. (2006). Personality correlates of the four-factor model of
cultural intelligence, 31(1), 100–123.
Ang, S., Van Dyne, L., Koh, C., Ng, K.-Y., Templer, K. J., Tay, C., & Chandrasekar, N. A.
(2007). Cultural intelligence: Its measurement and effects on cultural judgment and decision
making, cultural adaptation, and task performance. Management and Organization Review,
3, 335–371.
Ang, S., Van Dyne, L., & Rockstuhl, T. (2015). Cultural Intelligence origins, conceptualization,
evolution, and methodological diversity. In M. J. Gelfand, C. Y. Chiu, & Y. Y. Hong (Eds.),
Handbook of advances in culture and psychology (Vol. 5) (pp. 273–323). Oxford
Scholarship Online.
Ansari, M. I., Radmehr, R., & Shalikar, M. (2012). Analysis the relationship between cultural
intelligence and transformational leadership (The case of managers at the trade office).
International Journal of Business and Social Science, 3(14), 252–261.
Arnold, M. (1932). Culture and anarchy: Landmarks in the history of education. Cambridge,
UK: Cambridge University Press.
Arora, P., & Rohmetra, N. (2010). Cultural Intelligence: Leveraging differences to bridge the
gap in the international hospitality industry. International Review of Business Research
Papers, 6(5), 216–234.
Association of American Colleges and Universities. (2011). The LEAP vision for learning:
Outcomes, practices, impact, and employers’ views. Peer Review, 13(2), 1–28.
Azizi, Z., Fatemi, A. H., Pishghadam, R., & Ghapanchi, Z. (2015). Investigating the relationship
between Iranian EFL learners’ cultural intelligence and their home cultural attachment.
Mediterranean Journal of Social Sciences, 6(3), 575–585.

117
Bandura, A. (1977a). Self-efficacy: Toward a unifying theory of behavioral change.
Psychological Review, 84(2), 191–215.
Bandura, A. (1977b). Social learning theory. Englewood Cliffs, NJ: Prentice-Hall.
Bandura, A. (2002). Social cognitive theory in a cultural context. Applied Psychology: An
International Review, 51, 269–290.
Banks, J. A. (2008). An introduction to multicultural education. Boston, MA: Pearson Allyn &
Bacon.
Barakat, L. L., Lorenz, M. P., Ramsey, J. R., & Cretoiu, S. L. (2015). Global managers: An
analysis of the impact of cultural intelligence on job satisfaction and performance.
International Journal of Emerging Markets, 10, 781–800.
Barker, M. C., & Mak, A. S. (2013). From classroom to boardroom and ward: Developing
generic intercultural skills in diverse disciplines. Journal of Studies in International
Education, 17(5), 573–589.
Baruch, Y., & Holtom, B. C. (2008). Survey response rate levels and trends in organizational
research. Human Relations, 61(8), 1139–1160. https://doi.org/10.1177/0018726708094863
Berdan, S. N. (2012). Preparing our students for the global marketplace. Huffpost. Retrieved
from http://www.huffingtonpost.com/stacie-nevadomski-berdan/preparing-our-students-
fo_b_1189512.html
Bhawuk, D. P. S., & Brislin, R. (2000). Cross-cultural training: A review. Applied Psychology:
An International Review, 49(1), 162–192.
Billings, N. C. (2006). Bringing globalization into the classroom. Journal of Family and
Consumer Sciences, 98(3), 48–50.
Black, H. T., & Duhon, D. L. (2006). Assessing the impact of business study abroad programs on

118
cultural awareness and personal development. Journal of Education for Business, 81(3),
140–144.
Blasco, M., Feldt, L. E., & Jakobsen, M. (2012). If only cultural chameleons could fly too: A
critical discussion of the concept of cultural intelligence. International Journal of Cross
Cultural Management, 12(2), 229–245.
Boas, F. (1940). Race, language and culture. New York, NY: Macmillan.
Brewer, E. W., & Kuhn, J. (2010). Encyclopedia of research design: Vol. 1. In N. J. Salkind
(Ed.) (pp. 124–130). Thousand Oaks, CA: SAGE Publications.
Broido, E. M. (2004). Understanding diversity in millennial students. New Directions for Student
Services, 2004(106), 73–85. Retrieved from http://doi.wiley.com/10.1002/ss.126
Bronfenbrenner, U., & Ceci, S. J. (1994). Nature-nurture reconceptualized in developmental
perspective: A bioecological model. Psychological Review, 101(4), 568–586.
Brown, D. E. (1991). Human universals. New York, NY: McGraw-Hill.
Bücker, J., Furrer, O., & Lin, Y. (2015). Measuring cultural intelligence (CQ): A new test of the
CQ scale. International Journal of Cross Cultural Management, 15(3), 259–284.
Bücker, J., Furrer, O., & Peeters Weem, T. (2016). Robustness and cross-cultural equivalence of
the Cultural Intelligence Scale (CQS). Journal of Global Mobility: The Home of Expatriate
Management Research, 4(3), 300–325.
Burdick, E., & Lederer, W. J. (1958). The ugly American. New York, NY: W.W. Norton.
Byram, M. (1997). Teaching and assessing intercultural communicative competence. Bristol,
PA: Multilingual Matters.
Camblin, L. D. J., & Steger, J. A. (2000). Rethinking faculty development. Higher Education,
39(1), 1–18.

119
Carpenter, M. A., Sanders, W. G., & Gregersen, H. B. (2001). Bundling human capital with
organizational context: The impact of international assignment experience on multinational
firm performance and CEO pay. Academy of Management Journal, 44, 493–511.
Chao, M. M., Takeuchi, R., & Farh, J. L. (2017). Enhancing cultural intelligence: The roles of
implicit culture beliefs and adjustment. Personnel Psychology, 70(1).
https://doi.org/10.1111/peps.12142
Chen, A. S., Lin, Y. C., & Sawangpattanakul, A. (2011). The relationship between cultural
intelligence and performance with the mediating effect of culture shock: A case from
Philippine laborers in Taiwan. International Journal of Intercultural Relations, 35(2), 246–
258.
Chen, G., Kirkman, B. L., Kim, K., Farh, C. I., & Tangirala, S. (2010). When does cross-cultural
motivation enhance expatriate effectiveness? A multilevel investigation of the moderating
roles of subsidiary support and cultural distance. Academy of Management Journal, 53,
1110–1130. https://doi.org/10.5465/AMJ.2010. 54533217
Chen, X. P., Liu, D., & Portnoy, R. (2011). A multilevel investigation of motivational cultural
intelligence, organizational diversity climate, and cultural sales: Evidence from U.S. real
estate firms. Journal of Applied Psychology. https://doi.org/10.1037/a0024697
Chiu, C. Y., Gries, P., Torelli, C. J. J., & Cheng, S. Y. Y. (2011). Toward a social psychology of
globalization. Journal of Social Issues, 67, 663–676.
Cho, J., & Morris, M. W. (2015). Cultural study and problem-solving gains: Effects of study
abroad, openness, and choice. Journal of Organizational Behavior, 36(7), 944–966.
Choudhury, M. H. (2013). Teaching culture in EFL: Implications, challenges and strategies.
Journal of Humanities and Social Science, 13(1), 20–24.

120
Chua, R. Y., & Morris, M. W. (2009). Innovation communication in multicultural networks:
Deficits in intercultural capability and affect-based trust as barriers to new idea sharing in
intercultural relationships. Harvard Business School.
Cochran, J. L., McCallum, R. S., & Bell, S. M. (2010). Three A’s: How do attributions, attitudes,
and aptitude contribute to foreign language learning? Foreign Language Annals, 43, 566–
582.
Cohen, A. M., Brawer, F. B., & Kisker, C. B. (2013). The American community college (6th ed.).
San Francisco, CA: Jossey-Bass.
Conway, J. M., & Lance, C. E. (2010). What reviewers should expect from authors regarding
common method bias in organizational research. Journal of Business and Psychology,
25(3), 325–334.
Coryn, C. L., & Hobson, K. A. (2010). Using nonequivalent dependent variables to reduce
internal validity threats in quasi‐experiments: Rationale, history, and examples from
practice. New Directions for Evaluation, 131, 31–39.
Costa, P. T., & McCrae, R. R. (1992). Revised NEO-Personality Inventory (NEO-PI-R) and NEO
Five-Factor Inventory (NEO-FFI) professional manual. Odessa, FL: Psychological
Assessment Resources.
Crowne, K. A. (2008). What leads to cultural intelligence? Business Horizons, 51, 391–399.
Crowne, K. A. (2009). The relationships among social intelligence, emotional intelligence and
cultural intelligence. Organization Management Journal, 6, 148–163.
Crowne, K. A. (2013). Cultural exposure, emotional intelligence, and cultural intelligence: An
exploratory study. International Journal of Cross Cultural Management, 13(1), 5–22.
Daily, C. M., Certo, S. T., & Dalton, D. R. (2000). International experience in the executive

121
suite: The path to prosperity? Strategic Management Journal, 21, 515–523.
Dar, S., Jabeen, N., Jadoon, Z. I., & Dar, I. S. (2016). Faculty development programs and their
effect on individual and organizational performance in Pakistan. Pakistan Vision, 17(2),
318–364.
Davis, K. D. (2009). Cultural intelligence and leadership: An introduction for Canadian Forces
leaders. Kingston, Ontario: Canadian Defence Academy Press.
Desimone, L. M., & Garet, M. S. (2015). Best practices in teachers’ professional development in
the United States. Psychology, Society & Education, 7(3), 252–263.
Dewey, J. (1938). Experience and education. New York, NY: Simon & Schuster.
Dezure, D., Lattuca, L. R., Huggett, K. D., Smith, N. C., & Conrad, C. F. (2014). National
reports on the undergraduate curriculum, traditional and contemporary perspectives:
Innovations in the undergraduate curriculum. Retrieved from
http://education.stateuniversity.com/pages/1896/Curriculum-Higher-Education.html
Digman, J. M. (1990). Personality structure: Emergence of the five-factor model. Annual Review
of Psychology, 41, 417–440.
Dusi, P., Messetti, G., & Steinbach, M. (2014). Skills, attitudes, relational abilities & reflexivity:
Competences for a multicultural society. Procedia - Social and Behavioral Sciences,
112(April), 538–547. https://doi.org/10.1016/j.sbspro.2014.01.1200
Earley, P. C., & Ang, S. (2003). Cultural intelligence: Individual interactions across cultures.
Palo Alto, CA: Stanford University Press.
Earley, P. C., Ang, S., & Tan, J. S. (2006). CQ: Developing cultural intelligence at work. Palo
Alto, CA: Stanford University Press.
Earley, P. C., & Peterson, R. S. (2004). The elusive cultural chameleon: Cultural intelligence as a

122
new approach to intercultural training for the global manager. Academy of Management
Learning and Education, 3, 100–115.
Eccles, J. S., & Wigfield, A. (2002). Motivational beliefs, values, and goals. In S. T. Fiske, D. L.
Schacter, & C. Zahn-Waxler (Eds.), Annual review of psychology (pp. 109–132). Palo Alto,
CA: Annual Reviews.
Egan, M. L., & Bendick, M. J. (2008). Combining multicultural management and diversity into
one course on cultural competence. Academy of Management Learning & Education, 7(3),
387–393.
Elliott, R. W. (2014). Faculty development curriculum: What informs it? The Journal of Faculty
Development, 28(3), 35–45.
Engle, R. L., & Crowne, K. A. (2014). The impact of international experience on cultural
intelligence: An application of contact theory in a structured short-term programme. Human
Resource Development International, 17(1). https://doi.org/10.1080/13678868.2013.856206
Engle, R. L., & Nash, B. (2016). Foreign travel experience and cultural intelligence: Does
country choice matter? Journal of Teaching in International Business, 27(1), 23–40.
https://doi.org/10.1080/08975930.2016.1173615
Engle, R. L., & Nehrt, C. C. (2012). Antecedents of cultural intelligence: The role of risk,
control, and openness in France and the United States. Journal of Management, 13(5), 35–
47. Retrieved from http://www.na-businesspress.com/JMPP/NehrtRL_Web13_5_.pdf
Faul, F., Erdfelder, E., Lang, A.-G., & Buchner, A. (2007). G*Power 3: A flexible statistical
power analysis program for the social, behavioral, and biomedical sciences. Behavior
Research Methods, 39, 175–191.
Fehr, M. C., & Agnello, M. F. (2012). Engaging in diverse classrooms using a diversity

123
awareness survey to measure. Multicultural Education, 19(2), 34–39.
Flavell, J. H. (1979). Metacognition and cognitive monitoring: A new area of cognitive-
developmental inquiry. American Psychologist, 34(10), 906–911.
Flavell, J. H. (1987). Speculations about the nature and development of metacognition. In F. E.
Weinert & R. H. Kluwe (Eds.), Metacognition, motivation and understanding (pp. 21–29).
Hillside, NJ: Lawrence Erlbaum Associates.
Frías-Jamilena, D. M. M., Sabiote-Ortiz, C. M. M., Martín-Santana, J. D. D., & Beerli-Palacio,
A. (2018). Antecedents and consequences of cultural intelligence in tourism. Journal of
Destination Marketing & Management, 8, 350–358.
Friedman, T. l. (2000). The Lexus and the olive tree. New York, NY: Farrar, Straus and Giroux.
Gall, M. D., Gall, J. P., & Borg, W. R. (2007). Educational research: An introduction. Boston,
MA: Pearson Education.
Gardner, H. (1983). Frames of mind: The theory of multiple intelligences. New York, NY: Basic
Books.
Gardner, H. (1993). Multiple intelligences: The theory in practice. New York, NY: Basic Books.
Gardner, H. (1999). Intelligence reframed. New York, NY: Basic Books.
Gay, G. (2000). Culturally responsive teaching: Theory, research, & practice. New York, NY:
Teachers College Press.
Geisler, M., Kramsch, C., McGinnis, S., Patrikis, P., Pratt, M. L., Ryding, K., & Saussy, H.
(2007). Foreign languages and higher education: New structures for a changed world: MLA
ad hoc committee on foreign languages. Profession, 234–245.
Ghonsooly, B., & Shalchy, S. (2013). Cultural intelligence and writing ability: Delving into
fluency, accuracy and complexity. Novitas-ROYAL (Research on Youth and Language),

124
7(2), 147–159.
Ghonsooly, B., Sharififar, M., Sistani, S. R., & Ghahari, S. (2013). Cultural intelligence in
foreign language learning contexts. Cultus, 47, 47–68.
Ginges, J., & Atran, S. (2013). Sacred values and cultural conflict. Advances in Culture and
Psychology, 4, 273–301.
Goh, M. (2012). Teaching with cultural intelligence: Developing multiculturally educated and
globally engaged citizens. Asia Pacific Journal of Education, 32(4), 395–415.
Greenfield, P. (2000). Three approaches to the psychology of culture: Where do they come
from? Where can they go? Asian Journal of Social Psychology, 3(3), 223–240.
Gregersen, H. B., Morrison, A. J., & Black, J. S. (1998). Developing leaders for the global
frontier. Sloan Management Review, 40, 21–32.
Griffer, M. R., & Perlis, S. M. (2007). Developing cultural intelligence in preservice speech-
language pathologists and educators. Communication Disorders Quarterly, 29(1), 28–35.
Griffith, R. L. L., Wolfeld, L., Armon, B., Rios, J., & Liu, O. L. (2016). Assessing intercultural
competence in higher education: Existing research and future directions. ETS Research
Report Series, 2016(2), 1–44.
Groves, K., & Feyerherm, A. (2011). Leader cultural intelligence in context: Testing the
moderating effects of team cultural diversity on leader and team performance. Organization
Management Journal, 36, 535–566. https://doi.org/10.1177/1059601111415664
Groves, R. M. (2006). Nonresponse rates and nonresponse bias in household surveys. Opinion
Quarterly, 70(4), 646–675.
Gullekson, N. L., Tucker, M. L., Coombs, G., & Wright, S. B. (2011). Examining intercultural
growth for business students in short-term study abroad programs: Too good to be true?

125
Journal of Teaching in International Business, 22(2), 91–106.
Gupta, A. K., & Govindarajan, V. (2002). Cultivating a global mindset. Academy of
Management Executive, 16(1), 116–126.
Gurin, P., Dey, E. L., Hurtado, S., & Gurin, G. (2002). Diversity and higher education: Theory
and impact on educational outcomes. Harvard Educational Reviews, 7(3), 330–366.
Retrieved from https://search-proquest-com.ezproxy.liberty.edu/docview/212287515?pq-
origsite=summon&accountid=12085
Hall, E. T. (1959). The silent language. New York, NY: Anchor Books.
Hall, E. T. (1993). An anthropology of everyday life. New York, NY: Anchor Books.
Hamaker, E. L., Nesselroade, J. R., & Molenaar, P. C. (2007). The integrated trait–state model.
Journal of Research in Personality, 41(2), 295–315.
Harrison, J. K., & Brower, H. H. (2011). The impact of cultural intelligence and psychological
hardiness on homesickness among study abroad students. Frontiers: The Interdisciplinary
Journal of Study Abroad, 21, 41–62.
Hart Research Associates. (2015). Falling short? College learning and career success.
Washington, DC: Author. Retrieved from
http://www.aacu.org/sites/default/files/files/LEAP/2015employerstudentsurvey.pdf
Hart Research Associates. (2018). Fulfilling the American dream: Liberal education and the
future of work. Washington, DC. Retrieved from
https://www.aacu.org/sites/default/files/files/LEAP/2018EmployerResearchReport.pdf
Haygood, A. E. (2016). The role of the short-term mission trip process in the development of
cultural intelligence in university students: A collective case study. Liberty University.
Retrieved from http://digitalcommons.liberty.edu/doctoral/1352

126
Heberlein, T. A., & Baumgartner, P. (1978). Factors affecting response rates to mailed
questionnaires: A quantitative analysis of the published literature. American Sociological
Review, 43, 447–462.
Hechanova-Alampay, R., Beehr, T. A., Christiansen, N. D., & Van Horn, R. K. (2002).
Adjustment and strain among domestic and international student sojourners a longitudinal
study. School Psychology International, 23(4), 458–474.
Heckman, J. J., & Kautz, T. (2012). Hard evidence on soft skills. Labour Economics, 19(4), 451–
464.
Hofstede, G. (1984). Culture’s consequence. Newbury Park, CA: Sage.
Hofstede, G. (1994). Cultures and organizations: Software of the mind. Administrative Science
Quarterly, 38(1), 132–134.
Hofstede, G. (2001). Culture’s consequences: Comparing values, behaviors, institutions, and
organizations across nations. Thousand Oaks, CA: Sage.
Hofstede, G., Hofstede, G. J., & Minkov, M. (2010). Cultures and organizations: Software of the
mind. New York, NY: McGraw-Hill.
Holbrook, A., Krosnick, J. A., & Pfent, A. (2007). The causes and consequences of response
rates in surveys by the news media and government contractor survey research firms.
Advances in Telephone Survey Methodology, 499–528.
Holmes, P., & O’Neill, G. (2012). Developing and evaluating intercultural competence:
Ethnographies of intercultural encounters. International Journal of Intercultural Relations,
36(5), 707–718. https://doi.org/10.1016/j.ijintrel.2012.04.010
Holt, K., & Seki, K. (2012). Global leadership: A developmental shift for everyone. Industrial
and Organizational Psychology, 5(2), 196–215.

127
Hughes, E. C. (1971). The sociological eye: Selected papers. Chicago, IL: Aldine-Atherton.
Imai, L., & Gelfand, M. J. (2010). The cultural intelligent negotiator: The impact of cultural
intelligence (CQ) on negotiation sequences and outcomes. Organizational Behavior and
Human Decision Processes, 112, 83–98.
Institute of International Education. (2016). Open Doors 2016 Report on International
Educational Exchange. Retrieved from http://www.iie.org/opendoors
James, P., & Steger, M. B. (2014). A genealogy of “globalization”: The career of a concept.
Globalizations, 11(4), 417–434.
Jyoti, J., & Kour, S. (2015). Assessing the cultural intelligence and task performance equation:
Mediating role of cultural adjustment. Cross Cultural Management, 22(2), 236–258.
Kanfer, R., & Heggestad, E. D. (1997). Motivational traits and skills: A person-centered
approach to work motivation. Research in Organizational Behavior, 19, 1–56.
Karma, K., & Vedina, R. (2009). Cultural intelligence in global teams: A fusion model of
collaboration. Group and Organization Management, 31, 124–153.
Karnyshev, A. D., & Kostin, A. K. (2010). Intercultural competence as a competitive advantage
of secondary school graduates. Russian Education and Society, 52(11), 12–26.
Khodadady, E., & Yazdi, B. H. (2014). Cultural intelligence of English language learners within
a mono-cultural context. International Journal of Psychology and Behavioral Sciences,
4(5), 165–172.
Kihlstrom, J. F., & Cantor, N. (2000). Social intelligence. Handbook of Intelligence, 2, 359–379.
Kolb, A. Y., & Kolb, D. A. (2005). Learning styles and learning spaces: Enhancing experiential
learning in higher education. Academy of Management Learning & Education, 4(2), 193–
212.

128
Kolb, D. A. (1984). Experiential learning: Experience as the source of learning and
development. Englewood Cliffs, NJ: Prentice-Hall.
Konanahalli, A. O., Oyedele, L., Spillane, J., Coates, R., von Meding, J., & Ebohon, J. (2014).
Cross-cultural intelligence (CQ): Its impact on British expatriate adjustment on international
construction projects. International Journal of Managing Projects in Business, 7(3), 423–
448.
Koo Moon, H., Kwon Choi, B., & Jung, J. S. (2012). Previous international experience, cross‐
cultural training, and expatriates’ cross‐cultural adjustment: Effects of cultural intelligence
and goal orientation. Human Resource Development Quarterly, 23(3), 285–330.
Kroeber, A. L., & Kluckhohn, C. (1952). Culture: A critical review of concepts and definitions.
Peabody Museum of Archaeology & Ethnology, Harvard University.
Kurpis, L. H., & Hunter, J. (2017). Developing CQ through experiential learning. Journal of
Marketing Education, 39(1), 30–46.
Lanz, P. (2000). The concept of intelligence in psychology and philosophy. In H. Cruse, J. Dean,
& H. Dean (Eds.), Prerational intelligence: Adaptive behavior and intelligent systems
without symbols and logic, 1 (pp. 19–30). Dordrecht, NL.
Latham, G. P., & Locke, E. A. (2007). Employee motivation. In J. Barling & C. L. Cooper
(Eds.), The Sage handbook of organizational behavior: Vol. 1. micro approaches. Thousand
Oaks, CA: Sage.
Lee, L.-Y., & Sukoco, B. M. (2010). The effects of cultural intelligence on expatriate
performance: The moderating effects of international experience. The International Journal
of Human Resource Management, 21(7), 963–981.
Lee, L.-Y., Veasna, S., & Sukoco, B. M. (2014). The antecedents of cultural effectiveness of

129
expatriation: moderating effects of psychological contracts. Asia Pacific Journal of Human
Resources, 52, 215–233.
Lenartowicz, T., Johnson, J. P., & Konopaske, R. (2014). The application of learning theories to
improve cross-cultural training programs in MNCs. International Journal of Human
Resource Management. Taylor & Francis. https://doi.org/10.1080/09585192.2013.860384
Leung, K., Ang, S., & Tan, M. L. (2014). Intercultural competence. Annual Review of
Organizational Psychology and Organizational Behavior, 1(1), 489–519.
Li, G. (2013). Promoting teachers of culturally and linguistically diverse students as change
agents: A cultural approach to professional learning. Theory Into Practice, 52(2), 136–143.
Li, M., & Mobley, W. H. (2010). The role of experiential learning in the development of cultural
intelligence. In Academy of Management. Montreal, Canada.
Livermore, D. (2015). Leading with cultural intelligence: The new secret to success. New York,
NY: AMACOM.
Livingston, J. A. (2003). Metacognition: An overview.
Lokkesmoe, K. J., Kuchinke, K. P., & Ardichvili, A. (2016). Developing cross-cultural
awareness through foreign immersion programs. European Journal of Training and
Development, 40(3), 155–170. https://doi.org/10.1108/EJTD-07-2014-0048
Lopes-Murphy, S. A. (2014). Experiences in postsecondary education that may lead to cultural
intelligence: Exploring and proposing practices. International Journal of Teaching and
Learning in Higher Education, 26(2), 287–296.
Lovvorn, A. S., & Chen, J.-S. (2011). Developing a global mindset: The responsibility between
an international assignment and cultural intelligence. International Journal of Business and
Social Sciences, 2(9), 275–283.

130
MacNab, B. R. (2012). An experiential approach to cultural intelligence education. Journal of
Management Education, 36(1), 66–94.
MacNab, B. R., Brislin, R., & Worthley, R. (2012). Experiential cultural intelligence
development: Context and individual attributes. International Journal of Human Resource
Management, 23(7), 1320–1341. https://doi.org/10.1080/09585192.2011.581636
MacNab, B. R., & Worthley, R. (2012). Individual characteristics as predictors of cultural
intelligence development: The relevance of self-efficacy. International Journal of
Intercultural Relations, 36(1), 62–71.
Manning, T. T. (2003). Leadership across cultures: Attachment style influences. Journal of
Leadership and Organizational Studies, 9(1), 20–32.
Markus, H. R., & Kitayama, S. (1991). Culture and the self: Implications for cognition, emotion,
and motivation. Psychological Review, 98(2), 224.
Mayer, J. D., & Salovey, P. (1993). The intelligence of emotional intelligence. Intelligence, 17,
433–442. Retrieved from
http://www.sciencedirect.com/science/article/pii/0160289693900103
McCrae, R. R., & Costa, P. T. (1999). A five-factor theory of personality. In L. A. Pervin & O.
P. John (Eds.), Handbook of personality: Theory and research (2nd ed., pp. 139–153). New
York, NY: Guilford.
McCrea, E. A., & Yin, J. Z. (2012). Developing cultural intelligence: An undergraduate course
assessment framework. Organization Management Journal, 9(2), 104–111.
McGrew, A. G. (1992). Conceptualizing global politics. In A. G. McGrew & P. G. Lewis (Eds.),
Global politics: globalization and the nation-state (pp. 1–28). Cambridge: Polity Press.
McKee, C. W., & Tew, W. M. (2013). Setting the stage for teaching and learning in American

131
higher education: Making the case for faculty development. New Directions for Teaching
and Learning, 133, 3–14.
McNeil, J. D., & Pozzi, C. (2011). Developing multicultural competency. In R. J. Priest & A. L.
Nieves (Eds.), This Side of heaven: Race, ethnicity, and christian faith. Oxford Scholarship
Online.
Mercer, S. (2011). Towards an understanding of language learner self-concept. Dordrecht, NL:
Springer.
Morris, M. W., Leung, K., Ames, D., & Lickel, B. (1999). Views from inside and outside:
Integrating emic and etic insights about culture and justice judgment. Academy of
Management Review, 24, 781–796.
Mulder, M. (1977). The daily power game. Leiden, The Netherlands: Mar-tinus Nijhoff Social
Sciences Division.
Murdock, G. P. (1987). Outline of cultural materials (5th ed.). New Haven, CT: HRAF.
Murray, J. P. (2002). Faculty development in SACS-accredited community colleges. Community
College Review, 29(4), 50–66.
National Leadership Council for Liberal Education and America’s Promise [NLCLEAP]. (2007).
College Learning for the New Global Century. Washington, DC. Retrieved from
http://www.aacu.org/leap/documents/GlobalCentury_final.pdf
National Standards in Foreign Language Education Project. (2006). Standards for foreign
language learning in the 21st century. Yonkers, NY: National Standards in Foreign
Language Education Project.
Ng, K.-Y., Van Dyne, L., & Ang, S. (2009). Developing global leaders: The role of international
experience and cultural intelligence. Advances in Global Leadership, 5, 225–250.

132
Ng, K.-Y., Van Dyne, L., & Ang, S. (2012). Cultural intelligence: A review, reflections, and
recommendations for future research. In A. M. Ryan, F. T. L. Leong, & F. L. Oswald
(Eds.), Conducting multinational research: Applying organizational psychology in the
workplace (pp. 29–58). Washington, DC: American Psychological Association.
Nguyen, A. T. (2010). Expatriate effectiveness and cultural intelligence among multiculturals
and monoculturals abroad. University of California, Riverside.
Onwuegbuzie, A. J., Bailey, P., & Daley, C. E. (2000). Cognitive, affective, personality, and
demographic predictors of foreign-language achievement. The Journal of Educational
Research, 94(1), 3–15.
Ott, D. L., & Michailova, S. (2016). Cultural intelligence: A review and new research avenues.
International Journal of Management Reviews, 00, 1–21.
https://doi.org/10.1111/ijmr.12118
Peivandi, A. (2011). The relationship between CQ and IQ in writing ability of adult Iranian EFL
learners. Ferdowsi University of Mashhad, Mashhad, Iran.
Podsakoff, P. M., MacKenzie, S. B., Lee, J.-Y., & Podsakoff, N. P. (2003). Common method
biases in behavioral research: A critical review of the literature and recommended remedies.
Journal of Applied Psychology, 88(5), 879–903.
Pottshoff, D., Dinsmore, J. A., & Moore, T. J. (2001). The diversity cohort—a professional
development program for college faculty. The Teacher Educator, 2, 145–156.
Presbitero, A. (2019). Foreign language skill, anxiety, cultural intelligence and individual task
performance in global virtual teams: A cognitive perspective. Journal of International
Management, (February). https://doi.org/10.1016/j.intman.2019.100729
Rafieyan, V., Golerazeghi, H., & Orang, M. (2015). Relationship between cultural intelligence

133
and pragmatic comprehension. Journal of Language Teaching and Research, 6(3), 560–
565.
Ramalu, S. S., Rose, R. C., Kumar, N., & Uli, J. (2010). Doing business in global arena: An
examination of the relationship between cultural intelligence and cross-cultural adjustment.
Asian Academy of Management Journal, 15(1), 79–97.
Ramsey, J. R., Leonel, J. N., & Gomes, G. Z. (2011). Cultural intelligence’s influence on
international business traveler’s stress. Cross Cultural Management: An International
Journal, 18(1), 21–37.
Rockstuhl, T., & Ng, K.-Y. (2008). The effects of cultural intelligence on interpersonal trust in
multicultural teams. In S. Ang & L. Van Dyne (Eds.), Handbook of cultural intelligence:
Theory, measurement, and applications (pp. 206–220). New York, NY: Sharpe.
Rockstuhl, T., Seiler, S., Ang, S., Van Dyne, L., & Annen, H. (2011). Beyond general
intelligence (IQ) and emotional intelligence (EQ): The role of cultural intelligence (CQ) on
cross-border leadership effectiveness in a globalized world. Journal of Social Issues, 67,
825–840.
Rokeach, M. (1973). The nature of human values. Free press.
Ryan, R. M., & Deci, E. L. (2000). Intrinsic and extrinsic motivations: Classic definitions and
new directions. Contemporary Educational Psychology, 25, 54–67.
Şahin, F., Gürbüz, S., Köksal, O., & Ercan, U. (2013). Measuring cultural intelligence in the
Turkish context. International Journal of Selection and Assessment, 21, 135–144.
Salovey, P., & Mayer, J. D. (1990). Emotional intelligence. Imagination, Cognition and
Personality, 9(3), 185–211.
Sambharya, R. B. (1996). Foreign experience of top management teams and international

134
diversification strategies of U.S. multinational corporations. Strategic Management Journal,
17, 739–746.
Savicki, V., Downing-Burnette, R., Heller, L., Binder, F., & Sutinger, W. (2004). Contrasts,
changes, and correlates in actual and potential intercultural adjustment. Journal of
Intercultural Relations, 28(3–4), 311–329.
Schein, E. (1985). Organizational culture and leadership. San Francisco, CA: Jossey-Bass.
Shannon, L. M., & Begley, T. M. (2008). Antecedents of the four-factor model of cultural
intelligence. In S. Ang & L. Van Dyne (Eds.), Handbook of cultural intelligence: Theory,
measurement, and applications (pp. 41–55). New York, NY: Sharpe.
Sherriff, N. S., Jeffery, A., Davies, J. K., Hills, M., Carroll, S., Jackson, S., … Attorp, A. (2012).
Transatlantic student exchange between Canada and Europe: Experiences from the
CEIHPAL project. Journal of Further and Higher Education, 36(1), 41–55.
Simonelli, J. (2000). Service learning abroad: Liability and logistics. An International Forum,
11(1), 35–44.
Southern Association of Colleges and Schools. (2012). The principles of accreditation:
Foundations for quality enhancement. Southern Association of Colleges and Schools,
Commission on Colleges. Retrieved from
http://www.sacscoc.org/pdf/2012PrinciplesOfAcreditation.pdf
Spearman, C. (1927). The abilities of man. Newbury Park, CA: Macmillan.
Spencer-Oatey, H. (2008). Culturally speaking. Culture, communication and politeness theory.
(2nd ed.). London, UK: Continuum.
Spencer-Oatey, H. (2012). What is culture ? A compilation of quotes. GlobalPAD Core
Concepts. Retrieved from

135
http://www2.warwick.ac.uk/fac/soc/al/globalpad/interculturalskills/
Spitzberg, B. H., & Chagnon, G. (2009). Conceptualizing intercultural competence. In D. K.
Deardorff (Ed.), The SAGE handbook of intercultural competence (pp. 2–52). Thousand
Oaks, CA: Sage.
Sternberg, R. J. (1983). Components of human intelligence. Cognition, 15(1), 1–48.
Sternberg, R. J. (1984). Toward a triarchic theory of human intelligence. Behavioral and Brain
Sciences, 7(2), 269–287.
Sternberg, R. J. (1986). A framework for understanding conceptions of intelligence. In R. J.
Sternberg & D. K. Detterman (Eds.), What is intelligence? Contemporary viewpoints on its
nature and definition (pp. 3–15). Norwood, NJ: Ablex.
Sternberg, R. J. (1997). Successful intelligence: How practical and creative intelligence
determine success in life. New York, NY: Plume.
Sternberg, R. J., & Detterman, D. K. (Eds.). (1986). What is intelligence? Contemporary
viewpoints on its nature and definition. Norwood, NJ: Ablex.
Tabachnick, B. G., & Fidell, L. S. (2007). Using multivariate statistics (5th ed.). Boston, MA:
Pearson.
Taguchi, N. (2005). Comprehending implied meaning in English as a foreign language. The
Modern Language Journal, 89(4), 543–562.
Tajfel, H., & Turner, J. C. (1986). The social identity theory of inter-group behavior. In S.
Worchel & W. Austin (Eds.), Psychology of intergroup relations. Chicago, IL: Nelson-Hall.
Takeuchi, R., Tesluk, P. E., Yun, S., & Lepak, D. P. (2005). An integrative view of international
experience. Academy of Management Journal, 48, 85–100.
Tarique, I., & Takeuchi, R. (2008). Developing cultural intelligence: The roles of international

136
nonwork experiences. In S. Ang & L. Van Dyne (Eds.), Handbook of cultural intelligence:
Theory, measurement, and applications (pp. 56–70). New York, NY: Sharpe.
Tay, C., Rossi, A. M., & Westman, M. (2010). International business travelers: Inter-role
conflicts and moderating effects on emotional exhaustion. In Paper presented at the annual
meeting of the Academy of Management. Montreal, Canada.
Tay, C., Westman, M., & Chia, A. (2008). Antecedents and consequences of cultural intelligence
among short-term business travelers. In S. Ang & L. Van Dyne (Eds.), Handbook of
cultural intelligence: Theory, measurement, and applications (pp. 126–144). Armonk, NY:
M.E. Sharpe.
Taylor, D. L., Van Zandt, C., & Menjares, P. C. (2013). Developing culturally competent
faculty: A cognitive, affective, and spiritual model. Christian Higher Education, 12(1),
110–121.
Templer, K. J., Tay, C., & Chandrasekar, N. A. (2006). Motivational cultural intelligence,
realistic job preview, realistic living conditions preview, and cross-cultural adjustment.
Group & Organization Management, 31, 154–173.
https://doi.org/10.1177/1059601105275293
Thomas, D. C., Elron, E., Stahl, G., Ekelund, B. Z., Ravlin, E. C., Cerdin, J. L., … Lazarova, M.
B. (2008). Cultural intelligence: Domain and assessment. International Journal of Cross
Cultural Management, 8(2), 123–143. https://doi.org/10.1177/1470595808091787
Thomas, D. C., Liao, Y., Aycan, Z., Cerdin, J. L., Pekerti, A. A., Ravlin, E. C., … Van de Vijver,
F. (2015). Cultural intelligence: A theory-based, short form measure. Journal of
International Business Studies, 46(9), 1099–1118. https://doi.org/10.1057/jibs.2014.67
Thorndike, E. L. (1921). Intelligence and its measurement: A symposium. Educational
137
Psychology, 12, 123–147.
Thorndike, R. L. (1936). Factor analysis of social and abstract intelligence. Journal of
Educational Psychology, 27(3), 231–233.
Thorndike, R. L., & Stein, S. (1937). An evaluation of the attempts to measure social
intelligence. Psychological Bulletin, 43, 275–285.
Torres, V., Howard-Hamilton, M., & Cooper, D. L. (2003). Identity development of diverse
populations: Implications for teaching and administration in higher education. Higher
Education Report, 29(6), 1–8.
Triandis, H. C. (1972). The analysis of subjective culture. New York, NY: John Wiley.
Triandis, H. C. (1981). Handbook of cross cultural psychology (Vols. 1-6). (H. C. Triandis, W.
Lambert, J. Berry, W. Lonner, A. Heron, R. Brislin, & J. Draguns, Eds.). Boston, MA:
Allyn & Bacon.
Triandis, H. C. (1996). The psychological measurement of cultural syndromes. American
Psychologist, 51(4), 407–415.
Triandis, H. C. (2001). Individualism-collectivism and personality. Journal of Personality, 69(6),
907–924.
Triandis, H. C. (2006). Cultural intelligence in organizations. Group and Organization
Management, 31, 20–26.
Trompenaars, A., & Hampden-Turner, C. (1997). Riding the waves of culture: Understanding
cultural diversity in global business. New York, NY: McGraw-Hill.
Tuleja, E. A. (2014). Developing cultural intelligence for global leadership through mindfulness.
Journal of Teaching in International Business, 25(1), 5–24.
Tylor, E. B. (1874). Primitive culture: Researches into the development of mythology,

138
philosophy, religion, language, art and customs (Vol. 1). New York, NY: Henry Holt.
Van de Vijver, F., & Tanzer, N. K. (2004). Bias and equivalence in cross-cultural assessment:
An overview. Revue Européenne de Psychologie Appliquée, 54, 119–135.
Van Dyne, L., Ang, S., & Koh, C. (2008). Development and validation of the CQS. Handbook of
Cultural Intelligence, 16–40.
Van Dyne, L., Ang, S., Ng, K.-Y., Rockstuhl, T., Tan, M. L., & Koh, C. (2012). Subdimensions
of the four-factor model of cultural intelligence: Expanding the conceptualization and
measurement of cultural intelligence. Social and Personality Psychology Compass, 6(4),
295–313.
Vygotsky, L. S. (1978). Mind in society: The development of higher psychological processes.
Cambridge, MA: Harvard University Press.
Walker, R. E., & Foley, J. M. (1973). Social intelligence: Its history and measurement.
Psychological Reports, 33(3), 839–864.
Ward, C., & Kennedy, A. (1993). Psychological and socio-cultural adjustment during
crosscultural transitions: A comparison of secondary students overseas and at home.
International Journal of Psychology, 28(2), 129–147.
Warner, R. M. (2013). Applied statistics: From bivariate through multivariate techniques.
Thousand Oaks, CA: SAGE Publications.
Watson, J. B. (1928). The ways of behaviorism. Oxford, UK: Harper.
West, C. (2012). Toward globally competent pedagogy. Washington, DC. Retrieved from
http://www.nafsa.org/uploadedFiles/Chez_NAFSA/Find_Resources/Publications/Periodical
s/Epublications/epub_toward_globally.pdf
Wiesel, E., & Heffner, R. D. (2009). Conversations with Elie Wiesel. New York, NY: Schocken

139
Books.
William, V., & Nagy, S. (2012). Sweetgrass science. Science and Children, 49(7), 46–49.
Williams, M. E. (2008). Individual differences and cross-cultural adaptation: A study of cultural
intelligence, psychological adjustment, and sociocultural adjustment. Trident University
International University.
Wittgenstein, L. (1953). Philosophical Investigations. (G. E. Anscombe, Ed.). Oxford, UK:
Blackwell Publishing.
Wood, E. D., & St. Peters, H. Y. Z. (2014). Short-term cross-cultural study tours: Impact on
cultural intelligence. International Journal of Human Resource Management, 25(4), 558–
570. https://doi.org/10.1080/09585192.2013.796315
Woods, N. (1998). Globalization: Definitions, debates and implications. Oxford Development
Studies, 26(1), 5–13.
Yankelovich, D. (2005). Ferment and change: Higher education in 2015. The Chronicle of
Higher Education, 52(14), 1–12.

140
APPENDICES
Appendix A: Demographic Questions
Demographic Information:
Please indicate your gender:
o Male
o Female
Please indicate your age range:
o 20-29
o 30-39
o 40-49
o 50-59
o 60-69
o Above 70
Please indicate your ethnicity:
o African American
o American Indian
o Asian
o Caucasian
o Hispanic or Latino
o Other: _________________________
Educational & Employment Information:
Please indicate the subject matter of each of the degrees you have earned:
o Bachelor’s in _________________
o Master’s in _________________
o Doctorate in _________________
Please indicate your rank:
o Instructor
o Assistant Professor
o Associate Professor
o Professor
Mark all that apply to your duties as faculty:
o Full-time
o Part-time
o Residential
o Online
o Graduate
o Undergraduate
Please indicate in which school(s) and department(s) you teach:
o School of _________________
o Department of _________________

141
International and Intercultural Experience:
Please evaluate your level of experience interacting with people from other countries:
o 1 = no experience
o 2 = a little experience
o 3 = moderately experienced
o 4 = very experienced
Please indicate if you grew up in the United States:
o Yes, I lived my entire childhood/adolescence in the United States
o Partially, I moved here or away as a child/teenager
o No, I moved here as an adult
o Other _________________
Have you spent any time outside the United States?
o Yes
o No
If yes, please indicate your experience outside the United States (include both short trips and
extended living situations):
o Number of countries besides the USA where you have lived (extended living/more than
2 months): ______________
o Number of countries besides the USA you have visited (visits under 2 months):
______________
o Can your total time spent outside the USA be expressed in:
o days
o weeks
o months
o years
o decades
Please indicate your language experience:
o What is your native language? ___________________
o How many languages besides your native language have you learned (more than just a
few words)? ___________
o How would you rate your proficiency in each foreign language?
(Add more if necessary)
N/A Elementary
Proficiency (can
get by as a tourist)
Intermediate
Proficiency (can
handle most basic
social or some
work situations)
Advanced
Proficiency
(communicate
effectively in
professional
settings)
Foreign
Language # 1

142
Foreign
Language # 2
Foreign
Language # 3
Foreign
Language # 4
Additional
Languages
Additional comments you would like to make:

143
Appendix B: IRB Approval

144
Appendix C: Informed Consent Form
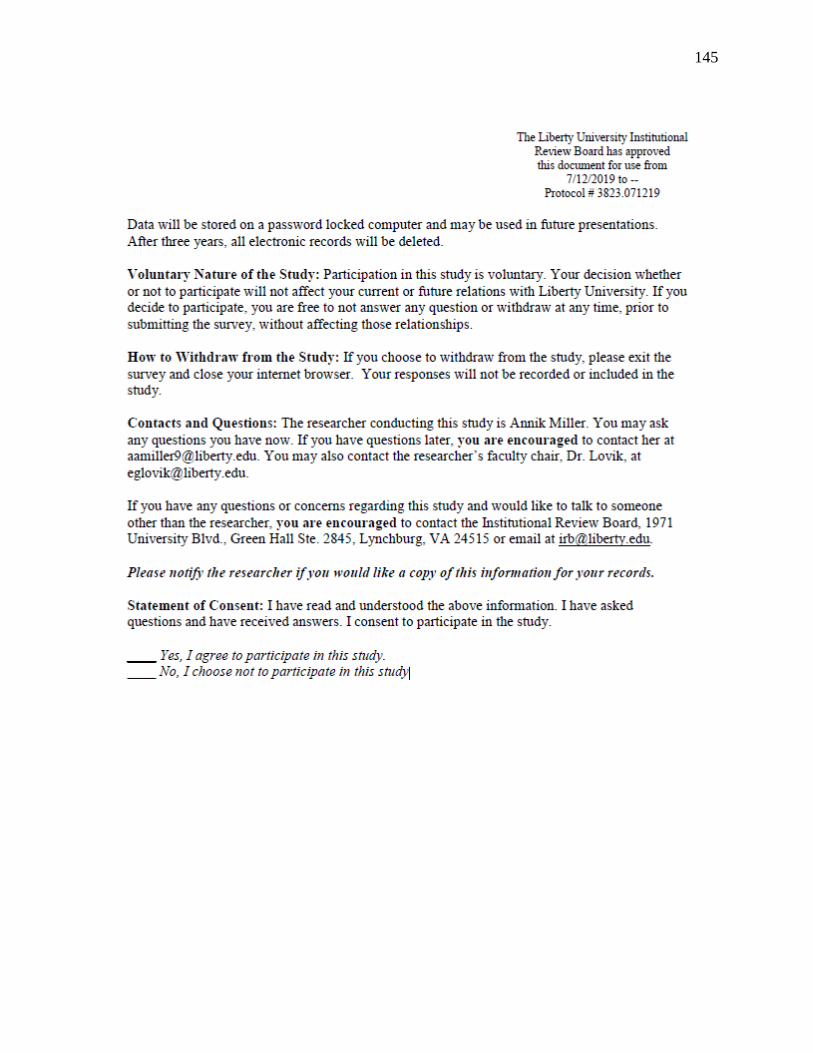
145

146
Appendix D: Recruitment Email
Dear colleague:
As a graduate student in the School of Education and fellow faculty member at Liberty
University, I am conducting research as part of the requirements for a Doctor of Education
degree. The purpose of my research is to better understand the Cultural Intelligence makeup of
undergraduate faculty at Liberty University, and I am writing to invite you to participate in my
study.
If you teach any classes at the undergraduate level at Liberty University, whether residentially or
online, and are willing to participate, you will be asked to take the Expanded Cultural
Intelligence Scale and answer a few questions about your background. It should take
approximately 15 minutes for you to complete the procedures listed. Your participation will be
completely anonymous, and no personally identifiable information will be collected as a part of
data collection. Results of the study will be shared in aggregate form only, which will prevent
any potential identification of individual participants.
To participate, click on the link provided below and complete and submit the survey. A consent
document is provided as the first page you will see after you click on the link. The consent
document contains additional information about my research. Select “yes” at the end of the
consent information to indicate that you have read the consent information and would like to take
part in the survey.
If you choose to participate, you will have the option to be entered in a raffle drawing to receive
a $300 Visa gift card.
This study has been approved by both LU administration and the Institutional Review Board.
The IRB approval number is 3823.
[Survey link: https://liberty.co1.qualtrics.com/jfe/form/SV_02Hfbs7n7FKUEER]
Sincerely,
Annik Miller, EdS.
Assistant Professor of German and French
Department of Modern Languages
(434) 582-2448
Liberty University | Training Champions for Christ since 1971

147
Appendix E: Recruitment Email Follow-Up 1
Dear colleague:
As a graduate student in the School of Education and fellow faculty member at Liberty
University, I am conducting research as part of the requirements for a Doctor of Education
degree. The purpose of my research is to better understand the Cultural Intelligence (CQ)
makeup of faculty at Liberty University.
Last week you received an email inviting you to participate in this research study. This follow-up
email is being sent to remind you to complete the survey if you would like to participate. The
deadline for participation is [______Date]. Your participation in this study will contribute
valuable insight to determine whether CQ training during faculty development should be
provided to all faculty across the board or with discipline-specific variations. To ensure the
findings are truly representative of our faculty’s CQ, I would very much welcome your
contribution to the study.
If you choose to participate, you will be asked to take the Cultural Intelligence Scale and answer
a few questions about your life experiences. It should take approximately 15 minutes for you to
complete the study procedures. Your participation will be completely anonymous, and no
personally identifiable information will be collected as a part of data collection. Results of the
study will be shared in aggregate form only which will prevent any potential identification of
individual participants.
To participate, click on the link provided below and complete and submit the survey. A consent
document is provided as the first page you will see after you click on the link. The consent
document contains additional information about my research. Select “yes” at the end of the
consent information to indicate that you have read the consent information and would like to take
part in the survey.
If you choose to participate, you will have the option to be entered in a raffle drawing to receive
a $300 Visa gift card.
[Survey link: https://liberty.co1.qualtrics.com/jfe/form/SV_02Hfbs7n7FKUEER]
Sincerely,
Annik Miller, EdS.
Assistant Professor of German and French
Department of Modern Languages
(434) 582-2448
Liberty University | Training Champions for Christ since 1971

148
Appendix F: Recruitment Email Follow-Up 2
Dear colleague:
Last week you received an email reminder to participate in a research study. This follow-up
email is being sent to remind you that your last opportunity to complete the survey if you would
like to participate is [________Date].
As a graduate student in the School of Education and fellow faculty member at Liberty
University, I am conducting research to better understand the Cultural Intelligence makeup of
faculty at Liberty University. I would value the contribution of every undergraduate faculty
member to ensure the findings are truly representative of CQ levels across our schools.
Your participation would require approximately 15 minutes as you take the Cultural Intelligence
Scale and answer a few questions about your life experiences. Your participation will be
completely anonymous, and no personally identifiable information will be collected as a part of
data collection. Results of the study will be shared in aggregate form only, which will prevent
any potential identification of individual participants.
To participate, click on the link provided below and complete and submit the survey. A consent
document is provided as the first page you will see after you click on the link. The consent
document contains additional information about my research. Select “yes” at the end of the
consent information to indicate that you have read the consent information and would like to take
part in the survey.
If you choose to participate, you will have the option to be entered in a raffle drawing to receive
a $300 Visa gift card.
[Survey link: https://liberty.co1.qualtrics.com/jfe/form/SV_02Hfbs7n7FKUEER]
Sincerely,
Annik Miller, EdS.
Assistant Professor of German and French
Department of Modern Languages
(434) 582-2448
Liberty University | Training Champions for Christ since 1971

149
Appendix G: Permission to Use E-CQS
Dear Annik, Thank you for reaching out. You have our permission to use our copyrighted CQ surveys in your research aimed at publication in scholarly journals. There are two easy ways you can do this. 1) We offer on-line assessments using the E-CQS that provide personal feedback reports to participants. This provides them with an incentive to participate in your research because the reports allow people to compare their CQ scores with the world-wide norms and also gives them information on the CQ sub-dimensions. The feedback reports also include questions to guide interpretation of results and creation of personal development plans. We offer highly discounted prices cost for academic researchers. Alternatively, you can set up a program using the E-CQS where participants pay personally by individual credit card before accessing the assessment. In either case, we can provide you with an xls file with individual participant responses to the items in the E-CQS that you can use in your research. I can give you more information on these programs and costs if you are interested. 2) You can create your own survey using the 39 E-CQS items in the attached file. If you do this, be sure to include the following copyright information on all electronic and paper copies of the survey. © Cultural Intelligence Center 2018. Used by permission of Cultural Intelligence Center. Note. Use of this scale granted to academic researchers for research purposes only. For information on using the scale for purposes other than academic research (e.g., consultants and non-academic organizations), please send an email to [email protected] Please remember these are copyrighted scales and I am making them available to you ONLY for scholarly research aimed at publication in academic journals. Should you decide you want to use the scale for consulting or program evaluation in the future, please contact me to make the necessary arrangements. In addition, please remember that you should use 1-7 Likert scales responses in research and research papers/presentations, with a focus on relationships (predictors and/or outcomes of CQ or development of CQ) because the world-wide norms, interpretation of scores, and the 1-100 scores are proprietary. We wish you the best with your research. Please share your results with us so that we can learn from you. Sincerely, Keyla Keyla Waslawski Director of Operations +1-616-855-1762
CULTURAL INTELLIGENCE CENTER 30300 Telegraph Road Suite #260 Bingham Farms, MI 48025 +1-248-232-3032 (Main Office)
150
Appendix H: Permission to Use Open Doors Graphics
Hello Annik,
Thank you for reaching out. Do feel free to use the Open Doors graphics in your dissertation.
Please make sure that all Open Doors data is properly cited. Please let me know if you have any
other questions.
Citation:
Institute of International Education (2019) “GRAPH NAME and date range” Open Doors Report
on International Educational Exchange, Retrieved from http://www.iie.org/opendoors
Best,
Natalya
Natalya Andrejko
Research Analyst
Institute of International Education
809 United Nations Plaza • New York, NY 10017
[email protected] • www.iie.org/opendoors
IIE • The Power of International Education
Related Documents