This article appeared in a journal published by Elsevier. The attached copy is furnished to the author for internal non-commercial research and education use, including for instruction at the authors institution and sharing with colleagues. Other uses, including reproduction and distribution, or selling or licensing copies, or posting to personal, institutional or third party websites are prohibited. In most cases authors are permitted to post their version of the article (e.g. in Word or Tex form) to their personal website or institutional repository. Authors requiring further information regarding Elsevier’s archiving and manuscript policies are encouraged to visit: http://www.elsevier.com/copyright

Welcome message from author
This document is posted to help you gain knowledge. Please leave a comment to let me know what you think about it! Share it to your friends and learn new things together.
Transcript

This article appeared in a journal published by Elsevier. The attachedcopy is furnished to the author for internal non-commercial researchand education use, including for instruction at the authors institution
and sharing with colleagues.
Other uses, including reproduction and distribution, or selling orlicensing copies, or posting to personal, institutional or third party
websites are prohibited.
In most cases authors are permitted to post their version of thearticle (e.g. in Word or Tex form) to their personal website orinstitutional repository. Authors requiring further information
regarding Elsevier’s archiving and manuscript policies areencouraged to visit:
http://www.elsevier.com/copyright
Author's personal copy
Viewpoint
A catchment-based approach to mapping hydrological ecosystem servicesusing riparian habitat: A case study from the Wet Tropics, Australia
P.L. Pert a,*, J.R.A. Butler a, J.E. Brodie c, C. Bruce b, M. Honzak d, F.J. Kroon b, D. Metcalfe b,D. Mitchell e, G. Wong f
a CSIRO Sustainable Ecosystems, James Cook University, Cairns Campus, PO Box 12139, Earlville BC, Cairns, Queensland 4870, Australiab CSIRO Sustainable Ecosystems, PO Box 780, Atherton, Queensland 4883, Australiac James Cook University, Townsville Campus, Australian Centre for Tropical Freshwater Research, Douglas, Townsville 4811, Australiad Conservation International, 2011 Crystal Drive, Suite 500, Arlington, VA 22202, United Statese Conservation International, PNG Program, PO Box 943, Alotau, Milne Bay Province, Papua New Guineaf UNDP-UNEP Poverty-Environment Initiative, PO Box 345, Lane Xang Ave, Vientiane, Lao PDR
1. Introduction
In Australian catchments, the rehabilitation of riparian zones isa major focus of management strategies now being implementedto protect and improve water quality and aquatic ecosystem health(Webb and Erskine, 2003). Given the large investments beingmade, it is crucial that up-to-date management guidelines areavailable to support these environmental management activities(DEH, 2005). Moreover, the guidelines should be based on the best-available scientific information. In this paper, we use a catchment-
based approach to mapping hydrological ecosystem services usingriparian habitat.
Ecosystem services are the benefits that people obtain fromecosystems (Millennium Ecosystem Assessment, 2003; 2005). TheMillennium Ecosystem Assessment (2003; 2005) was the firstinternational comprehensive attempt to provide decision-makerswith scientific information on the consequences of changes inecosystems and their associated services for human well-being. Itrevealed the option to include ecosystem services in conservationplanning, providing opportunities to protect biodiversity. Howev-er, the links between biodiversity, ecological functions and theprovision of ecosystem services are often poorly understood (Swiftet al., 2004; Kremen and Ostfeld, 2005; Carpenter et al., 2006;Mertz et al., 2007). In spite of this, it has become evident that
Ecological Complexity 7 (2010) 378–388
A R T I C L E I N F O
Article history:
Received 28 April 2009
Received in revised form 23 March 2010
Accepted 20 May 2010
Available online 2 July 2010
Keywords:
Ecosystem services
Riparian habitat
Biodiversity
GIS
A B S T R A C T
Hydrological processes have been identified as delivering ecosystem services that are fundamental to
both human well-being and the maintenance of biodiversity. If we can map the hydrological processes
and the threats to them, the integrity of the provision of ecosystem services from the catchment can be
identified, highlighting areas in need of further protection. Using the Tully-Murray catchment in the Wet
Tropics as a case study, we constructed a simplified description of the ecosystem functions and related
processes, and identified the roles of the ecosystem service providers and beneficiaries. Mapping the
riparian zone and adjacent land uses enabled us to visualise areas where non-remnant vegetation
existed and also vegetation that was classified as ‘Endangered’ or ‘Of Concern’. An assessment of the
riparian vegetation and adjacent land use revealed that 51% of the catchment contained non-remnant
riparian vegetation (i.e. was cleared or under agricultural production) and 36% of remnant vegetation
was described as ‘‘Endangered’’ with a further 35% being classified as ‘‘Of Concern’’. This is consistent
with the reported current threats from water quality degradation, habitat fragmentation and other
anthropogenic influences driven by rapid economic growth. The findings and data derived from this
project can be used for a range of purposes in managing the riparian zone. Mapping the riparian zone and
adjacent land use has shown the different types of land uses that impact on waterways and this will
assist natural resource managers in prioritizing areas where remnant vegetation should be retained or
rehabilitated. With this information, adjacent landholders can improve their management of the riparian
zone and remnant vegetation through gaining the ecosystem service benefits, and further are able to
profit from grant applications and incentives. Maintaining a healthy waterway and retaining remnant
riparian vegetation will offer the possibility to obtain many economic, biodiversity and aesthetic benefits
both within the catchment and downstream as far as the Great Barrier Reef.
Crown Copyright � 2010 Published by Elsevier B.V. All rights reserved.
* Corresponding author. Tel.: +61 7 4059 5006; fax: +61 7 4055 6338.
E-mail address: [email protected] (P.L. Pert).
Contents lists available at ScienceDirect
Ecological Complexity
journa l homepage: www.e lsev ier .com/ locate /ecocom
1476-945X/$ – see front matter . Crown Copyright � 2010 Published by Elsevier B.V. All rights reserved.
doi:10.1016/j.ecocom.2010.05.002
Author's personal copy
protecting ecosystem services potentially can support the protec-tion of biodiversity. Ecosystem services depend upon biodiversityand can also connect a wider range of places, people, policies andfinancial resources than biodiversity conservation alone (Patta-nayak and Wendland, 2007; Goldman et al., 2008; Tallis et al.,2008). As a result, there are opportunities for simultaneouslyassessing ecosystem services in biodiversity planning, and vice
versa (Chan et al., 2006; Naidoo and Ricketts, 2006; Egoh et al.,2007).
The Millennium Ecosystem Assessment (2003, 2005) distin-guishes four categories of ecosystem services: provisioning,regulating, supporting and cultural. In this paper, we look at oneof the regulating services, namely water regulation (hydrologicalprocesses) in more detail. Regulation services refer to the capacityof natural and semi-natural ecosystems to regulate essentialecological processes and life support systems through bio-geochemical cycles and other biospheric processes (de Grootet al., 2002). In addition to maintaining ecosystem (and biosphere)health, these regulation functions provide many services that havedirect and indirect benefits to humans (such as clean air, water andsoil, and biological control services). Furthermore, water regula-tion deals with the influence of natural systems on the regulationof hydrological flows on the earth’s surface. Ecosystem servicesderived from water regulation function include amongst others,the maintenance of natural irrigation and drainage, and thebuffering of extremes in discharge of rivers and regulation ofchannel flow (de Groot et al., 2002). Preserving the ‘regulating’hydrological ecosystem services provides the greatest opportu-nities for the synergistic protection of biodiversity (Chan et al.,2006). Hydrological services such as the provision of waterquantity and quality often depend on the condition of the nativevegetation within the catchment (Pattanayak, 2004; Braumanet al., 2007; Pattanayak and Wendland, 2007). Therefore largeareas of vegetation may need to be conserved or re-established inorder to obtain reciprocal benefits for biodiversity.
The riparian zone encompasses ‘‘the strip of land containing
distinctive vegetation along the margin of the stream’’ (Anderson,1993). The vegetation may include trees, woody shrubs, herbs/forbs, grasses and sedges. The vegetation in the riparian zonediffers from other terrestrial vegetation forms because of ‘‘the
influence of the stream in increasing the available moisture, flooding
and soil characteristics. The vegetation is important to the stream
because it contributes organic debris, stabilises the banks and provides
shade and cover for the instream communities’’ (Anderson, 1993).The ecological importance of riparian zones to ecosystem functionsof aquatic ecosystems have been well recognised (Welcomme,1979; Bunn, 1993; Malanson, 1993; Naiman and Decamps, 1997;Pusey and Arthington, 2003; Naiman et al., 2005). Studies continueto evaluate the value of ecosystem service that riparian zones (andassociated vegetation and habitat) provide; however at present,their true worth is unknown (Chan et al., 2006; Postel andCarpenter, 1997). As ecosystem service providers, riparian habitatsare frequently considered to have little or no direct economic value(Edwards and Abivardi, 1998) and are often cleared or overgrazed,resulting in their fragmentation.
Riparian zones are able to deliver a range of regulatinghydrological ecosystem services. For example, land and vegetationadjacent to streams can provide a protective buffer betweenstreams and nearby land-based activities. Studies in NorthAmerica, Europe, New Zealand and Australia have shown thatriparian zones remove over 90% of the nitrate from thegroundwater that flows through them (Hill, 1996; Hunter et al.,2006). Riparian zones are also capable of trapping sediment runofffrom land, promoting bank stability and thus minimising furtherloss of soil into watercourses (Tubman and Price, 2001; McKergowet al., 2004). Another benefit of the riparian vegetation lies in
shading of watercourses and regulating the temperature of aquaticecosystems (Pusey and Arthington, 2003). It contributes tocatchment biodiversity by functioning as wildlife corridors andas habitat for many aquatic and terrestrial species (Matos et al.,2009).
Riparian habitats are increasingly threatened worldwide byurbanisation and changes in land use (Zedler and Kercher, 2005).Protecting riparian habitat and its associated biodiversityrepresents a great conservation challenge because of the widerange of influencing factors such as the upstream drainagenetwork, the surrounding land, and downstream reaches. Thesevere loss or degradation of riparian habitats has led to theirimpaired function, which may have severe consequences on boththe riparian habitats themselves and their associated biota.However, there still remains some debate about appropriatemethods to map and evaluate riparian habitat, and theircorresponding ecosystem services. There is also disagreementbetween various levels of governments, as well as in legislation, asto what constitutes the area of a riparian zone, often leading to thediscussion of what areas are allowed to be cleared up to the streamor river. Nevertheless, the need for greater protection of the GreatBarrier Reef (GBR) has been recognised by state and federalgovernments and hence has prompted the formulation of a ReefWater Quality Protection Plan (Reefplan: Commonwealth andQueensland Governments, 2003). The Reefplan was initiallydeveloped due to the increasing degradation of the reef mainlycaused by runoff of land sourced pollutants (Brodie et al., 2001).Therefore the goal of the Reefplan was to halt and reverse thedecline in the quality of the water entering the reef within 10years. This necessarily included rehabilitating and conservingareas of reef catchment that have a role in removing waterbornepollutants.
Consequently, the Tully Water Quality Improvement Plan(WQIP) has recently been developed under the Reef Plan, withthe main aim to reduce sediment, nutrient and pesticide loads inthe water entering the GBR (Kroon, 2009; Kroon and Brodie,2009). One of the high-priority actions proposed in the WQIP is torestore and replant vegetation on stream banks and wetlands inidentified priority ‘hotspots’ to reduce sediment and nutrientlosses. The case study area, the Tully catchment, is located inNorth Queensland, Australia; it both contains and connects toareas of high biodiversity and conservation values, one of 35basins discharging into the Great Barrier Reef (GBR) WorldHeritage Area. The landscape, and in particular the floodplainarea, has been altered extensively since European settlement.Over 80% of natural floodplain vegetation and over 60% oforiginal riparian zones and wetlands have been converted, andthis has resulted in significant changes in regional hydrology anddrainage.
The Tully River is one of Australia’s least variable rivers,representing the generally wet tropical climate of the region. Itfloods regularly, between one to four times per year, with thecoastal and inshore areas adjacent to the Tully catchment beingregularly exposed to flood waters and associated riverine discharge(Devlin and Schaffelke, 2009). The considerable floodplain networkin this study area, transports sediments, nutrients and pesticidesinto the GBR either directly through the wetlands or via the largerTully and Murray Rivers (Bainbridge et al., 2009).
In this paper, we present an approach to mapping riparianhabitat and hydrological ecosystem services and associatedbiodiversity values, based on a case study of the Tully-Murraycatchment in the Wet Tropics. We believe that our research canserve as a template to assist in identifying areas of riparian habitator ‘hotspots’ that need to be retained and rehabilitated because ofthe adjacent land use, slope and/or their biodiversity statuscondition.
P.L. Pert et al. / Ecological Complexity 7 (2010) 378–388 379

Author's personal copy
2. Methods
Streams and their adjacent riparian areas are highly inter-connected and the terms ‘‘riparian areas or zones’’ throughout thispaper refer to the land beside the stream and the stream channel aswell. Thus, we define the riparian areas are the ‘‘green zones’’which lie between stream channels and uplands. They are the linkbetween aquatic environments and terrestrial (upland) ecosys-tems. The nature and condition of the riparian area beside a streamchannel fundamentally affects the aquatic environment (Gregoryet al., 1991).
2.1. Study area
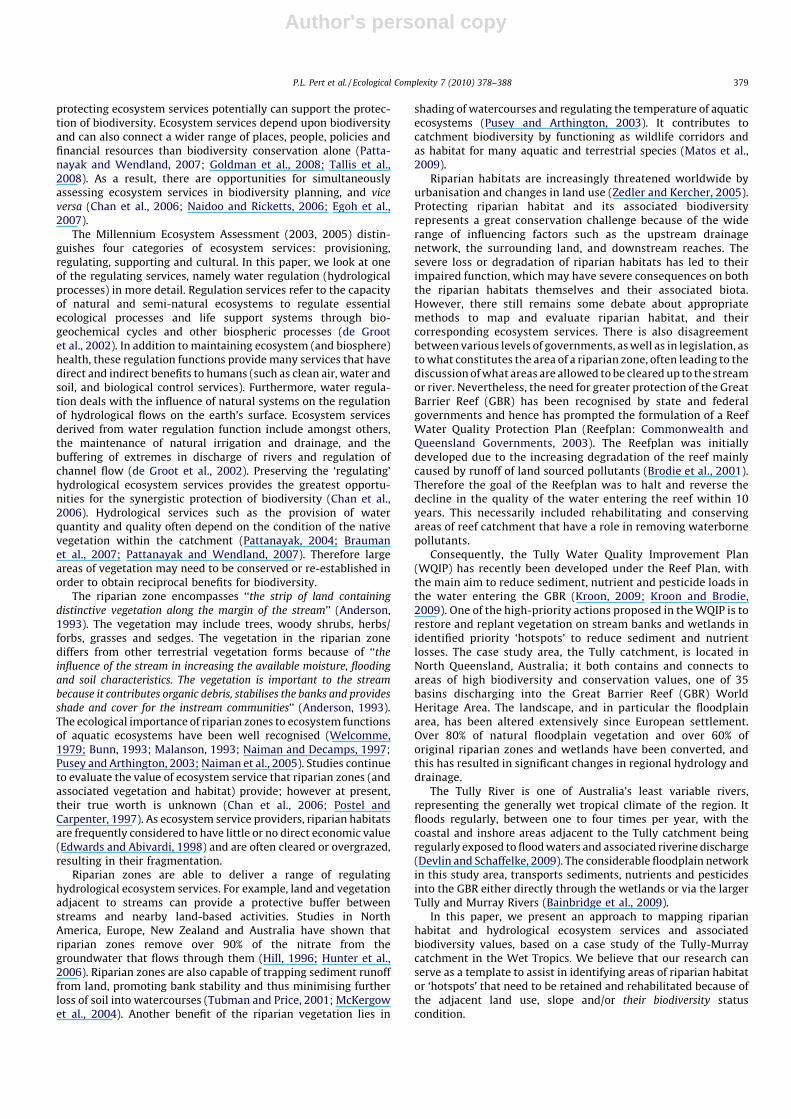
The Tully-Murray catchment is located in Far North Queens-land, Australia (Johnson 1988), and is bordered by the Wet TropicsWorld Heritage Area (WT WHA) in the west and by the GreatBarrier Reef World Heritage Area (GBR WHA) in the east (Fig. 1).The six major sub-catchments include: (1) Hull River and coastaltributaries; (2) Tully River; (3) Murray River; (4) Dallachy Creek;(5) Meunga Creek and Kennedy Creek; and (6) coastal creeksdraining into Hinchinbrook Channel (Johnson, 1998) (Fig. 2). Thestudy area comprises an area of 278,886 ha and contains eight
[(Fig._1)TD$FIG]
Fig. 1. Location of the Tully-Murray catchment (study area) within the Wet Tropics bioregion relative to the Great Barrier Reef and Wet Tropics world heritage areas,
Queensland, Australia.
P.L. Pert et al. / Ecological Complexity 7 (2010) 378–388380
Author's personal copy
major land uses (Fig. 3). The higher elevations and upper reaches ofthe rivers and creeks are primarily occupied by tropical rainforestand sclerophyll forests, while the coastal floodplain has largelybeen cleared and drained for agricultural purposes (Johnson,1998). Remnant patches of rainforest are found on the alluvialplains, and in wetlands and estuaries near the alluvial coast. Thearea comprises four main topographic units: lowland plains,coastal ranges, tidal flats and flood plains. Most of the natural forestin the Tully-Murray catchment is protected (approximately 64%),and is in the Wet Tropics World Heritage Area, in National Parks orState Forests, and in Nature refuges, but the remaining 36% ofnatural forest is under environmental pressure. The area offloodplain vegetation in the catchment is approximately
20.8 km2, and has decreased by approximately 80% compared topre-European settlement (Furnas, 2003). These changes invegetation communities reflect clearing for agricultural develop-ment and an increase in tussock grassland or sedgeland, with acorresponding decrease in open and closed forest (Furnas, 2003).The extent of the riparian area in the basin is approximately59 km2, and has decreased by approximately 60% since Europeandevelopment (Furnas, 2003). The last river survey in 1997indicated that only 38% were not classed as being in either ‘verypoor’, ‘poor’ or ‘moderate’ condition (Johnson, 1998).
The Wet Tropics bioregion in Far North Queensland is a regionof high economic importance and exceptional environmental value(McDonald and Weston, 2004). It contains the highest biological
[(Fig._2)TD$FIG]
Fig. 2. Location of six major sub-catchments found within the Tully-Murray catchment.
P.L. Pert et al. / Ecological Complexity 7 (2010) 378–388 381

Author's personal copy
diversity in Australia, and supports the Wet Tropics WorldHeritage rainforest. The region occupies less than 2% of Queens-land, yet provides 10% of the State’s agricultural activity and 23% oftourism activity. However, the region is under environmentalthreat from water quality degradation, habitat fragmentation andother anthropogenic influences driven by rapid economic growth(Wet Tropics Management Authority, 2004).
Freshwater habitats in the Wet Tropics support significantaquatic biodiversity (Pearson and Stork, 2008). The disruption offreshwater aquatic biodiversity assemblages including fish andmacro-invertebrates is likely to be a result of declining riparianvegetation extent and condition, prolonged periods of highsediment load and low levels of dissolved oxygen resulting fromnutrient enrichment (Ryan, 1991; Connolly and Pearson, 2007;Harrison et al., 2008). Clearance of riparian vegetation also allowssunlight to promote the growth of invasive aquatic weeds whichrestrict flows, promoting anoxic conditions (Bunn et al., 1998). A
total of 79 fauna species use both freshwater and marine habitatsin the Wet Tropics and 10 marine species have been found in Tully-Murray floodplain lagoons (Hogan, 2000). Among these is thebarramundi fish, a species important for commercial andrecreational fisheries. It is particularly dependent on freshwaterwetlands as nursery habitat, and there is a likely correlationbetween the area of wetland flooded annually, recruitment andsubsequent catches (reviewed by Veitch and Sawynok, 2004)(Fig. 2).
The impacts of increased pollutant discharges into the GBRlagoon include ‘‘reduced growth, reproduction and recruitment inorganisms to major shifts in the community structure and health ofcoral reef and seagrass ecosystems’’ (GBRMPA 2001). Reefs in theWet Tropics region of the GBR are regularly exposed to pollutants(suspended sediments, nutrients and pesticides) sourced fromagriculture on the adjacent catchments including the Tully(Mitchell et al., 2001; Wooldridge et al., 2006; Devlin and
[(Fig._3)TD$FIG]
Fig. 3. Land use adjacent to stream network (and riparian areas) in the Tully-Murray catchment.
P.L. Pert et al. / Ecological Complexity 7 (2010) 378–388382
Author's personal copy
Schaffelke, 2009). Degradation of many of these reefs has resulted(Fabricius et al., 2005; Devantier et al., 2006).
2.2. Datasets and analysis
The methodology adopted a spatial analysis approach to bothvisualise and analyse riparian habitat and adjacent land use in theTully-Murray catchment. First, the stream network order andriparian buffers were generated. The regional ecosystems vegeta-tion and land use datasets were then clipped and unioned with theriparian buffers to retain the various attributes for example,biodiversity status, tenure and land use.
2.2.1. Creating stream orders
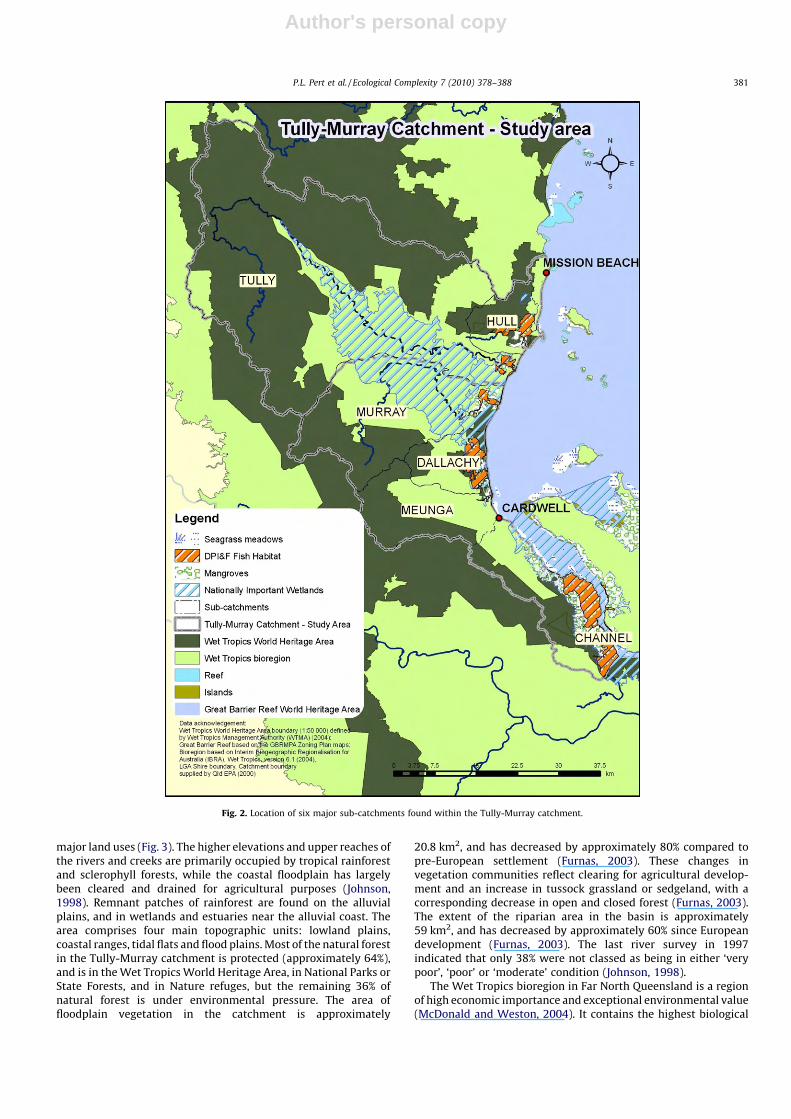
A stream order coverage was obtained from Department ofNatural Resources and Water (DNRW) for the study area. Thestream order classification provided a standardized approach todefine the size and importance of creeks and rivers in the Tully-Murray catchment. Very small streams occurred in the higherelevated parts of the landscape and were classified as a streamorder of ‘‘1’’, while larger rivers occurred in the lower parts of thelandscape and were with a stream order of ‘‘6’’. The stream ordercoverage was created using the ‘‘Strahler’’ method which allocatedeach drainage arc a stream order number depending on itsrelationship to its adjacent areas (Tarboton et al., 1991).
2.2.2. Creating riparian buffers
Using ESRI ArcGIS9.2 software, the ‘buffer’ command was usedto create the riparian zones around the stream features. The DNRW
guidelines (Lovett and Price, 2001) were used to set the numericfield value of the buffer widths, which varied depending on thestream order. Thus stream orders of 1 and 2 were given a bufferwidth of 50 m each side of the creek, stream orders 3 and 4 weregiven 100 m each side, and stream orders 5 and 6 were given abuffer width of 200 m either side (Fig. 4). The resulting streamorder datasets were then appointed buffer widths via theformation of a buffer field. A new polygon shape file was producedusing this new buffer field as buffer distance for individual riversections.
2.2.3. Development of riparian zones using regional ecosystems
The riparian vegetation zones were derived from using1:100,000 Queensland Herbarium and Environment ProtectionAgency (EPA) regional ecosystems data. Regional ecosystems arevegetation communities in a bioregion that are consistentlyassociated with a particular combination of geology, landformand soil (Sattler and Williams, 1999). They are derived from abroad range of existing information sources including land system,vegetation and geology mapping and reports. Due to the scale ofthe regional ecosystem mapping (20 ha) excluding small or narrowremnants of riparian vegetation, the ArcGIS 9.2 ‘clip’ command wasused to create a riparian zone by overlaying two sets of features.The clip coverage represented the buffered stream networkderived previously, and the areas to be clipped were the regionalecosystems. The output was a regional ecosystem or vegetationshapefile which had been clipped to the buffered stream shape file.Area calculations were then made for the field Biodiversity Status(‘‘BD_STATUS’’) so as to ascertain the area in hectares for each
[(Fig._4)TD$FIG]
Fig. 4. Using stream order we created the riparian zone and assigned buffer widths to streams based on DNRW guidelines (Lovett and Price, 2001).
P.L. Pert et al. / Ecological Complexity 7 (2010) 378–388 383

Author's personal copy
biodiversity status classification. According to the EPA’s degrada-tion criteria, the Biodiversity Status is based on an assessment ofthe condition of remnant vegetation in addition to the pre-clearingand remnant extent of a regional ecosystem.
2.2.3.1. Endangered. A regional ecosystem is listed as endangeredunder the Vegetation Management Act 1999 if:
Remnant vegetation is less than 10% of its pre-clearingextent across the bioregion; or 10–30% of its pre-clearingextent remains and the remnant vegetation is less than10,000 ha.
In addition, for biodiversity planning purposes a regionalecosystem is also listed with a Biodiversity Status of endangeredif:
� less than 10% of its pre-clearing extent remains unaffected bysevere degradation and/or biodiversity loss; or� 10–30% of its pre-clearing extent remains unaffected by severe
degradation and/or biodiversity loss and the remnant vegetationis less than 10,000 ha; or� it is a rare regional ecosystem subject to a threatening process.
2.2.3.2. Of concern. A regional ecosystem is listed as of concernunder Vegetation Management Act 1999 if:
Remnant vegetation is 10–30% of its pre-clearing extent acrossthe bioregion; or more than 30% of its pre-clearing extentremains and the remnant extent is less than 10,000 ha.
For biodiversity planning purposes a regional ecosystem islisted with a Biodiversity Status ‘of concern’ if: 10–30% of its pre-clearing extent remains unaffected by moderate degradation and/or biodiversity loss.
2.2.3.3. Not of concern/no concern at present. A regional ecosystemis listed as Not of concern under the Vegetation Management Act
1999 if:
Remnant vegetation is over 30% of its pre-clearing extent acrossthe bioregion, and the remnant area is greater than 10,000 ha.
For biodiversity planning purposes a regional ecosystem islisted with a Biodiversity Status of No concern at present if:
the degradation criteria listed above for endangered or ofconcern regional ecosystems are not met.1
2.2.4. Land use
The 2004 Queensland Land Use Mapping (QLUMP) shape fileswere obtained from the Queensland Department of NaturalResources and Water (DNRW) for the Tully and Murray catch-ments. Land use was then clipped to the buffered drainage coverand area calculations made for each land use category. A ‘union’ ortopological overlay was performed using the regional ecosystemsand land use spatial datasets. Performing this union enabled us toretain all the features from both datasets and to create a newpolygon dataset assigned with all the features and attributes ofboth layers.
2.2.5. Slope
The slope layer was derived from a 25 m Digital ElevationModel (DEM) supplied by DNRW using the ArcGIS9.2 slope tool. Itcalculated the maximum rate of change between each cell and itsneighbours. Each cell contained the value of the steepest downhilldescent for the cell (the maximum change in elevation over thedistance between the cell and its eight neighbours) (ESRI, 2008).The output slope raster was calculated as in the degrees of slope,the lower the slope value, the flatter the terrain; the higher theslope value, the steeper the terrain. Steeper slopes were shaded redon the output slope map. The slope file was used to furtherinvestigate the terrain of adjacent land uses.
3. Results
3.1. Assessment of vegetation and land use in the riparian zone
Streams can be classed in several ways and understandingstream classifications and their location in the environment assistsin making management decisions (Tiner, 1999). Within the Tully-Murray catchment, the majority (77%) of the water features wereclassified with a stream order of either 1 or 2 and were located inthe upper parts of the catchment. Third and fourth order streamswere less prevailing (18%), and 5th and 6th order streams (4.7%)included: Meunga Creek, Tully, Murray and Hull Rivers. The 1st and2nd order streams length totaled 3474 km, whilst 3rd and 4thorder streams were 591 km and the 5th and 6th order rivers were205 km long.
Based on our assignment of stream orders, the Tully-Murraycatchment total riparian area covered approximately 57,831 ha(21% of the total catchment). The dominant land uses foundadjacent to the riparian areas included remnant vegetation (suchas rainforest and dry sclerophyll), agricultural land uses such assugar cane, forestry, grazing and bananas (Fig. 3). These land usesmainly occurred in higher stream orders, for example along theTully River which has a stream order of 6.
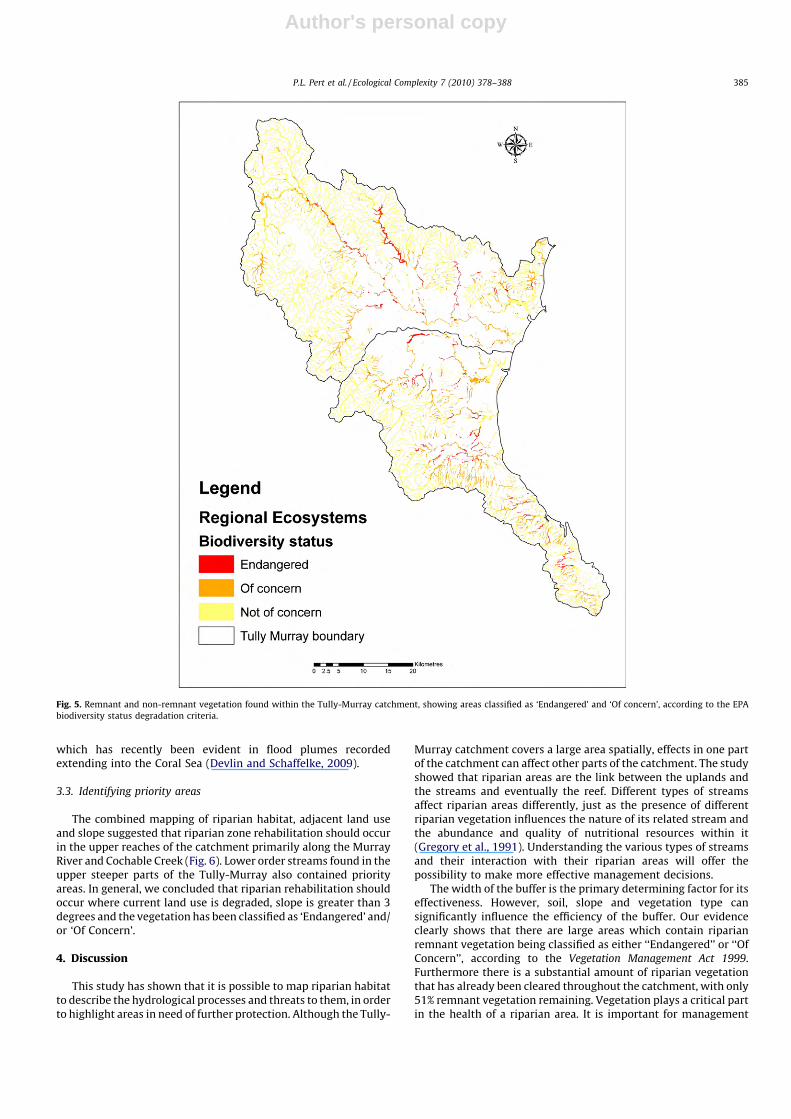
51% (29,844 ha) of the riparian area contained non-remnantvegetation (i.e. was cleared or under agricultural production) andwas located primarily on the floodplain. Of the remnant nativevegetation remaining, 36% was classified as ‘‘Endangered’’according to the Vegetation Management Act 1999 with a further35% being classified as ‘‘Of Concern’’ (Fig. 5), highlighting areas inneed of further protection. These ‘‘Endangered’’ and ‘‘Of Concern’’riparian ecosystems were primarily located along the majorrivers Tully and Murray and also prevalently in their upperreaches and floodplains. The associated tenure of these areasrevealed that 31% of ‘‘Endangered’’ vegetation occurred outsideof National Parks, with 15% of this occurring on freehold land. Afurther 27% unprotected freehold land was classified as ‘‘OfConcern’’.
3.2. Alteration of river systems
The degradation and loss of native vegetation within theriparian zones is clearly evident with only 36% remainingunfragmented. Rivers and associated riparian zones support a fullrange of ecosystem services and the majority of species andhabitats. Our results highlight the fragmentation which hasoccurred which places the integrity of the ecosystem at risk. Thisin turn might affect the potential of the river to deliver ecosystemservices, particularly in the wet season when flow regulation andflood-related services is imperative. The valuable role played byriparian vegetation and substrates in trapping sediments, nutrientsand pollutants is well established, however our results have shownthat the increasing alteration of the river systems within the Tullycatchment can only result in increased erosion and sedimentation
1 For further definitions refer to: http://www.epa.qld.gov.au/nature_conserva-
tion/biodiversity/regional_ecosystems/introduction_and_status/ and Neldner et al.
(2005).
P.L. Pert et al. / Ecological Complexity 7 (2010) 378–388384
Author's personal copy
which has recently been evident in flood plumes recordedextending into the Coral Sea (Devlin and Schaffelke, 2009).
3.3. Identifying priority areas
The combined mapping of riparian habitat, adjacent land useand slope suggested that riparian zone rehabilitation should occurin the upper reaches of the catchment primarily along the MurrayRiver and Cochable Creek (Fig. 6). Lower order streams found in theupper steeper parts of the Tully-Murray also contained priorityareas. In general, we concluded that riparian rehabilitation shouldoccur where current land use is degraded, slope is greater than 3degrees and the vegetation has been classified as ‘Endangered’ and/or ‘Of Concern’.
4. Discussion
This study has shown that it is possible to map riparian habitatto describe the hydrological processes and threats to them, in orderto highlight areas in need of further protection. Although the Tully-
Murray catchment covers a large area spatially, effects in one partof the catchment can affect other parts of the catchment. The studyshowed that riparian areas are the link between the uplands andthe streams and eventually the reef. Different types of streamsaffect riparian areas differently, just as the presence of differentriparian vegetation influences the nature of its related stream andthe abundance and quality of nutritional resources within it(Gregory et al., 1991). Understanding the various types of streamsand their interaction with their riparian areas will offer thepossibility to make more effective management decisions.
The width of the buffer is the primary determining factor for itseffectiveness. However, soil, slope and vegetation type cansignificantly influence the efficiency of the buffer. Our evidenceclearly shows that there are large areas which contain riparianremnant vegetation being classified as either ‘‘Endangered’’ or ‘‘OfConcern’’, according to the Vegetation Management Act 1999.Furthermore there is a substantial amount of riparian vegetationthat has already been cleared throughout the catchment, with only51% remnant vegetation remaining. Vegetation plays a critical partin the health of a riparian area. It is important for management
[(Fig._5)TD$FIG]
Fig. 5. Remnant and non-remnant vegetation found within the Tully-Murray catchment, showing areas classified as ‘Endangered’ and ‘Of concern’, according to the EPA
biodiversity status degradation criteria.
P.L. Pert et al. / Ecological Complexity 7 (2010) 378–388 385

Author's personal copy
planning as plant communities often provide the first indicators ofchanges to the system. Riparian vegetation plays a significant rolein slowing flow velocity, stabilising streambanks, and reducingerosion. In addition to the bank stabilisation provided by welldeveloped root systems, both the amount and types of vegetationpresent in the riparian area influence other functions of a ripariansystem (Easson and Yarbrough, 2002). Riparian vegetation protectsthe soil from erosion and compaction, traps sediments as well asnutrients, and reduces water and soil temperature as well asevaporation (Tabacchi et al., 1998). These remaining remnant areasidentified by this study should be given priority when manage-ment decisions are made.
Furthermore we have identified areas where rehabilitation orprotection is a priority based on the degree of slope. Bare ground or
soil that is covered by little or no vegetation is highly susceptible toerosion. It may contribute to both above ground sediment flow andthe erosion of streambanks. In both cases, it can affect waterquality as well as the loss of valuable soil and acreage. Soil notcovered by vegetation can be a prime area for invasion of noxiousweeds or other undesirable plant species. Bare ground increasesthe possibility of soil compaction or bank shearing by hoofedanimals, vehicles, or people. As a consequence this often leads tothe reduced water-holding capacity of the soil (Heartsill-Scalleyand Aide, 2003).
The data derived from this project can be used for a wide rangeof riparian zone management purposes, including weed manage-ment, identification of stream bank instability and analysis ofhabitat fragmentation. For example, the areas mapped as cleared,
[(Fig._6)TD$FIG]
Fig. 6. Combined mapping of riparian habitat and slope (degrees) within inset of the upper reaches of the catchment primarily along the Murray River and Cochable Creek.
P.L. Pert et al. / Ecological Complexity 7 (2010) 378–388386
Author's personal copy
found adjacent to the outside of meander bends will likely be highrisk areas for stream bank erosion or weed infestation. The servicesprovided by riparian vegetation and wetland habitats forbiodiversity values and reduced sedimentation and nutrientdepositions on the GBR can now be further evaluated usingsedimentation transport models and software. Assessing the costsof replanting and foregone agricultural income are also recom-mended. A possible outcome of future works is to enable marketsand mechanisms for ecosystem services, with the transfer ofpayments from marine reef tourism industries in the GBR tolandholders in the Tully catchment to mitigate water pollution andrehabilitate riparian areas.
We emphasise that land managers work closely and coopera-tively with landholders who undertake clearing and drainage foragricultural production to develop more ecologically sustainableapproaches to drainage activities. This could involve educationabout the impacts of altered drainage patterns on adjacentwetlands and waterways. Further land management supportwould include offering resources and other incentives to practicemore ecologically sustainable outcomes, or entering into coopera-tive management agreements for the protection of significantriparian habitat. Bank erosion, as well as associated sediments andnutrient losses, can be reduced by large-scale riparian rehabilita-tion (Armour et al., 2009; Rassam and Pagendam, 2009). Whilesuch works will also require considerable investments, imple-mentation is likely to enhance the protection of identifiedenvironmental values such as aquatic ecosystems, indigenousand non-indigenous cultural heritage, and amenity,
Our mapping has provided a useful approach for conservationplanning and farm management because it highlights whereprotection, rehabilitation and vulnerable areas are existing.Conservation planning must be developed over large land units,such as at the catchment scale, so that environmental gainsassociated with local conservation incentives can be fully realized(Wang et al., 2002). Farming practices adopted by farmers aregoverned by farm traditions and economics (Medley et al., 1995;Jacobson et al., 2003), however farmers’ attitude and behaviourtowards conservation actions are mainly dictated by theirknowledge and level of information (Lichtenberg and Zimmerman,1999). Reliable information is essential for landowners and landplanners in order to contribute to the recovery of their regionalecosystem under optimal management (Miller and Hobbs, 2002).Local newspaper articles, press releases and public informationsessions are effective tools to increase the general publicawareness on environmental problems (Lichtenberg and Zimmer-man, 1999), as are government financial incentives to engagefarmers in conservation actions (Jacobson et al., 2003).
Overall, since European settlement, the filtering role of theTully-Murray floodplain has been substantially altered, due toremoval of wetlands and the installation of drainage systems incoastal floodplains. Sustaining ecosystem services relevant tohuman livelihood, while providing a dependable water supply foragriculture and urban needs is a major challenge faced bymanagers of human-dominated watersheds (Strange et al.,1999). Rehabilitation of waterways, including river and streambanks and wetlands, will improve ecosystem services such aswater quality and restore uses and values that have been lost overtime, as well as enhance the resilience of the coastal floodplainecosystem. With appropriate management, riparian buffer zonescan reduce the amount of nitrogen reaching waterways fromadjacent land-based activities and thereby help protect the waterquality of aquatic ecosystems downstream. Research effort willneed to be directed towards evaluating the filtering role of coastalfloodplains, including the filter function of riparian zones andwetland areas, and the role of drainage systems in increasingrunoff rates and amounts.
5. Conclusions
Research into the importance of riparian vegetation for riverrehabilitation and provision of ecosystem services has been andcontinues to be extensive. From our study, we identified that 51%of remnant vegetation remains in the catchment, for which mostoccurs in the Tully River and Cochable Creek and should berehabilitated urgently. We further conclude that our approach ofmapping riparian habitat, using existing data, is an economic andreliable method to obtain information on evaluating the ecologicalbenefits of riparian vegetation. Healthy riparian areas provideseveral important functions and hydrological ecosystem serviceswhich, not only enhance ecological health but have economic andsocial benefits as well. These benefits and ecosystem servicesinclude water purification from riparian vegetation, improvedwater quality and increased aesthetics of water for visitors whichsupport native fish and wildlife (Loomis et al., 2000). The decisionof appropriate management activities for riparian areas relies onthe assessment of their current condition and health. This studyhas demonstrated that riparian areas within the Tully-Murraycatchment are under threat and degraded, especially along theTully River which has a stream order of 6 and extensive associatedland use. From our study, it is highly recommended that streamsand riparian areas should be considered within the context of theircatchment, adjacent land use and slope. They also should bemanaged accordingly. It is imperative for sustainable land andmarine management that the health of streams and rivers are seenwithin the spatial context of the landscape (i.e. riparian zone).Hereby, adjacent land use and slope have effects downstream, asfar out as the Great Barrier Reef.
Acknowledgements
This work has been funded through the Australian Govern-ment’s Marine and Tropical Sciences Research Facility andConservation International. Thank you to Nalini Rao, Ralf Schroers(Spatial Diversity) and two anonymous reviewers.
References
Anderson, J.R., 1993. ‘State of Rivers’ Project: Report 1. Development and Validationof the Methodology. A Report to Department of Primary Industries, Queensland.
Armour, J.D., Hateley, L.R., Pitt, G.L., 2009. Catchment modelling of sediment,nitrogen and phosphorus nutrient loads with SedNet/ANNEX in theTully–Murray basin. Marine and Freshwater Research 60 (Special Issue), 1091–1096.
Bainbridge, Z.T., Brodie, J.E., Faithful, J.W., Sydes, D.A., Lewis, S.E., 2009. Identifyingthe land-based source of suspended sediments, nutrients and pesticides dis-charged to the Great Barrier Reef from the Tully-Murray Basin, Queensland,Australia. Marine and Freshwater Research 60, 1081–1090.
Brodie, J.E., Christie, C., Devlin, M., Haynes, D., Morris, S., Ramsay, M., Waterhouse, J.,Yorkston, H., 2001. Catchment management and the Great Barrier Reef. WaterScience and Technology 43, 203–211.
Brauman, K.A., Daily, G.C., Duarte, T.K., Mooney, H.A., 2007. The nature and value ofecosystem services: an overview highlighting hydrologic services. AnnualReview of Environment and Resources 32, 67–98.
Bunn, S.E., 1993. Riparian-stream linkages: research needs for the protection of in-stream values. Australian Biologist 6, 46–51.
Bunn, S.E., Davies, P.M., Kellaway, D.M., Prosser, I.P., 1998. Influence of invasivemacrophytes on channel morphology and hydrology in an open tropical low-land stream, and potential control by riparian shading. Freshwater Biology 39,171–178.
Carpenter, S.R., DeFries, R., Dietz, T., Mooney, H.A., Polasky, S., Reid, W.V., Scholes,R.J., 2006. Millennium ecosystems assessment: research needs. Science 314,257–258.
Chan, K.M.A., Shaw, M.R., Cameron, D.R., Underwood, E.C., Daily, G.C., 2006. Con-servation planning for ecosystem services. PLoS Biology 4 (11), 2138–2152.
Commonwealth and Queensland Governments, 2003. Reef Water Quality Protec-tion Plan: For Catchments Adjacent to the Great Barrier Reef World HeritageArea. Australian Government and Queensland Government.
Connolly, N.M., Pearson, R.G., 2007. The effect of fine sedimentation on a tropicalstream macroinvertebrate assemblages: a comparison using flow-throughartificial stream channels and recirculating mesocosms. Hydrobiologia 592,423–438.
P.L. Pert et al. / Ecological Complexity 7 (2010) 378–388 387
Author's personal copy
de Groot, R.S., Wilson, M.A., Boumans, R.M.J., 2002. A typology for the classification,description and valuation of ecosystem functions, good and services. EcologicalEconomics 41, 393–408.
DEH, 2005. The National Water Quality Management Strategy (NWQMS).Australian Government, Department of the Environment and Heritage http://www.environment.gov.au/water/policy-programs/nwqms/index.html (accessed13.03.2010).
Devantier, L., De’ath, G., Turak, E., Done, T., Fabricius, K., 2006. Species richness andcommunity structure of reef-building corals on the nearshore Great BarrierReef. Coral Reefs 25, 329–340.
Devlin, M., Schaffelke, B., 2009. Spatial extent and exposure of riverine flood plumesand exposure of marine ecosystems in the Tully coastal region. Marine andFreshwater Research 60 (11), 1109–1122.
Easson, G., Yarbrough, L.D., 2002. The effects of riparian vegetation on bank stability.Environmental & Engineering Geoscience 3 (4), 247–260.
Edwards, P.J., Abivardi, C., 1998. The value of biodiversity: where ecology andeconomy blend. Biological Conservation 83, 239–246.
ESRI, 2008. ArcGIS 9—Geoprocessing Commands Quick Reference Guide. ESRI,United States http://webhelp.esri.com/arcgisdesktop/9.3/pdf/Geoprocessing_Quick_Guide.pdf (accessed 13.03.2010).
Egoh, B., Rouget, M., Reyers, B., Knight, A.T., Cowling, R.M., van Jaarsveld, A.S., Welz,A., 2007. Integrating ecosystem services into conservation assessments: areview. Ecological Economics 63, 714–721.
Fabricius, K., De’ath, G., McCook, L., Turak, E., Williams, D.B., 2005. Changes in algal,coral and fish assemblages along water quality gradients on the inshore GreatBarrier Reef. Marine Pollution Bulletin 51 (1–4), 384–398.
Furnas, M., 2003. Catchments and Corals. Terrestrial Runoff to the Great BarrierReef. Australian Institute of Marine Science, Townsville, 334 pp.
Goldman, R.L., Tallis, H., Kareiva, P., Daily, G.C., 2008. Field evidence that ecosystemservice projects support biodiversity and diversify options. PNAS 105, 9445–9448.
Gregory, S.V., Swanson, F.J., McKee, A., Cummins, K.W., 1991. An ecosystem per-spective of riparian zones. BioScience 41, 540–551.
Harrison, E.T., Norris, R.H., Wilkinson, S.N., 2008. Can an indicator of river healthbe related to assessments from a catchment-scale model? Hydrobiologia 600,49–64.
Heartsill-Scalley, T., Aide, T.M., 2003. Riparian vegetation and stream condition ina tropical agriculture-secondary forest mosaic. Ecological Applications 13,225–234.
Hill, A.R., 1996. Nitrate removal in stream riparian zones. Journal of EnvironmentalQuality 25, 743–755.
Hogan, A., 2000. Use of Lagoons on the Tully-Murray Floodplain by Native Fish.Freshwater Fisheries and Aquaculture Centre. Queensland Department of Pri-mary Industries, Walkamin, Australia.
Hunter, H., Fellows, C., Rassam, D., DeHayr, R., Pagendam, D., Conway, C., Bloesch, P.,Beard, N., 2006. Managing Riparian Lands to Improve Water Quality: Optimis-ing Nitrate Removal via Denitrification. Cooperative Research Centre for CoastalZone, Estuary and Waterway Management (Coastal CRC).
Jacobson, S.K., Sieving, K.E., Jones, G.A., Van Doorn, A., 2003. Assessment of farmerattitudes and behavioral intentions toward bird conservation on organic andconventional Florida farms. Conservation Biology 17, 595–606.
Johnson, D.P., 1998. State of the Rivers—Tully and Murray Rivers and MajorTributaries. Department of Natural Resources, Brisbane, 106 pp.
Kremen, C., Ostfeld, R.S., 2005. A call to ecologists: measuring, analyzing andmanaging ecosystem services. Frontiers in Ecology and the Environment 3(10), 540–548.
Kroon, F.J., 2009. Preface: Integrated research to improve water quality in the GreatBarrier Reef region. Marine and Freshwater Research 60 (Special Issue) i–iii.
Kroon, F.J., Brodie, J., 2009. Catchment management and health of coastal ecosys-tems: synthesis and future directions. Marine and Freshwater Research 60(Special Issue), 1196–1200.
Lichtenberg, E., Zimmerman, R., 1999. Information and farmers’ attitudes aboutpesticides, water quality, and related environmental effects. Agriculture Eco-systems and Environment 73, 227–236.
Loomis, J., Kent, P., Strange, L., Fausch, K., Covich, A., 2000. Measuring the totaleconomic value of restoring ecosystem services in an impaired river basin:results from a contingent valuation survey. Ecological Economics 33, 103–117.
Lovett, S., Price, P., 2001. Managing Riparian Lands in the Sugar Industry. A Guide toPrinciples and Practices. Sugar Research and Development Corporation/Landand Water Australia, Brisbane.
Malanson, G.P., 1993. Riparian Landscapes. Cambridge University Press, Cambridge.Matos, H.M., Santos, M.J., Palomares, F., Santo-Reis, M., 2009. Does riparian habitat
condition influence mammalian carnivore abundance in Mediterraneanecosystems? Biodiversity and Conservation 18, 373–386.
McDonald, G., Weston, N., 2004. Sustaining the Wet Tropics: A Regional Plan forNatural Resource Management: volume 1 Background to the Plan. RainforestCRC and FNQ NRM Ltd., Cairns, pp. 64.
McKergow, L.A., Prosser, I.P., Grayson, R.B., Heiner, D., 2004. Performance of grassand rainforest riparian buffers on banana plantations, far north Queensland. 2.Water quality. Australian Journal of Soil Research 42 (4), 485–498.
Medley, K.E., Okey, B.W., Barrett, G.W., Lucas, M.F., Renwick, W.H., 1995. Landscapechange with agricultural intensification in a rural watershed, southwesternOhio, USA. Landscape Ecology 10, 161–176.
Mertz, O., Ravbborg, H.M., Lovei, G.L., Nielsen, I., Konijnendijk, C.C., 2007. Ecosystemservices and biodiversity in developing countries. Biodiversity Conservation 16,2729–2737.
Miller, J.R., Hobbs, R.J., 2002. Conservation where people live and work. Conserva-tion Biology 16, 330–337.
Mitchell, A., Reghenzani, J.R., Furnas, M., 2001. Nitrogen levels in the Tully River—along-term view. Water Science and Technology 43 (9), 99–105.
Naidoo, R., Ricketts, T.H., 2006. Mapping the economic costs and benefits ofconservation. PLoS Biology 4, 2153–2164.
Naiman, R.J., Decamps, H., 1997. The ecology of interfaces: riparian zones. AnnualReview Ecology and Systematics 28, 621–658.
Naiman, R.J., Decamps, H., McClain, M.E., 2005. Riparia: Ecology, Conservation, andManagement of Streamside Communities. Elsevier, Burlington.
Neldner, V.J., Wilson, B.A., Thompson, E.J., Dillewaard, H.A., 2005. Methodology forSurvey and Mapping of Regional Ecosystems and Vegetation Communities inQueensland. Version 3.1. Updated September 2005. Queensland Herbarium,Environmental Protection Agency, Brisbane, 128 pp.
Pattanayak, S.K., 2004. Valuing watershed services: concepts and empirics fromSoutheast Asia. Agriculture Ecosystems and Environment 104, 171–184.
Pattanayak, S.K., Wendland, K.J., 2007. Nature’s care: diarrhea, watershed protec-tion, and biodiversity conservation in Flores, Indonesia. Biodiversity and Con-servation 16 (10), 2801–2819.
Pearson, R.G., Stork, N.E., 2008. Catchment to reef: water quality and ecosystemhealth in tropical streams. In: Stork, N.E., Turton, S. (Eds.), Living in a DynamicTropical Forest Landscape. Blackwell Publishing Ltd., Oxford, UK, pp. 557–576.
Postel, S., Carpenter, S., 1997. Freshwater ecosystem services. In: Daily, G. (Ed.),Nature’s Services. Island Press, Washington, DC, pp. 195–214.
Pusey, B.J., Arthington, A.H., 2003. Importance of the riparian zone to the conserva-tion and management of freshwater fish: a review. Marine and FreshwaterResearch 54, 1–16.
Rassam, D.W., Pagendam, D., 2009. Development and application of the RiparianMapping Tool to identify priority rehabilitation areas for nitrogen removal inthe Tully–Murray basin, Queensland, Australia. Marine and Freshwater Re-search 60 (Special Issue), 1165–1175.
Ryan, P.A., 1991. Environmental effects of sediment on New Zealand streams: areview. New Zealand Journal of Marine and Freshwater Research 25, 207–221.
Sattler, P.S., Williams, R.D. (Eds.), 1999. The Conservation Status of QueenslandBioregional Ecosystems. Environmental Protection Agency, Brisbane.
Strange, E., Fausch, K.D., Covich, A.P., 1999. Sustaining ecosystem services inhuman-dominated watersheds: biohydrology and ecosystem processes inthe South Platte River Basin. Environmental Management 24, 39–54.
Swift, M.J., Izac, A.M.N., van Noordwijk, M., 2004. Biodiversity and ecosystemservices in agricultural landscapes—are we asking the right questions? Agri-culture Ecosystems and Environment 104, 113–134.
Tabacchi, E., Correll, D.L., Pinay, G., Planty-Tabacchi, A., Wissmar, R.C., 1998.Development, maintenance and role of riparian vegetation in the river land-scape. Freshwater Biology 40, 497–516.
Tallis, H., Kareiva, P., Marvier, M., Chang, A., 2008. An ecosystem services frameworkto support both practical conservation and economic development. PNAS 105,9457–9464.
Tarboton, D.G., Bras, R.L., Rodriguez-Iturbe, I., 1991. On the extraction of channelnetworks from digital elevation data. Hydrological Processes 5, 81–100.
Tiner, R.W., 1999. Wetland Indicators: A Guide to Wetland Identification, Delinea-tion, Classification, and Mapping. CRC Press, Florida, USA.
Tubman, W., Price, P., 2001. Riparian Land Management Technical Guidelines. Landand Water Resources, Research and Development Corporation, Canberra.
Veitch, W., Sawynok, B., 2004. Freshwater Wetlands and Fish: Importance ofFreshwater Wetlands to Marine Fisheries Resources in the Great Barrier Reef.Sunfish Queensland Report to the Great Barrier Reef Marine Park Authority,Townsville, Australia, 127 pp.
Wang, L., Lyons, J., Kanehl, P., 2002. Effects of watershed best management practiceson habitat and fish in Wisconsin streams. Journal of the American WaterResources Association 38, 663–680.
Webb, A.A., Erskine, W.D., 2003. A practical approach to riparian vegetationrehabilitation in Australia. Journal of Environmental Management 68, 329–341.
Welcomme, R.L., 1979. Fisheries Ecology of Floodplain Rivers. Longman, London,UK.
Wet Tropics Management Authority, 2004. Wet Tropics Conservation Strategy: TheConservation, Rehabilitation and Transmission to Future Generations of TheWet Tropics World Heritage Area. WTMA, Cairns.
Wooldridge, S., Brodie, J., Furnas, M., 2006. Exposure of inner-shelf reefs to nutrientenriched runoff entering the Great Barrier Reef Lagoon: post-European changesand the design of water quality targets. Marine Pollution Bulletin 52, 1467–1479.
Zedler, J.B., Kercher, S., 2005. Wetland resources: status, trends, ecosystem services,and restorability. Annual Review Ecology and Systematics 30, 39–74.
P.L. Pert et al. / Ecological Complexity 7 (2010) 378–388388
Related Documents