A Case Study on U.S. City Action Towards Protecting Homeless Lives from Heat Vulnerability By Erin Olesiewicz University of Colorado - Boulder A thesis submitted by to the University of Colorado Boulder In partial fulfillment of the requirements to receive Honors designation in Environmental Studies Defense Date: April 5, 2022 Thesis Advisors: Dr. Roger Pielke jr., CU Boulder, Department of Environmental Studies, Primary Advisor. Dr. Cassandra Brooks, CU Boulder, Department of Environmental Studies, Honors Council Representative. Dr. Zak Kopeikin, CU Boulder, Department of Philosophy, Outside Reader. ©2022 by Erin Olesiewicz All Rights Reserved

Welcome message from author
This document is posted to help you gain knowledge. Please leave a comment to let me know what you think about it! Share it to your friends and learn new things together.
Transcript
A Case Study on U.S. City Action Towards Protecting Homeless Lives from Heat Vulnerability
By Erin Olesiewicz
University of Colorado - Boulder
A thesis submitted by to the University of Colorado Boulder
In partial fulfillment of the requirements to receive
Honors designation in Environmental Studies
Defense Date: April 5, 2022
Thesis Advisors: Dr. Roger Pielke jr., CU Boulder, Department of Environmental Studies,
Primary Advisor. Dr. Cassandra Brooks, CU Boulder, Department of Environmental Studies,
Honors Council Representative. Dr. Zak Kopeikin, CU Boulder, Department of Philosophy, Outside Reader.
©2022 by Erin Olesiewicz All Rights Reserved
1
Abstract
Vulnerability to times of extreme heat and heatwaves vary by social and socioeconomic
groups. The particular group studied in this research is homeless populations. I examined sources
outlining vulnerabilities to heat compared to sources covering homeless vulnerabilities. The
vulnerabilities homeless people experience to extreme heat and heat waves is defined in this
paper. The scope is divided between homeless populations exposure rate and adaptive capacity.
The vulnerabilities of homeless populations defined represent higher exposure rate to extreme
heat and lower adaptive capacity to extreme heat by homeless communities compared to housed
communities.
A case study on two U.S. cities was conducted through policy research on heat mitigation
strategies. These cities are Phoenix (AZ) and Philadelphia (PA). I compared the cities’ actions to
the vulnerabilities experienced by homeless communities. This comparison highlights where
cities are successful or fall short in protecting the lives of homeless populations. The city of
Phoenix’s new Office of Heat Response and Mitigation has set plans that will reduce homeless
vulnerabilities. The city of Philadelphia has more resources for cold weather events, rather than
hot weather events, but their Code Red initiative has potential to be successful if it is
implemented similarly to Philadelphia’s Code Blue.
2
Acknowledgments
I would like to extend my gratitude towards everyone who has helped me towards
producing this thesis. To my committee: Dr. Pielke jr., thank you for your guidance, wisdom and
supervision; Dr. Brooks, thank you for your coaching and encouragement; and Dr. Kopiekin,
thank you for your patience and enthusiasm.
I want to acknowledge my incredible support systems. To my friends and roommates,
thank you for listening to me talk about this thesis for hours. Your reassurance has meant the
world to me! To my family, your love and encouragement has helped me reach my potential.
Mom, Dad, and Billie- you are my motivation, I love you!
And finally, I would like to acknowledge the homeless population of Boulder, Colorado.
You have given me your time and your kind words. We have shared laughs, tears, and stories
together. I see your humanity and I acknowledge your burdens and struggles in this world. I wish
every homeless person I have had the pleasure to come across the resources to survive and
escape the cycle of homelessness.
3
1. Introduction
The scientific community entirely accepts that the effects of climate change are causing
rising temperatures in American urban areas. As a result, local governments are forced to
consider heat mitigation strategies for their cities. Current city action towards public safety
during times of extreme heat leave out an entire population of people— those experiencing
homelessness (Bernard et al., 2004; Uejio et al., 2011). In doing so, homeless people are
invisible in the eyes of the cities they inhabit, suffering and dying in the streets, with little aid.
Homeless populations are more vulnerable to extreme heat due to the vulnerabilities in exposure
and adaptive capacity. Due to this, city action to mitigate heat must respond to the vulnerabilities
homeless people have to heat.
The United Nation’s Intergovernmental Panel on Climate Change (IPCC) characterizes
vulnerability as adaptive capacity, sensitivity, and exposure (O’Brien et al., 2004). O’Brien et. al
(2004) describes adaptive capacity as the ability for a system to adjust or cope with climate
stressors (O’Brien et al., 2004). They define sensitivity as the degree to which a system will
respond to a change in climate, and exposure as the magnitude to which a system feels climate
stressor events (O’Brien et al., 2004).
This paper outlines the vulnerabilities of homeless populations to extreme heat due to
their limited adaptive capacity and large exposure rates. Specifically, a literature review will
cover the prior research on extreme heat in respect to homeless people’s vulnerabilities. This
literature review enabled me to create a framework that defines the specific vulnerabilities
homeless people experience to extreme heat. Further, this framework categorizes the
vulnerabilities so that cities can best respond to areas specific to the needs of their community.
Following this is a case study on American cities’ action. This case study aims to highlight what
actions the city of Phoenix and the city of Philadelphia are conducting to lessen the
vulnerabilities to heat felt by homeless communities. The next section, prior to the literature
review and case studies, will frame my methods of conducting the literature review and the case
studies.
In this paper, the homeless populations are categorized as primary homeless populations.
Primary homeless populations are those that live on the streets, in cars, or in temporary shelters,
this excludes secondary homeless people— homeless shelter residents, temporarily with
family/friends, or hopping between shelters— and it excludes tertiary homeless people— those
4
in long-term temporary housing (City of Melbourne, 2015). Homeless people are residents of
their city and deserve to be recognized in policies affecting their wellbeing. People experiencing
homelessness are the most exposed to weather and “the social and economic problems caused by
extreme weather and climate change and variability” (Gronlund et al., 2018; Kidd et al., 2021).
There is a growing need for cities to create plans to protect their lives, and this paper
comparatively analyzes two different American cities’ strategies for mitigating extreme heat for
their homeless communities. These cities are Phoenix (AZ) and Philadelphia (PA). This paper’s
objective is to understand homeless population’s vulnerability to heat, and gauge U.S. cities’
efforts for heat mitigation of the homeless populations.
Before research for the thesis started, I conducted unstructured discussions with homeless
people. The individuals’ identity, information, and stories are not included in this paper. These
people were not coded nor used for data in research. Rather, the interviews were used as a guide
for prioritizing research. The majority of these discussions were conducted on the streets of
Boulder, Colorado.
2. Methods
Research for this paper included three stages. Stage one is reviewing existing literature,
stage two is policy analysis, stage three is comparing existing policies with vulnerabilities felt.
The first stage of gathering data was conducting research through narrative reviews of
literature. The data bases used for collection of literature were “OneSearch” via University of
Colorado Boulder Libraries, and “Google Scholar.” The terms used for searching included but
not limited to: “homeless/homelessness,” “heat/extreme heat/heat waves,” “heat mitigation,”
“heat vulnerabilities,” and the two respective cities. The literature reviewed contributed to
defining extreme heat implications and the vulnerabilities of homeless populations to extreme
heat. The types of literature reviewed were research papers, climate data, peer reviewed articles,
city policy journals, city climate action plans, and homeless shelter data resources. In the
appendix, all references noted with an asterisk (*) are a part of the literature review.
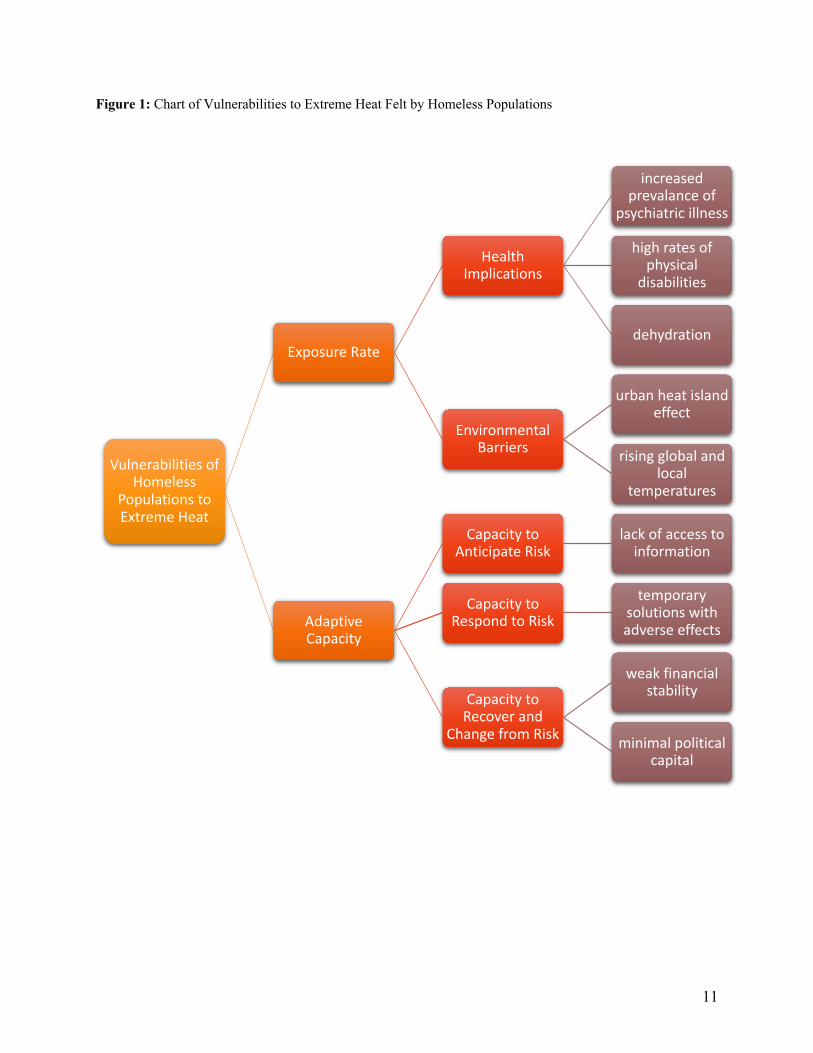
A flow chart was created to visually present the vulnerabilities found. The two major
categories in the flow chart are Exposure Rate and Adaptive Capacity, both sourced from the
UN’s IPCC definition of vulnerability. Within Exposure Rate, the two subcategories were
5
distinguished as internal and external to a homeless individual; Health Implications are internal
to an individual, and Environmental Barriers are external to an individual. The subcategories
under the Adaptive Capacity section were defined using the UN’s IPCC definition of adaptive
capacity.
Policy reviews were conducted as stage two of research. Policies were found through
research on city and county government webpages. Many government pages provided links to
homeless shelter/resource pages with more data on the cities’ homeless populations. Most
policies were found in annual city climate action plans. The research began with five cities:
Phoenix (AZ), Philadelphia (PA), Houston (TX), Portland (OR), and Boulder (CO). Boulder was
originally included as it was the site of the majority of homeless discussions leading up to the
thesis. But it was not included in the end, as it is not a city on the same population scale as the
other cities. Portland was initially included in the research because the city recently experienced
a deadly heatwave while existing in a mild climatic region. But eventually Portland was removed
from the case study due to the city size not being as comparable to Phoenix, Philadelphia, and
Houston, as well as the city references being shaded by the recent heatwave, making research
difficult. Houston was considered for this research as a comparison to a city similar to Phoenix,
and has many other natural disasters, besides extreme heat, needing city mitigation. Houston was
not a part of the final case studies due to the lack of government resources, mainly due to the
city’s desire to have little government footprint. Philadelphia remained in the study because it
has a very similar population size to Phoenix and can be used as an example of a city who is
taking action towards heat mitigation prior to heat being a large risk to the city. Phoenix was
included in the study because it is a city prone to extreme heat and is on the forefront of cities
being forced to mitigate heat.
After finding what policies exist, I compared the policies of stage two with the
vulnerabilities of stage three. This comparison highlights the strengths and limitations of city
policies to protect the lives of homeless people in times of extreme heat. A chart was created to
visually show where improvement is needed.
6
3. Literature Review
3A. Climate Implications
As the effects of climate change are studied in depth, the impacts of climatic changes
have found to be disproportionately felt. Climate change currently and predictively has a larger
impact on the poor (Field et al., 2014). Extreme climate events create poverty traps for the poor,
increasing their hardship (Field et al., 2014). Climate change is broader than just biogeological
issues. It encompasses human rights, public health, and social equity. Shonkoff et. al (2011)
highlight that without proactive policies to address the inequities of climate change, climatic
impacts will “reinforce and amplify current as well as future socioeconomic disparities” leaving
vulnerable populations with additional burdens and fewer opportunities for economic gain
(Shonkoff et al., 2011, S499). Environmental and Climate Justice confronts the ethical
proportions of climate change, acknowledging that populations with the lowest impacts towards
climate change are often the first to feel the effects of climate change. Environmental action is
occurring on highly unequal terms resulting in an “ecological debt” to the vulnerable populations
(Francis, 2015).
The Environmental Protection Agency, as well as Field et al. (2014) outline homeless
populations as at particularly high risk for extreme heat due to climate change (Environmental
Protection Agency, 2016; Field et al., 2014). Shonkoff et al.’s research (2011) shows the
disproportionate impacts of extreme weather events on low socioeconomic status households
have “the potential to exacerbate homelessness” (Shonkoff et al., 2011, page 9). Climate change
is predicted to increase the prevalence of homelessness globally, which will increase the need for
policies surrounding the populations’ safety (Kidd et al., 2021). Homeless populations possess
some of the smallest carbon footprints yet endure disproportionately large effects of climate
change (Ramin et al., 2009).
A wide dimension of environmental research found that climate change increases the
frequency, intensity, and longevity of extreme heat events (Anderson et al., 2013; Rohat et al.,
2021). Additionally, 91% of homeless populations live within urban settings, exposing
themselves to the urban heat island effect (Ramin et al., 2009). The urban heat island effect is
when low albedo (darker colored) materials replace a setting’s high albedo (lighter colored)
materials, resulting in less sun reflection and more sun absorption, as well as the reduced air flow
7
and increased car heat emissions, all resulting in an increased temperature (Environmental
Protection Agency, 2016). Homeless populations find the most amount of resources for survival
in urban environments, so the urban heat island effect is not a variable this population can avoid.
Urban planning must consider climate implications in order to protect people from higher
temperatures than what already exists in the area (Rohat et al., 2019).
Extreme heat exists during days when the apparent temperature exceeds the specific
month’s 95th percentile (Conlon et al., 2020). Extreme heat in the United States accounts for the
greatest number of weather-related deaths than any other natural hazard, and in some years, it
causes more fatalities than most weather hazards (such as tornadoes, flooding, and hurricanes)
combined (Longo et al., 2017; Uejio et al., 2011). Extreme heat and heat waves generate large
human health concerns and can produce fatal events, such as the 2003 French heat wave killing
over 14,000 people (Anderson et al., 2013; Murray et al., 2012). As climate change increases the
frequency and intensity of extreme heat and heat waves, as well as the urban heat island effect, it
is vital for cities to produce plans to protect their citizens.
3B. Vulnerabilities
Homeless populations are perceived as invisible in the eyes of disaster risk planning
(Longo et al., 2017; Wisner, 1998). Vulnerabilities to extreme weather events are felt different
by different social and socioeconomic groups. Racial and ethnic minorities, low socioeconomic
class and caste, marginalized genders and ages, physically or mentally disabled, and poor
housing or lack thereof, can increase the vulnerability of a population for an extreme weather
event (Murray et al., 2012). Homeless people are a part of an extremely vulnerable group (Bassil
et al., 2010).
Putnam et al.’s research (2018) demonstrated just how vulnerable homeless populations
are to extreme heat when they found that an increase in the number of homeless people correlates
to an increase in the number of heat-associated deaths overall (Putnam et al., 2018). This
research showed that an increase in temperature is not the driving force for an increase in heat-
related death, instead an increase in homeless people drives more heat-related deaths.
Additionally, there is other research concluding that homeless populations are
disproportionately exposed to heat with very few survival options (Bezgrebelna et al., 2021;
Longo et al., 2017; Nicolay et al., 2016; Pendrey et al., 2014). Longo et al.’s (2017) policy
8
investigations on public infrastructure to reduce exposure to heat through warning systems and
relief services again showed that the homeless people are at a particularly high vulnerability
(Longo et al., 2017). Vulnerability to human induced climate change is defined in other research
as a group’s ability to anticipate, resist, and recover from impacts of climate change (Shonkoff et
al., 2011). To understand specifically what causes people experiencing homelessness to have
such a high vulnerability to extreme heat, their experiences can be categorized under exposure
rate and adaptive capacity.
Exposure Rate
Exposure rate is the degree to which climatic stress is felt upon an individual or group
(O’Brien et al., 2004). Exposure rates can increase or decrease depending on the frequency and
intensity of extreme weather events, as well as the frequency and intensity of comorbidities
occurring in the human-biological-realm and the built environment. There are very few scientific
studies on the exposure rates of homeless populations, hence this review on the topic finds the
intersections of other populations with homeless people. This literature review does not go into
detail about the increased exposure rate due to rising temperatures because a myriad of scientific
research shows that the frequency and intensity of extreme weather events is increasing due to
human induced climate change.1
On the human-biological-realm, heat mortality is more prevalent in populations with
higher levels of disability and pre-existing health implications (City of Melbourne, 2015;
Pendrey et al., 2014; Putnam et al., 2018; Rohat et al., 2021; Uejio et al., 2011). Homeless
populations have very high rates of disability and pre-existing health problems, involving
comorbidities to extreme heat such as diabetes, pulmonary diseases, schizophrenia, and addiction
(City of Melbourne, 2015; Longo et al., 2017; Uejio et al., 2011). Longo et. al (2017)’s study
found that pre-existing psychiatric illness triples the threat of fatality from extreme heat, and
levels of psychiatric illness are significantly higher in homeless populations than the general
1 To explore this topic more, the studies conducted by the United Nation’s Intergovernmental Panel on Climate Change, specifically in AR6 Chapter 14: North America sections 14.2.1, 14.2.2, 14.6, go into detail about increasing frequency of extreme heat and increasing intensity of heat related events in the United States.
9
population (Longo et al., 2017).2 Uejio et al.’s research (2011) mentions how heat mortality
increases with higher levels of disability, but the amount of medical care can modify the
statistical relationship (Uejio et al., 2011). Homeless populations receive very little medical care
and experience high levels of disability, so they are at an increasing risk for heat mortality.
Often, addiction to alcohol and other drugs results in lack of spatial/social/atmospheric
awareness as well as increased dehydration– which exacerbates oblivion, other medical issues
present, and heat-related morbidities (Goulem, 2021).
The built environment can also exacerbate the exposure rate to extreme heat. The urban
heat island effect results in increased temperatures in urban areas, the residency of the vast
majority of homeless people. Rohat et al. (2021) present research on how heat-related
vulnerability for populations is increased without access to air conditioning (Rohat et al., 2021).
Homeless populations do not have access to air conditioning unless they are allowed into public
spaces with air conditioning. Additionally, Uejio et al. (2011)’s research highlights waste heat,
and how heat generated by air conditioning contributes to the urban heat island effect and can
increase heat exposure for households (or individuals) without air conditioning (Uejio et al.,
2011). More vulnerabilities to increased exposure rate can be found in homeless sleeping habits.3
Adaptive Capacity
The ability for one to adjust and cope to their changing environment is their adaptive
capacity (O’Brien et al., 2004). Hondula et al.’s research (2015) on adapting to rising
temperatures mentions that the relationship between extreme heat and health concerns is
seemingly straight forward until the complexity of human’s ability to adapt is considered
(Hondula et al., 2015). Homeless populations have very limited ability to adapt, highlighting the
link between their health outcomes and rising temperatures.
The ability to adapt is measured in one’s capacity to anticipate risk, respond to risk, and
recover/change (Murray et al., 2012). To anticipate risk, the United Nation’s Intergovernmental
Panel on Climate Change (IPCC) suggests planned efforts such as diversifying income sources
2 Additionally, many of these health issues cause the person to become homeless due to the costly requirements to stay ahead of their health implications. 3 Falling asleep or lying for extended periods in the sun, sleeping in the sun with multiple layers on, and being mistaken for peacefully sleeping when they are actually in a severe heat stress situation (City of Melbourne, 2015).
10
and collective action towards avoiding high risk development (Murray et al., 2012). Homeless
people have miniscule income, not enough to diversify, and have a weak social capital, posing
difficult to participate in mitigating large risk management. Additionally, to anticipate risk, easy
access to information is required. Populations that lack access to information are more prone to
injury and death (Wisner, 1998). Homeless populations do not have easy access to weather
forecasts, as well as Mukarram et al.’s research presents that 55% of homeless individuals
surveyed could not identify the symptoms associated with heat related illnesses (Mukarram et al.,
2021).
The capacity to respond to risk involves temporary solutions to mitigate climate stresses
(O’Brien et al., 2004). Most homeless individuals have this capacity, but it is weak. Homeless
individuals seek shade, a water source, or an air-conditioned public space. Other temporary
solutions can have adverse effects, such as spending money to cool down when it was originally
saved for food, shelter, and/or transportation (Murray et al., 2012). When a heatwave occurs in a
city, homeless people are not the ones scrambling to the store to buy swamp coolers and AC
units, they are in search of the bare minimum to survive. The IPCC concludes that the capacity to
respond is not sufficient to reduce risk (Murray et al., 2012). Solutions need to be more
permanent as the climate crisis worsens.
The capacity to recover and change is driven by many different factors such as financial
ability, health ability, and political will (Murray et al., 2012). The Intergovernmental Panel on
Climate Change highlights how severely limited the capacity to recover is by poverty, and this
capacity can often lead to a poverty spiral, resulting in the inability to ever return to previous
conditions (Murray et al., 2012). To recover, homeless people need health resources, financial
stability, and a just representation in political decisions. These three factors are extremely
difficult for homeless populations to gain as they are disengaged from health services, often
variable income, and “cognitively invisible” in public policies (Longo et al., 2017; Pendrey et al.,
2014).
11
Figure 1: Chart of Vulnerabilities to Extreme Heat Felt by Homeless Populations
Vulnerabilities of Homeless
Populations to Extreme Heat
Exposure Rate
Health Implications
increased prevalance of
psychiatric illness
high rates of physical
disabilities
dehydration
Environmental Barriers
urban heat island effect
rising global and local
temperatures
Adaptive Capacity
Capacity to Anticipate Risk
lack of access to information
Capacity to Respond to Risk
temporary solutions with adverse effects
Capacity to Recover and
Change from Risk
weak financial stability
minimal political capital
12
4. Case Study on American Cities
This paper is outlining two U.S. cities: Phoenix (AZ) and Philadelphia (PA). Phoenix is
selected because it resides in a climate used to very high and dry temperatures and is one of the
forefronts for anthropogenic climate change induced heat risk. Philadelphia has mild
temperatures and heat risk is seemingly not as urgent. Both cities have a responsibility for
preparing for current and future heat crises. Phoenix and Philadelphia are studied because they
have varying levels of relative urgency, with similar structures (i.e., both are cities under United
States’ government format).
4A. Phoenix, Arizona
The city of Phoenix is an ideal location to study heat risk mitigation as it is in a desert
biome, experiencing warm temperatures year-round. Phoenix is arid subtropical, with summer
temperatures averaging, in the last 30 years, at 106.5º Fahrenheit highs and 84.5º Fahrenheit lows
(NOAA, 2021; Uejio et al., 2011). In July of 2021, the City of Phoenix announced an addition to
their government: Office of Heat Response and Mitigation. This is the first of its kind, and a
large step towards mitigating human-environmental risk.
In Guyer et al.’s research on heat risk in Phoenix, they found specific risk factors that
exacerbate the effects of extreme heat, some of these factors implicitly and explicitly involve
homeless populations: low access to social services, low access to air conditioning, social
isolation, excessive outdoor time, limited knowledge of resources available, mental and physical
health issues, and homelessness (Guyer et al., 2019). During a 2005 extreme heat event, Phoenix
coroners identified two-thirds of the mortality cases as homeless people (Uejio et al., 2011).
Phoenix resides within Maricopa County and makes up the majority of its residents. An
extensive mortality report on Maricopa County provided statistics on homeless deaths. In 2020,
Maricopa County found:
• 97% of homeless deaths were outdoors (Maricopa County Public Health, 2020)
• 53% of heat related deaths were homeless people (Maricopa County Public
Health, 2020).
13
• Of the 323 heat related deaths in Maricopa County in 2020, 58% involved
substance abuse, and of that, 82% of those people were homeless (Maricopa
County Public Health, 2020).
• Of the 323 deaths, 37% were in the range of 60-64 years old, and 60% of those
people were homeless (Maricopa County Public Health, 2020).
The majority of homeless deaths (56%) occurred in July— 76 homeless people died
within the 20-day period of July 2-21, 2020— and 31% died in August – 26 homeless deaths
between August 13-21, 2020 (Maricopa County Public Health, 2020). These two months contain
the highest temperature days for Phoenix. Homeless population measurements with heat are
lacking representation and can be found cited in multiple Phoenix studies under the limitation or
further research needed areas (Uejio et al., 2011).
In a policy review of the city’s actions towards protecting homeless people from the
detriments of extreme heat, the new Office of Heat Response and Mitigation for Phoenix
outlined their key missions in mitigating heat: Cool Pavement Program, Tree and Shade Master
Plan, and Citizen Forester (Hondula et al., 2021). The Cool Pavement Programs aims to increase
albedo in the city by replacing dark pavement materials to lighter ones (Hondula et al., 2021).
The Tree and Shade Master Plan aims to increase forestry in the city, to increase the number of
shaded regions, and in turn to help reduce the temperature felt in the city (Hondula et al., 2021).
The Citizen Forester is a program to educate the community on importance of planting trees
(Hondula et al., 2021). Phoenix’s Office of Heat Response and Mitigation outlined their key
missions in response programs: We’re Cool Campaign, Heat Relief Network, and “Take a Hike,
Do It Right” campaign (Hondula et al., 2021). The We’re Cool Campaign is designed to inform
low-income residents about the city’s 44 cooling and hydration centers (Hondula et al., 2021).
The Heat Relief Network is for city partners to provide hydration stations, cooling centers, and
donation drives throughout the city (Hondula et al., 2021). This initiative could be beneficial in
allowing for effective community-based help, as Berisha et al. (2017) found that the limiting
factor to longer hours for cooling centers in Phoenix is the lack of monetary support to allow for
extended worker hours to support independent efforts (Berisha et al., 2017). The “Take a Hike,
Do It Right” campaign involves City Park Rangers assisting in heat safety measures (Hondula et
al., 2021). Additionally, the city defined 5 actionable goals for mitigating city heat (City of
Phoenix, 2021; Hondula et al., 2021):
14
1. Create a network of 100 cool corridors in vulnerable communities by 2030.
2. Increase shade (trees/constructed) in ‘flatland parks’ and street right of way to
achieve 25% canopy by 2030.
3. Provide resources and services to residents to manage heat.
4. Increase the use of high albedo, or reflective materials in infrastructure projects.
5. Develop “HeatReady” certification for cities in partnership with ASU by 2025.
In Phoenix’s 2021 Climate Action Plan, there is no mention of homeless populations at
all (City of Phoenix, 2021). But they did dedicate an entire section to environmental justice. In
this section, the plan outlined 6 key values for all climate action: (1) Equitable Representation (2)
Prioritizing Benefits, (3) Economic Impacts, (4) Health Impacts, (5) Access to Solutions, and (6)
Building Resilience (City of Phoenix, 2021)4. The 2021 Climate Action Plan conducted surveys
and workshops to better gauge the needs of Phoenix residents in regard to climate action (City of
Phoenix, 2021). These efforts are pro-active towards combating the effects of climate change in
Phoenix, but still do not include the perspective nor acknowledgement of homeless communities
in Phoenix.
4B. Philadelphia, Pennsylvania
The city of Philadelphia is in humid subtropical and humid continental climatic zones
with variable weather patterns and warm summers (Uejio et al., 2011). A study by Weber et al.
(2015) found that from 1980-2013, the number of extreme heat days in the city of Philadelphia
4 Key values for Phoenix’s Climate Action Plan as defined in the 2021 plan (City of Phoenix, 2021): (1) Equitable Representation: “The Climate Caption Planning process should provide easily accessible opportunities for any interested person to participate.” (2) Prioritizing Benefits: “Climate Action Planning strategies with the potential to provide benefits to individuals or communities, overburdened communities should be prioritized.” (3) Economic Impacts: “Climate Action Planning strategies should reduce costs, including currently externalized costs, and increase economic benefits for overburdened communities wherever possible.” (4) Health Impacts: “Climate Action Planning strategies should minimize negative health impacts and increase health benefits for disproportionately impacted communities.” (5) Access to Solutions: “Climate Action Planning strategies should promote clean technologies in ways that are equitable for all living in Phoenix.” (6). Building Resilience: “Climate Action Planning strategies should improve resilience and quality of life for overburdened communities.”
15
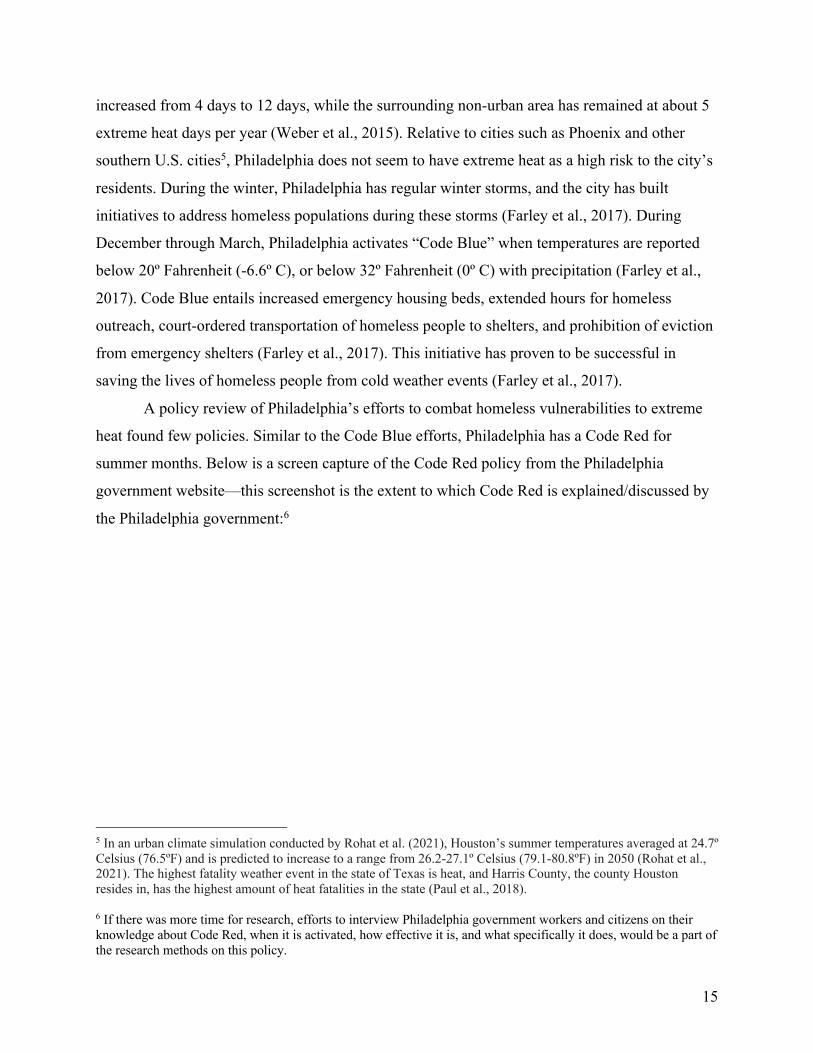
increased from 4 days to 12 days, while the surrounding non-urban area has remained at about 5
extreme heat days per year (Weber et al., 2015). Relative to cities such as Phoenix and other
southern U.S. cities5, Philadelphia does not seem to have extreme heat as a high risk to the city’s
residents. During the winter, Philadelphia has regular winter storms, and the city has built
initiatives to address homeless populations during these storms (Farley et al., 2017). During
December through March, Philadelphia activates “Code Blue” when temperatures are reported
below 20º Fahrenheit (-6.6º C), or below 32º Fahrenheit (0º C) with precipitation (Farley et al.,
2017). Code Blue entails increased emergency housing beds, extended hours for homeless
outreach, court-ordered transportation of homeless people to shelters, and prohibition of eviction
from emergency shelters (Farley et al., 2017). This initiative has proven to be successful in
saving the lives of homeless people from cold weather events (Farley et al., 2017).
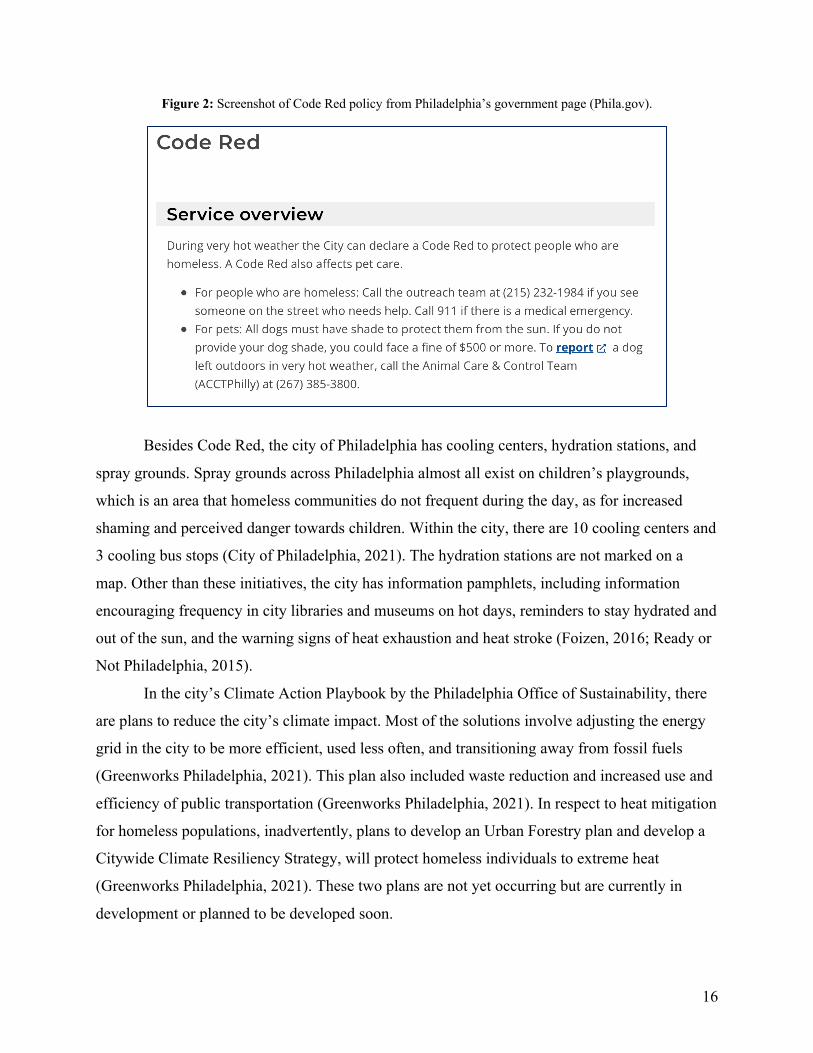
A policy review of Philadelphia’s efforts to combat homeless vulnerabilities to extreme
heat found few policies. Similar to the Code Blue efforts, Philadelphia has a Code Red for
summer months. Below is a screen capture of the Code Red policy from the Philadelphia
government website—this screenshot is the extent to which Code Red is explained/discussed by
the Philadelphia government:6
5 In an urban climate simulation conducted by Rohat et al. (2021), Houston’s summer temperatures averaged at 24.7º Celsius (76.5ºF) and is predicted to increase to a range from 26.2-27.1º Celsius (79.1-80.8ºF) in 2050 (Rohat et al., 2021). The highest fatality weather event in the state of Texas is heat, and Harris County, the county Houston resides in, has the highest amount of heat fatalities in the state (Paul et al., 2018). 6 If there was more time for research, efforts to interview Philadelphia government workers and citizens on their knowledge about Code Red, when it is activated, how effective it is, and what specifically it does, would be a part of the research methods on this policy.
16
Figure 2: Screenshot of Code Red policy from Philadelphia’s government page (Phila.gov).
Besides Code Red, the city of Philadelphia has cooling centers, hydration stations, and
spray grounds. Spray grounds across Philadelphia almost all exist on children’s playgrounds,
which is an area that homeless communities do not frequent during the day, as for increased
shaming and perceived danger towards children. Within the city, there are 10 cooling centers and
3 cooling bus stops (City of Philadelphia, 2021). The hydration stations are not marked on a
map. Other than these initiatives, the city has information pamphlets, including information
encouraging frequency in city libraries and museums on hot days, reminders to stay hydrated and
out of the sun, and the warning signs of heat exhaustion and heat stroke (Foizen, 2016; Ready or
Not Philadelphia, 2015).
In the city’s Climate Action Playbook by the Philadelphia Office of Sustainability, there
are plans to reduce the city’s climate impact. Most of the solutions involve adjusting the energy
grid in the city to be more efficient, used less often, and transitioning away from fossil fuels
(Greenworks Philadelphia, 2021). This plan also included waste reduction and increased use and
efficiency of public transportation (Greenworks Philadelphia, 2021). In respect to heat mitigation
for homeless populations, inadvertently, plans to develop an Urban Forestry plan and develop a
Citywide Climate Resiliency Strategy, will protect homeless individuals to extreme heat
(Greenworks Philadelphia, 2021). These two plans are not yet occurring but are currently in
development or planned to be developed soon.
17
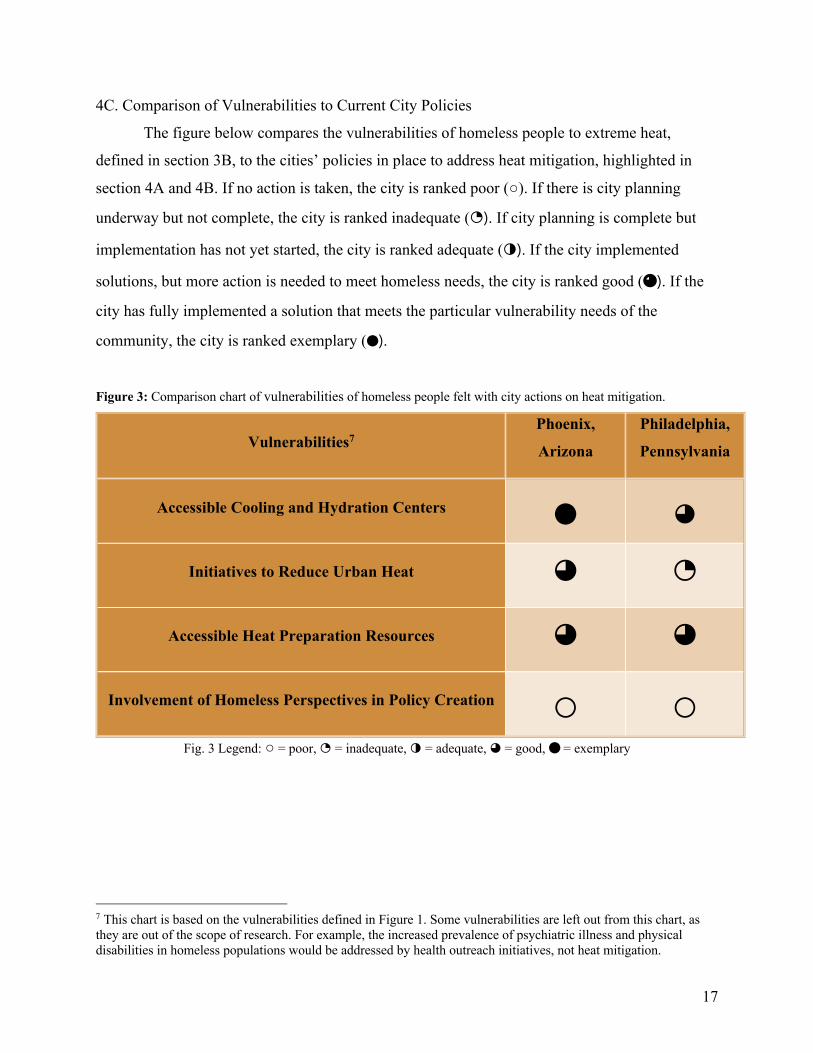
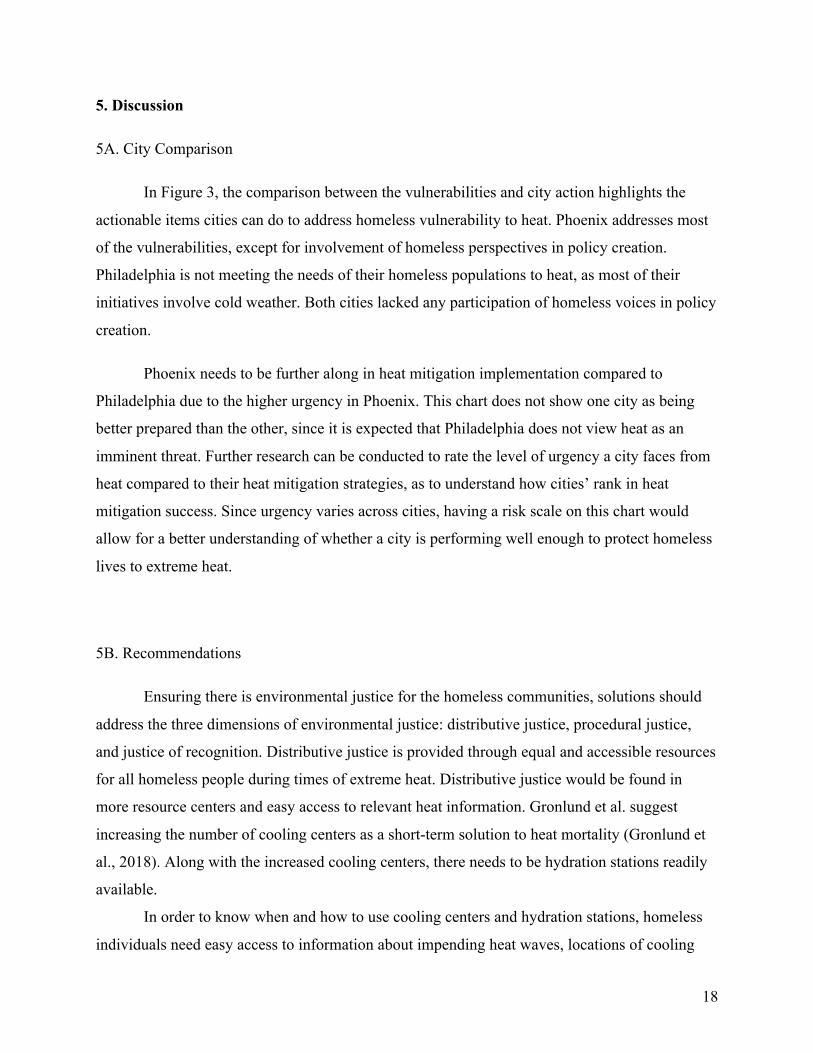
4C. Comparison of Vulnerabilities to Current City Policies
The figure below compares the vulnerabilities of homeless people to extreme heat,
defined in section 3B, to the cities’ policies in place to address heat mitigation, highlighted in
section 4A and 4B. If no action is taken, the city is ranked poor (○). If there is city planning
underway but not complete, the city is ranked inadequate (◔). If city planning is complete but
implementation has not yet started, the city is ranked adequate (◑). If the city implemented
solutions, but more action is needed to meet homeless needs, the city is ranked good (◕). If the
city has fully implemented a solution that meets the particular vulnerability needs of the
community, the city is ranked exemplary (⬤).
Figure 3: Comparison chart of vulnerabilities of homeless people felt with city actions on heat mitigation.
Vulnerabilities7 Phoenix,
Arizona
Philadelphia,
Pennsylvania
Accessible Cooling and Hydration Centers
⬤
◕
Initiatives to Reduce Urban Heat ◕ ◔
Accessible Heat Preparation Resources ◕ ◕
Involvement of Homeless Perspectives in Policy Creation ○ ○ Fig. 3 Legend: ○ = poor, ◔ = inadequate, ◑ = adequate, ◕ = good, ⬤ = exemplary
7 This chart is based on the vulnerabilities defined in Figure 1. Some vulnerabilities are left out from this chart, as they are out of the scope of research. For example, the increased prevalence of psychiatric illness and physical disabilities in homeless populations would be addressed by health outreach initiatives, not heat mitigation.
18
5. Discussion
5A. City Comparison
In Figure 3, the comparison between the vulnerabilities and city action highlights the
actionable items cities can do to address homeless vulnerability to heat. Phoenix addresses most
of the vulnerabilities, except for involvement of homeless perspectives in policy creation.
Philadelphia is not meeting the needs of their homeless populations to heat, as most of their
initiatives involve cold weather. Both cities lacked any participation of homeless voices in policy
creation.
Phoenix needs to be further along in heat mitigation implementation compared to
Philadelphia due to the higher urgency in Phoenix. This chart does not show one city as being
better prepared than the other, since it is expected that Philadelphia does not view heat as an
imminent threat. Further research can be conducted to rate the level of urgency a city faces from
heat compared to their heat mitigation strategies, as to understand how cities’ rank in heat
mitigation success. Since urgency varies across cities, having a risk scale on this chart would
allow for a better understanding of whether a city is performing well enough to protect homeless
lives to extreme heat.
5B. Recommendations
Ensuring there is environmental justice for the homeless communities, solutions should
address the three dimensions of environmental justice: distributive justice, procedural justice,
and justice of recognition. Distributive justice is provided through equal and accessible resources
for all homeless people during times of extreme heat. Distributive justice would be found in
more resource centers and easy access to relevant heat information. Gronlund et al. suggest
increasing the number of cooling centers as a short-term solution to heat mortality (Gronlund et
al., 2018). Along with the increased cooling centers, there needs to be hydration stations readily
available.
In order to know when and how to use cooling centers and hydration stations, homeless
individuals need easy access to information about impending heat waves, locations of cooling
19
centers, locations of hydration stations, and hours of operations for those and other support
systems. Additionally, homeless populations need easy access to information about what heat
sickness looks like, when to seek help, and other survival information about incoming extreme
heat events. Without accessible information on how to utilize the help centers or when to seek
aid, homeless people will not receive distributive justice. Both Phoenix and Philadelphia have
informational pamphlets about what heat illness looks like and how to avoid it. But these
pamphlets are in the perspective of those living in houses. There needs to be informational
guides for homeless people, as the non-homeless perspective guides include many survival tips
that are inaccessible or unattainable to homeless people.
To guarantee procedural justice, homeless voices must be a part of city decision making
on policies that effect their lives. As Wisner highlights in the discussion of his findings, policy
planners cannot fully understand the needs of marginal populations unless the population is
invited and encouraged to speak up (Wisner, 1998). Wisner also recognizes that there are many
obstacles between full participation of marginal groups on policy development, and it is the job
of the policy planners to clear the obstacles (Wisner, 1998). To increase homeless voices in
policy developments, outreach and accessible workshops are necessary.
In 2018, Arizona held a workshop to increase connections of individuals and agencies
working to mitigate extreme heat impacts (Guyer et al., 2019). The workshop was mostly
successful, but Guyer et al. (2019) notes that there are still gaps remaining for the best practices
towards heat preparedness and response (Guyer et al., 2019). Gaillard et al. (2019)’s research on
homeless people’s experience with natural hazards found that establishing dialogue between
stakeholders, which they define as including homeless people, is essential in understanding and
securing the resources required for homeless population’s safety and livelihood, especially since
they experience unique precarities (Gaillard et al., 2019).
Additionally, Gaillard et al. acknowledge that the locations homeless people frequent
(parks, churches, support centers/services, and footpaths for hustling), are temporary in the
individual’s transient lifestyle, as homeless people tend to seek sites that are discrete and
secluded (Gaillard et al., 2019). This makes outreach difficult as individual’s locations are
unknown to the public and unknown even within the individual’s social network (Gaillard et al.,
2019).
20
A lot of policy development is through analytics that tend to exclude homeless people
(Longo et al., 2017). Without a smart phone, bank account, credit card, or regular internet
connection, the networks of sensors and monitors do not capture the data of homeless people,
rendering them invisible in any analytic approach to policy development and biasing all data
against their interests (Longo et al., 2017). Additionally, Bassil et al.’s research on reducing
morbidity and mortality to heat found that “telephone and postal surveys and face-to-face
interviews that recruit participants at public places such as shopping plazas, typically in suburban
rather than urban areas, do not capture important vulnerable groups like the socially isolated and
homeless” (Bassil et al., 2010). Through my research, I cannot advise the best practices for
effective homeless outreach and consideration, but nonetheless, homeless individual outreach
efforts should be a crucial step in policy development.
Justice of recognition can be provided through the acknowledgment of homeless people
as a population of city residents in policy planning. In Phoenix and Philadelphia, homeless
populations were not included as a crucial resident population, sometimes not even mentioned at
all, in climate action plans. Providing the basic human desire of recognition of humanity is
necessary in providing justice to homeless populations.
5C. Limitations
The largest limitation to this thesis is lack of prior research. City governments lack
concern for homeless people and heat, resulting in little information provided. If given more time
to conduct this project, interviews, risk assessment, and inclusion of other cities would be added.
Interviews with homeless people in Phoenix and Philadelphia would add to this paper through a
first-hand perspective on whether city policies are effective in meeting their needs. Additionally,
interviews with members of the city governments would provide more information on policies
than what the government web pages provide. Specifically, I am interested in the details and
effectiveness of Code Red in Philadelphia, as the web page provided very little information.
In figure 3, I believe the chart would be more effective in evaluation if there was a rank
of heat-risk urgency per city. Showing the varying level of risk would allow for the cities to be
compared to each other as to who is performing better. Without the addition of a measurement of
21
urgency, the cities cannot be compared to each other, rather they stand alone, only compared to
the vulnerabilities they are responding to.
Inclusion of more cities in the case study would provide a larger view as to what different
U.S. governments are doing for heat mitigation. A wider scope of city action could provide
examples of effective practices for other cities to adopt. Additionally, the inclusion of global
cities could aid in this effort as well. For example, the city of Melbourne (Victoria, Australia),
has an extensive list of homeless vulnerabilities to heat, and how the city is addressing the
problems (City of Melbourne, 2015). More research into Melbourne and other global cities could
expand the possibilities of addressing the homeless vulnerabilities to heat.
5D. Conclusion
Climate change expects to have the greatest impact on populations that are already
vulnerable. Homeless populations are made up of veterans, transgender people, people of color,
disabled people, and more marginalized and minority populations. The vulnerability to natural
hazards reflects homeless people’s everyday uncertainty and invisibility, inequitably compared
to the power and resources shared by the rest of society (Gaillard et al., 2019). Homeless
populations are among the lowest contributors to climate change and have one of the smallest
carbon footprints, yet they bear a disproportionate front end of climate change forces (Ramin et
al., 2009). As a consequence of their lack of financial resources, protective permanent shelter,
and basic services, homeless populations fall into a poverty trap whenever an extreme event
occurs (Field et al., 2014).
Proactive versus reactive policies for vulnerable populations are a matter of life and death
for homeless people. Phoenix is already experiencing high frequency of extreme heat days
annually, and the need for effective policies is urgent. Phoenix succeeds at addressing the rising
apparent temperature in the city, but their Office of Heat Response and Mitigation must continue
reaching their goals in a timely manner. Although Philadelphia does not currently face an urgent
need to respond to extreme heat similar to Phoenix, the efforts must be in place now, before a
period of extreme heat hits the city. Philadelphia has cooling and hydration centers in place, but
22
most heat mitigation strategies are not fully developed. Policies mitigating extreme heat need to
be proactive, otherwise the vulnerabilities described in section 3B will lead to the death of
homeless individuals. Cities need to act eagerly and effectively on creating procedures to combat
the effects of extreme heat.
23
6. Appendix 6A. References *Anderson, G. B., Bell, M. L., & Peng, R. D. (2013). Methods to calculate the heat index as an exposure metric in environmental health research. Environmental Health Perspectives, 121(10), 1111-1119. https://doi.org/10.1289/ehp.1206273 *Bassil, K. L., & Cole, D. C. (2010). Effectiveness of public health interventions in reducing morbidity and mortality during heat episodes: a structured review. International journal of environmental research and public health, 7(3), 991-1001 Berisha, V., Hondula, D., Roach, M., White, J. R., McKinney, B., Bentz, D., ... & Goodin, K. (2017). Assessing adaptation strategies for extreme heat: a public health evaluation of cooling centers in Maricopa County, Arizona. Weather, climate, and society, 9(1), 71-80. Bernard, S. M., & McGeehin, M. A. (2004). Municipal heat wave response plans. American Journal of Public Health (1971), 94(9), 1520-1522. https://doi.org/10.2105/AJPH.94.9.1520 *Bezgrebelna, M., McKenzie, K., Wells, S., Ravindran, A., Kral, M., Christensen, J., ... & Kidd, S. A. (2021). Climate change, weather, housing precarity, and homelessness: a systematic review of reviews. International Journal of Environmental Research and Public Health, 18(11), 5812. *City of Melbourne (2015) Heatwaves and Homelessness. https://www.melbourne.vic.gov.au/SiteCollectionDocuments/heatwaves-homelessness.pdf City of Philadelphia (2021) Cooling Resources [Map]. https://phl.maps.arcgis.com/apps/webappviewer/index.html?id=0afe8e198cd84da6a51ca4af027a7056 City of Phoenix (2021) Climate Action Plan. City of Phoenix https://www.phoenix.gov/oepsite/Documents/2021ClimateActionPlanEnglish.pdf *Conlon, K. C., Mallen, E., Gronlund, C. J., Berrocal, V. J., Larsen, L., & O’neill, M. S. (2020). Mapping human vulnerability to extreme heat: a critical assessment of heat vulnerability indices created using principal components analysis. Environmental health perspectives, 128(9), 097001 *Environmental Protection Agency. (2016). Climate Change and Extreme Heat- What You Can Do to Prepare. United States Environmental Protection Agency & Center for Disease Control. https://www.epa.gov/sites/default/files/2016-10/documents/extreme-heat-guidebook.pdf Farley, T., Gulino, S., Hoffman, R., Bissell, D. (2017) City of Philadelphia Homeless Death Review Report 2011-2015. Department of Public Health Medical Examiner’s Office. https://www.phila.gov/media/20180418095811/HDR-Report-2011-2015-Deaths.pdf
24
*Field, C. B., Barros, V. R., Dokken, D. J., Mach, K. J., Mastrandrea, M. D., Bilir, T. E., ... & Genova, R. C. (2014). AR5 Climate Change 2014: Impacts, Adaptation, and Vulnerability, Global and Sectoral Aspects, Working Group II Contribution to the Fifth Assessment Report of the Intergovernmental Panel on Climate Change. Foizen, N. (2016). How to Stay Cool During Philly’s 5th Heatwave. Philadelphia Office of Emergency Management. https://www.phila.gov/posts/oem/2016-08-10-how-to-stay-cool-during-phillys-5th-heat-wave/ *Francis, P. (2015, May 24). Encyclical Letter Laudato Si' of the Holy Father Francis on the Care for Our Common Home. Laudato si' Francis. Retrieved from https://www.vatican.va/content/francesco/en/encyclicals/documents/papa-francesco_20150524_enciclica-laudato-si.html#_ftn30 Gaillard, J. C., Walters, V., Rickerby, M., & Shi, Y. (2019). Persistent precarity and the disaster of everyday life: homeless people’s experiences of natural and other hazards. International Journal of Disaster Risk Science, 10(3), 332-342 Genova, R. C. (2014). AR5 Climate Change 2014: Impacts, Adaptation, and Vulnerability, Global and Sectoral Aspects, Working Group II Contribution to the Fifth Assessment Report of the Intergovernmental Panel on Climate Change. *Goulem, B. (2021, Jul 02). Extreme heat puts homeless residents at risk. Kingston Whig - Standard https://colorado.idm.oclc.org/login?url=https://www-proquest-com.colorado.idm.oclc.org/newspapers/extreme-heat-puts-homeless-residents-at-risk/docview/2547793232/se-2?accountid=14503 Greenworks Philadelphia (2021) Philadelphia Climate Action Playbook. City of Philadelphia Office of Sustainability. https://www.phila.gov/media/20210113125627/Philadelphia-Climate-Action-Playbook.pdf Gronlund, C. J., Sullivan, K. P., Kefelegn, Y., Cameron, L., & O’Neill, M. S. (2018). Climate change and temperature extremes: A review of heat-and cold-related morbidity and mortality concerns of municipalities. Maturitas, 114, 54-59. Guyer, H. E., Putnam, H. F., Roach, M., Iñiguez, P., & Hondula, D. M. (2019). Cross-sector management of extreme heat risks in Arizona. Bulletin of the American Meteorological Society, 100(3), ES101-ES104. *Hondula, D. M., Balling, R. C., Vanos, J. K., & Georgescu, M. (2015). Rising temperatures, human health, and the role of adaptation. Current Climate Change Reports, 1(3), 144-154. Hondula, D., Litwin, M., (2021) City of Phoenix Office of Heat Response and Mitigation. Urban Climate Research Center at Arizona State University. https://www.phoenix.gov/heatsite/Documents/ASU%20Poster%20Final.pdf
25
*Kidd, S. A., Greco, S., & McKenzie, K. (2021). Global Climate implications for homelessness: a scoping review. Journal of Urban Health, 98(3), 385-393. *Longo, J., Kuras, E., Smith, H., Hondula, D. M., & Johnston, E. (2017). Technology use, exposure to natural hazards, and being digitally invisible: Implications for policy analytics. Policy & Internet, 9(1), 76-108. Maricopa County Public Health. (2020). Heat-Associated Deaths in Maricopa County, AZ Final Report for 2020. CivicPlus. https://www.maricopa.gov/ArchiveCenter/ViewFile/Item/5240 *Mukarram, Mahnoor, Rao, V., Mukarram, Maheeyah, Hondula, D. M., Buras, M. R, and Kling J. M. (2021) Menopausal symptoms in underserved and homeless women living in extreme temperatures in the southwest. Women's Health Reports, 2(1), 44-52. https://doi.org/10.1089/whr.2020.0083 *Murray, V., & Ebi, K. L. (2012). IPCC special report on managing the risks of extreme events and disasters to advance climate change adaptation (SREX). Journal of Epidemiology and Community Health (1979), 66(9), 759-760. https://doi.org/10.1136/jech-2012-201045 National Oceanic and Atmospheric Administration (NOAA) (2021). NWS Phoenix, Phoenix, Yuma, & El Centro July 2021 Climate Data. U.S. Department of Commerce. Retrieved from https://www.weather.gov/psr/July2021ClimateData *Nicolay, M., Brown, L. M., Johns, R., & Ialynytchev, A. (2016). A study of heat related illness preparedness in homeless veterans. International Journal of Disaster Risk Reduction, 18, 72-74. https://doi.org/10.1016/j.ijdrr.2016.05.009 *O’Brien, K., Leichenko, R., Kelkar, U., Venema, H., Aandahl, G., Tompkins, H., Javed, A., Bhadwal, S., Barg, S., Nygaard, L., & West, J. (2004). Mapping vulnerability to multiple stressors: Climate change and globalization in India. Global Environmental Change, 14(4), 303-313. https://doi.org/10.1016/j.gloenvcha.2004.01.001 Paul, S. H., Sharif, H. O., & Crawford, A. M. (2018). Fatalities caused by hydrometeorological disasters in Texas. Geosciences, 8(5), 186. *Pendrey, C. G., Carey, M., & Stanley, J. (2014). Impacts of extreme weather on the health and well-being of people who are homeless. Australian Journal of Primary Health, 20(1), 2-3 Philadelphia Office of Homeless Services (2020). 2020 Annual Report- Now More Than Ever, Housing is Healthcare. City of Philadelphia. https://www.phila.gov/media/20210602140814/OHS-annualreport2020-20200928.pdf *Putnam, H., Hondula, D. M., Urban, A., Berisha, V., Iñiguez, P., & Roach, M. (2018). It’s not the heat, it’s the vulnerability: attribution of the 2016 spike in heat-associated deaths in Maricopa County, Arizona. Environmental research letters, 13(9), 094022.
26
*Ramin, B., & Svoboda, T. (2009). Health of the homeless and climate change. Journal of Urban Health, 86(4), 654-664. Ready or Not Philadelphia (2015). Stay Cool Guide: How to Protect Your Health When It’s Hot. Philadelphia Department of Public Health & Philadelphia Water Department. https://www.phila.gov/media/2015/06/readyornot-StayCoolGuide-oem.pdf *Rohat, G. T., Flacke, J., Dosio, A., Dao, H., & Maarseveen, M. (2019). Projections of human exposure to dangerous heat in African cities under multiple socioeconomic and climate scenarios. Earth's Future, 7(5), 528-546. https://doi.org/10.1029/2018EF001020 *Rohat, G. T., Wilhelmi, O., Flacke, J., Monaghan, A., Gao, J., van Maarseveen, M., & Dao, H. (2021). Assessing urban heat-related adaptation strategies under multiple futures for a major US city. Climatic Change, 164(3), 1-20 *Shonkoff, S. B., Morello-Frosch, R., Pastor, M., & Sadd, J. (2011). The climate gap: environmental health and equity implications of climate change and mitigation policies in California—a review of the literature. Climatic Change, 109(1), 485-503. *Uejio, C. K., Wilhelmi, O. V., Golden, J. S., Mills, D. M., Gulino, S. P., & Samenow, J. P. (2011). Intra-urban societal vulnerability to extreme heat: The role of heat exposure and the built environment, socioeconomics, and neighborhood stability. Health & Place, 17(2), 498-507. https://doi.org/10.1016/j.healthplace.2010.12.005 Weber, S., Sadoff, N., Zell, E., & de Sherbinin, A. (2015). Policy-relevant indicators for mapping the vulnerability of urban populations to extreme heat events: A case study of Philadelphia. Applied Geography, 63, 231-243. *Wisner, B. (1998). Marginality and vulnerability: Why the homeless of Tokyo don't ‘count’ in disaster preparations. Applied Geography (Sevenoaks), 18(1), 25-33. https://doi.org/10.1016/S0143-6228(97)00043-X
Related Documents