Vol.:(0123456789) 1 3 Applied Water Science (2019) 9:13 https://doi.org/10.1007/s13201-018-0887-3 ORIGINAL ARTICLE Morphometric analysis using SRTM and GIS in synergy with depiction: a case study of the Karmanasa River basin, North central India K. Prakash 1 · Diksha Rawat 2 · S. Singh 1 · K. Chaubey 1 · S. Kanhaiya 1,4 · T. Mohanty 3 Received: 30 July 2018 / Accepted: 26 December 2018 / Published online: 4 January 2019 © The Author(s) 2019 Abstract The Karmanasa basin is spread over the Kaimur sandstone (Upper Vindhyan) and marginal Ganga plain with the areal exten- sion of about 7926 km 2 . The quantitative approach of the basin development of the Karmanasa River basin was carried out by the morphometric parameters. The drainage network was extracted from SRTM data. The trellis pattern characterizes upstream of the drainage basin, while the dendritic pattern is noticed in middle and downstream of the basin. The drainage density (0.34–0.44) indicates that the basin has highly permeable subsoil and thick vegetative cover. Relatively larger values of form factor (SW-1, SW-2, SW-3, SW-6 and KW) signify higher flow peak for a shorter duration. High values of ruggedness number and relief ratio suggest that Karmanasa basin is prone to soil erosion. The present work shows that the Karmanasa basin is less prone to flood, vulnerable to soil erosion and a good resource of surface water. This study would help to utilize the water resources and extended for sustainable development of the Karmanasa River basin area. Keywords North central India · Karmanasa River basin · Morphometric · Drainage density · Soil erosion Introduction Morphometric analysis of the river basin is a quantitative representation of basin. Morphometric analysis of a basin provides information about the characteristics of the drain- age system, topographic pattern of earth’s surface, the shape and dimensions of its landforms, and it is also an impera- tive technique to assess and comprehend the role of basin dynamics (Pati et al. 2006, 2008; Withanage et al. 2014; Prakash et al. 2016a, b; Singh et al. 2018a, b). The morpho- metric analysis strengthens fundamental of the geometric uniqueness of the fluvial landscape with the degree of litho- logical and structural controls (Pophare and Balpande 2014). In addition, the drainage patterns have good indicators for subsurface geology and effective processes (Ritter 1986). The morphometric analysis was adopted to determine issues related to basin analysis (Thomas et al. 2010; Singh et al. 2014); prioritization of micro-basins provides valu- able information water resources potential assessment and management (Chandrashekar et al. 2015; Pankaj and Kumar 2009; Sarmah et al.2012; Vandana 2013). Digital elevation model (DEM) is the dataset for vari- ous studies that include morphometric, neo-tectonic and hydrologic studies (Jensen 1991; Patel et al. 2016; Wise 2000; Singh and Kanhaiya 2015; Prakash et al. 2017a, b, c; Kanhaiya et al. 2018). Extracting drainage parameters from DEM is proficient, accurate and efficient (Moore et al. 1991). GIS platform is ideal for morphometric analysis because of its potency in processing and quantifying topo- graphic data (Altaf et al. 2013; Prakash et al. 2016a, b). In the absence of hydrologic data, morphometric analysis can provide significant information about hydrologic character- istics of the basin (Perucca and Angilieri 2011; Angillieri 2012; Soni 2016; Kabite and Gessesse 2018; Kaushik and Ghosh 2018a, b). These studies tried to the developed relationship between morphometric drainage parameters and hydrologic charac- teristics of the basin using GIS technique. Therefore, the present aim of the study was to quantify morphometric * S. Singh [email protected] 1 Centre of Advanced Study in Geology, Institute of Science, Banaras Hindu University, Varanasi, India 2 Department of Applied Geology, IIT (ISM), Dhanbad, India 3 Civil Engineering Department, Ujjain Engineering College, Ujjain, India 4 Prof. Rajendra Singh (Rajju Bhaiya), Institute of Physical Sciences for Study and Research, VBSPU, Jaunpur, India

Welcome message from author
This document is posted to help you gain knowledge. Please leave a comment to let me know what you think about it! Share it to your friends and learn new things together.
Transcript
Vol.:(0123456789)1 3
Applied Water Science (2019) 9:13 https://doi.org/10.1007/s13201-018-0887-3
ORIGINAL ARTICLE
Morphometric analysis using SRTM and GIS in synergy with depiction: a case study of the Karmanasa River basin, North central India
K. Prakash1 · Diksha Rawat2 · S. Singh1 · K. Chaubey1 · S. Kanhaiya1,4 · T. Mohanty3
Received: 30 July 2018 / Accepted: 26 December 2018 / Published online: 4 January 2019 © The Author(s) 2019
AbstractThe Karmanasa basin is spread over the Kaimur sandstone (Upper Vindhyan) and marginal Ganga plain with the areal exten-sion of about 7926 km2. The quantitative approach of the basin development of the Karmanasa River basin was carried out by the morphometric parameters. The drainage network was extracted from SRTM data. The trellis pattern characterizes upstream of the drainage basin, while the dendritic pattern is noticed in middle and downstream of the basin. The drainage density (0.34–0.44) indicates that the basin has highly permeable subsoil and thick vegetative cover. Relatively larger values of form factor (SW-1, SW-2, SW-3, SW-6 and KW) signify higher flow peak for a shorter duration. High values of ruggedness number and relief ratio suggest that Karmanasa basin is prone to soil erosion. The present work shows that the Karmanasa basin is less prone to flood, vulnerable to soil erosion and a good resource of surface water. This study would help to utilize the water resources and extended for sustainable development of the Karmanasa River basin area.
Keywords North central India · Karmanasa River basin · Morphometric · Drainage density · Soil erosion
Introduction
Morphometric analysis of the river basin is a quantitative representation of basin. Morphometric analysis of a basin provides information about the characteristics of the drain-age system, topographic pattern of earth’s surface, the shape and dimensions of its landforms, and it is also an impera-tive technique to assess and comprehend the role of basin dynamics (Pati et al. 2006, 2008; Withanage et al. 2014; Prakash et al. 2016a, b; Singh et al. 2018a, b). The morpho-metric analysis strengthens fundamental of the geometric uniqueness of the fluvial landscape with the degree of litho-logical and structural controls (Pophare and Balpande 2014). In addition, the drainage patterns have good indicators for
subsurface geology and effective processes (Ritter 1986). The morphometric analysis was adopted to determine issues related to basin analysis (Thomas et al. 2010; Singh et al. 2014); prioritization of micro-basins provides valu-able information water resources potential assessment and management (Chandrashekar et al. 2015; Pankaj and Kumar 2009; Sarmah et al.2012; Vandana 2013).
Digital elevation model (DEM) is the dataset for vari-ous studies that include morphometric, neo-tectonic and hydrologic studies (Jensen 1991; Patel et al. 2016; Wise 2000; Singh and Kanhaiya 2015; Prakash et al. 2017a, b, c; Kanhaiya et al. 2018). Extracting drainage parameters from DEM is proficient, accurate and efficient (Moore et al. 1991). GIS platform is ideal for morphometric analysis because of its potency in processing and quantifying topo-graphic data (Altaf et al. 2013; Prakash et al. 2016a, b). In the absence of hydrologic data, morphometric analysis can provide significant information about hydrologic character-istics of the basin (Perucca and Angilieri 2011; Angillieri 2012; Soni 2016; Kabite and Gessesse 2018; Kaushik and Ghosh 2018a, b).
These studies tried to the developed relationship between morphometric drainage parameters and hydrologic charac-teristics of the basin using GIS technique. Therefore, the present aim of the study was to quantify morphometric
* S. Singh [email protected]
1 Centre of Advanced Study in Geology, Institute of Science, Banaras Hindu University, Varanasi, India
2 Department of Applied Geology, IIT (ISM), Dhanbad, India3 Civil Engineering Department, Ujjain Engineering College,
Ujjain, India4 Prof. Rajendra Singh (Rajju Bhaiya), Institute of Physical
Sciences for Study and Research, VBSPU, Jaunpur, India
Applied Water Science (2019) 9:13
1 3
13 Page 2 of 10
parameters (linear, areal and relief aspects) and hydrologi-cally characterize the Karmanasa basin. This valuable infor-mation could help in soil and water resource planning and basin management.
Study area
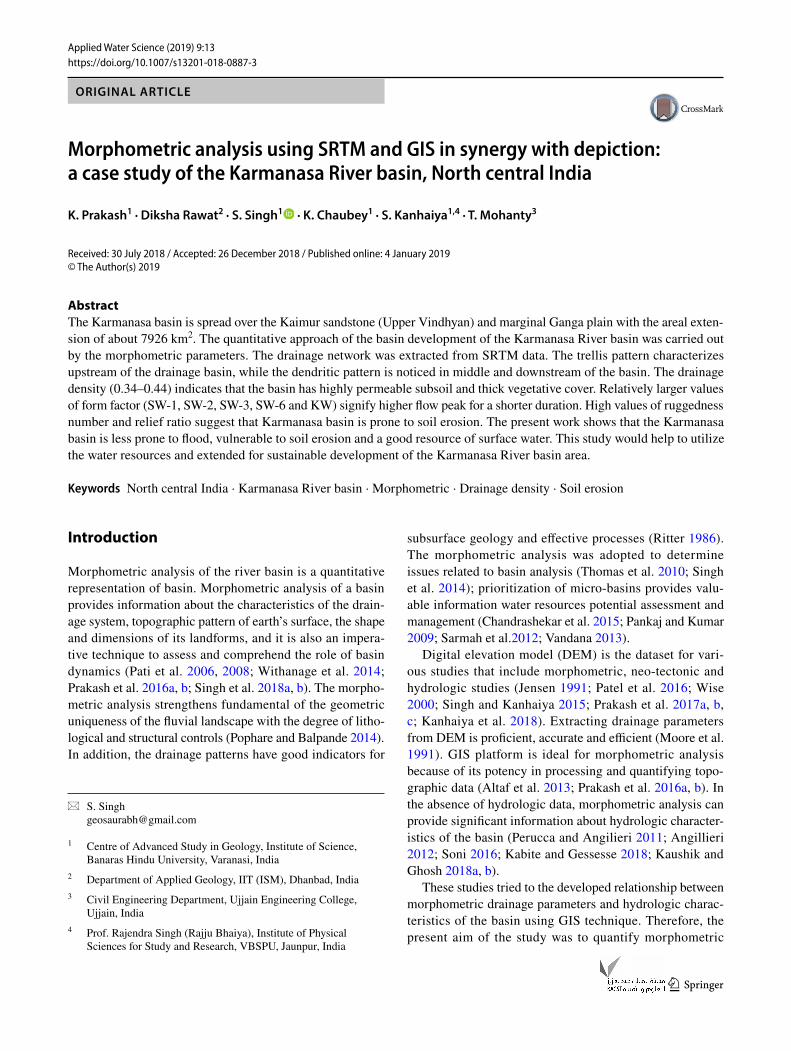
The Karmanasa River is an important marginal plain tribu-tary of Ganga River (Fig. 1). The Karmanasa originates at the height of 350 meters of the Kaimur Group of Upper Vindhyan Supergroup near Sarodag in Kaimur district of Bihar (Fig. 1). The river flows in a north-westerly direction through the marginal Ganga plain near Chandauli district (Uttar Pradesh), also it forms the eastern boundary between Uttar Pradesh and Bihar, and finally joins the Ganga river near Chausa district of Bihar. The total drainage area of the Karmanasa River basin is 7926 km2, and perimeter of the
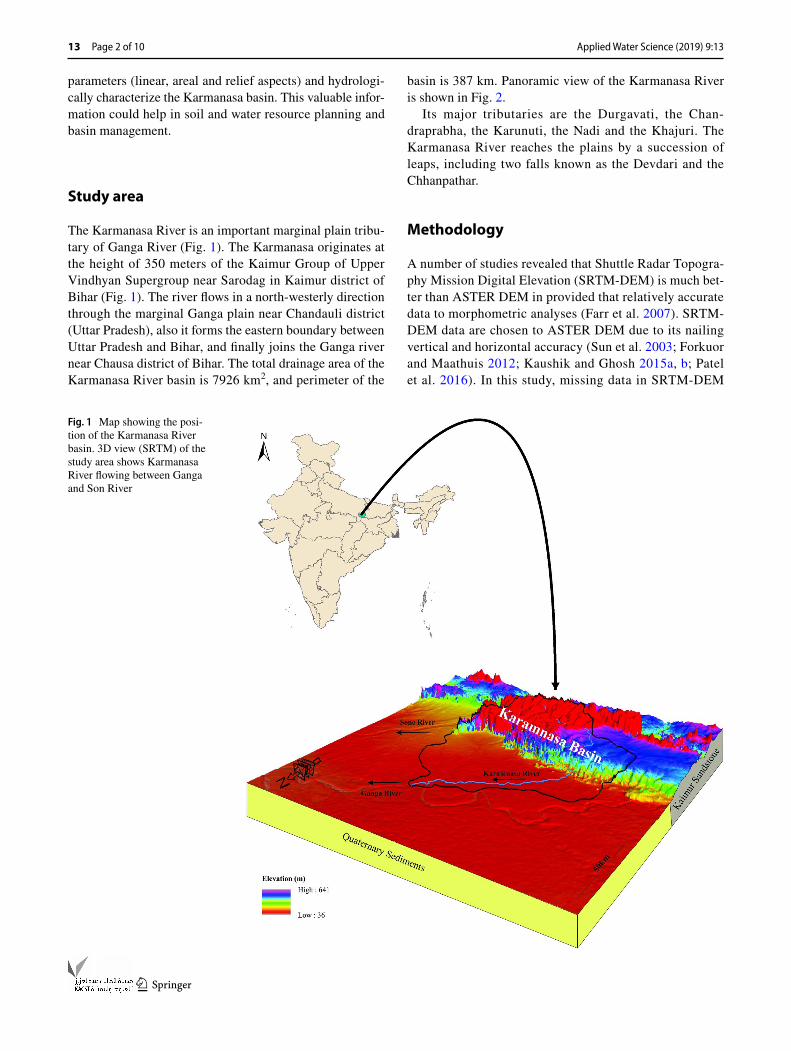
basin is 387 km. Panoramic view of the Karmanasa River is shown in Fig. 2.
Its major tributaries are the Durgavati, the Chan-draprabha, the Karunuti, the Nadi and the Khajuri. The Karmanasa River reaches the plains by a succession of leaps, including two falls known as the Devdari and the Chhanpathar.
Methodology
A number of studies revealed that Shuttle Radar Topogra-phy Mission Digital Elevation (SRTM-DEM) is much bet-ter than ASTER DEM in provided that relatively accurate data to morphometric analyses (Farr et al. 2007). SRTM-DEM data are chosen to ASTER DEM due to its nailing vertical and horizontal accuracy (Sun et al. 2003; Forkuor and Maathuis 2012; Kaushik and Ghosh 2015a, b; Patel et al. 2016). In this study, missing data in SRTM-DEM
Fig. 1 Map showing the posi-tion of the Karmanasa River basin. 3D view (SRTM) of the study area shows Karmanasa River flowing between Ganga and Son River
Applied Water Science (2019) 9:13
1 3
Page 3 of 10 13
(Fig. 1) are filled by interpolation techniques and sink fill algorithm applied as preprocessing of DEM for minimiz-ing errors.
The base maps of the basins were prepared from SRTM data and data to download from the Consultative Group for International Agriculture Research Consortium for Spatial Information (CGIAR-CSI). Drainage map is derived from the processing of an SRTM data of the study area, with a spatial resolution of 90 m. ArcGIS-10 software was used for delineating the study area and exporting the informa-tion. Drainage network was analyzed using Horton’s (1932, 1945), and Strahler (1964) methods were adopted. The mor-phometric parameter (length of the individual stream, basin area and perimeter of the basin) was extracted in the Arc GIS-10 platform and used for the morphometric analysis (linear, areal and relief aspects, Table 1). As a result, signifi-cant geomorphic parameters such as contours, slope gradient and aspects have been quantified.
Results
The morphometric analysis includes a mathematical analysis of the basin, altitude, volume, slope, profiles of the stream (Clark 1966). The Karmanasa basin occupies 7926.19 km2 areas in Kaimur sandstone and marginal Ganga plain. The parameters linear, areal and relief aspects have been exam-ined and described in the following sections.
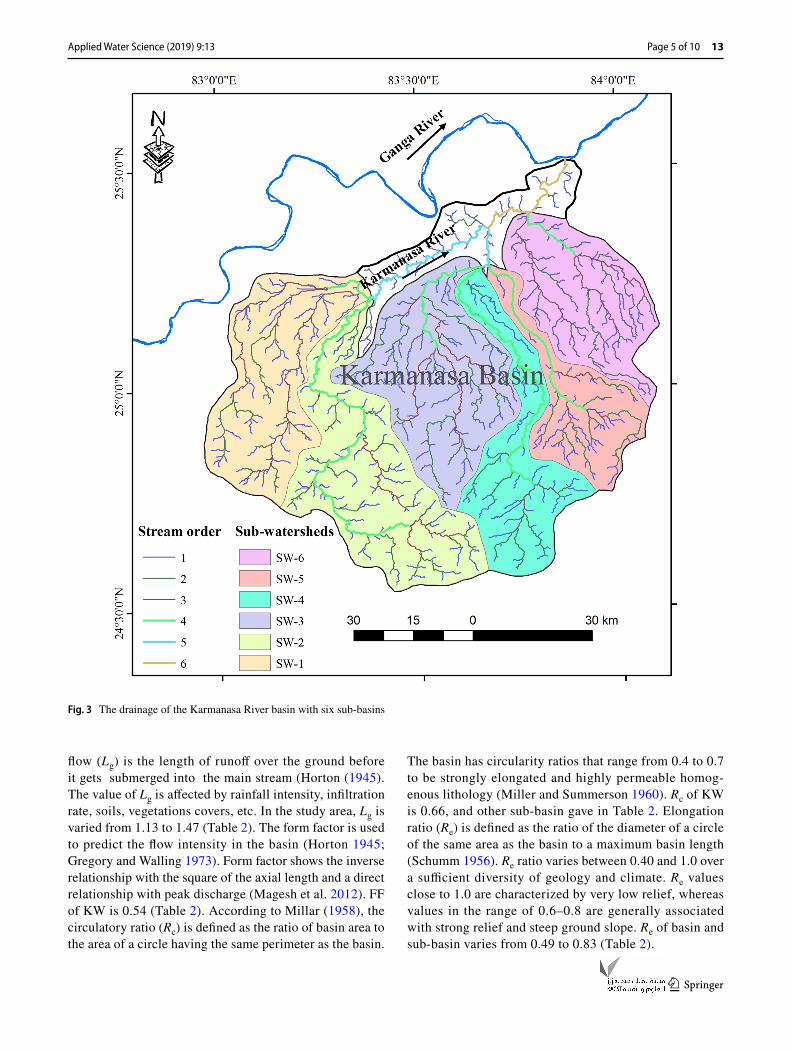
The drainage orientations of the Karmanasa River basin (KW) show polymodal distribution. The drainage patterns in the Karmanasa basin are dendritic in nature, reflecting that the significant parts of the basin have uniform lithol-ogy and horizontal to gently dipping strata, while the trel-lis drainage pattern also noticed in the marginal part of the basin (Fig. 3). The river is following the regional slope and is well adjusted to the different geological structures of the area. The dendritic drainage pattern indicates that the area has homogeneous lithology.
Fig. 2 a Panoramic view of the Karmanasa River is an exposi-tion of meandering nature. b Incision of the river and devel-opment of cliff section along the right bank of Karmanasa River
Applied Water Science (2019) 9:13
1 3
13 Page 4 of 10
Linear aspects
The perimeter of the Karmanasa basin is 387.68 km (Table 2). According to Horton (1945), a measure of the position of the stream in the hierarchy of tributaries is defined as stream order. The classification of streams based on the stream order and tributary junction’s type has demonstrated to be a convenient marker of stream size, discharge and drainage area (Strahler, 1957). The KW is allocated as 6th-order stream (Fig. 3).
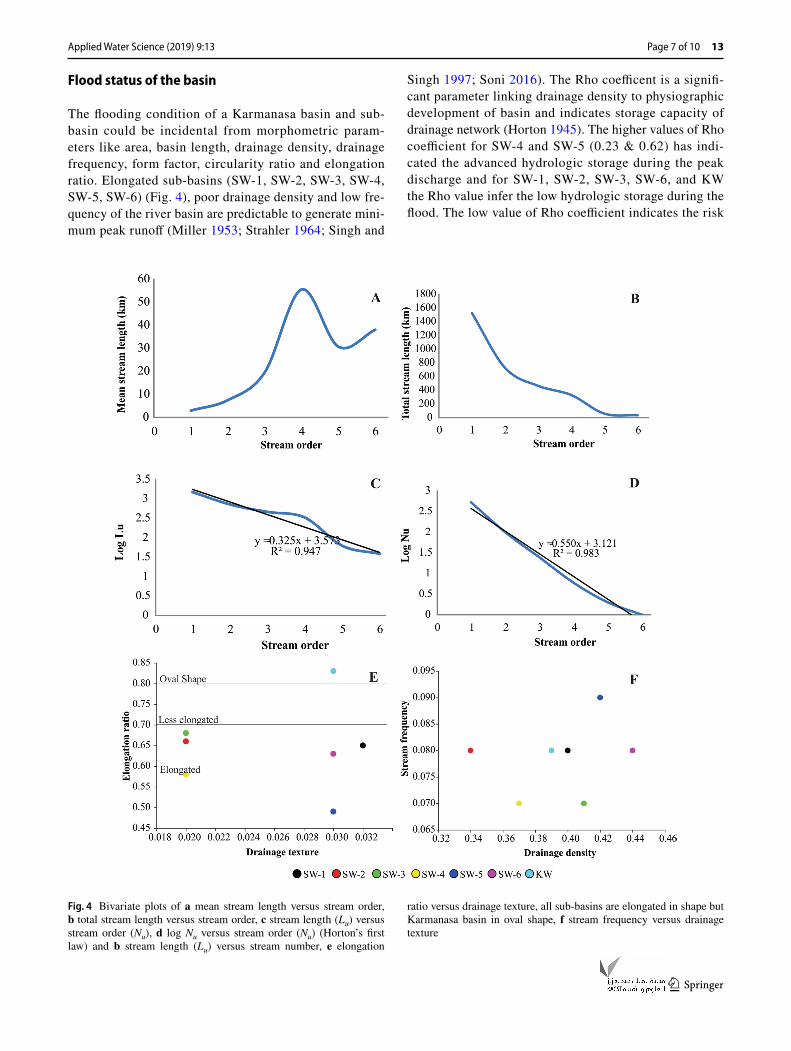
Stream length is a significant morphometric parameter of the basin as it reveals surface runoff nature. Streams that have relatively smaller lengths are characteristics of the steeper slope and finer texture of the area. The streams having comparatively long lengths are suggestive of flat topography with gentle gradients. According to the law of stream length (Horton 1945), the total length of stream segments is maximum in first-order streams and decreases as the stream order increases. The mean and total stream length of each stream order is given in Table 2. The rela-tionship between stream length and basin area is character-ized as the headward erosion is the predominant driver for the drainage network development and expansion (Hack 1957). The average stream length ratio is observed maxi-mum 2.46 (SW-4) and minimum 0.53 (SW-3) (Table 2), suggestive of the control of rock types and structures in the development of drainage basin.
Bifurcation ratio (Strahler 1964) is defined as the ratio of the number of streams of a given order (Nu) to the number of streams to the next higher order (Nu + 1). The average values of bifurcation ratio that vary from 3.54 (SW-3) to 4.82 (SW-2) suggest the structures control of the basin.
Areal aspects
Drainage density (Dd) is described as the ratio of total chan-nel lengths to the basin area (Horton 1945; Strahler 1964). The Dd in the study area varies between 0.34 (SW-2) and 0.44 (SW-6) (Table 2).
The drainage texture refers to the relative channel spac-ing of a total number of stream segments of a given length per unit area (Smith 1950), which is notably prejudiced by climate, vegetation, lithology, soil type, relief and stage of development of a basin.
According to Smith (1950), the drainage texture is classified into five different textures, very coarse (< 2), coarse (2–4), moderate (4–6), fine (6–8) and very fine (> 8). The study area comes under very coarse drain-age texture (0.02–0.03; Table 2). According to Schumm (1956), inverse of drainage density is termed as a constant of channel maintenance (C). In the study area, C varies from 2.27 to 2.94 (Table 2). A significant value of C indi-cates a higher infiltration rate and matures to the old stage of the river basin (Schumm 1956). The length of overland
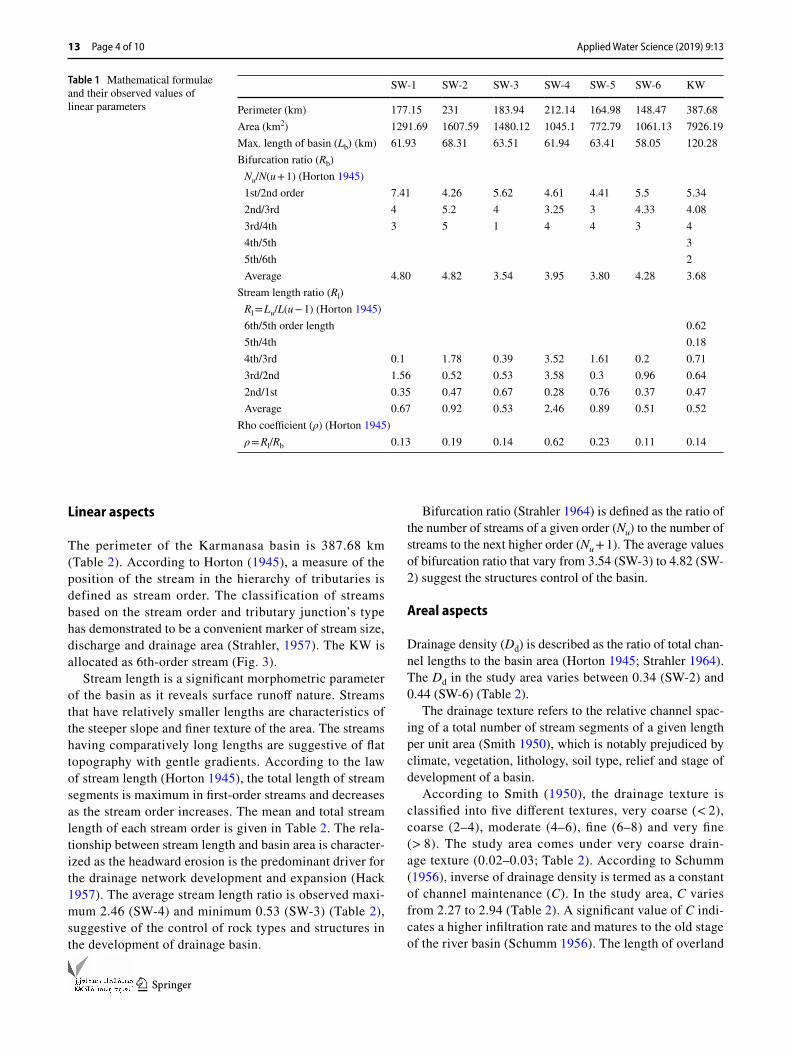
Table 1 Mathematical formulae and their observed values of linear parameters
SW-1 SW-2 SW-3 SW-4 SW-5 SW-6 KW
Perimeter (km) 177.15 231 183.94 212.14 164.98 148.47 387.68Area (km2) 1291.69 1607.59 1480.12 1045.1 772.79 1061.13 7926.19Max. length of basin (Lb) (km) 61.93 68.31 63.51 61.94 63.41 58.05 120.28Bifurcation ratio (Rb) Nu/N(u + 1) (Horton 1945) 1st/2nd order 7.41 4.26 5.62 4.61 4.41 5.5 5.34 2nd/3rd 4 5.2 4 3.25 3 4.33 4.08 3rd/4th 3 5 1 4 4 3 4 4th/5th 3 5th/6th 2 Average 4.80 4.82 3.54 3.95 3.80 4.28 3.68
Stream length ratio (Rl) Rl = Lu/L(u − 1) (Horton 1945) 6th/5th order length 0.62 5th/4th 0.18 4th/3rd 0.1 1.78 0.39 3.52 1.61 0.2 0.71 3rd/2nd 1.56 0.52 0.53 3.58 0.3 0.96 0.64 2nd/1st 0.35 0.47 0.67 0.28 0.76 0.37 0.47 Average 0.67 0.92 0.53 2.46 0.89 0.51 0.52
Rho coefficient (ρ) (Horton 1945) ρ = Rl/Rb 0.13 0.19 0.14 0.62 0.23 0.11 0.14
Applied Water Science (2019) 9:13
1 3
Page 5 of 10 13
flow (Lg) is the length of runoff over the ground before it gets submerged into the main stream (Horton (1945). The value of Lg is affected by rainfall intensity, infiltration rate, soils, vegetations covers, etc. In the study area, Lg is varied from 1.13 to 1.47 (Table 2). The form factor is used to predict the flow intensity in the basin (Horton 1945; Gregory and Walling 1973). Form factor shows the inverse relationship with the square of the axial length and a direct relationship with peak discharge (Magesh et al. 2012). FF of KW is 0.54 (Table 2). According to Millar (1958), the circulatory ratio (Rc) is defined as the ratio of basin area to the area of a circle having the same perimeter as the basin.
The basin has circularity ratios that range from 0.4 to 0.7 to be strongly elongated and highly permeable homog-enous lithology (Miller and Summerson 1960). Rc of KW is 0.66, and other sub-basin gave in Table 2. Elongation ratio (Re) is defined as the ratio of the diameter of a circle of the same area as the basin to a maximum basin length (Schumm 1956). Re ratio varies between 0.40 and 1.0 over a sufficient diversity of geology and climate. Re values close to 1.0 are characterized by very low relief, whereas values in the range of 0.6–0.8 are generally associated with strong relief and steep ground slope. Re of basin and sub-basin varies from 0.49 to 0.83 (Table 2).
Fig. 3 The drainage of the Karmanasa River basin with six sub-basins
Applied Water Science (2019) 9:13
1 3
13 Page 6 of 10
Relief aspects
In the relief, aspects are calculated as relief ratio (Rr), basin relief (R), ruggedness number (Rn) and gradient ratio (Rg), and the data are presented in Table 2. Basin relief is a param-eter that shows the elevation difference between the highest and lowest point in the basin (Hadley and Schumm 1961). It is the determined stream gradient that influences flood pat-tern and volume of sediment that can be transported (Had-ley and Schumm 1961; Kanhaiya et al. 2018). The basin relief varies from 0.085 to 0.58 km (Table 2). According to Schumm (1956), relief ratio is a ratio between basin relief and basin length. Relief ratio is an effective measure of gradient aspects of the basin (Schumm 1956; Vittala et al. 2004). Relief ratio in study area varies from 0.004 (KW) and 0.014 (SW-6) (Table 2). The ruggedness number (Strahler 1958; Vijith and Satheesh 2006) is defined as the product of basin relief and drainage density. The ruggedness value of the Karmanasa basin is 0.22 (Table 2). Gradient ratio is
a parameter which indicates channel slope which enables measurement of the runoff volume (Sreedevi et al. 2004, 2009; Thomas et al. 2010). The Rg value of KW is 0.004 (Table 2).
Hydro‑geomorphologic characteristics of Karmanasa River basin
The basin morphometric parameters are strongly correlated with basin hydrologic processes (Jensen 1991; Altaf et al. 2013; Prakash et al. 2017a, b; Kanhaiya et al. 2018; Singh et al. 2018a, b; Kabite and Gessesse 2018; Kaushik and Ghosh 2018a, b). The morphometric analyses make it pos-sible to infer the significant hydrologic behavior of a basin such as flooding, soil erosion and groundwater recharge of a basin from the quantitative morphometric analysis.
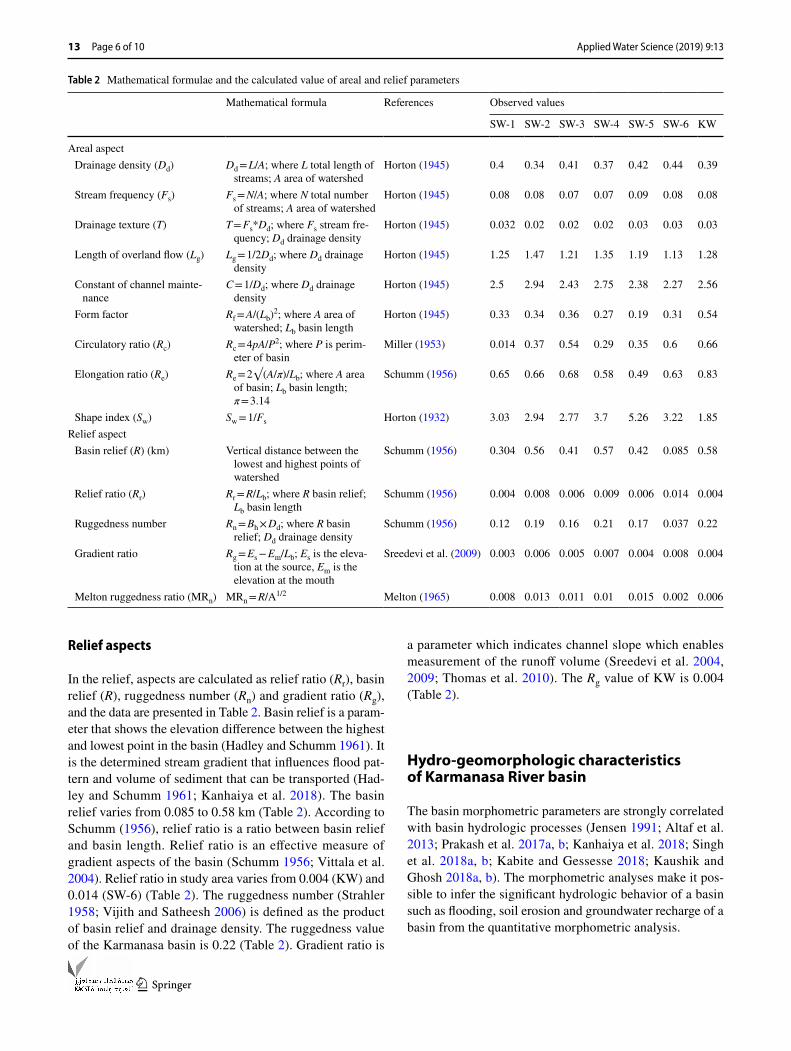
Table 2 Mathematical formulae and the calculated value of areal and relief parameters
Mathematical formula References Observed values
SW-1 SW-2 SW-3 SW-4 SW-5 SW-6 KW
Areal aspect Drainage density (Dd) Dd = L/A; where L total length of
streams; A area of watershedHorton (1945) 0.4 0.34 0.41 0.37 0.42 0.44 0.39
Stream frequency (Fs) Fs = N/A; where N total number of streams; A area of watershed
Horton (1945) 0.08 0.08 0.07 0.07 0.09 0.08 0.08
Drainage texture (T) T = Fs*Dd; where Fs stream fre-quency; Dd drainage density
Horton (1945) 0.032 0.02 0.02 0.02 0.03 0.03 0.03
Length of overland flow (Lg) Lg = 1/2Dd; where Dd drainage density
Horton (1945) 1.25 1.47 1.21 1.35 1.19 1.13 1.28
Constant of channel mainte-nance
C = 1/Dd; where Dd drainage density
Horton (1945) 2.5 2.94 2.43 2.75 2.38 2.27 2.56
Form factor Rf = A/(Lb)2; where A area of watershed; Lb basin length
Horton (1945) 0.33 0.34 0.36 0.27 0.19 0.31 0.54
Circulatory ratio (Rc) Rc = 4pA/P2; where P is perim-eter of basin
Miller (1953) 0.014 0.37 0.54 0.29 0.35 0.6 0.66
Elongation ratio (Re) Re = 2√(A/π)/Lb; where A area of basin; Lb basin length; π = 3.14
Schumm (1956) 0.65 0.66 0.68 0.58 0.49 0.63 0.83
Shape index (Sw) Sw = 1/Fs Horton (1932) 3.03 2.94 2.77 3.7 5.26 3.22 1.85Relief aspect Basin relief (R) (km) Vertical distance between the
lowest and highest points of watershed
Schumm (1956) 0.304 0.56 0.41 0.57 0.42 0.085 0.58
Relief ratio (Rr) Rr = R/Lb; where R basin relief; Lb basin length
Schumm (1956) 0.004 0.008 0.006 0.009 0.006 0.014 0.004
Ruggedness number Rn = Bh × Dd; where R basin relief; Dd drainage density
Schumm (1956) 0.12 0.19 0.16 0.21 0.17 0.037 0.22
Gradient ratio Rg = Es − Em/Lb; Es is the eleva-tion at the source, Em is the elevation at the mouth
Sreedevi et al. (2009) 0.003 0.006 0.005 0.007 0.004 0.008 0.004
Melton ruggedness ratio (MRn) MRn = R/A1/2 Melton (1965) 0.008 0.013 0.011 0.01 0.015 0.002 0.006
Applied Water Science (2019) 9:13
1 3
Page 7 of 10 13
Flood status of the basin
The flooding condition of a Karmanasa basin and sub-basin could be incidental from morphometric param-eters like area, basin length, drainage density, drainage frequency, form factor, circularity ratio and elongation ratio. Elongated sub-basins (SW-1, SW-2, SW-3, SW-4, SW-5, SW-6) (Fig. 4), poor drainage density and low fre-quency of the river basin are predictable to generate mini-mum peak runoff (Miller 1953; Strahler 1964; Singh and
Singh 1997; Soni 2016). The Rho coefficent is a signifi-cant parameter linking drainage density to physiographic development of basin and indicates storage capacity of drainage network (Horton 1945). The higher values of Rho coefficient for SW-4 and SW-5 (0.23 & 0.62) has indi-cated the advanced hydrologic storage during the peak discharge and for SW-1, SW-2, SW-3, SW-6, and KW the Rho value infer the low hydrologic storage during the flood. The low value of Rho coefficient indicates the risk
Fig. 4 Bivariate plots of a mean stream length versus stream order, b total stream length versus stream order, c stream length (Lu) versus stream order (Nu), d log Nu versus stream order (Nu) (Horton’s first law) and b stream length (Lu) versus stream number, e elongation
ratio versus drainage texture, all sub-basins are elongated in shape but Karmanasa basin in oval shape, f stream frequency versus drainage texture
Applied Water Science (2019) 9:13
1 3
13 Page 8 of 10
of flooding during heavy rainfall as the drainage channels have less capacity to store much runoff.
The form factor is prophesying the flow concentration of a basin with a defined area and also has a direct linkage to peak discharge (Horton 1945; Gregory and Walling 1973). Relatively larger values of Ff (SW-1, SW-2, SW-3, SW-6, KW) indicate higher flow peak for a shorter duration. The value of the Ff indicates that the interval time is high in the area resulting in less chance for flooding to occur.
Soil erosion characteristics of the basin
Soil erosion potential and its intensity in a given basin could be obtained from areal and relief aspect (Tejpal 2013). The parameters indicate soil erosion potential which is the length of overland flow (Lg), Constant of channel maintenance (C), basin relief, relief ratio, channel gradients, ruggedness num-ber, basin length and Melton ruggedness number. A high values of Lg (1.35- 1.47) and C (0.60-0.66) for SW-1, SW-2, SW-3, SW-4, SW-5, SW-6, and KW, indicate that the area has undergone through the sheet erosion process (Horton 1945; Strahler 1952; Schumm 1956).
The variability in stream length ratio (RI) shows the relationship between slope and topography. It has an essen-tial control of discharge and different erosional stages of the basin (Sreedevi et al. 2004). The increase in RI value from lower to higher order illustrates geomorphic maturity of the basin (Thomas et al. 2010). The high stream length ratio (2.46) is alluding high erosional activity in the subwa-tershed (SW-4).
The parameters (Lg, C, R, Rn, RI) evince that the basin is characterized by a steep slope and rough topographically which allows sediment production and transportation (Wil-ford et al. 2004). The ruggedness value (0.22) of the Kar-manasa basin refers that the region is more prone to soil erosion. More elongated basin configuration (SW-1, SW-2, SW-3, SW-4, SW-5, SW-6) and drainage characteristics (low drainage density, coarse texture and low drainage frequency) of the sub-basins (SW-1, SW-2, SW-3, SW-4, SW-5, SW-6) may counterbalance the high soil erosion status that could result from topographic effect. The vulnerability of the basin to severe soil erosion could be tailored by vegetation cover and soil type.
Groundwater recharges potential of the basin
Groundwater recharge potential is prejudiced by stream fre-quency, drainage density, drainage texture, length of over-land flow, etc. Those parameters represent information about the infiltration capacity of the surface and surface runoff (Singh et al. 2014; Soni 2016). Low drainage density of the sub-basins (SW-1, SW-2, SW-3, SW-4, SW-5, SW-6) is favoured of highly permeable subsoil materials or resistant
lithology, under dense vegetations (Strahler 1964). Accord-ing to this study, sub-basins (SW-1, SW-2, SW-3, SW-4, SW-5, SW-6) show high groundwater recharges potential.
Morphometric parameters (stream frequency, drainage density, drainage texture, length of overland flow) indicate that water runoff and sediments transportation are slow in the study area which gets extended time to infiltrate during such slow motion. This runoff could be due to the occur-rence of underlying permeable materials. Karmanasa basin has been six-order basin. The drainage density of the sub-basin and Karmanasa basin indicates that the nature of sub-surface materials is permeable as the drainage density is less than 0.5. Poor drainage density and coarse drainage texture characteristic of the Karmanasa basin show good potential for the construction of artificial recharge structures. The mean bifurcation ratios in the study area are between 3.8 and 4.82, demonstrating that the stream networks are formed in the least structural disturbances (Chow 1964; Mekel 1970; Nautiyal 1994; Thomas et al. 2010; Kanhaiya et al. 2018).
Conclusion
The study remote sensing and GIS techniques are useful tools to substantiate the different stages of hydro-geomor-phologic interpretation of river basin. Morphometric analy-ses bestow way to understand the status of landform and their processes. High values of ruggedness number and relief ratio suggest that Karmanasa basin is prone to soil erosion with the high degree of slopes and high surface runoff. The analysis is further supported for water recourse planning and management in the water sacristy area of the basin. The various attributes of a drainage basin play a signifi-cant role in locating sites for artificial recharge structures. However, a comparison of all the six sub-basins shows that the poor drainage density hence is suitable for construction of recharge structures. In the study area, streams up to the 3rd order are traversed in high altitude, whereas higher-order (4th, 5th and 6th order) streams flow in the relatively flat area and thus will be suitable for the construction of small storage dam (check dams) in the area to recharge the groundwater and further to improve the water table in the Karmanasa basin.
Acknowledgements KP is thankful to DST-SERB Project (No. P07/673) for the financial assistant. The authors are also grateful to the Head of Department, Geology, Banaras Hindu University, for providing departmental GIS laboratory for computing facilities.
Open Access This article is distributed under the terms of the Crea-tive Commons Attribution 4.0 International License (http://creat iveco mmons .org/licen ses/by/4.0/), which permits unrestricted use, distribu-tion, and reproduction in any medium, provided you give appropriate credit to the original author(s) and the source, provide a link to the Creative Commons license, and indicate if changes were made.
Applied Water Science (2019) 9:13
1 3
Page 9 of 10 13
References
Altaf F, Meraj G, Romshoo AS (2013) Morphometric analysis to infer the hydrological behaviour of Lidder Watershed, Western Hima-laya, India. Geography J 2013:1–14
Angillieri EYM (2012) Morphometric characterization of the Carrizal basin applied to the evaluation of flash floods hazards, San Juan, Argentina. Quat Int 253:74–79
Chandrashekar H, Lokesh VK, Sameena M, Roopa J, Ranganna G (2015) GIS based morphometric analysis of two reservoir catch-ments of Arkavati River, Ramanagaram District, Karnataka. International Conference on water resources, Coastal and Ocean Engineering (ICWCOE2015). Aquat Procedia 4:1345–1353
Clark C (1966) Morphometry from maps. Essay in geomorphology. Elsevier publication company, New York, pp 235–274
Chow VT (1964) Handbook of applied hydrology. McGraw-Hill, New York
Farr T, Rosen PA, Caro E, Crippen R, Duren R, Hensley S (2007) The shuttle radar topography mission. Rev Geophys 45:RG2004
Forkuor G, Maathuis B (2012) Chapter 9: Comparison of SRTM and ASTER derived digital elevation models over two regions in Ghana-implications for hydrological and environmental mode-ling. In: Piacentini T (ed) Studies on environmental and applied geomorphology. InTech, Rijeka, pp 219–240
Gregory KJ, Walling DE (1973) Drainage basin. Form and process: A geomorphological approach. Edward Arnold, London
Hack JT (1957) Studies of longitudinal stream profiles in Virginia and Maryland. US Geological Survey Professional paper 294-B Horton, R.E. (1932)
Hadley R, Schumm S (1961) Sediment sources and drainage basin characteristics in upper Cheyenne River basin. USGS water sup-ply paper, 1531-B Washington DC, 198
Horton RE (1932) Drainage basin characteristics. Trans Am Geophys Union 13:350–361
Horton RE (1945) Erosional development of streams and their drain-age basins hydrophysical approach to quantitative morphology. Geol Soc Am Bull 56:275–370
Jensen SK (1991) Applications of hydrologic information automati-cally extracted from digital elevation models. Hydrol Process 5(1):31–44
Kabite G, Gessesse B (2018) Hydro-geomorphological characteriza-tion of Dhidhessa River Basin, Ethiopia. Int Soil Water Conserv Res 6:175–183
Kanhaiya S, Singh BP, Singh S, Mittal P, Srivastava VK (2018) Morphometric analysis, bed-load sediments and weathering intensity in the Khurar River Basin, Central India. Geol J. https ://doi.org/10.1002/gj.3194
Kaushik P, Ghosh P (2015a) 3D DEM delineation of Chambal river basin from SRTM data using remote sensing and GIS technol-ogy. Int J Remote Sens Geosci 4(4):1–6
Kaushik P, Ghosh P (2015b) Geomorphic evolution of Chambal River origin in Madhya Pradesh using remote sensing and GIS. Int J Adv Remote Sens GIS 4(1):1130–1141
Kaushik P, Ghosh P (2018a) Morphometric analysis of Shipra River sub-basin, India, remote sensing and GIS approach. Int J Creat Res Thoughts 6(1):1536–1546
Kaushik P, Ghosh P (2018b) Morphometric analysis of Mej sub-basin, Rajasthan, India, using remote sensing and GIS applica-tions. Int J Creat Res Thoughts 6(1):1379–1392
Magesh NS, Jitheshlal KV, Chandrasekar N, Jini KV (2012) GIS-based morphometric evaluation of Chimmini and Mupily water-sheds, parts of Western Ghats, Thrissur District, Kerala, India. Earth Sci Inf 5:111–121
Mekel JFM (1970) The use of aerial photographs in geological map-ping. ITC Text Book Photo-interpret 8:1–169
Melton MA (1965) The geomorphic and paleo-climatic significance of alluvial deposits in Southern Arizona. J Geol 73:1–3
Millar JP (1958) High mountainous streams; effect of geology on channel characteristics and bed material. New Mexico Bureau Mines Miner Resour 4:51
Miller VC (1953) A quantitative geomorphic study of drainage basin characteristics in the Clinch mountain area, Virginia and Tennes-see. Department of Geology, Columbia University, New York, pp 389–402
Miller OM, Summerson CH (1960) Slope zone map. Geogr Rev 50:194–202
Moore ID, Grayson RB, Ladspm AR (1991) Digital terrain model-ling: a review of hydrological, geomorphological and biological applications. Hydrol Process 5:3–30
Nautiyal MD (1994) Morphometric analysis of a drainage basin, district Dehradun, Uttar Pradesh. J Indian Soc Remote Sens 22(4):251–261
Pankaj A, Kumar P (2009) GIS-based Morphometric Analysis of five major-watersheds of Song river, Dehradun District, Uttara-khand with special reference to landslide incidences. J Indian Soc Remote Sens 37:157–166
Patel A, Katiyar KS, Prasad V (2016) Performances evaluation of dif-ferent open source DEM using differential global positioning sys-tem (DGPS). Egypt J Remote Sens Space Sci 19(1):7–16
Pati JK, Malviya VP, Prakash K (2006) Basement re-activation and its relation to neotectonic activity in and around Allahabad, Ganga Plain. J Indian Soc Remote Sens 34:47–56
Pati JK, Lal J, Prakash K, Bhusan R (2008) Spatiotemporal shift of Western bank of the Ganga River, Allahabad City and its Implica-tions. J Indian Soc Remote Sens 36:289–297
Perucca PL, Angilieri EY (2011) Morphometric characterization of Del Molle basin applied to the evaluation of flash floods hazard, Iglesia Department, San Juan, Argentina. Quatern Int 233:81–86
Pophare AM, Balpande US (2014) Morphometric analysis of Suketi river basin, Himachal Himalaya, India. J Earth Syst Sci 123:1501–1515
Prakash K, Mohanty T, Singh S, Chaubey K, Prakash P (2016a) Drain-age morphometry of the Dhasan river basin, Bundelkhand craton, central India using remote sensing and GIS techniques. J Geomat 10:21–132
Prakash K, Singh S, Shukla UK (2016b) Morphometric changes of the Varuna river basin, Varanasi district, Uttar Pradesh. J Geom 10:48–54
Prakash K, Chaubey K, Singh S, Mohanty T, Singh CK (2017a) Mor-phometric analysis of the Satna river basin, Central India. Indian J Geomorphol 22:41–60
Prakash K, Mohanty T, Pati JK, Singh S, Chaubey K (2017b) Morpho-tectonics of the Jamini River basin, Bundelkhand Craton, Central India; using remote sensing and GIS technique. Appl Water Sci 7:3767–3782
Prakash K, Singh S, Mohanty T, Chaubey K, Singh CK (2017c) Mor-phometric assessment of Gomati river basin, middle Ganga plain, Uttar Pradesh, North India. Spat Inf Res 25:449–458
Ritter DF (1986) Process geomorphology, 2nd edn. William C. Brown Company Publishers, Dubuque
Sarmah K, Jha LK, Tiwari BK (2012) Morphometric analysis of a high-land micro watershed in East Khasi Hills District of Meghalaya, India: using remote sensing and geographic information system (GIS) techniques. J Geol Reg Plan 5:142–150
Schumm SA (1956) Evolution of drainage systems and slopes in bad-lands at Perth Amboy, New Jersey. Geol Soc Am Bull 67:597–646
Singh S, Kanhaiya S (2015) Morphometry of the Barakar river basin, India: a remote sensing and GIS approach. Int J Curr Res 7(7):17948–17955
Singh S, Singh MC (1997) Morphometric analysis of Kanhar river basin. Natl Geogr J India 43(1):31–43
Applied Water Science (2019) 9:13
1 3
13 Page 10 of 10
Singh P, Gupta A, Singh M (2014) Hydrological inferences from the watershed analysis of water resource management using remote sensing and techniques. Egypt J Remote Sens Space Sci 17:111–121
Singh S, Kanhaiya S, Singh A, Chaubey K (2018a) Drainage net-work characteristics of the Ghaghghar River Basin (GRB), Son Valley, India. Geol Ecol Landsc. https ://doi.org/10.1080/24749 508.2018.15256 70
Singh S, Kumar S, Mittal P, Kanhaiya S, Prakash P, Kumar R (2018b) Drainage basin parameters of Bagh river, a sub-basin of Narmada river, Central India: analysis and implications. J Appl Geochem 20(1):91–102
Smith KG (1950) Standards for grading textures of erosional topogra-phy. Am J Sci 248:655–668
Soni S (2016) Assessment of morphometric characteristics of Chakra watershed in Madhya Pradesh India using the geospatial tech-nique. Appl Water Sci 7:2089–2102
Sreedevi PD, Subrahmanyam K, Ahmed S (2004) The significance of morphometric analysis for obtaining groundwater potential zones in a structurally controlled terrain. Environ Geol 47:412–420
Sreedevi PD, Owais S, Khan H, Ahmed S (2009) Morphometric analy-sis of a watershed of South India using SRTM data and GIS. J Geol Soc India 73:543–552
Strahler AN (1952) Hypsometric area altitude. Analysis of erosional topography. Geol Soc Am Bull 63:1117–1142
Strahler AN (1957) Quantitative analysis of watershed geomorphology. Trans Am Geophys Union 38:913–920
Strahler AN (1958) Dimensional analysis applied to fluvially eroded landforms. Geol Soc Am Bull 69:279–300
Strahler A (1964) Quantitative geomorphology of drainage basins and channel networks. In: Chow V (ed) Handbook of applied hydrol-ogy. McGraw Hill, New York, pp 439–476
Sun G, Ranson KJ, Kharuk VI, Kovacs K (2003) Validation of surface height from shuttle radar topography mission using shuttle laser altimeter. Remote Sens Environ 88(4):401–411
Tejpal (2013) Relief analysis of the tangri watershed in the lower shiva-lik and piedmont zone of Haryana and Punjab. Indian J Spat Sci 4(1):9–20
Thomas J, Joseph S, Thrivikramaji KP (2010) Morphometric aspects of a small tropical mountain river system, the southern Western Ghats, India. Int J Digit Earth 3:135–156
Vandana M (2013) Morphometric analysis and watershed prioritiza-tion: a case study of Kabani river basin, Wayanad district, Kerala, India. Indian J Geo-Mar Sci 42:211–222
Vijith H, Satheesh R (2006) GIS-based morphometric analysis of two major upland sub-watersheds of Meenachil river in Kerala. J Indian Soc Remote Sens 34:181–185
Vittala SS, Govindiah S, Honne Gowda H (2004) Morphometric analy-sis of sub-watersheds in the Pavagada area of Tumkur district, South India, using remote sensing and GIS techniques. J Indian Soc Remote Sens 32:351–362
Wilford DJ, Sakals ME, Innes JL, Sidle RC, Bergerud WE (2004) Rec-ognition of debris flow, debris flood and flood hazard through watershed morphometrics. Landslides 1:61–66
Wise S (2000) Assessing the quality for hydrological applications of digital elevation models derived from contours. Hydrol Process 14(11–12):1909–1929
Withanage W, Dayawansa NDK, De Silva RP (2014) Morphometric analysis of the Gal Oya river basin using spatial data derived from GIS. Trop Agric Res 26:175–188
Publisher’s Note Springer Nature remains neutral with regard to jurisdictional claims in published maps and institutional affiliations.
Related Documents