41 Research article Characterization of rock layers based on seismic refraction method: a case study of Mentarang’s Hydro‐ power Plant, Malinau Regency, North Kalimantan Wisnu Slamet Priyanto*, Jauhari Arifin Research Center for Geotechnology, Indonesian Institute of Sciences, Bandung ABSTRACT North Kalimantan Province is a new province that is dynamic in development in order to prosper the inhabitants. The research and exploration to make a plan to develop new renewable energy are one of their main programs. The hydro-power plant of Mentarang, Malinau Regency, Kalimantan Utara is a plan program in 2020. The research study of hydro-power plants is essential as a reference in the development plan and avoids the hazard, miss calculation due to human error, etc. Seismic refraction is used in the feasibility study and detailed engineering study (FS DED) of Mentarang's Hydro-power plant. Analysis from the Seismic refraction method can be used as an input parameter for deciding the feasibility of Mentarang's hydro-power plant. This study aims to characterize the sub-surface layers, structure, and sub-surface layer thickness within this area. The seismic refraction method uses the intercept time or travel-time versus distance and processed using the reciprocal method, then it is modelled using inversion and resulted in a 2D profile. This research study was used the seismic refraction method with geometry acquisition of 14 sources with two spread and 5 meters of geophone interval. The analysis result of the 2D inversion profile model, in general, is classified as four strata layers. These strata are categorized as weathered layers with 5-15 meters of thickness, clay, and Sandstone about 5-20 meter of layer thickness, Sandstone with the layer thickness of about 20-50 meters, and lastly, granite, lava rocks, or limestone with depth more than 70 meters below the subsurface. There is a possibility of a structure at an offset of 70 meters, but this method's limitation will overestimate the conclusion. Therefore, it is necessary to bring another method that more sensitive to work further in research study evaluation of hydro-power plant Mentarang, Malinau Regency, North Kalimantan. INTRODUCTION North Kalimantan is the youngest province in Indonesia, which was formed on October 25, 2012. The Statistics Indonesia data indicates that this province has quite rapid population growth, which reach 3.36% in the last three years (BPS Provinsi Kalimantan Utara, 2020). Within this condition, Riset Geologi dan Pertambangan Indonesian Journal of Geology and Mining Vol.31, No 1, pages 41-50 doi: 10.14203/risetgeotam2021.v31. 1160 Keywords: Seismik refraction Hydro-power plant Malinau North Kalimantan Corresponding author Wisnu Slamet Priyanto E-mail address: [email protected] Article history Received 27 Jan 2021 Revised 1 May 2021 Accepted 4 May 2021 ©2021 Pusat Penelitian Geoteknologi - Lembaga Ilmu Pengetahuan Indonesia This is an open access article under the CC BY-NC-ND license (http://creativecommons.org/l icenses/by-nc-nd/4.0/).

Welcome message from author
This document is posted to help you gain knowledge. Please leave a comment to let me know what you think about it! Share it to your friends and learn new things together.
Transcript

41
Research article Characterization of rock layers based on seismic refraction method: a case study of Mentarang’s Hydro‐power Plant, Malinau Regency, North Kalimantan
WisnuSlametPriyanto*,JauhariArifinResearch Center for Geotechnology, Indonesian Institute of Sciences, Bandung
ABSTRACT North Kalimantan Province is a new province that is dynamic in development in order to prosper the inhabitants. The research and exploration to make a plan to develop new renewable energy are one of their main programs. The hydro-power plant of Mentarang, Malinau Regency, Kalimantan Utara is a plan program in 2020. The research study of hydro-power plants is essential as a reference in the development plan and avoids the hazard, miss calculation due to human error, etc. Seismic refraction is used in the feasibility study and detailed engineering study (FS DED) of Mentarang's Hydro-power plant. Analysis from the Seismic refraction method can be used as an input parameter for deciding the feasibility of Mentarang's hydro-power plant. This study aims to characterize the sub-surface layers, structure, and sub-surface layer thickness within this area. The seismic refraction method uses the intercept time or travel-time versus distance and processed using the reciprocal method, then it is modelled using inversion and resulted in a 2D profile. This research study was used the seismic refraction method with geometry acquisition of 14 sources with two spread and 5 meters of geophone interval. The analysis result of the 2D inversion profile model, in general, is classified as four strata layers. These strata are categorized as weathered layers with 5-15 meters of thickness, clay, and Sandstone about 5-20 meter of layer thickness, Sandstone with the layer thickness of about 20-50 meters, and lastly, granite, lava rocks, or limestone with depth more than 70 meters below the subsurface. There is a possibility of a structure at an offset of 70 meters, but this method's limitation will overestimate the conclusion. Therefore, it is necessary to bring another method that more sensitive to work further in research study evaluation of hydro-power plant Mentarang, Malinau Regency, North Kalimantan.
INTRODUCTION
North Kalimantan is the youngest province in Indonesia, which was formed on October 25, 2012. The Statistics Indonesia data indicates that this province has quite rapid population growth, which reach 3.36% in the last three years (BPS Provinsi Kalimantan Utara, 2020). Within this condition,
Riset Geologi dan Pertambangan Indonesian Journal of Geology and Mining Vol.31, No 1, pages 41-50
doi: 10.14203/risetgeotam2021.v31.1160 Keywords: Seismik refraction Hydro-power plant Malinau North Kalimantan Corresponding author Wisnu Slamet Priyanto E-mail address: [email protected] Article history Received 27 Jan 2021 Revised 1 May 2021 Accepted 4 May 2021 ©2021 Pusat Penelitian Geoteknologi - Lembaga Ilmu Pengetahuan Indonesia This is an open access article under the CC BY-NC-ND license (http://creativecommons.org/licenses/by-nc-nd/4.0/).
Priyanto&Arifin/Characterizationofrocklayersbasedonseismicrefractionmethod
42
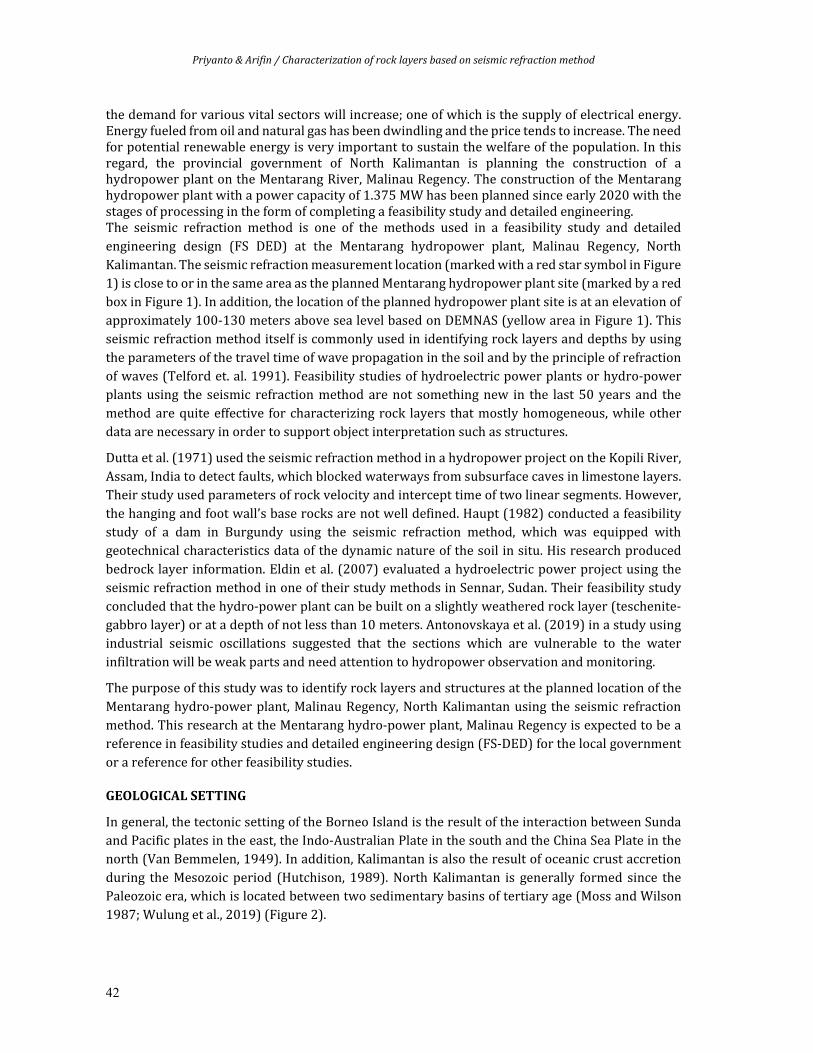
the demand for various vital sectors will increase; one of which is the supply of electrical energy. Energy fueled from oil and natural gas has been dwindling and the price tends to increase. The need for potential renewable energy is very important to sustain the welfare of the population. In this regard, the provincial government of North Kalimantan is planning the construction of a hydropower plant on the Mentarang River, Malinau Regency. The construction of the Mentarang hydropower plant with a power capacity of 1.375 MW has been planned since early 2020 with the stages of processing in the form of completing a feasibility study and detailed engineering. The seismic refraction method is one of the methods used in a feasibility study and detailed engineering design (FS DED) at the Mentarang hydropower plant, Malinau Regency, North Kalimantan. The seismic refraction measurement location (marked with a red star symbol in Figure 1) is close to or in the same area as the planned Mentarang hydropower plant site (marked by a red box in Figure 1). In addition, the location of the planned hydropower plant site is at an elevation of approximately 100-130 meters above sea level based on DEMNAS (yellow area in Figure 1). This seismic refraction method itself is commonly used in identifying rock layers and depths by using the parameters of the travel time of wave propagation in the soil and by the principle of refraction of waves (Telford et. al. 1991). Feasibility studies of hydroelectric power plants or hydro-power plants using the seismic refraction method are not something new in the last 50 years and the method are quite effective for characterizing rock layers that mostly homogeneous, while other data are necessary in order to support object interpretation such as structures.
Dutta et al. (1971) used the seismic refraction method in a hydropower project on the Kopili River, Assam, India to detect faults, which blocked waterways from subsurface caves in limestone layers. Their study used parameters of rock velocity and intercept time of two linear segments. However, the hanging and foot wall’s base rocks are not well defined. Haupt (1982) conducted a feasibility study of a dam in Burgundy using the seismic refraction method, which was equipped with geotechnical characteristics data of the dynamic nature of the soil in situ. His research produced bedrock layer information. Eldin et al. (2007) evaluated a hydroelectric power project using the seismic refraction method in one of their study methods in Sennar, Sudan. Their feasibility study concluded that the hydro-power plant can be built on a slightly weathered rock layer (teschenite-gabbro layer) or at a depth of not less than 10 meters. Antonovskaya et al. (2019) in a study using industrial seismic oscillations suggested that the sections which are vulnerable to the water infiltration will be weak parts and need attention to hydropower observation and monitoring.
The purpose of this study was to identify rock layers and structures at the planned location of the Mentarang hydro-power plant, Malinau Regency, North Kalimantan using the seismic refraction method. This research at the Mentarang hydro-power plant, Malinau Regency is expected to be a reference in feasibility studies and detailed engineering design (FS-DED) for the local government or a reference for other feasibility studies.
GEOLOGICALSETTING
In general, the tectonic setting of the Borneo Island is the result of the interaction between Sunda and Pacific plates in the east, the Indo-Australian Plate in the south and the China Sea Plate in the north (Van Bemmelen, 1949). In addition, Kalimantan is also the result of oceanic crust accretion during the Mesozoic period (Hutchison, 1989). North Kalimantan is generally formed since the Paleozoic era, which is located between two sedimentary basins of tertiary age (Moss and Wilson 1987; Wulung et al., 2019) (Figure 2).

RisetGeologidanPertambanganIndonesianJournalofGeologyandMiningVol.31,No1,June2021,pages41‐50
43
Figure1. Morphological map of the North Kalimantan’s Province (Source:DEMNAS).
Figure2. Geological’s map of the North Kalimantan’s Province (Modification from Moss and Wilson 1998).
Figure3. Location map of seismic refraction’s line in Malinau’s Regency, North Kalimantan.

Priyanto&Arifin/Characterizationofrocklayersbasedonseismicrefractionmethod
44
There are two major basins in North Kalimantan: the Nunukan Basin and the Tarakan Basin. Mentarang, Malinau Regency, is located in the Nunukan Basin. Nunukan Island itself is also an extension from NW Ahus Arch, which is close to the Semporna Fault (Husein, 2017). In addition, Malinau district is part of the tertiary of Jelai volcano, which is petrologically exposed, consisting of basalt, andesite to dacite (Baharuddin, 2011).
DATAANDMETHODS
Field data acquisitions were carried out on April 6, 2020 using the seismic refraction method. The data acquisition used the GeometryES-3000 instrument, with measurement configurations of 14 sources with 2 spreads or 2 tracks (Figure 3). In the first line, we used 24 geophones with seven sources. The seven sources include a reciprocal pair (forward and reverse). The geometry design consisted of placing sources after every three geophones within the geophone trajectory (five sources), and outside the first and last geophone offsets (2 sources). In the second track, which is a continuation of the first track, we used 24 geophones with 7 sources, where the last three geophones on the first track were still installed. Therefore, for processing data purpose, there were 12 sources. The distance between the geophones was 5 meters, so that the total distance between the two tracks was 220 meters.
Basically, the seismic refraction is a method which is use waves responses that is created by a source (e.g. hammer blow, dynamite explosion, vibroseis or others) and it refracted back to the receiver sensor when its meet a different boundary layer. The receiver sensor is called a geophone,
which is sensitive to very small ground motions and converts it to electrical signals. The farther the wave, the longer the arrival time of the wave will be. The obtained data that are collected is define as travel-time curves respected to wave responses. The wave response could be due to the contrast of a different subsurface medium such as a different rock layers, faults and other structures. Based on wave properties like the difference of distance and time, we can reconstruct a geological cross section model. In general, the seismic refraction interpretation method can be divided into three
parts, which are the intercept time method, the delay time method, and the wave front method (Taib et al., 1984; Wahyuningrum et al., 2006).
In this Mentarang hydro-power plant study, we used the intercept time method or travel time to distance method. The intercept time method is an interpretation of seismic refraction method that does not use too many assumptions, where the focus on the quantity of travel-time data is directly proportional to the resolution of the results (Hawkins, 1961; Palmer, 1980). Although this method is quite effective and efficient in identifying layers, it has limited identification at certain points and tends to be good at identifying layers that mostly homogeneous (Palmer, 1986; Sjorgen, 2000; Wahyuningrum et al., 2006).
Based on the wave’s principle, Snell's law of refraction or reflection and reflection of waves, and also Huygens' principle on the boundary plane of the layer, state that wave will refract above every point on the boundary plane. Therefore, the wave that passing the different boundary layer will contain information such as interval velocity and back to the surface then recorded by the receiver sensors (Figure 4 and 5). The refraction wave equation is as follows:
𝑇𝑡 (1)

RisetGeologidanPertambanganIndonesianJournalofGeologyandMiningVol.31,No1,June2021,pages41‐50
45
Where, Tt is the travel-time, v1 and v2 are the velocity in layers 1 and 2. Furthermore, when transferred by another equation, it becomes:
𝑇
(2)
𝑇 2ℎ
(3)
𝑇 2ℎ
(4)
From the above equation, h is the depth in layer 1, while x is the distance from the receiver and geophone shooting point (a to d), and 𝛼 is the angle between the refraction wave line and the normal line. If x = 0, then Ti can be obtained from the time-to-distance curve. Ti is also known as the intercept time, then the equation becomes:
ℎ
(5)
If 𝛼 , and if, 𝑐𝑜𝑠 𝑐𝑜𝑠 𝛼 , then the depth or thickness of the first rock layer can
be simplified to:
ℎ (6)
For a case with many layers or multilayer, the equation of intercept time and depth of rock layers becomes:
𝑇 ∑ 2ℎ
(7)
ℎ
𝑇 ∑ (8)
We used SeisImager software for data processing. The format of the data obtained from the instrument was in the form of (.Seg2). The data was converted using the Interpex software. Then, using Geometrics software, we located the source and interval groups. After obtained the wave data, the data was then interpreted using the Pickwin software in SeisImager to determine the location of the first breaks. By plotting the first break value against the distance a traveltime, we got the intercept curves (Figure 6).
Furthermore, modeling using Plotrefa software in SeisImager with traveltime intercept curve input and elevation data produced a profile model. On the travel time curve of this reciprocal, objectively we selected points where there was velocity slowness (Figure 6). At the point where the velocity change to be slow, it is interpreted as the place where there is a boundary between the two rock layers. After that, a time-term inversion was carried out, which resulted in a 2D cross section with colors and values that explained the different characteristics of rock layers. Furthermore, tomography modeling is also carried out to smoothing the velocity, which is identified as a weathered layer. In this modeling, it is referred to the P wave velocity classification according to Tables 1 and 2.

Priyanto&Arifin/Characterizationofrocklayersbasedonseismicrefractionmethod
46
Table1. Classification of lithology base on P wave velocity (Burger, 1992)
Materials Pwavevelocitiy(m/s)
Weathered layered 200 – 900 Soil 250 – 600 Clay 1000 – 2500 Sandstone 3000 – 4500 Limestone 5500 – 6000 Granite 5000 – 5100
Table2. Classification of lithology base on P wave velocity (Nurdiyanto et al., 2011).
No Layerdepth(meters)
Pwavevelocitiy(m/s)
Lithology
1. 0 – 5 200 – 700 Soil 2. 0 – 5 700- 1100 Granodiorit strong/completely weathered 3. 0 – 15 1100 - 1770 Granodiorit slightly weathered 4. >70 > 1770 Granodiorit fresh
Figure4. Traveltime’scurvein the simple two-layer’s model (Source modification: Telford 1976).
Figure5. Two layer’s simple model at the parallel boundary (Source modification: Telford 1976).

RisetGeologidanPertambanganIndonesianJournalofGeologyandMiningVol.31,No1,June2021,pages41‐50
47
RESULTSANDDISCUSSION
The 2D cross-section profile inversion model shows that there are at least 4 strata layers of soil and rocks. The first layer has a velocity ranging from 300 m/s to 900 m/s, which is generally interpreted as a completely weathered layer of soil. This layer has a layer thickness of approximately 5-15 meters (Figure 7). The second layer with velocities ranging from 900 m/s to 2400 m/s, is interpreted as moderately weathered rock (Figure 7). This layer has a layer thickness of approximately 5-20 meters. In the third layer with velocities between 2400 m/s to 4000 m/s in the form of slightly weathered rock (Figure 7). The thickness of the third layer varies from 20-50 meters. The last layer has a velocity between 4000 m/s to 5000 m/s, which may be granite, lava or fresh rock (Figure 7). The thickness of this layer in the model is 40-70 meters, but might be more beyond the limit of the model.
In the 2D cross-sectional model there are structures appear to the surface. This surface morphology structure is in the form of 2 slope planes (Figure 7). The first slope has a slope of 𝛼1=63.4o from an offset of 130 meters, and the second slope has a slope of 𝛼1=63.4o and an offset of 50 meters. The analysis of the 2D velocity inversion model respected to wave response, has indicated that the structure have 50-meter subsurface continuities. However, the interpretation of the structure at an offset distance of 70 meters is might overestimate, because it requires additional methods or parameters to narrow the assumptions. Although the model shows differences in the possible existence of structures, back to the initial method of this study, the capacity is still limited to the tendency of homogeneous of the layers.
Many research studies on hydro-power plant have been carried out in previous studies, related to the feasibility of natural disaster conditions such as landslides, rock falls, liquefaction, flooding and so on (Dutta et al., 1971; Haupt, 1982; Eldin et al., 2007; Antonovskaya et al., 2017 ; Antonovskaya et al., 2017). In the study of the Mentarang hydropower plant, there are several significant points. First, the layer of slightly weathered rock where the minimum depth limit of hydro-power plant should be built as it refers to Eldin et al. (2007), in our study is confirmed base on the model has an average depth of slightly weathered rock about 20 meters subsurface. Second, the cliff that possibly is a continuous structure might be considered as a vulnerable or weak part, which should be strengthened. Third, comparative studies with other methods are required to obtain other perspectives and to reduce assumptions due to the limited resolution of the method used.
Figure6. First-break picking’s result at the travel time curve.

Priyanto&Arifin/Characterizationofrocklayersbasedonseismicrefractionmethod
48
Antonovskaya et al. (2017) suggested that there are three important factors to observe in hydropower planning: first is the extent of impact study in the hydropower area itself; second is the consideration of seismic activity due to earthquakes; third is the detection of the possibility of potential seismic induction.
CONCLUSION
The analysis of 2D cross-sectional modeling indicated the 4 layers of rocks: a layer of weathered soil with a thickness of 5-15 meters, a layer of clay and sandstone with a thickness of 5-20 meters, a layer of gravel sandstone with a thickness of 20-50 meters and finally a layer of granite, lava or limestone with a depth of more than 70 meters from the surface. There is a possibility of structural continuity at an offset distance of 70 meters, which is likely considered to be a vulnerable part in the future. This study provides an overview of the characteristics of rock and soil velocity parameters. Other studies and methods are required to conclude further the feasibility study of Mentarang’s hydro-power plant study, such as geotechnical characteristics data or passive seismic to determine the effect of an earthquake, or the possibility of induced seismicity in the future which can be miscalculated with a disaster impact.
Figure7. Interpreted model’s inversion of the 2D seismik refraction’s profile of the Mentarang’s Hydropower-plants, Malinau, North Kalimantan.
RisetGeologidanPertambanganIndonesianJournalofGeologyandMiningVol.31,No1,June2021,pages41‐50
49
ACKNOWLEDGMENT
The author would like to thank all parties who have assisted in the completion and publication of this research, especially to PT. Bina Teknika Mandiri as a collaborator who has allowed the use of data.
REFERENCES
Antonovskaya, G.N., Kapustian, N.K., Moshkunov, A.I., Danilov, A.V. and Moshkunov, K.A., 2017. New seismik array solution for earthquake observations and hydropower plant health monitoring. Journal of Seismology, 21(5), pp.1039-1053
Antonovskaya, G., Kapustian, N., Basakina, I., Afonin, N. and Moshkunov, K., 2019. Hydropower Dam State and Its Foundation Soil Survey Using Industrial Seismik Oscillations. Geosciences, 9(4), p.187
Badan Pusat Statistik. 2020. Provinsi Kalimantan Utara Dalam Angka 2019". www.kaltara.bp.go.id. BPS Provinsi Kalimantan Utara. Diakses tanggal 17 Februari 2020.
Baharuddin, B., 2011. PETROLOGI DAN GEOKIMIA BATUAN GUNUNG API TERSIER JELAI DI DAERAH MALINAU, KALIMANTAN TIMUR: Implikasi tektoniknya. Jurnal Geologi dan Sumberdaya Mineral, 21(4), pp.203-211.
Burger, H.R., Burger, D.C. and Burger, H.R., 1992. Exploration geophysics of the shallow subsurface (Vol. 8). New Jersey: Prentice Hall.
Dutta, N.P. and Saikia, B.C., 1972. Detection of a fault by the seismic refraction method in the Kopili Hydro-Electric Project, India. Geoexploration, 10(2), pp.101-108.
Eldin, M.A.M., Huiming, T., Bahwi, N.H. and Faraw, A.G., 2007. Geological, soil and rock mass evaluation for proposed hydroelectric power plant at Sennar Dam, Sudan. Journal of Applied Sciences, 7(22), pp.3477-3484.
Haupt, W.A., 1982. Seismic refraction survey at a dam construction site. Bulletin of the International Association of Engineering Geology-Bulletin de l'Association Internationale de Géologie de l'Ingénieur, 26(1), pp.253-256.
Husein, Salahuddin, 2017. Lithostratigraphy of Tabul Formation and Onshore Geology of Nunukan Island, North Kalimantan. Journal of Applied Geology, 2(1), pp.25-35. https://doi.org/10.22146/jag.30255.
Hutchison, C.S., 1989. Geological evolution of South-east Asia. Oxford monographs on geology and geophysics, 13, pp.1-368.
https://humas.kaltaraprov.go.id/berita/view/6038/pembangunan-plta-kayan-segera-dimulai.html
Moss, S.J. and Wilson, M.E., 1998. Biogeographic implications of the Tertiary palaeogeographic evolution of Sulawesi and Borneo. Biogeography and geological evolution of SE Asia, 133, p.163.
Nurdiyanto, B., Hartanto, E., Ngadmanto, D., Sunardi, B. and Susilanto, P., 2011. Penentuan Tingkat Kekerasan Batuan Menggunakan Metode Seismik Refraksi. Jurnal Meteorologi dan Geofisika, 12(3).
Palmer, D., 1986. Refraction seismics: the lateral resolution of structure and seismic velocity (Vol. 13). Pergamon.
Palmer, D., 1980. The generalized reciprocal method of seismic refraction interpretation. Society of Exploration Geophysicists.
Sjögren, B., 2000. A brief study of applications of the generalized reciprocal method and of some limitations of the method. Geophysical prospecting, 48(5), pp.815-834.
Taib, M. I. T., 1984, Engineering Seismology, Institut Teknologi Bandung Press: Bandung (tidak dipublikasikan)
Telford, M.W., Geldart, L.P., Sheriff, R.E, & Keys, D.A. (1976). Applied geophysics, New York: Cambridge University Press.
van Bemmelen, R.W., 1949. General Geology of Indonesia and adjacent archipelagoes. The geology of Indonesia.
Wahyuningrum, S., Yulianto, G. and Nurwidyanto, M.I., 2006. Interpretasi Data Seismik Refraksi Menggunakan Metode Reciprocal Hawkins dan Sofware SRIM (Studi Kasus Daerah Sioux Park, Rapid City, South Dakota, USA). Berkala Fisika, 9(4), pp.177-184.
Wulung, S.R.P., Yuliawati, A.K. and Hadian, M.S.D., 2019, June. Geotourism potential analysis of North Kalimantan. In 3rd International Seminar on Tourism (ISOT 2018) (pp. 283-287). Atlantis Press.

Priyanto&Arifin/Characterizationofrocklayersbasedonseismicrefractionmethod
50
Related Documents