69 A Case Study of Airflow Patterns around an Arched Type Agricultural Building: Investigating Mesh Convergence of Different Turbulence Models C. Zong, W. Wu, G.-Q. Zhang and X. Shen G. Ntinas Department of Engineering Faculty of Science and Technology Aarhus University Tjele Denmark Department of Hydraulics Soil Sciences and Agricultural Engineering Faculty of Agriculture Aristotle University of Thessaloniki Thessaloniki Greece Keywords: computational fluid dynamics (CFD), grid convergence index, grid refinement, simulation Abstract Livestock production buildings are a source of ammonia and greenhouse gas emissions. The transport mechanism of gas dispersions depends on a better understanding of airflow patterns surrounding agricultural buildings. With rapid development of technology of computational fluid dynamics (CFD), it becomes more and more popular to study the wind field and pollutant dispersion from agricultural buildings. In this paper, CFD was used to investigate the airflow patterns around a building with an arched type roof. The steady turbulence models were used to handle the turbulent motions. To make a qualified simulation, mesh convergence should be achieved for different turbulence models. An index called Grid Convergence Index as well as wall y+ and vortices shape size ratio were considered to evaluate mesh independence for different turbulence models. Results show all these three parameters could assist grid refinement to a certain degree. INTRODUCTION Indoor air quality in livestock production is a big issue for us due to its significant impact on the well-being for both inhabitants and workers inside. Odours and greenhouse gases are the most concerned variables for determining air quality in agricultural buildings (Saha et al., 2010; Ye et al., 2008; Zhang et al., 2005). The dispersion and deposition of ammonia and other contaminants are mostly affected by airflow patterns surrounding the building (Zhang and Strøm, 1999; Morsing et al., 2008). As a result, a better understanding of the airflow characteristics for developing effective and practical methods to guide airflow distribution is highly desired. With the rapid development of computational fluid dynamics (CFD), studies on the wind field and pollutants dispersion in agricultural production have become more and more popular. Some researchers (Rong et al., 2010; Saha et al., 2011; Wu et al., 2012) used CFD as a tool to study ammonia emissions from pig houses. CFD simulation was also performed on airflow distribution around greenhouses (Bartzanas et al., 2007). In order to make a qualified simulation and resolve attributes accurately, grid convergence need to be achieved first. Ideally, all solutions from CFD simulations should be independent from the computational grid, which means the solutions will not be altered if the computational grid is refined. However, obtaining a grid-independent solution is almost impractical because of restrictions in computer power and time. By grid-convergence, the solution can asymptotically approach the exact solution (Sørensen and Nielsen, 2003). Although grid refinement studies were generally reported, detailed assessment for assisting numerical simulation is still required. In this study, CFD was used to investigate the airflow patterns in the surrounding of an agricultural building with an arched type roof. Ten stages of grid refinement were involved in this investigation; wall y+ and vortex lengths and heights were assessed under varying turbulence models. An index called Grid Convergence Index (GCI), i.e. an Proc. I st IS on CFD Applications in Agriculture Ed.: R. Suay Acta Hort. 1008, ISHS 2013

Welcome message from author
This document is posted to help you gain knowledge. Please leave a comment to let me know what you think about it! Share it to your friends and learn new things together.
Transcript
69
A Case Study of Airflow Patterns around an Arched Type Agricultural Building: Investigating Mesh Convergence of Different Turbulence Models C. Zong, W. Wu, G.-Q. Zhang and X. Shen G. NtinasDepartment of Engineering Faculty of Science and Technology Aarhus University Tjele Denmark
Department of Hydraulics Soil Sciences and Agricultural Engineering Faculty of Agriculture Aristotle University of Thessaloniki Thessaloniki Greece
Keywords: computational fluid dynamics (CFD), grid convergence index, grid
refinement, simulation Abstract
Livestock production buildings are a source of ammonia and greenhouse gas emissions. The transport mechanism of gas dispersions depends on a better understanding of airflow patterns surrounding agricultural buildings. With rapid development of technology of computational fluid dynamics (CFD), it becomes more and more popular to study the wind field and pollutant dispersion from agricultural buildings. In this paper, CFD was used to investigate the airflow patterns around a building with an arched type roof. The steady turbulence models were used to handle the turbulent motions. To make a qualified simulation, mesh convergence should be achieved for different turbulence models. An index called Grid Convergence Index as well as wall y+ and vortices shape size ratio were considered to evaluate mesh independence for different turbulence models. Results show all these three parameters could assist grid refinement to a certain degree.
INTRODUCTION
Indoor air quality in livestock production is a big issue for us due to its significant impact on the well-being for both inhabitants and workers inside. Odours and greenhouse gases are the most concerned variables for determining air quality in agricultural buildings (Saha et al., 2010; Ye et al., 2008; Zhang et al., 2005). The dispersion and deposition of ammonia and other contaminants are mostly affected by airflow patterns surrounding the building (Zhang and Strøm, 1999; Morsing et al., 2008). As a result, a better understanding of the airflow characteristics for developing effective and practical methods to guide airflow distribution is highly desired.
With the rapid development of computational fluid dynamics (CFD), studies on the wind field and pollutants dispersion in agricultural production have become more and more popular. Some researchers (Rong et al., 2010; Saha et al., 2011; Wu et al., 2012) used CFD as a tool to study ammonia emissions from pig houses. CFD simulation was also performed on airflow distribution around greenhouses (Bartzanas et al., 2007).
In order to make a qualified simulation and resolve attributes accurately, grid convergence need to be achieved first. Ideally, all solutions from CFD simulations should be independent from the computational grid, which means the solutions will not be altered if the computational grid is refined. However, obtaining a grid-independent solution is almost impractical because of restrictions in computer power and time. By grid-convergence, the solution can asymptotically approach the exact solution (Sørensen and Nielsen, 2003). Although grid refinement studies were generally reported, detailed assessment for assisting numerical simulation is still required.
In this study, CFD was used to investigate the airflow patterns in the surrounding of an agricultural building with an arched type roof. Ten stages of grid refinement were involved in this investigation; wall y+ and vortex lengths and heights were assessed under varying turbulence models. An index called Grid Convergence Index (GCI), i.e. an
Proc. Ist IS on CFD Applications in Agriculture Ed.: R. Suay Acta Hort. 1008, ISHS 2013
70
expression of the uncertainty associated with the solution at a particular grid resolution was considered to evaluate mesh independence for different turbulence models. The simulated results were validated by scale model experiments.
Thus, the objective of this study was to assess grid convergence for different turbulences models of air flow around an arched-type roof building. The results provided a sight into similarities or differences for grid convergence under different turbulence models.
MATERIALS AND METHODS Scaled Model
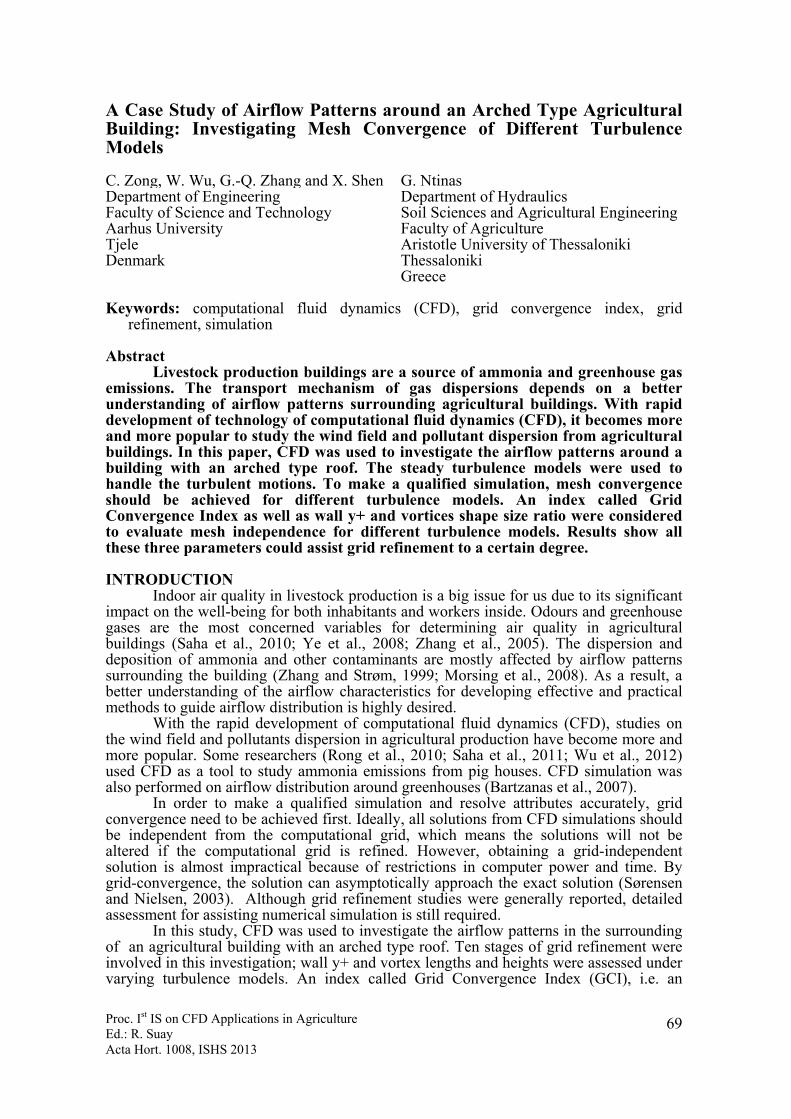
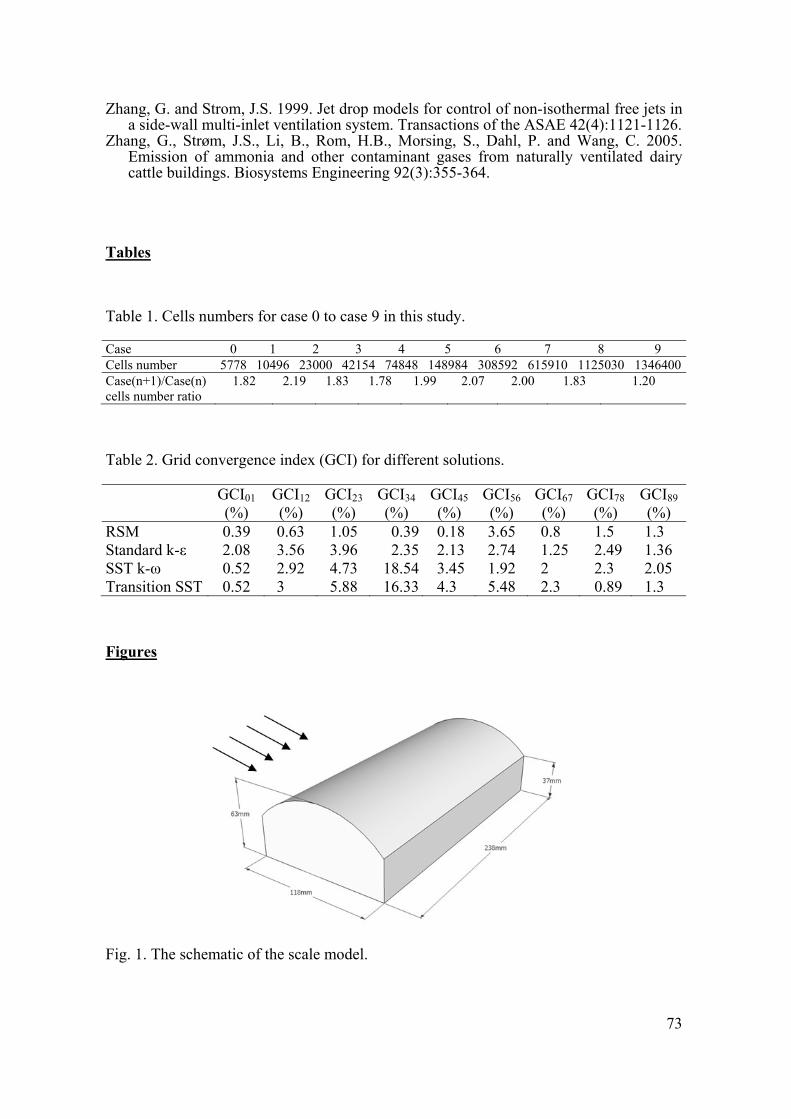
The model under investigation was an agricultural building with arched type roof, which was immersed in a flow at a constant free stream. Figure 1 shows the schematic illustrating the dimensions of scale building, which are 238×118×63 mm (L×W×H). Owing to its simplicity, this shape is widely used in agriculture. The study on the air distributions properties of this type of building is useful, and can provide a guideline for CFD being applied in similar agricultural buildings.
Turbulence Modelling
We used the commercial CFD software FLUENT 12.0 (2009, ANSYS Inc., US) to calculate the flow around the arched type agricultural building. The grid refinement was investigated by comparing the results from simulations under different turbulence models and different cells distributions. The steady turbulence models of standard k-ε, SST k-ω, transition SST and RSM were involved in this investigation. The flow patterns subjecting to different turbulence models were compared under steady situations.
Boundary Conditions and Mesh
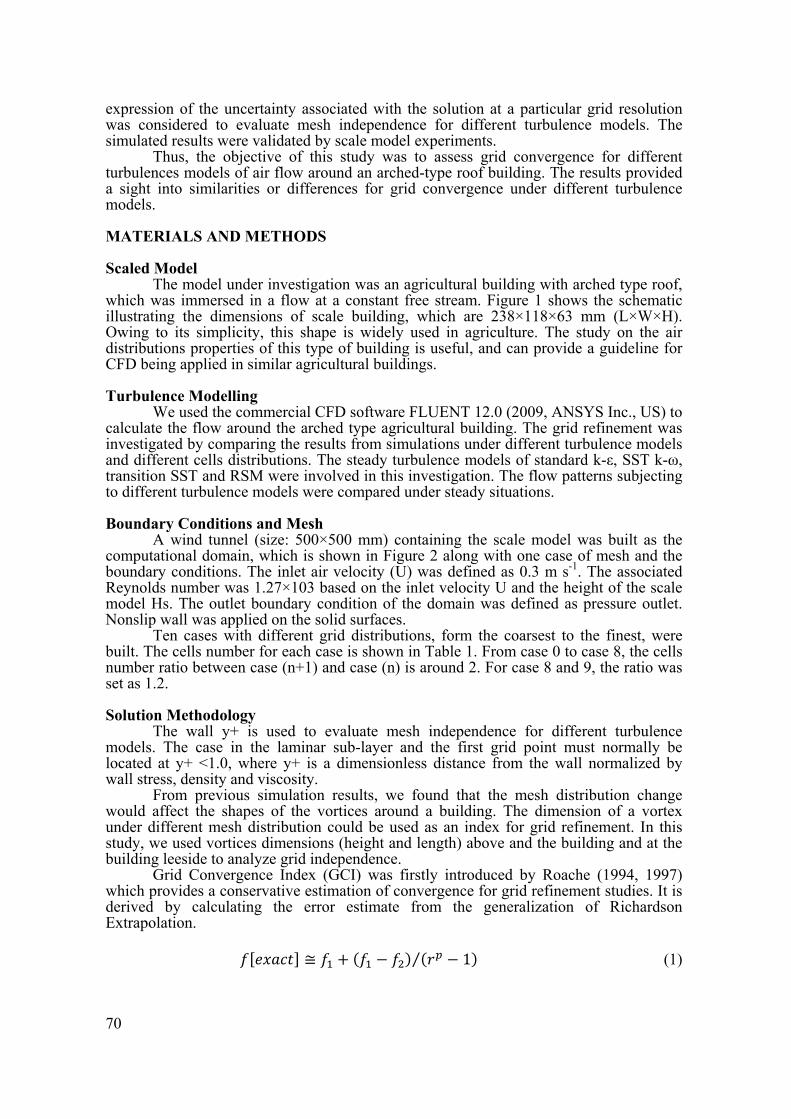
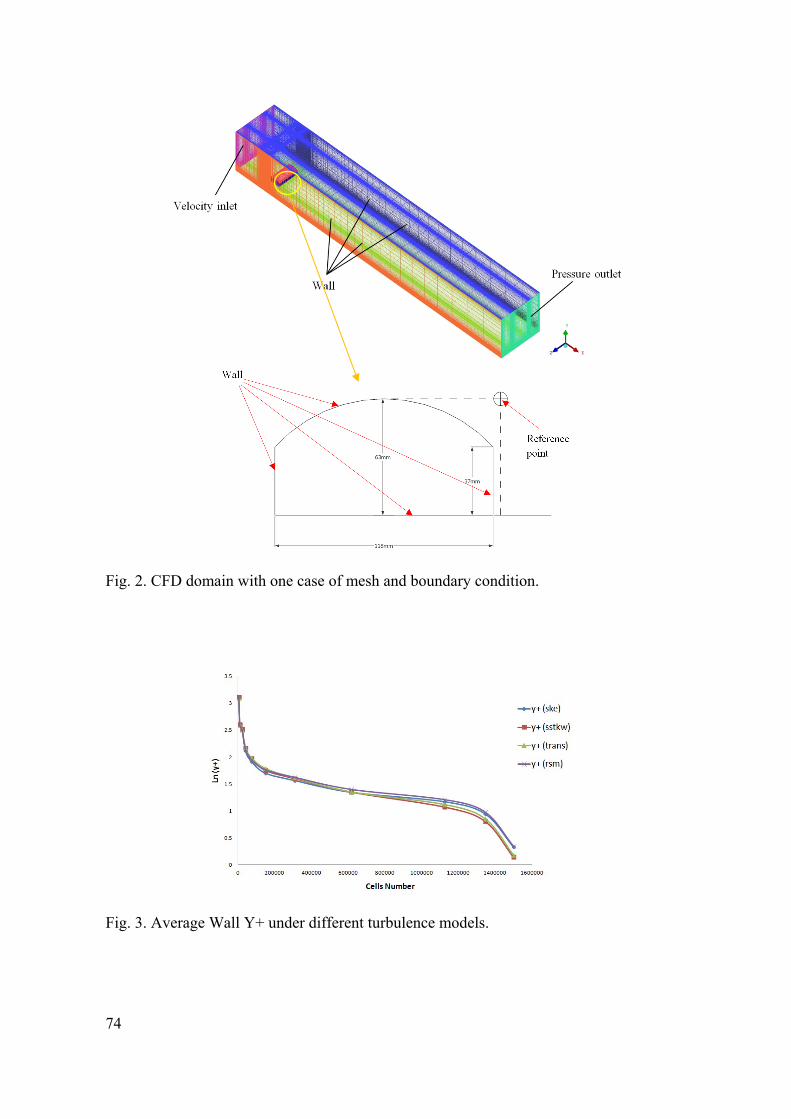
A wind tunnel (size: 500×500 mm) containing the scale model was built as the computational domain, which is shown in Figure 2 along with one case of mesh and the boundary conditions. The inlet air velocity (U) was defined as 0.3 m s-1. The associated Reynolds number was 1.27×10³ based on the inlet velocity U and the height of the scale model Hs. The outlet boundary condition of the domain was defined as pressure outlet. Nonslip wall was applied on the solid surfaces.
Ten cases with different grid distributions, form the coarsest to the finest, were built. The cells number for each case is shown in Table 1. From case 0 to case 8, the cells number ratio between case (n+1) and case (n) is around 2. For case 8 and 9, the ratio was set as 1.2.
Solution Methodology
The wall y+ is used to evaluate mesh independence for different turbulence models. The case in the laminar sub-layer and the first grid point must normally be located at y+ <1.0, where y+ is a dimensionless distance from the wall normalized by wall stress, density and viscosity.
From previous simulation results, we found that the mesh distribution change would affect the shapes of the vortices around a building. The dimension of a vortex under different mesh distribution could be used as an index for grid refinement. In this study, we used vortices dimensions (height and length) above and the building and at the building leeside to analyze grid independence.
Grid Convergence Index (GCI) was firstly introduced by Roache (1994, 1997) which provides a conservative estimation of convergence for grid refinement studies. It is derived by calculating the error estimate from the generalization of Richardson Extrapolation.
≅ 1⁄ (1)
71
We define the fine-grid solution by f1 and the coarse-grid solution by f2. Here, f1 and f2 can be any solution property. In this study we used the velocity magnitude of a reference point (63 mm/1 Hs high and 63 mm away from the ridge of the roof, in the centre line of the building sidewall, Fig. 2) to represent the quantity f. Denote r12 = h2/h1 as the grid refinement ratio, where h1 and h2 are representative cell-sizes for the fine and the coarse grid, respectively (thus, r12 > 1); p means the formal order of accuracy of the differencing scheme. The GCI for the fine grid solution is then defined as
,,
(2)
where Roache (1994) recommended Fs = 3 for normal applications. Thus, when the solution is within the asymptotic range, the GCI may be used as an estimation of the solution error to the given problem. Often, ri, i+1 is chosen to be two for grid-independency investigations (Ali et al., 2009). Validation of CFD Modelling
The simulations were validated by the scale model experiments, which were carried out in a wind tunnel in the Air Physics Laboratory (APL), University of Aarhus (AU). The scale model building was made of a 5 mm thick clear acrylic sheet. In the measurement, velocities at different positions were measured by a Laser Doppler anemometer (LDA).
RESULTS AND DISCUSSION Wall Y+
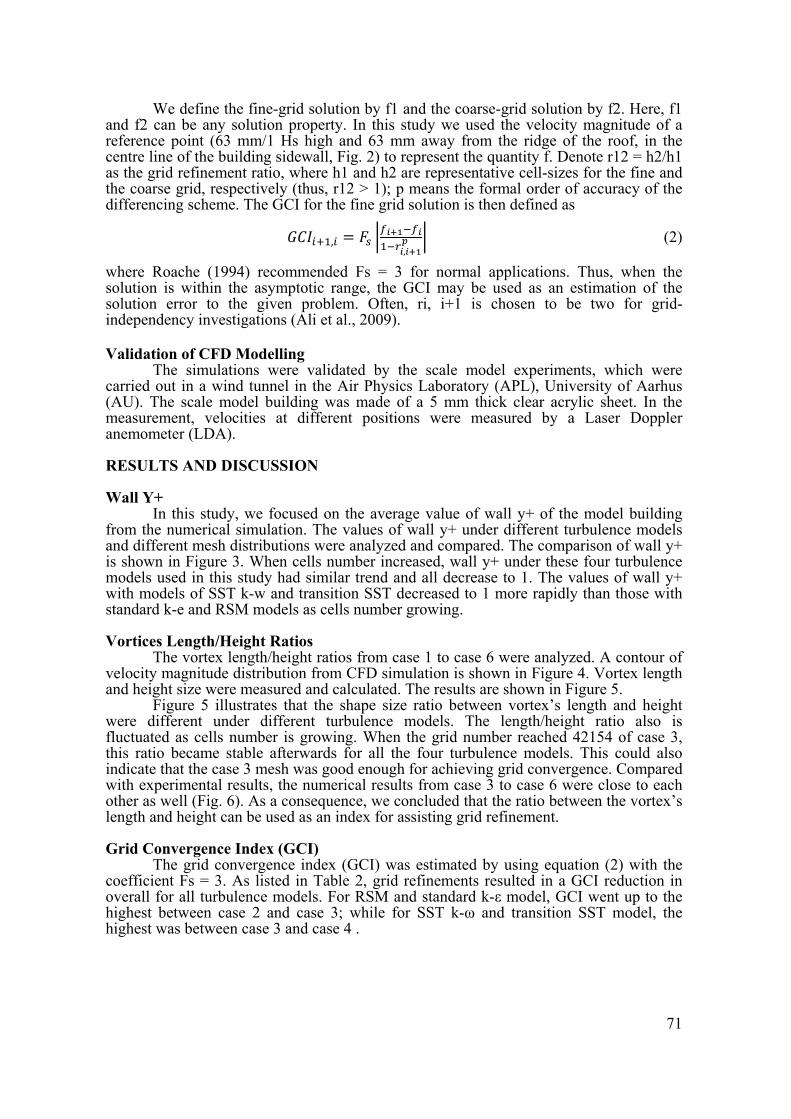
In this study, we focused on the average value of wall y+ of the model building from the numerical simulation. The values of wall y+ under different turbulence models and different mesh distributions were analyzed and compared. The comparison of wall y+ is shown in Figure 3. When cells number increased, wall y+ under these four turbulence models used in this study had similar trend and all decrease to 1. The values of wall y+ with models of SST k-w and transition SST decreased to 1 more rapidly than those with standard k-e and RSM models as cells number growing.
Vortices Length/Height Ratios
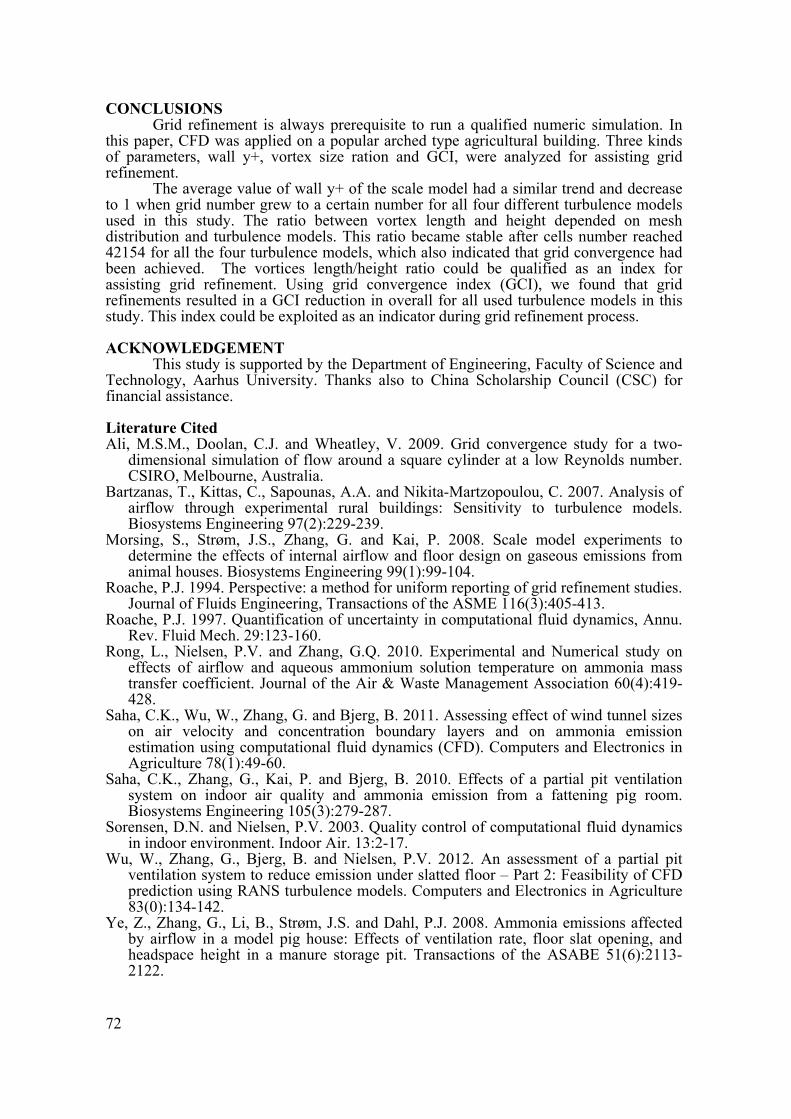
The vortex length/height ratios from case 1 to case 6 were analyzed. A contour of velocity magnitude distribution from CFD simulation is shown in Figure 4. Vortex length and height size were measured and calculated. The results are shown in Figure 5.
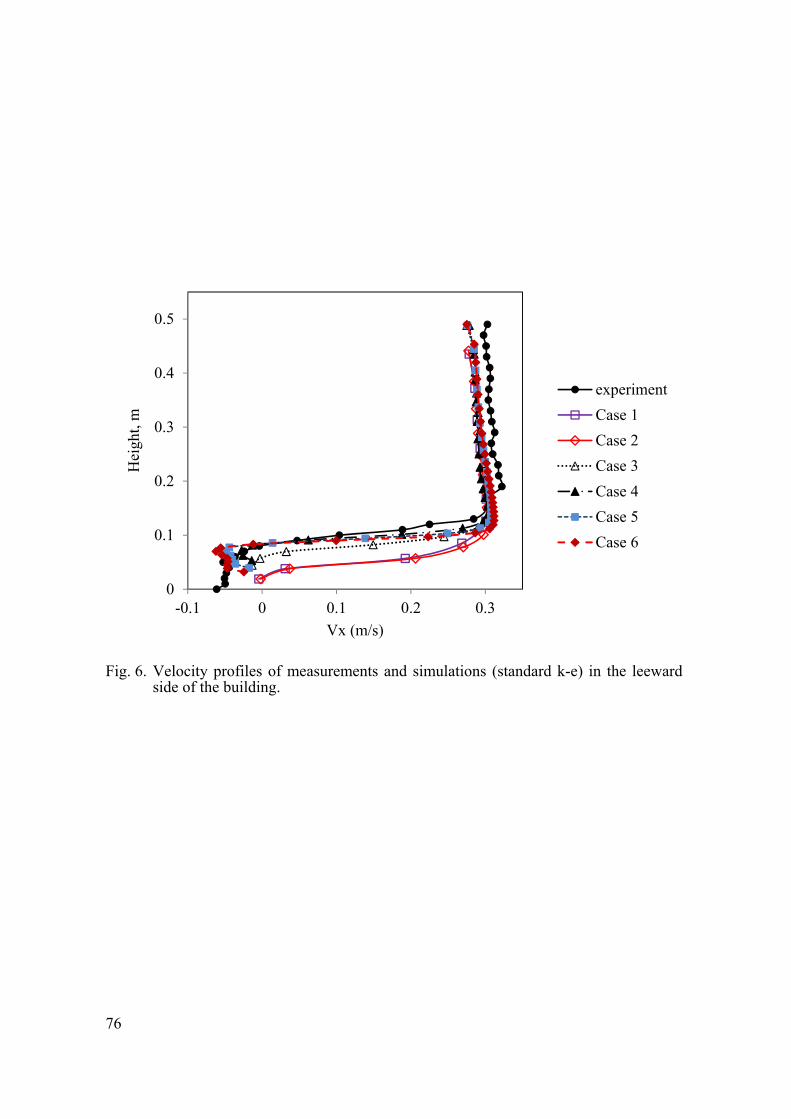
Figure 5 illustrates that the shape size ratio between vortex’s length and height were different under different turbulence models. The length/height ratio also is fluctuated as cells number is growing. When the grid number reached 42154 of case 3, this ratio became stable afterwards for all the four turbulence models. This could also indicate that the case 3 mesh was good enough for achieving grid convergence. Compared with experimental results, the numerical results from case 3 to case 6 were close to each other as well (Fig. 6). As a consequence, we concluded that the ratio between the vortex’s length and height can be used as an index for assisting grid refinement.
Grid Convergence Index (GCI)
The grid convergence index (GCI) was estimated by using equation (2) with the coefficient Fs = 3. As listed in Table 2, grid refinements resulted in a GCI reduction in overall for all turbulence models. For RSM and standard k-ε model, GCI went up to the highest between case 2 and case 3; while for SST k-ω and transition SST model, the highest was between case 3 and case 4 .
72
CONCLUSIONS Grid refinement is always prerequisite to run a qualified numeric simulation. In
this paper, CFD was applied on a popular arched type agricultural building. Three kinds of parameters, wall y+, vortex size ration and GCI, were analyzed for assisting grid refinement.
The average value of wall y+ of the scale model had a similar trend and decrease to 1 when grid number grew to a certain number for all four different turbulence models used in this study. The ratio between vortex length and height depended on mesh distribution and turbulence models. This ratio became stable after cells number reached 42154 for all the four turbulence models, which also indicated that grid convergence had been achieved. The vortices length/height ratio could be qualified as an index for assisting grid refinement. Using grid convergence index (GCI), we found that grid refinements resulted in a GCI reduction in overall for all used turbulence models in this study. This index could be exploited as an indicator during grid refinement process.
ACKNOWLEDGEMENT
This study is supported by the Department of Engineering, Faculty of Science and Technology, Aarhus University. Thanks also to China Scholarship Council (CSC) for financial assistance.
Literature Cited Ali, M.S.M., Doolan, C.J. and Wheatley, V. 2009. Grid convergence study for a two-
dimensional simulation of flow around a square cylinder at a low Reynolds number. CSIRO, Melbourne, Australia.
Bartzanas, T., Kittas, C., Sapounas, A.A. and Nikita-Martzopoulou, C. 2007. Analysis of airflow through experimental rural buildings: Sensitivity to turbulence models. Biosystems Engineering 97(2):229-239.
Morsing, S., Strøm, J.S., Zhang, G. and Kai, P. 2008. Scale model experiments to determine the effects of internal airflow and floor design on gaseous emissions from animal houses. Biosystems Engineering 99(1):99-104.
Roache, P.J. 1994. Perspective: a method for uniform reporting of grid refinement studies. Journal of Fluids Engineering, Transactions of the ASME 116(3):405-413.
Roache, P.J. 1997. Quantification of uncertainty in computational fluid dynamics, Annu. Rev. Fluid Mech. 29:123-160.
Rong, L., Nielsen, P.V. and Zhang, G.Q. 2010. Experimental and Numerical study on effects of airflow and aqueous ammonium solution temperature on ammonia mass transfer coefficient. Journal of the Air & Waste Management Association 60(4):419-428.
Saha, C.K., Wu, W., Zhang, G. and Bjerg, B. 2011. Assessing effect of wind tunnel sizes on air velocity and concentration boundary layers and on ammonia emission estimation using computational fluid dynamics (CFD). Computers and Electronics in Agriculture 78(1):49-60.
Saha, C.K., Zhang, G., Kai, P. and Bjerg, B. 2010. Effects of a partial pit ventilation system on indoor air quality and ammonia emission from a fattening pig room. Biosystems Engineering 105(3):279-287.
Sorensen, D.N. and Nielsen, P.V. 2003. Quality control of computational fluid dynamics in indoor environment. Indoor Air. 13:2-17.
Wu, W., Zhang, G., Bjerg, B. and Nielsen, P.V. 2012. An assessment of a partial pit ventilation system to reduce emission under slatted floor – Part 2: Feasibility of CFD prediction using RANS turbulence models. Computers and Electronics in Agriculture 83(0):134-142.
Ye, Z., Zhang, G., Li, B., Strøm, J.S. and Dahl, P.J. 2008. Ammonia emissions affected by airflow in a model pig house: Effects of ventilation rate, floor slat opening, and headspace height in a manure storage pit. Transactions of the ASABE 51(6):2113-2122.
73
Zhang, G. and Strom, J.S. 1999. Jet drop models for control of non-isothermal free jets in a side-wall multi-inlet ventilation system. Transactions of the ASAE 42(4):1121-1126.
Zhang, G., Strøm, J.S., Li, B., Rom, H.B., Morsing, S., Dahl, P. and Wang, C. 2005. Emission of ammonia and other contaminant gases from naturally ventilated dairy cattle buildings. Biosystems Engineering 92(3):355-364.
Tables Table 1. Cells numbers for case 0 to case 9 in this study. Case 0 1 2 3 4 5 6 7 8 9 Cells number 5778 10496 23000 42154 74848 148984 308592 615910 1125030 1346400Case(n+1)/Case(n) cells number ratio
1.82 2.19 1.83 1.78 1.99 2.07 2.00 1.83 1.20
Table 2. Grid convergence index (GCI) for different solutions. GCI01
(%) GCI12
(%) GCI23
(%) GCI34 (%)
GCI45 (%)
GCI56 (%)
GCI67 (%)
GCI78 (%)
GCI89 (%)
RSM 0.39 0.63 1.05 0.39 0.18 3.65 0.8 1.5 1.3 Standard k-ε 2.08 3.56 3.96 2.35 2.13 2.74 1.25 2.49 1.36 SST k-ω 0.52 2.92 4.73 18.54 3.45 1.92 2 2.3 2.05 Transition SST 0.52 3 5.88 16.33 4.3 5.48 2.3 0.89 1.3 Figures
Fig. 1. The schematic of the scale model.
74
Fig. 2. CFD domain with one case of mesh and boundary condition.
Fig. 3. Average Wall Y+ under different turbulence models.

75
Fig. 4. The contour of velocity magnitude distribution from k-ε simulation. Vortices
above and after the building are shown in the red circles.
Fig. 5. Vortices (above and after the building) length/height ratio.
Above the building At the leeward of building
76
Fig. 6. Velocity profiles of measurements and simulations (standard k-e) in the leeward
side of the building.
0
0.1
0.2
0.3
0.4
0.5
-0.1 0 0.1 0.2 0.3
Hei
ght,
m
Vx (m/s)
experiment
Case 1
Case 2
Case 3
Case 4
Case 5
Case 6
Related Documents