Prepared for: Alberta Electric System Operator 2500, 330 - 5th Avenue SW Calgary, AB T2P 0L4 A Case Study in Capacity Market Design and Considerations for Alberta Prepared by: Charles River Associates 80 Bloor St West Toronto, Ontario, M5S 2V1 www.crai.com/energy Date: March 30, 2017

Welcome message from author
This document is posted to help you gain knowledge. Please leave a comment to let me know what you think about it! Share it to your friends and learn new things together.
Transcript

Prepared for:
Alberta Electric System Operator
2500, 330 - 5th Avenue SW
Calgary, AB T2P 0L4
A Case Study in
Capacity Market Design
and Considerations for
Alberta
Prepared by:
Charles River Associates
80 Bloor St West
Toronto, Ontario, M5S 2V1
www.crai.com/energy
Date: March 30, 2017

Charles River Associates
Page i
Acknowledgements
The main report was authored by Robert Cary, Brian Rivard and Juliana Bruno. The PJM, ISO-NE and
CAISO case studies were authored by Jordan Kwok, the MISO case study was authored by Jeff Plewes,
the NYISO case study was authored by Chris Russo and Jack Garvey and studies on Great Britain and
Ireland were authored by Robin Cohen.
Disclaimer
The views expressed herein are the views and opinions of the authors and do not reflect or represent
the views of Charles River Associates or any of the organizations with which the authors are affiliated.
Any opinion expressed herein shall not amount to any form of guarantee that the authors or Charles
River Associates has determined or predicted future events or circumstances, and no such reliance
may be inferred or implied. The authors and Charles River Associates accept no duty of care or liability
of any kind whatsoever to any party, and no responsibility for damages, if any, suffered by any party as
a result of decisions made, or not made, or actions taken, or not taken, based on this paper.
Charles River Associates
Page ii
Acronyms
AESO Alberta Electric System Operator
ALFCO Adjusted Load Following Capacity Obligation
ASP Administered Scarcity Pricing
BRA Base Residual Auction
BTMG Behind-the-Meter Generation
CAISO California ISO
CARIS Congestion Assessment and Resource Integration Study
CCA Claimed Capability Audits
CCGT Combined Cycle Gas Turbine
CCP Capacity Commitment Period
CES Clean Energy Standard
CFD Contract for Differences
CLO Capacity Load Obligation
CLP Climate Leadership Plan
CMU Capacity Market Unit
CONE Cost of New Entry
CP Capacity Performance
CPP Clean Power Plan
CR Capacity Resources
CRA Competitive Retail Areas
CRP Comprehensive Reliability Plan
CRS Competitive Retail Solution
CSP Curtailment Service Provider
CSPP Comprehensive System Planning Process
DAM Day-Ahead Market
DMNC Dependable Maximum Net Capability
DPS Department of Public Service
DR Demand Resources
DRR Demand Response Resources
DSR Demand-Side Reduction
DSU Demand-Side Unit
E&AS Energy and Ancillary Service
EE Energy Efficiency
EFORd Equivalent Demand Forced Outage Rate

Charles River Associates
Page iii
EMM External Market Monitor
EMR Electricity Market Reform
ENTSO-E European Network of Transmission System Operators
ETU Elective Transmission Upgrade
EU European Union
FCA Forward Capacity Auction
FCEM Forward Clean Energy Market
FCM Forward Capacity Market
FERC Federal Energy Regulatory Commission
FRA Forward Resource Auction
FRR Fixed Resource Requirement
FTR Financial Transmission Rights
GB Great Britain
HQICC Hydro-Quebec Interconnection Credits
IA Incremental Auctions
ICAP Installed Capacity
ICR Installed Capacity Requirement
IESO Independent Electricity System Operator
IMAPP Integrating Markets and Public Policy
IMM Internal Market Monitor
IRM Installed Reserve Margin
I-SEM Single Electricity Market of Ireland
ISO Independent System Operator
ISO-NE New England ISO
LBA Local Balancing Authorities
LBMP Location-Based Market Price
LCR Locational Minimum Capacity Requirement
LDA Locational Delivery Areas
LM Load Management
LMR Load Modifying Resources
LOLE Loss-of-Load Expectation
LOLP Loss-of-Load Probability
LRZ Local Resource Zone
LSE Load Serving Entity
LTPP Local Transmission Owner Planning Process
M&V Measurement and Verification

Charles River Associates
Page iv
MISO Midcontinent ISO
MMU Market Monitoring Unit
MORP Minimum Offer Price Rule
MRI Marginal Reliability Impact
MRP Market Reference Price
MSP Management Services Provider
NCZ New Capacity Zone
NEPOOL New England Power Pool
NERC North American Electric Reliability Corporation
netCONE Net Cost of New Entry
NICR Net Installed Capacity Requirement
NOx Nitrogen Oxide
NPV Net Present Value
NRCP Net Regional Clearing Price
NYCA New York Control Area
NYISO New York ISO
NYPA New York Power Authority
NYSRC New York State Reliability Council
OM&A Operation, Maintenance and Administration
OCGT Open Cycle Gas Turbine
ORTP Offer Review Trigger Prices
PER Peak Energy Rent
PFP Pay-for-Performance
PJM PJM Interconnect
PRA Planning Reserve Auction
PRM Planning Reserve Margin
PSM Peak Season Maintenance
RAR Resource Adequacy Requirements
RelReq Reliability Requirement
REP Renewable Energy Program
RGGI Regional Greenhouse Gas Initiative
RNA Reliability Needs Assessment
RO Reliability Option
ROS Rest-of-State
RPM Reliability Pricing Model
RTEPP Regional Transmission Expansion Planning Process

Charles River Associates
Page v
RTO Regional Transmission Organization
SCC Seasonal Claimed Capacity
SCR Special Case Resources
SEM Strategic Enrollment Management
SOI Show-of-Interest
SP Strike Price
TSO Transmission System Operator
UCAP Unforced Capacity
UDR Unforced Capacity Deliverability Right
VCA Voluntary Capacity Auction
VRR Variable Resource Requirement
VRT Variable Reliability Target

Charles River Associates
Page vi
Table of contents
1. Executive Summary ..................................................................................................................... 1
1.1. Objective and scope ......................................................................................................... 1
1.2. Contextual overview .......................................................................................................... 1
1.3. Key findings: commonly accepted practices ..................................................................... 2
1.4. Design considerations for Alberta ..................................................................................... 4
2. Introduction and Overview ......................................................................................................... 6
2.1. Introduction ....................................................................................................................... 6
2.2. Selection of markets for comparison ................................................................................ 7
3. A Primer on Capacity Markets .................................................................................................... 8
3.1. What is a capacity market? ............................................................................................... 8
3.2. Why do they exist? ............................................................................................................ 9
3.3. How do they work? ......................................................................................................... 10
4. Jurisdictional Comparison ....................................................................................................... 16
4.1. Section overview ............................................................................................................. 16
4.2. Energy market statistics .................................................................................................. 17
4.3. How much capacity needs to be procured?.................................................................... 18
4.4. Who will buy the capacity?.............................................................................................. 19
4.5. When and how often will capacity be purchased? .......................................................... 20
4.6. How long will the capacity delivery period be? ............................................................... 21
4.7. Who can provide capacity, and how much? ................................................................... 22
4.8. How do we know that capacity has been provided? ....................................................... 23
4.9. How will the capacity market work? ................................................................................ 26
4.10. How will capacity providers be paid? How will capacity costs be allocated? ....... 27
4.11. How will the capacity market impact the energy and ancillary services markets? ......... 29
4.12. Regulatory oversight ....................................................................................................... 30
4.13. Cogeneration and behind-the-meter generation ............................................................. 31
4.14. Market power and its mitigation ...................................................................................... 32
5. Lessons Learned and Common Practices .............................................................................. 34
5.1. Lessons learned .............................................................................................................. 34
5.2. Common capacity market design practices .................................................................... 45
Charles River Associates
Page vii
6. Key Characteristics of Alberta and Considerations for Capacity Market Design ............... 49
6.1. Market scale, market concentration and financing new investment ............................... 49
6.2. Interconnections .............................................................................................................. 50
6.3. Load shape and supply shape ........................................................................................ 51
6.4. Natural gas generation and fuel-specific issues ............................................................. 56
6.5. Role of industrial cogeneration facilities ......................................................................... 57
6.6. Planned coal phase-out and renewables contracting ..................................................... 57
6.7. Wholesale energy market design and transmission policy ............................................. 58
6.8. Market institutions and retail structure ............................................................................ 60
Appendices: Jurisdictional Reviews ............................................................................................... 62
Appendix A: PJM Interconnection ................................................................................................... 63
Appendix B: New England ISO (ISO-NE) ......................................................................................... 77
Appendix C: New York ISO (NYISO) ................................................................................................ 90
Appendix D: Midcontinent ISO (MISO) .......................................................................................... 103
Appendix E: Great Britain (GB) ...................................................................................................... 113
Appendix F: Ireland ......................................................................................................................... 129
Appendix G: California ISO (CAISO) .............................................................................................. 139
Charles River Associates
Page viii
Table of Figures
Figure 1: Cleared Capacity as a Percentage of Target Capacity ......................................... 36
Figure 2: Capacity Price as a % of Net CONE ..................................................................... 39
Figure 3: Capacity Prices ($/kW-year) ................................................................................. 41
Figure 4: Alberta Internal Load Quarterly Intra-day Pattern, 2015 ........................................ 52
Figure 5: Hydro Generation Quarterly Intra-day Pattern, 2015 ............................................ 53
Figure 6: Wind Generation Quarterly Intra-day Pattern, 2015 .............................................. 54
Figure 7: Solar Generation Quarterly Intra-day pattern, 2015 .............................................. 55
Figure 8: VRR Curve Definition ........................................................................................... 67
Figure 9: Marginal Reliability Impact Curve ......................................................................... 81
Figure 10: NYISO Zones ..................................................................................................... 91
Figure 11: 2015 NYISO Capacity Mix .................................................................................. 92
Figure 12: New York Transmission Lines ............................................................................ 92
Figure 13: NYISO Capacity Market Geography ................................................................... 93
Figure 14: NYISO Demand Curve ....................................................................................... 97
Figure 15: Clearing Prices for NYCA in ICAP auctions from 2000 to 2003 ........................ 100
Figure 16: Clearing Prices for NYCA 2000 to 2015............................................................ 100
Figure 17: MISO Resource Adequacy ............................................................................... 109
Figure 18: Extract from Capacity Market Impact Assessment ............................................ 115
Figure 19. EMR interaction with Energy and Ancillary Services Markets ........................... 116
Figure 20: EMR Mechanisms and Institutions .................................................................... 121
Figure 21: GB Capacity Market demand curve for 3rd T-4 auction .................................... 123
Figure 22: Reliability Option Difference Payments ............................................................. 130
Figure 23: Capacity Remuneration Mechanisms ............................................................... 131
Figure 24: Settlement arrangements ................................................................................. 132
Figure 25: Piecewise linear Administered Scarcity Pricing Function .................................. 133
Figure 26: Reliability Option Cash-flows ............................................................................ 134

Charles River Associates
Page ix
Table of Tables
Table 1: Market Statistics .................................................................................................... 17
Table 2: Summary of Forward and Delivery Periods ............................................................ 22
Table 3: Summary of Performance Obligations ................................................................... 24
Table 4: Summary of Performance Incentive Regimes ........................................................ 25
Table 5: Summary of Wholesale Cost Allocation Processes (US markets) .......................... 28
Table 6: Wholesale Cost Allocation Processes (Great Britain and Ireland) .......................... 29
Table 7: Summary of Government/Regulatory Oversight .................................................... 31
Table 8: Summary of Market Power Mitigation Measures .................................................... 33
Table 9: Breakdown of Alberta Internal Load in 2015 .......................................................... 60
Table 10: Alberta Customer Category Split ......................................................................... 60

Charles River Associates
Page 1
1. Executive Summary
1.1. Objective and scope
This report, prepared for the Alberta Electric System Operator (AESO), provides a review of the
capacity market designs in selected jurisdictions. The objective of the review is to identify lessons
learned and commonly accepted practices in capacity market design. Further, the report considers
some of the key characteristics of the Alberta marketplace that may influence the province’s choices in
capacity market design
The report reviews the capacity market designs in six jurisdictions, the four jurisdictions in the United
States (US) that operate centralized capacity markets--New York ISO (NYISO), the New England ISO
(ISO-NE), the Midcontinent ISO (MISO) and the PJM Interconnection (PJM)--and the Great Britain (GB)
and Ireland markets. These jurisdictions represent a cross section of jurisdictions that have either had
considerable experience operating and evolving a capacity market (PJM, NYISO, NE-ISO) or that have
recently designed a capacity market based on research into the experiences of others (GB, Ireland and
MISO).
The report also provides a review of the California ISO (CAISO) resource adequacy mechanism. CAISO
is not a centralized capacity market, but is included to provide a point of comparison to the other
jurisdictions which do operate centralized capacity markets.
1.2. Contextual overview
Many jurisdictions that operate competitive electricity markets have implemented a capacity market as
a means for ensuring that the jurisdiction can meet its supply adequacy standards in a cost-effective
manner through a regular competitive process. A properly defined capacity market works in conjunction
with the real-time energy and ancillary services markets to provide the economic price signals needed
to facilitate efficient long-term decisions, including decisions to invest in new resources, retire existing
resources, uprate existing resources, and develop demand response capability.
Any review of lessons learned and commonly accepted practices in capacity market design must
recognize certain practical aspects that have influenced the evolution of capacity market
implementation. First, all capacity markets reviewed in this report were designed to operate in the
context of the jurisdiction’s pre-existing institutions and regulatory frameworks, and to interact with the
existing energy and ancillary services markets. As a result, many features of capacity market design
are situational to the jurisdiction. This is relevant to Alberta given the uniqueness of its energy
marketplace.
Second, all of the capacity markets reviewed in this report have varying degrees of maturity and are
subject to ongoing evolution. Many of the early problems that were common across markets have been

Charles River Associates
Page 2
resolved in subsequent designs and redesigns, and the lessons learned from this evolution provide
insights on the emergence of commonly accepted practices. However, many jurisdictions continue to
identify issues as they learn from the actual performance of the market and as new external drivers
emerge. This creates a tension between the need for design stability and the benefits of continued
design evolution and refinement. Overall, for those jurisdictions reviewed with actual performance
histories, there is no evidence that this tension has been fatal to the operation of the markets.
This report has been prepared to provide information to the AESO and its stakeholders that will aid in
the consideration of capacity market design elements for Alberta. In order to facilitate the ongoing
discussions, the jurisdictional review and discussion on commonly accepted practices in this report is
organized to address the key design questions posed by AESO1 as well as a few additional questions
that emerged in the stakeholder process.
1.3. Key findings: commonly accepted practices
Our review of the selected jurisdictions has identified the following lessons learned and commonly
accepted practices, in capacity market design that may inform the choices for design in Alberta.
The supply adequacy standard in all jurisdictions is based on a loss-of-load expectation that is
either approved or endorsed by government or a relevant regulator. The system operator then
converts that standard into a targeted capacity amount that is used for auction-based procurement.
The obligation to procure capacity varies across jurisdictions and is largely influenced by the pre-
existing institutions, government policies, and regulatory frameworks. Many jurisdictions place the
obligation on pre-existing load-serving entities to secure capacity to satisfy their share of the supply
adequacy requirement. However, in all the capacity market jurisdictions (excluding CAISO)
reviewed, the system operator runs a centralized auction to procure at least a portion of the
system’s capacity obligations and allocates the cost of this procurement across load serving entities
(LSE) or customers.
All reviewed capacity market jurisdictions use a downward sloping demand curve for procuring
capacity in the auction process. The demand curve is derived using the target capacity amount
determined by the system operator and based on estimates of the cost of new entry of a benchmark
generation facility. The downward sloping demand curve reduces excess volatility and uncertainty
for new investors and mitigates market power. This is an important lesson learned in design.
1 AESO (January 2017), “Designing Alberta’s Capacity Market.” Available at https://www.aeso.ca/assets/Up-
loads/AESO-Capacity-Market-Stakeholder-Session-Jan-2017-Final.pdf.

Charles River Associates
Page 3
Most jurisdictions are electing to use forward capacity markets that procure capacity three to four
years in advance. This is designed to avoid what might otherwise be considered excessive risk
associated with new generation investments. It also increases the degree of competition in the
capacity market. This is another principal of good design.
Most jurisdictions operate annual capacity markets with one-year commitment periods for the
capacity providers. A common practice is to offer new generation facilities a longer commitment
period (three years in PJM and 15 years in GB, for example).
Jurisdictions that use longer forward periods also typically run supplementary or rebalancing
auctions after the base auction and leading up to the start of the commitment period. These
auctions are used to adjust the capacity commitment to the changing supply and demand
conditions. They allow adjustments to correct for demand forecast errors. Some allow sellers to
trade in and out of their base capacity auction obligations when it is economical to do so.
All jurisdictions strive for technological neutrality by permitting both conventional and
unconventional resources, such as variable generation, demand response and in some cases,
energy efficiency programs and imports. Promoting technological neutrality requires the capacity
product to be defined carefully so that a MW from each resource represents an equivalent reliability
value. This requires care as to the treatment of demand response and energy efficiency resources.
The standards regarding this treatment are still evolving.
All jurisdictions except for Ireland place a “must-offer” into the energy or ancillary service markets
obligation on those resources that clear the capacity market. The purpose of the “must-offer”
obligation is to ensure that the energy or ancillary services from the committed capacity are
physically available when most needed. The “must-offer” obligation is generally implemented within
the pre-existing day-ahead markets or, in the case of GB, through a four-hour advance warning.
The design of Ireland’s capacity market is characterized as a “reliability option” and relies on
financial incentives rather than physical obligations to support the availability of energy or ancillary
services when needed. That reliability option approach is presently untested.
All of the US jurisdictions reviewed operate capacity markets in which the capacity price can vary
between zones; this reflects the locational pricing structure of their energy markets. The zonal
capacity markets recognize transmission constraints that may limit the ability of energy to be
delivered between zones under stress conditions. GB and Ireland operate uniform capacity markets
consistent with their energy markets, although Ireland recognizes deliverability limitations procuring
capacity and makes “out-of-merit” payments to attract the required capacity in the constrained
zones.
Charles River Associates
Page 4
1.4. Design considerations for Alberta
There are key characteristics of the Alberta marketplace that may warrant consideration in the design
of a capacity market for Alberta.
There are no legacy LSEs, like those in the reviewed US jurisdictions that have an obligation to
procure capacity that pre-dates market restructuring. Instead, the Alberta market is characterized
by a large number of competitive retail suppliers and a large industrial consumer base with no
obligation to procure capacity. Jurisdictions such as GB and Ireland that also do not have legacy
LSEs have elected to designate the system operator as the primary procurer of capacity and have
designed cost allocation measures to recover costs from various consumer classes.
The wholesale energy market is a highly concentrated oligopoly structure. To date, generators have
been able to unilaterally exercise market power to maintain energy price expectations at levels
sufficient to support new investments, largely from incumbent firms. The capacity market is
intended to provide different types of support for new investment and offers an opportunity to attract
new entry from a broader and more diverse set of players.
Alberta’s small scale, concentrated oligopoly structure and its need for considerable new
investment to replace retiring coal in the future, may influence Alberta’s choice of a forward period.
A forward capacity market that procures capacity three to four years in advance, would tend to
attract a broader diversity of investors.
Similarly, Alberta’s small scale, concentrated oligopoly structure and need for considerable new
investment to replace retiring coal in the future, may favor Alberta’s adoption of a multi-year
commitment period for new generation facilities in order to reduce investment financing risks, and
enhance competition between new entrants.
The various interconnections with Alberta contribute to the efficiency of the Alberta energy market
and have the potential to act as sources of capacity. The capacity market could be designed to
facilitate this participation subject to the appropriate stakeholder interest and the agreement of
neighbouring jurisdictions.
Alberta is a winter peaking jurisdiction, but it will also place considerable importance on gas units
to meet both winter and summer peak demands. The gas units show significant temperature
sensitivity and negative correlation with summer-peaking demand. This may merit a capacity
market design that uses different seasonal capacity requirements and recognizes different
seasonal capabilities.
Unlike most other jurisdictions, Alberta does not have a day-ahead market that creates schedules
and prices for settlement. While the absence of such a day-ahead market is not an obstacle to the
implementation of a capacity market, consideration will need to be given to the must-offer rules and

Charles River Associates
Page 5
their linkage with the obligations of capacity providers. Alternatively, Alberta may consider the Irish
approach of a “reliability option” which uses only financial incentives rather than physical obligations
to ensure the energy or ancillary services are available.
Alberta currently operates a uniform-price energy market, and common practices suggest that
alignment of the capacity market with the energy market may be a reasonable starting point.

Charles River Associates
Page 6
2. Introduction and Overview
2.1. Introduction
AESO currently operates an “energy-only” market in which the energy price provides the underlying
driver for new investment. The energy-only market has functioned well to date, attracting needed new
investment, maintaining a reliable supply of electricity, and providing competitively priced electricity.
In November 2015, the Government of Alberta introduced the Climate Leadership Plan (CLP) to reduce
carbon emissions.2 The CLP will significantly change the future supply mix in Alberta. All coal
generation will be shut down by 2030. Replacement of coal is expected to include 5,000 MW of new
renewable capacity. Additional investment in the form of natural gas generation or other dispatchable
resources will be required.
The AESO plays a key role in the implementation of the CLP, advising the government on the coal
transition as well as designing and implementing the Renewable Energy Program (REP). The AESO is
also responsible for evolving the current electricity market structure as the generation mix changes to
provide reliable and competitively priced electricity.
The AESO recently conducted an analysis of the ability of the current energy-only market to meet the
CLP objectives while maintaining a reliable supply through private investment and competitive prices.3
They recommended and the government agreed, that the province would be best served by moving
from an energy-only market structure to a capacity market structure. The current start period for first
capacity delivery is 2021.4
The AESO has initiated a stakeholder engagement process to work with stakeholders over the next
two years to design a capacity market that is best suited for Alberta. To assist in this effort, the AESO
has engaged CRA to:
conduct a jurisdictional review, including lessons learned, of selected jurisdictions that have
designed and operate (or will operate) a capacity market;
identify common practices in capacity market design; and
consider key characteristics of the Alberta marketplace that might influence the adoption of various
common practices in Alberta.
2 Alberta Government, “Climate Leadership Plan.” https://www.alberta.ca/climate-leadership-plan.aspx.
3 AESO (October 2016), “Alberta’s Wholesale Electricity Market Transition Recommendation.” Available at
https://www.aeso.ca/assets/Uploads/Albertas-Wholesale-Electricity-Market-Transition.pdf
4 Ibid.

Charles River Associates
Page 7
It is the AESO’s preference that the ultimate capacity design be one that:
fosters sufficient private investment in new resources at levels that would maintain the AESO
resource adequacy requirements while achieving lowest costs for consumers;
quickly establishes a stable set of rules that minimizes the risk of continued future rule “tweaking”;
and
provides stable forward price signals and fosters private investor confidence in the ability of the
wholesale market to drive investment.
2.2. Selection of markets for comparison
This report examines the capacity market designs and lessons learned in six jurisdictions. Those are
the four jurisdictions in the United States (US) that operate centralized capacity markets--New York
ISO (NYISO), the New England ISO (ISO-NE), the Midcontinent ISO (MISO), and the PJM Interconnect
(PJM)--and Great Britain (GB) and Ireland. These jurisdictions were recommended for study by the
AESO since they all operate a centralized capacity market. They represent a cross section of
jurisdictions that have either had considerable experience operating and evolving a capacity market
(PJM, NYISO, NE-ISO) or have recently studied and designed a capacity market (GB, Ireland and
MISO) and hence had the opportunity to draw on the best practices of others.
The report also provides a review of the California ISO (CAISO) resource adequacy mechanism. This
is not a centralized capacity market, but is included to provide a point of comparison to the other
jurisdictions which do operate centralized capacity markets.
These seven markets are referred to within this report as the “reviewed markets.”
The remainder of the report is organized as follows: Section 3 provides a primer on capacity markets
intended to offer a basic understanding of why capacity markets exists, how they work, and their
common design elements. Section 4 provides a jurisdictional comparison of the current capacity market
designs in the reviewed markets. Section 5 discusses some of the lessons learned in design and the
emergence of common design practices in the reviewed markets. Section 6 discusses some of the key
characteristics of the Alberta marketplace and associated capacity market design considerations.
Appendices A to G contain individual case studies of the reviewed markets.

Charles River Associates
Page 8
3. A Primer on Capacity Markets
The purpose of this section is to provide a general overview of capacity markets, what they are, why
they exist, and how they work. This section provides context for the jurisdictional review and discussion
of the lessons learned and common practices in capacity market design.
3.1. What is a capacity market?
A capacity market is a means for ensuring that a jurisdiction meets its resource adequacy standards to
maintain reliable operations. Resource adequacy is the ability of supply-side and demand-side
resources to meet the jurisdiction’s aggregate electrical demand (including losses).5 A jurisdiction’s
resource adequacy standard is typically established by a regulator/government and is generally
expressed in terms of a loss-of-load expectation (LOLE) or loss-of-load probability (LOLP).6 The
standard is then typically translated into a planning requirement to have a certain reserve margin of
installed capacity above forecasted future peak demand levels.
In regulated electricity systems prior to competitive markets, the obligation to carry its appropriate share
of physical capacity was allocated to each utility operating in any jurisdiction. This pattern applied in
the tight power pools of the northeast US from which those northeast US energy markets evolved, and
continues to be the basis of capacity obligation in some areas, i.e. Californian and the 90% of the MISO
market without retail competition. Centrally operated capacity markets evolved to supplement or in
some cases displace this system of allocating physical capacity obligations in the context of competitive
energy markets.
A capacity market is a competitive process run regularly by a system operator to identify and attract
qualifying resources to meet forecasted future peak-demand levels plus a reserve margin. The system
operator (with appropriate regulatory involvement) establishes the standard for capacity, but uses
competitive market forces and private investment to achieve it at least cost to consumers. Qualifying
providers compete against each other to sell capacity in the market to the amount needed by the system
operator to achieve the standard. A capacity market works in conjunction with the real-time energy and
ancillary service markets to provide the economic signals (prices) need to attract private investment.
5 North American Electric Reliability Corporation (March 2017) “Glossary of Terms Used in NERC Reliability Standards.”
Available at http://www.nerc.com/files/glossary_of_terms.pdf.
6 For example, many of the North American jurisdictions use a one-event-in-ten-years (1-in-10) loss-of-load standard
whereas GB uses the security of supply standard of three hours per year LOLE.

Charles River Associates
Page 9
3.2. Why do they exist?
A capacity market is a mechanism used to ensure that a jurisdiction achieves its mandated resource
adequacy standard in an efficient manner. Resource adequacy standards are typically set by the
regulator/government and often reflect traditional utility or political preferences for reliability rather than
economics.7 As noted in this report, the determination of resource adequacy standards in GB and
Ireland is more directly derived from the value of lost load (VOLL) calculation.
Resource adequacy standards typically translate into a requirement to maintain a certain reserve
margin of installed capacity above forecasted future peak demand levels. By design, the last increments
of this generation capacity are only expected to operate for a few hours per year, particularly if the
jurisdiction’s peak demands are large relative to its average demands. As a result, and absent capacity-
related revenues, these generators would have to earn sufficient revenue through the energy and
ancillary services markets during these few hours in order to cover their variable and fixed operating
cost plus any return on investment.
If the energy and ancillary service market prices do not rise high enough or often enough to cover these
costs, then there will be what has been referred to as a “missing money” problem. The missing money
problem arises when the expected net revenues from sales of energy and ancillary services earned at
market prices provide inadequate incentives for merchant generating capacity investors or equivalent
demand-side resources to invest in sufficient capacity to meet the mandated resource adequacy
standard.8
In theory, a well-designed energy-only market (with an associated liquid forward contract market) can
solve this problem over time and will support a certain level of adequacy. However, that level of
adequacy is typically below that necessary to meet the desired LOLE. The money is “missing” in the
sense that, without it, the resource adequacy standard would not be met. Lower levels of resources
7 In the North American eastern interconnection, the 1-in-10 year LOLE has historically been a metric used to ensure
that each of the interconnected jurisdictions fairly contribute to overall grid adequacy and do not enjoy a free ride on
the investments made by the other jurisdictions. The 1-in-10 year LOLE standard is a physical resource adequacy
standard that is not based on economics. Though certain costs can be implied from a physical criterion, such ap-
proaches to resource adequacy do not necessarily reflect any explicit cost-benefit analysis or VOLL calculation, nor
do they consider least cost operation of the power system. See for example James F. Wilson, “One Day in Ten Years?
Resource Adequacy for the Smart Grid,” Wilson Energy Economics, November 2009.
8 For a more complete discussion of the missing money problem and its causes see: Paul Joskow, “Competitive
Electricity Markets and Investment in New Generating Capacity,” The New Energy Paradigm (Dieter Helm, ed.), Oxford
University Press, 2007; and Peter Cramton and Axel Ockenfels, “Economics and design of capacity markets for the
power sector,” 2011 and Peter Cramton et al, “Capacity Market Fundamentals,” Economics of Energy & Environmental
Policy, 2013.

Charles River Associates
Page 10
may result in volatility in the levels of service reliability and in market prices that are unacceptable from
a social policy perspective.9
A capacity market is a means for addressing this missing money problem. A capacity market provides
generation and demand response resources with an additional revenue stream, designed to bridge the
gap between what they expect to earn in the energy and ancillary services markets, and what they must
earn to continue investing in sufficient capacity to meet the administratively set resource adequacy
standard. Capacity markets can dampen the volatility around future revenue streams (capacity, energy,
and ancillary services) that can otherwise emerge in an energy-only market. In effect, consumers
assume some risk with respect to demand forecasts, but benefit from more assured reliability. In
addition, by reducing risk and making investments more attractive there is the potential to reduce the
cost of financing that investment. At the same time, the competitive discipline of the market-based
approach ensures that required capacity investments and maintenance is achieved as efficiently and
as transparently as possible. In an ideal world, the capacity market provides an accurate reflection of
the marginal cost and value of resource adequacy at any point in time.10
3.3. How do they work?
No two capacity markets are identical. Each jurisdiction that has implemented a capacity market has
chosen specific design features according to the characteristics of its broader marketplace. However,
there are some similarities in the basic design elements across various capacity markets. To provide a
clearer understanding of how capacity markets work and the general choices to be made in their design,
the following provides a brief description of the basic design elements.
The Capacity Product
All markets require a clearly defined product to be exchanged between buyers (or in the case of some
capacity markets, a single buyer) and sellers. In the context of a capacity market, there are certain
things generally considered when defining the product. First, the product should be defined in a way
9 Robert Stoddard and Seabron Adamson, “Comparing Capacity Market and Payment Designs for Ensuring Supply
Adequacy,” Proceedings of the 42nd Hawaii International Conference on System Sciences, 2009. Alberta has
successfully operated an energy only market to date, attracting private investment while maintaining a reliable level of
supply. There are several features of the Alberta market that have arguably enabled it to function effectively as an
energy-only market and to support investment. See Brian Rivard and Adonis Yatchew, “Can the Electricity Market
Structure Accommodate Significant Levels of Renewable Generation? An Evaluation of Carbon Policy Options for the
Alberta Electricity Sector,” Alberta Market Surveillance Administrator, October 2015, for a description of these features.
However, as the AESO’s Market Transition report concludes, as Alberta shifts toward lower-emission sources of elec-
tricity, a capacity market is needed to maintain an acceptable level of supply adequacy.
10 In this regard, if all of the other factors contributing to the missing money gap are addressed, the remaining capacity
payments reflect the value of the incremental reliability implicit in achieving the LOLE standard.

Charles River Associates
Page 11
that is consistent with the reliability objective for which it was created (namely, resource adequacy).
Second, in order to promote economic efficiency, the capacity product should be defined in a way that
is agnostic to the technology being used. Such technological neutrality is achieved if the capacity
product is defined so that an MW from each resource represents an equivalent reliability value. Third,
in some jurisdictions, the capacity product may require a locational attribute if transmission constraints
limit product deliverability from one location to another.11 Most jurisdictions have defined the capacity
product generically as the “availability to generate energy or reduce load when needed,” typically
during periods of shortage or scarcity.12 This is generally expressed and measured in the reviewed
capacity markets as unforced capacity (UCAP).
The Buyers
The buyers in a capacity market are those that hold the resource adequacy obligation. In most
jurisdictions, a regulator or government establishes the resource adequacy standard, generally with
reference to a LOLE. The system operator calculates through a planning process a target amount of
capacity needed to achieve the standard. The obligation to secure this capacity may then reside with
the system operator itself. This is the case in the GB example. Alternatively, the obligation may be fully
or partially assigned to LSEs, which is the case in many US jurisdictions.
North American Electric Reliability Corporation (NERC) defines an LSE as the entity that secures
energy and transmission services and related interconnected operations services to serve the electrical
demand and energy requirements of its end-use customers.13 LSEs are creations of the local
jurisdictions laws, regulations, and tariffs. Many LSEs are the descendants of utilities with defined
geographical territories. Today, the term includes load aggregators or power marketers that have been
granted the authority, or have an obligation pursuant to jurisdictional law or regulations, to sell energy
to end users located within the jurisdiction (competitive retailers). In some cases, the LSE definition
includes end-use customers that qualify by law or regulation to directly manage their own energy supply
and use of transmission and ancillary services.
11 Defining the capacity product on a locational basis is a standard in the US capacity markets, but not in GB or Ireland.
In GB, there is no locational pricing in the energy market. The zonal capacity market matches the current energy market
design although the possibility of locational pricing in both markets is being considered. In Ireland, the energy market
design is zonal. The proposed capacity market is zonal, but it reflects delivery constraints caused by transmission and
provides out-of-merit payments to capacity resources needed to address these constraints. See Section 4.9.2.
12 While the definition focuses on the availability of capacity, what is really needed is the actual energy from that capacity
during the periods of shortage or scarcity. One of the challenges that many capacity markets have faced is providing
the appropriate incentives to supply-side and demand-side resources to produce energy during these periods. See
discussion on performance obligations in Section 4.8 and on capacity market performance in Sections 5.4 and 5.5.
13 See supra note 5.

Charles River Associates
Page 12
The Sellers
The sellers in capacity markets are generators, including traditional generation and variable14
generation resources (typically renewable), imports, storage, demand response and in some markets,
energy efficiency. These resources have different operational characteristics and their capacity value
may differ. As mentioned above, a key objective of most jurisdictions is to promote technological
neutrality within their capacity markets by equalizing the reliability value of the capacity product sold.
This is often managed though capacity market rules that define a resource’s qualified capacity – the
amount of capacity that a resource is eligible to offer into the capacity market.
One common approach to qualifying capacity is based on unforced capacity (UCAP). UCAP is
calculated differently for each resource. For example, the UCAP of coal or gas generation units can be
calculated as installed capacity adjusted for forced outage rates, whereas for variable (renewable)
generation units, an equivalent to UCAP can be calculated based on historical capacity factors during
the seasonal peak demand hours. The capacity market design requires the system operator to establish
a transparent and consistent process for qualifying the capacity of each resource interested in selling
in the capacity market.
The Auction Mechanism
Centralized capacity markets use an auction process to facilitate the trade of the capacity products
between buyers and sellers. In some jurisdictions (ISO-NE, GB, Ireland), the system operator procures
all required capacity through the auction on behalf of LSEs (consumers) with the LSEs (consumers)
holding the financial obligation to pay for the capacity. In some jurisdictions, such as PJM, LSEs can
choose to self-supply their entire requirements upon approval by the system operator. The system
operator then procures the required capacity net of the self-supplied requirements on behalf of the
remaining LSE’s, with these LSEs holding the financial obligation to pay for the capacity. In some
jurisdictions (e.g. NYISO), participation is voluntary and the auction is used to assist LSEs in making
incremental adjustments to their self-supplied capacity. Whether auctions are mandatory or voluntary,
and whatever the auction mechanics, each auction results in the establishment of a clearing price used
for all settlements, as well as a set of cleared (sold) capacity resources and, if applicable, a set of
cleared buyers.
Many jurisdictions have started to deploy administratively-determined demand curves as part of the
auction clearing process. The demand curve is constructed by the system operator to represent the
buyers’ willingness to pay for various levels of capacity. The price decreases for increments of capacity
above the target, but can be allowed to rise to some price cap if there is a deficiency in capacity offered.
14 Variable generation resources may also be referred to as intermittent resources.
Charles River Associates
Page 13
A key element of the demand curve is the cost of new entry (CONE) as estimated by the system
operator for the most economical resource type. Gross CONE includes all fixed costs related to the
construction and availability of a facility, including those related to capital, financing, and fixed operat-
ing, maintenance, and administration (OM&A), but typically not fuel delivery fixed costs. Gross CONE
can vary by location to reflect locational differences in siting and construction costs. Net CONE equals
gross CONE minus the expected margin on sales of energy and ancillary services, and represents the
administrative estimate of reasonable new entry costs that would have to be recovered through the
capacity market. Net CONE may, therefore, also vary by location to reflect locational differences in
energy and ancillary services prices or fuel costs and hence energy and ancillary services margins.
Timing Parameters
There are various timing parameters to consider in the design of a capacity market. Key timing param-
eters include: the commitment period, the forward period, and supplementary or rebalancing auctions.
The delivery period or commitment period is the length of time for which a seller that clears the
auction is required to meet its obligations and provide the capacity product to either the single buyer
(system operator) or to the LSEs. The commitment period may be annual, seasonal (summer and
winter), or monthly.
The choice of the commitment period can affect different sellers and buyers differently. Generally
speaking, new build generation facility owners prefer longer commitment periods with correspondingly
longer term price certainties, as this makes obtaining financing easier. Some jurisdictions allow new
build generators to qualify for long commitment periods (e.g. three years in PJM and 15 years in GB).
Other sellers, like some demand response aggregators, may prefer a seasonal commitment period as
their ability to provide qualified capacity may vary, such as in the case of demand response associated
with heating or air conditioning loads. A longer commitment period can create more risk to consumers
as it requires a greater reliance on long-term demand forecasts. Finally, the choice of the commitment
period may depend on the role of LSEs in the market and on the regulatory and political uncertainties
in the jurisdiction. Markets with less perceived regulatory and political uncertainties may function well
with shorter commitment periods as there is more confidence in the longer-term price trends.
The forward period is the length of time between the auction and the start of the commitment period.
Both PJM and ISO-NE employ a three-year forward period, while NYISO operates a spot capacity
market which provides the ability to rebalance among participants and which clears two to four days
prior to the start of the month.15 Like the commitment period, the choice of the forward period can affect
15 The NYISO operates three capacity markets: a capability “strip” auction, a monthly auction, and a spot market auction.
See discussion in Section 4.5 and Appendix C.

Charles River Associates
Page 14
different sellers and consumers differently. A longer forward period allows new builds to clear the
auction and to be constructed during the period leading up to the commitment period. This arguably
encourages broader participation from new build as they have more certainty of the price they will
receive prior to initiating construction. Some demand response resources prefer a shorter forward
period as they have difficulties securing individual customers so far in advance. Finally, the longer the
forward period the greater the potential for demand forecast errors, such as on the amount of capacity
procured and the price at which the auction clears.
Jurisdictions that use longer forward periods also typically run supplementary or rebalancing
auctions after the base auction and leading up to the start of the commitment period. These auctions
are used to adjust the capacity commitment to the changing supply and demand conditions. They allow
adjustments to correct for demand forecast errors. Some allow sellers to trade in and out of their base
capacity auction obligations where it is economical to do so.
Performance Obligations
Most capacity markets place performance obligations on the sellers that clear the auction.16 The
performance obligations are required to ensure that the capacity that clears the auction is available
when needed and performs as required to maintain reliability.
One common performance obligation is a “must-offer” provision in the energy and ancillary services
markets. Sellers must offer a quantity of energy or ancillary services at least as great as the qualified
capacity that cleared the auction.17 They must offer this quantity in the day-ahead energy market18
and/or in the real-time energy or ancillary services markets, subject to recognized and reportable
limitations. If scheduled in the respective energy markets, they must then deliver. Performance of these
resources is evaluated based on their ability to achieve certain availability standards. Those that fail to
meet their obligations may be subject to performance penalties or may have their qualified capacity
adjusted in future auctions.
Market Power Mitigation
Most jurisdictions deploy rules to mitigate the potential market power of sellers and/or buyers. Supply-
side market power can be a concern when there are few competitors in a constrained delivery area,
16 The exception among reviewed markets is Ireland, which is described as a reliability option model, in which there is no
physical obligation, but just a simple financial settlement.
17 The must-offer obligation may apply to a higher value of capacity: i.e. for a conventional generator, with the ICAP value
corresponding to the UCAP cleared at auction; i.e. for wind or solar, the total available capacity.
18 The term day-ahead market is used in this report to mean a market in which energy and ancillary services are
scheduled in the day-ahead timeframe and are paid for their scheduled production at prices established in that
day-ahead market.

Charles River Associates
Page 15
causing one or more of the sellers to be “pivotal” – i.e., that the capacity demand in the area cannot be
met without the supply of the seller. Buyer-side market power or “monopsony” power can arise if there
is a large net buyer of capacity that has the incentive and ability to depress the prices by offering its
qualified capacity below its cost.
Market Power Mitigation measures may differ across jurisdictions. On the supply side, some
jurisdictions use pivotal supplier tests to measure the potential for seller market power. If the seller fails
the test, the market monitor will impose an offer cap on the seller based on going forward cost data.
Some jurisdictions have requirements for mandatory participation by existing facilities, with price caps
or price-taker requirements. On the buy side, several jurisdictions employ a minimum offer price rule
(MOPR) to limit a net buyer’s ability to depress the capacity market’s clearing price through its qualified
capacity offers.

Charles River Associates
Page 16
4. Jurisdictional Comparison
4.1. Section overview
This section provides a high-level comparison of the capacity markets in the following jurisdictions:
PJM, NYISO, NE-ISO, MISO, GB, and Ireland. Reference is also made to the CAISO’s resource
adequacy process in California, but in our view, this is not a capacity market framework. The
comparison is largely organized around the AESO’s “Key Questions for capacity market Development”
as set out in the AESO’s January 17th presentation to stakeholders and as adopted in CRA’s February
7th presentation. Comprehensive descriptions of each of these markets have been provided in the
appendices.
These capacity markets have varying degrees of maturity, but all are subject to ongoing evolution. The
markets in PJM, ISO-NE, and NYISO all have their origins in the period 1999 to 2005 with
implementations in the mid-2000s.The GB market was established under 2013 legislation, and the
Ireland market is still under redesign in order to bring it into line with the European Electricity Target
Model. Both the PJM and ISO-NE capacity markets have recently implemented changes that affect
capacity commitments that have been made though auctions in the last couple of years but which
remain to be delivered in future years. MISO has proposed changes to its capacity markets in those
zones that operate competitive retail markets. These proposed changes were the subject of an
application to the Federal Energy Regulatory Commission (FERC) which was outstanding at the time
this report was drafted, but which has since been rejected by FERC.
As noted in Appendix D, the grounds for rejection focused on concerns over the potential interactions
between the two parallel capacity markets systems (for competitive and non-competitive retail zones)
and a lack of positive support for this proposal. This report contains the description of the proposal, as
this is indicative of what was considered appropriate capacity market practice by MISO, and therefore
it provides useful information for the AESO. The capacity market descriptions are set out in the
appendices. Comparisons in this section reflect the present state of the rules, including those proposed
(in MISO) and under development (in Ireland). While the indicators of capacity auction outcomes in the
markets with long forward periods are available and are reflected in the market performance data, the
delivery period performance under these updated rules is yet to be proven.
In viewing the differences among markets, it is important to recognize that capacity markets have in all
cases been added to pre-existing energy markets. Those energy markets comprised certain institutions,
regulatory contexts, and energy market designs. Capacity markets have been designed to complement
and interface with those institutions (i.e. LSEs), regulatory contexts (i.e. single vs multi-state), and

Charles River Associates
Page 17
energy market design features (i.e. day-ahead markets). This review has not identified any major
changes to energy market structures that were made to accommodate capacity markets.19
The section will commence with a summary table showing key energy market statistics for each
reviewed market. This is followed by a description of how the reviewed markets address each of
AESO’s capacity market design questions and additional issues. The description identifies common
elements as well as differences.
4.2. Energy market statistics
Table 1 sets out 2015 overview data for each of the reviewed markets and for 2016 data for Alberta.
Table 1: Market Statistics20
19 The present redesign in Ireland comprises both energy and capacity markets, planned to replace the prior energy
market and capacity mechanism in order to reflect the European Electricity Target Model.
20 Note: Data is for 2015 except where noted, GB and Ireland data summarized for all classes of renewables. For Alberta,
“Other” includes Biomass. Sources: Velocity Suite, SNL, UK Gov, National Grid, and EirGrid Group.
AESO
(2016)PJM ISO-NE NYISO MISO Gr Br Ireland CAISO
Total load TWh 80 793 125 162 676 338 36 232
Peak demand GW 11 144 24 31 120 53 7 47
Load factor 79% 63% 59% 59% 64% 73% 61% 56%
Winter peak / summer peak 112% 100% 84% 79% 89% 130% 122% 72%
Supply mix
Nuclear 0% 34% 29% 31% 15% 19% 0% 13%
Coal 38% 35% 4% 1% 49% 30% 19% 2%
Gas 44% 25% 48% 44% 25% 30% 37% 53%
Water 5% 2% 7% 18% 2% 6%
Wind 8% 2% 2% 3% 6% 9%
Solar 0% 0% 0% 0% 19% 38% 9%
Biomass 2% 8% 2% 2% 3%
Geothermal 0% 0% 0% 0% 6%
Other (inc oil) 5% 0% 2% 0% 2% 3% 5% 1%

Charles River Associates
Page 18
4.3. How much capacity needs to be procured?
4.3.1. Loss of load expectation
All reviewed markets start by considering some measure of LOLE. However, there are two differences
between the markets:
The standard in North American markets is a planning expectation of one event of firm load loss
per 10 years, based on North American Electric Reliability Corp. (NERC) guidelines and some
regional reliability council standards. This is endorsed by state regulators acting singly (as in New
York) or in collaboration (as in MISO) through their exercise of regulatory authority over the retail
rates that may be charged by LSEs.
The less onerous standards in GB and in Ireland are three and eight hours of loss of load per year
respectively. These are set by the government (in GB) and the regulators (in Ireland), and are
based on their assessment of the value of lost load.
4.3.2. Capacity / reserve requirements
The total capacity requirement looks forward to the period in which the capacity is to be delivered and
comprises the forecasted peak energy demand plus the reserve margin required to meet the specified
LOLE.21
The capacity requirement may be expressed as installed capacity (as is the case in California and ISO-
NE) or unforced capacity (in other markets).
That single point capacity requirement, or the associated reserve margin, is used:
to define the capacity obligation of LSEs in those jurisdictions where the LSEs are obliged to, or
may elect to, self-supply their capacity.
as a key input to the positioning of the demand curve used in all centralized auctions operated by
system operators.
4.3.3. Setting the demand curve
All the markets reviewed except for California utilize a centralized auction-based procurement process
for at least part of the capacity requirement, and employ a sloped demand curve in that centralized
procurement process. The sloped demand curve recognizes diminishing value in incremental capacity
21 The loss of load criteria is applicable to the firm energy requirement and excludes energy supply which is specifically
interruptible. In setting the target capacity requirement for an auction, a loss of load event includes a loss of firm load.
It does not include an event in which the normal operating reserve requirements are not met.
Charles River Associates
Page 19
above the target level, and increasing value in avoiding incremental shortages below that target level.
A sloped demand curve also eliminates bipolar price outcomes and can contribute to mitigation of
market power. The shape of the demand curve can vary:
The simplest form of sloped demand curve is defined by two segments: at any demand below the
auction minimum quantity, the price equals the capacity auction price cap (typically related to gross
CONE or a multiple of net CONE); the demand curve then slopes down in a straight line to price
zero at the auction maximum quantity. This is the model used in New York.
In other reviewed markets, the sloped portion is divided into two segments. One is sloping down
from the price cap at minimum auction demand to (typically) net CONE at a target capacity level,
and then to zero at auction maximum capacity. The slope at less than target capacity (i.e. above
net CONE price) is steeper than above target capacity, so that the curve is described as “convex”
or “kinked”.
The shape of the demand curve in Ireland has yet to be defined.
The positioning of the demand curve relative to the single point capacity requirement determined
from LOLE, as well as the steepness of the slope, vary and are subject to regulatory oversight.
The reviewed US markets are each divided into zones reflecting transmission constraints. Separate
demand curves are established for each zone, reflecting the amount of in-zone capacity required,
as well as potential variation of CONE between zones due to differences in siting and construction
costs, as well as zonal net energy and ancillary service market margins.
4.4. Who will buy the capacity?
There are two primary modes of operation in resource adequacy mechanisms and capacity markets
which will be referenced here as “physical LSE obligations” and “financial LSE obligations,” recognizing
that LSEs used in this context may include qualified end-use customers.
In a physical LSE obligation model (i.e. California and most of MISO) the system operator
determines the capacity requirement or reserve margin and allocates the obligation to supply that
capacity to LSEs according to a measure of their peak demand. Each LSE then has the obligation
to supply that quantity of capacity to the market, either through ownership and control or through
contractual relationships. In this model, each LSE is an owner or a buyer of capacity with discretion
to use its own timing, processes, forms of contract, settlement terms, etc. for such bilateral contract
procurement. Those bilateral contract arrangements may be tendered or negotiated, and may
extend beyond simple capacity services to include energy, ancillary services, etc. outside the
applicable energy or ancillary services market. The capacity resources that an LSE uses to meet
its obligation to the system operator would however still be subject to the system operator’s rules
with respect to performance, etc., and the LSE would be subject to any applicable sanctions.

Charles River Associates
Page 20
In a financial LSE obligation model (i.e. ISO-NE), it is the system operator that procures and settles
for capacity. The obligation on LSEs in such a market is to pay to the system operator their allocated
shares of the capacity cost in accordance with the rules or tariff established for this purpose.
The physical model is a simple evolutionary step from the framework in place before the introduction of
electricity markets. None of the reviewed markets except California operate a purely physical model.
Centralized auctions play some role in all of the other markets. Three of the markets (ISO-NE, GB, and
Ireland) have adopted a purely financial model, while the other three (PJM, NYISO, and MISO) have
hybrid approaches, each with differing emphasis on each framework. Each of these three are discussed
below:
In PJM, the system operator (the regional transmission organization (RTO), operates a central
auction, but each individual LSE may elect instead to self-supply all of its capacity obligation.
In NYISO, each LSE has a physical obligation, but it may in effect choose to procure a portion of
this obligation through the ISO’s centralized auction process.
MISO is divided into zones, some in which competitive retail supply is permitted and others in which
it is not. In competitive retail zones, which comprise some 10% of MISO load, MISO operates a
centralized auction process. In other zones (90% of load) the obligation on LSEs is physical, but
those LSEs may utilize MISO’s voluntary auction process to trade capacity short term.
The California framework is based on LSEs bearing physical capacity obligations, with CAISO having
backstop power to use contract procurements to remedy deficiencies.
4.5. When and how often will capacity be purchased?
This discussion relates to the forward period of procurement under centralized auctions, i.e. the period
between the completion of an auction and the start of the delivery period, which is also referred to as
the commitment period. To the extent that an LSE self-supplies, the implicit forward period may be
similar to the auction forward period, as the same MW of resource cannot be committed to an LSE’s
self-supply and separately offered into a capacity auction. However, there is nothing to prevent bilateral
arrangements between LSEs (undertaking self-supply) and generators for longer contract durations
that would cover many delivery periods.
Much of the discussion about forward periods and delivery periods (discussed in the next section)
relates to the enablement of new investment. Longer forward periods (three or four years) enable
investors to secure capacity market commitments before making their major investment commitments.
Longer delivery periods for new investment (up to three years in PJM and 15 years in GB) provide price
certainty for investors in new generation facilities, and thus reduce the cost of capital and potentially
enlarge the competitive pool. On the other hand, these longer forward periods and delivery periods
impose more of the load forecast risk onto electricity consumers. Longer forward periods may also be

Charles River Associates
Page 21
more problematic for demand-based resources whose production cycles may drive shorter planning
and investment time horizons.
In all of the reviewed markets that have adopted a purely financial model, the emphasis appears to be
on allowing longer forward and delivery periods in order to facilitate market entry and reduce costs,
albeit at some risk arising from load forecast uncertainty. Supplementary auctions exist in all these
markets in order to permit some adjustment and rebalancing as load forecasts improve and as resource
capabilities may be found to vary.
There is less emphasis on long forward and delivery periods in reviewed markets with a strong physical
element. It is possible (though not researched for this report) that it is the LSEs in those markets that
are providing the bridge between shorter capacity market terms and longer investor needs, due to their
confidence in their ability to recover prudently incurred costs under their state regulatory regimes.
Tabulation of the reviewed market parameters are combined with those for the commitment period
discussed in the next section.
The frequency of auctions is driven by the combination of forward period and delivery period. Those
jurisdictions with one-year delivery periods have an annual cycle of auctions, with a primary auction
held at the forward period date and one (GB) or more annual supplementary auctions at shorter forward
periods. The frequency of NYISO auctions is twice per year for primary auctions, recognizing the
seasonal delivery period, with monthly supplementary auctions.
While Ontario is not one of the reviewed markets, and its capacity market design is still at a very early
stage, the proposed framework would be for two seasonal levels of requirement and capability, covered
in a single annual auction that would allow for linked winter-summer offers and joint optimization of the
supply stack.
4.6. How long will the capacity delivery period be?
The capacity delivery period or commitment period is the period over which the capacity resource is
obliged to meet its physical and/or financial capacity obligations.
The most common delivery period in the reviewed markets is one year. This is not necessarily a
calendar year, and indeed it is more typically defined so that each potentially critical season (winter or
summer) falls within a single capacity year. New York is unique amongst the reviewed markets in
adopting a seasonal approach; each year is divided into two six month seasons. New York and ISO-
NE also include monthly rebalancing auction processes.
Several markets have adopted longer delivery periods for new generation facilities and in some cases
for qualifying re-powering or refurbishment.
Forward and delivery periods in the reviewed markets are summarized in Table 2.

Charles River Associates
Page 22
Table 2: Summary of Forward and Delivery Periods
4.7. Who can provide capacity, and how much?
4.7.1. Conventional generation
The supply mix data summarized in Section 4.2 indicates that the majority of the supply in the reviewed
markets is from conventional, controllable generation: nuclear; coal; natural gas, and a certain amount
of hydroelectric. In all the reviewed markets except California and ISO-NE, the capacity of these
facilities is procured and settled as UCAP. In California and ISO-NE, the capacity obligation is
denominated as installed capacity (ICAP). Notwithstanding that, in most markets, capacity is procured
and settled as UCAP, the resulting performance obligation on conventional controllable generation is
to offer all of the ICAP except on recognized outages.
In PJM, ISO-NE, MISO, and California, the capacity requirement is set on a year-round basis, and the
capability of each facility reflects its year-round capability. The critical period of each year is the summer
season, so the capacity requirement is based on the summer peak, and the facility capability is based
on its summer capability. GB and Ireland are winter-peaking markets. New York has adopted a two-
season approach to its centralized capacity market, allowing separate capacity requirements,
recognition of different seasonal capabilities, and separate prices for each season.
Forward Period Delivery Period
Reviewed Market Primary AuctionsSupplementary /
Rebalancing AuctionsFor Existing Resources
For New Generation &
Refurbishments, etc.
PJM 3 yr base auction 2 yrs & 1 yr 1 yearUp to 3 years
(subject to min size)
ISO-NE 3 yr base auction 2 yrs & 1 yr & monthly 1 yearUp to 7 years (may include
repowering)
NYISO 1 monthDays ahead for monthly
incs & decs
6 month season with
monthly adjustments
6 month season with
monthly adjustments
MISOnon-competitive zones, physical
obligation & voluntary auction
participation2 months None 1 year 1 year
MISO competitive zones 3 years Residual auctions 1 yearUp to 3 years for new &
refurbished
GB 4 years 1 year 1 yearUp to 15 years for new and
3 years for refurbished
Ireland 4 years 1 year 1 year Up to 10 years
CAISO physical obligation - no auction2 months to specify
obligation (no auction)None
1 year commitment of
resource to CAISOBilateral with LSE only
Charles River Associates
Page 23
4.7.2. Variable generation
Variable generation includes wind, solar, and run-of-river hydroelectric. In GB, this is largely excluded
from the capacity market by the prohibition on participation by resources receiving other government
subsidy support. Otherwise, variable generation facilities are qualified to participate in the reviewed
capacity markets. The quantum of such participation reflects the extent to which it contributes to
reducing LOLE or to its expected production at times of system stress.
4.7.3. Imports
Imports to reviewed markets that are firm and not subject to recall by source or wheeling jurisdictions
can qualify as capacity resources.
4.7.4. Demand response and energy efficiency
Demand response (DR) programs are potentially eligible as capacity resources in all reviewed markets.
Energy efficiency (EE) programs are potentially eligible in PJM, ISO-NE, and MISO, with a decision yet
to be made in Ireland.
There is a strong interaction between DR and EE programs and the allocation to electricity consumers
of capacity costs. If LSEs or consumers implementing DR or EE receive benefit from a corresponding
reduction in their obligation to incur or pay capacity costs, then some suggest that they should not also
receive a capacity payment for making those reductions. This exclusion is explicit in the PJM discussion
of DR based on behind-the-meter generation (BTMG) and of EE.
4.8. How do we know that capacity has been provided?
4.8.1. Basic obligations
At a high level, generators in reviewed US markets are obligated to offer capacity into the energy and
or ancillary services markets in the day-ahead market except where excused for outages. The
mitigation of the energy offer prices is typically a pre-existing feature of those energy markets.
Obligations vary somewhat from market to market, as set out in the tables below.
This contrasts with the GB obligation, which is to offer the capacity during “capacity market warning
events,” of which the system operator will provide four hours’ notice.
In Ireland, the design is referred to as a reliability option and has no physical performance obligation.
The obligations on variable generation resources are modified to reflect their capability, and the
obligations on DR resources have been differentiated in some markets, but are becoming more closely
aligned with those for generation resources.

Charles River Associates
Page 24
Please refer to Table 3 for a summary of the performance obligations, as set out more fully in the
Appendices.
Table 3: Summary of Performance Obligations
4.8.2. Performance metrics and financial consequences
The reviewed markets exhibit a range of approaches to non-performance of capacity obligations:
Resources that fail to deliver on capacity obligations may be subject to a deficiency charge based
either on the capacity price otherwise payable, or on the energy market clearing price, or a
combination of both.
In MISO, load management resources that fail to deliver may be disqualified for future eligibility as
capacity resources.
In PJM and ISO-NE, the market is migrating to a “capacity performance” or “pay-for-performance”
basis whereby resources that underperform over a period are proportionately penalized, and the
funds thus collected are used to reward those who over perform.
Reviewed Market Must Offer Obligation
PJM
All generation that clears the RPM auction or obtains a capacity commitment must-offer into the
PJM day-ahead energy market. Demand resources must be available any day during the delivery
year during certain hours without a limit to the duration of interruption
ISO-NE
All traditional generation and imports must offer in day-ahead and real-time energy market. Day-
ahead is optional for variable generation. Participation in day-ahead and real-time required for
demand response starting in 2018
NYISO
Any resource that cleared in the auction is required to either bid into the day-ahead market or
declare itself unavailable. Demand response resources (SCRs) are not subject to daily bidding
instead they submit monthly UCAP and an associated offer price. Some variable resources may
not have to bid into day-ahead privded they perform up to standards used in determining their
UCAP
MISOResources in CRS zones must offer energy or ancillary services in day-ahead with the exception of
the Safe Harbor provision and an exemption for resources physically unable to participate
Great Britain
Must-offer and produce when SO issues “Capacity Market Warning.” CMW issued when
anticipated system margin in four hours time is less than 500MW. The capacity provider’s base
obligation is the derated capacity bid into the auction. But this may be modified proportionately to
system demand during the period of system stress
Ireland None
CAISO
Satisfying the must-offer obligation can be accomplished by submitting economic offers or self-
schedules for day-ahead energy and ancillary services market, through residual unit commitment
process and if applicable, in real-time
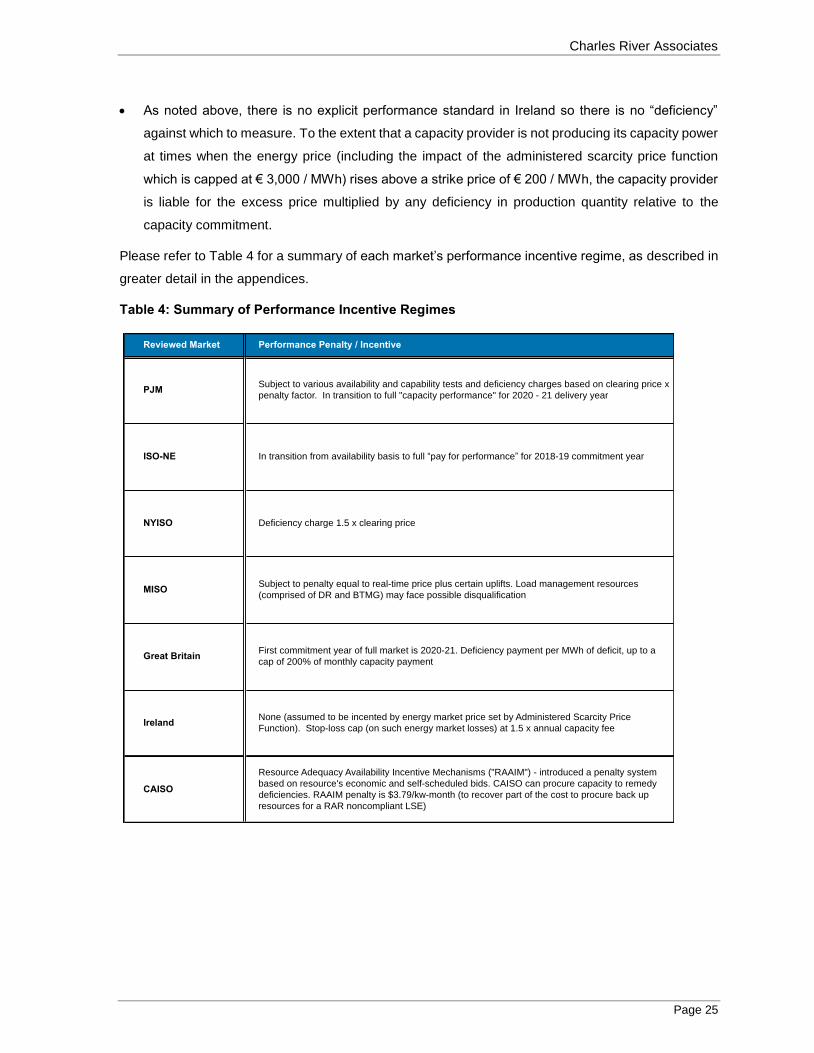
Charles River Associates
Page 25
As noted above, there is no explicit performance standard in Ireland so there is no “deficiency”
against which to measure. To the extent that a capacity provider is not producing its capacity power
at times when the energy price (including the impact of the administered scarcity price function
which is capped at € 3,000 / MWh) rises above a strike price of € 200 / MWh, the capacity provider
is liable for the excess price multiplied by any deficiency in production quantity relative to the
capacity commitment.
Please refer to Table 4 for a summary of each market’s performance incentive regime, as described in
greater detail in the appendices.
Table 4: Summary of Performance Incentive Regimes
Reviewed Market Performance Penalty / Incentive
PJMSubject to various availability and capability tests and deficiency charges based on clearing price x
penalty factor. In transition to full "capacity performance" for 2020 - 21 delivery year
ISO-NE In transition from availability basis to full “pay for performance” for 2018-19 commitment year
NYISO Deficiency charge 1.5 x clearing price
MISOSubject to penalty equal to real-time price plus certain uplifts. Load management resources
(comprised of DR and BTMG) may face possible disqualification
Great BritainFirst commitment year of full market is 2020-21. Deficiency payment per MWh of deficit, up to a
cap of 200% of monthly capacity payment
IrelandNone (assumed to be incented by energy market price set by Administered Scarcity Price
Function). Stop-loss cap (on such energy market losses) at 1.5 x annual capacity fee
CAISO
Resource Adequacy Availability Incentive Mechanisms ("RAAIM") - introduced a penalty system
based on resource's economic and self-scheduled bids. CAISO can procure capacity to remedy
deficiencies. RAAIM penalty is $3.79/kw-month (to recover part of the cost to procure back up
resources for a RAR noncompliant LSE)
Charles River Associates
Page 26
4.9. How will the capacity market work?
This section excludes California, whose resource adequacy process does not include a capacity market
process.
4.9.1. Auction process
There are two common auction processes:
In a sealed bid auction, resource owners provide sealed bids at the closing date and time. These
are assembled into a supply curve and matched to the demand curve to establish a clearing price.
All offers below that clearing price are accepted and become capacity obligations.
A descending clock auction is more interactive. The auctioneer posts a starting price (the price cap
level in the demand curve). Participants specify the capacity and resources they would provide at
that price. If that capacity offer quantity exceeds the capacity demand at that price, the auctioneer
repeats the process at a lower price, and participants update their capacity offer quantities at the
reduced price. The process continues until the total capacity offer quantity drops below the demand
curve quantity at that price, thus establishing a clearing price and the identity of resources cleared.
The detail of these processes becomes more complicated, as reflected in the appendices
describing each reviewed market. In particular, they are modified to allow the establishment of
zonal clearing prices to reflect zonal needs imposed by transmission constraints.
Of the reviewed markets, PJM, NYISO, MISO, and Ireland use a sealed bid auction process, while
ISO-NE and GB use a descending clock process. ISO-NE has prepared a discussion paper that
explores the implications of the different design choices.22
The sealed bid auction process puts more information in the hands of the auctioneer. The descending
clock process puts more information in the hands of the participants:
One argument for a descending clock process is that it allows more interactive price discovery by
participants during the auction process. This may however be seen as a disadvantage in a market
with a limited number of marginal participants for whom the additional information would facilitate
the exercise of market power.
The additional information available to the auctioneer under a sealed bid auction process may also
have a potential benefit by enabling co-optimization of separate seasonal supply stacks and
22 ISO-NE currently uses a hybrid of the descending clock and sealed bid auction, but are exploring possible changes to
their design. See ISO New England (July 2016). “Forward Capacity Auction Formats: Questions and Answers,” for a
discussion of the implications of the different design choices. Available at https://www.iso-ne.com/static-assets/docu-
ments/2016/07/20160711-dca-v-sealed-bid.pdf.
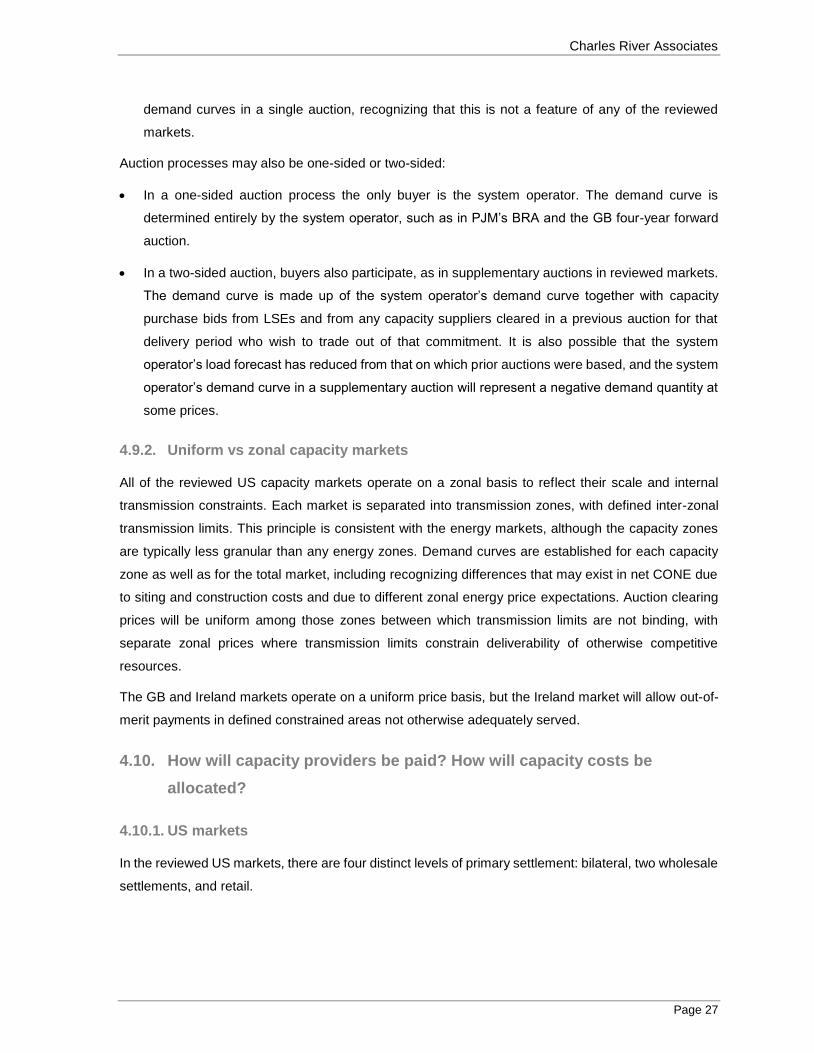
Charles River Associates
Page 27
demand curves in a single auction, recognizing that this is not a feature of any of the reviewed
markets.
Auction processes may also be one-sided or two-sided:
In a one-sided auction process the only buyer is the system operator. The demand curve is
determined entirely by the system operator, such as in PJM’s BRA and the GB four-year forward
auction.
In a two-sided auction, buyers also participate, as in supplementary auctions in reviewed markets.
The demand curve is made up of the system operator’s demand curve together with capacity
purchase bids from LSEs and from any capacity suppliers cleared in a previous auction for that
delivery period who wish to trade out of that commitment. It is also possible that the system
operator’s load forecast has reduced from that on which prior auctions were based, and the system
operator’s demand curve in a supplementary auction will represent a negative demand quantity at
some prices.
4.9.2. Uniform vs zonal capacity markets
All of the reviewed US capacity markets operate on a zonal basis to reflect their scale and internal
transmission constraints. Each market is separated into transmission zones, with defined inter-zonal
transmission limits. This principle is consistent with the energy markets, although the capacity zones
are typically less granular than any energy zones. Demand curves are established for each capacity
zone as well as for the total market, including recognizing differences that may exist in net CONE due
to siting and construction costs and due to different zonal energy price expectations. Auction clearing
prices will be uniform among those zones between which transmission limits are not binding, with
separate zonal prices where transmission limits constrain deliverability of otherwise competitive
resources.
The GB and Ireland markets operate on a uniform price basis, but the Ireland market will allow out-of-
merit payments in defined constrained areas not otherwise adequately served.
4.10. How will capacity providers be paid? How will capacity costs be
allocated?
4.10.1. US markets
In the reviewed US markets, there are four distinct levels of primary settlement: bilateral, two wholesale
settlements, and retail.
Charles River Associates
Page 28
Bilateral settlement takes place in all reviewed markets except ISO-NE, between LSEs and any
generators or other capacity resources with whom they have contracted in order to fulfil their
physical capacity obligations. These bilateral settlements are private commercial arrangements.
Wholesale capacity purchase settlement is, except for California, the payment by the system
operator at the zonal auction clearing price to all capacity resources cleared in auctions and
delivering capacity resources. These amounts may be subject to deficiency claw-backs and/or
performance adjustments. This settlement process would also include settlement with buyers in
two-sided capacity auctions.
Wholesale capacity cost allocation is the recovery by the system operator from LSEs and any other
wholesale market participants of net capacity costs, under the system operator’s rules or tariff.
Table 5 summarizes this process as set out more fully in the appendices.
In addition to the above primary settlement processes, LSEs and capacity suppliers (or others) may
undertake their own bilateral hedging arrangements. These could, for example, be contracts for
differences against the auction clearing prices.
Retail capacity settlement is the recovery by LSEs of their capacity costs incurred through
their ownership of capacity resources or any of the above market settlement processes. The retail
rates and tariffs of regulated LSEs are subject to state regulatory oversight, while competitive
retailers are expected to recover capacity costs through their competitive retail prices.
Table 5: Summary of Wholesale Cost Allocation Processes (US markets)
4.10.2. Great Britain and Ireland markets
Please refer to Table 6 which summarizes this process as set out more fully in the appendices.
Reviewed US Markets
PJM
ISO-NE
NYISO
MISO
Wholesale Cost Allocation Process
Assigned to zones and LSEs based on zonal coincident peak load, then passed to retail customers via
retail rates
Costs associated with capacity payments are passed on to LSEs. LSEs pass the capacity charges to
retail customers
LSEs largely self-incur capacity costs, and pass to retail customers

Charles River Associates
Page 29
Table 6: Wholesale Cost Allocation Processes (Great Britain and Ireland)
4.11. How will the capacity market impact the energy and ancillary services
markets?
4.11.1. Interaction of design
In the reviewed markets, there is no basis for comparison of “with” and “without” capacity market cases.
It is however possible to observe some consistent patterns of interaction between capacity market and
energy / ancillary services markets across those reviewed markets:
Energy and ancillary services markets continue to provide the economic incentives related to
operations and performance characteristics.
– The nature of the capacity performance obligation could theoretically influence investors
decisions on facility design (i.e. if compliance with the performance obligation would
economically require quick start capability).
– None of the reviewed markets attach explicit performance obligations (beyond the controllable
supply of energy, reduction of demand, etc. as discussed in Section 4.8 above) to qualification
as a capacity resource.23
– All reviewed markets rely on the ancillary services and energy markets to provide the incentives
to invest in facilities of the appropriate technology, such as combined cycle gas turbine (CCGT)
vs peaker plants, with the appropriate performance characteristics (e.g. start-up, min load, min
run, and ramp).
It appears that all the reviewed capacity markets have been designed to interface with pre-existing
energy markets without fundamental change.
23 Note, however, that the California resource adequacy rules do permit CAISO to require that LSEs also provide certain
levels of flexible resource adequacy within their capacity portfolios.
Great Britain & Ireland Wholesale Cost Allocation Process
Great Britain
Ireland
Retail suppliers are allocated the capacity market costs in proportion to their retail load and then
pass on to final customers
RO fees are recovered from retail suppliers on basis of their share of peak demand
Charles River Associates
Page 30
4.11.2. Interaction of outcome
There are a number of factors that could reduce energy prices below what they would otherwise have
been:
The existence of supply resources stimulated by the capacity market will obviously (and by intent)
affect the energy market supply curve24 and thus may affect the clearing price for energy relative
to that which would have prevailed if capacity shortages had been allowed to develop. The effect
will be similar in the ancillary services market.
The success of new market entrants or existing participants in clearing the capacity auctions may
affect energy market share and any relevant concentration of offer control, which could further
affect energy market outcomes.
A capacity market design based on the reliability option model adopted in Ireland could affect
energy offer behavior. The strike price for the RO obligation will likely act as a cap on capacity
resource offer prices in order that participants avoid exposure to not producing under prices in
excess of that strike price. If the strike price is set too low, this could be a distortion of otherwise
rational energy offers.
Any explicit energy offer price mitigation would tend to limit price spikes.
Expected energy market margins feed back into the calculation of net CONE by the system operator
and the equivalent calculation of required capacity price by owners and potential developers of capacity
resources, so there will be a dynamic relationship between energy and capacity prices.
4.12. Regulatory oversight
Capacity markets in all the reviewed markets are subject to regulatory oversight. In GB the government
also plays a direct role in setting the reliability standard to be met. Please refer to Table 7.
24 Depending on how they are integrated into the energy market, DR-based capacity resources may alternatively affect
the energy demand curve.

Charles River Associates
Page 31
Table 7: Summary of Government/Regulatory Oversight
4.13. Cogeneration and behind-the-meter generation
Cogeneration as a technology is not afforded any special treatment in any of the reviewed markets.
While none of the reviewed markets have BTMG of equivalent scale to that in Alberta, it is noted that
both PJM and ISO-NE recognize that demand reduction service may be provided by BTMG. In PJM it
is explicit that the BTMG must not be netted from the load for the purpose of calculating the peak
demand on which the capacity cost is allocated to that customer. In effect, this treats any DR provided
by BTMG generation as a separate resource and appears to rely on the gross load as the charge
determinant for cost allocation.
In GB the predominance of “generation-led” DSR (i.e. BTMG) in the first transitional auction led to
reconsideration of its qualification by policymakers. The UK government proposed to limit participation
in the second (and final) transitional auction to turn-down DSR only (and in effect exclude BTMG).
Stakeholders largely supported this proposal with several representations pointing to the observation
that BTMG crowded out turn-down DSR in the first transitional auction, the higher barriers and cost
Goverrnment / Regulator Functions
PJM
PJM determines quantity of capacity needed to meet 1 in 10 standard. FERC review and approval
jurisdiction over rules (including market power mitigation) and demand curve parameters. State
jurisdiction over retail competition, environmental matters, etc
ISO-NE Similar to PJM
NYISO
NY State Reliability Council determines reserve margin. NYISO determines capacity requirement
to fulfil this. Otherwise subject to FERC and state jurisdiction similar to PJM, but with greater state
impact in the single state market
MISO Similar to PJM
Great BritainGovernment (with input from the system operator) sets policy objectives including the total target
capacity requirement. Ofgem regulates the system operator
IrelandThe market is jointly operated by the two Transmission System operators for Eire and Northern
Ireland respectively, each operating under its national regulatory framework
CAISOResource adequacy requirements are determined by the California Public Utilities Commission,
working in collaboration with Investor Owned Utilitiies
Reviewed Market
Charles River Associates
Page 32
bases for turn-down DSR, the availability of existing embedded benefits25 for BTMG, and the existence
of an alternative route to market for BTMG following the introduction of an early capacity market auction
for delivery in 2017/18.
Though some representations were made in favor of not altering the eligibility requirements, or only
altering them to exclude small-scale embedded generation which exports electricity, the UK
government ultimately proceeded with their proposal. In its decision the UK government cited that
BTMG was mature enough to participate in the main capacity market auctions (notably, for delivery in
2017/18) and therefore proceeded to exclude BTMG from participating in transitional auctions.26
The second transitional auction (open only to turn-down DSR) took place in mid-March 2017 and
cleared at a significant premium to the wider capacity market auction that took place in February 2017.27
4.14. Market power and its mitigation
Market power may be exercised by buyers or sellers. Reviewed markets provide mitigation against one
or both.
Buyer market power is exercised when an LSE controls capacity offers and arranges for them to be
made below economic prices in order to suppress overall capacity price to their benefit. Mitigation is
typically in the form of specifying minimum offer prices for existing and new facilities, with existing facility
minimum offers typically being at avoidable cost net of expected market margins while new facility
minimum offers are typically based on net CONE.
The following table summarizes explicit market power mitigation measures in each of the reviewed
markets. These explicit measures are complemented in all cases by a degree of market power
mitigation implicit in the demand curve, including its price cap.
25 BTMG receive several types of ‘embedded generation benefit revenues’ from electricity suppliers primarily as a result
of their ability to help service local demand and reduce the overall cost burden on electricity suppliers. These benefits
include: avoided transmission charges, avoided system balancing charges and avoided capacity market supplier
charges.
26 UK Government Response to the March 2016 consultation on further reforms to the Capacity Market. https://www.gov.uk/gov-
ernment/uploads/system/uploads/attachment_data/file/521301/Govt_response_to_March_2016_consultation_FINAL.pdf
27 The Transitional Capacity Auction for delivery in 2017/18 concluded on 22nd March 2017 cleared at £45/kW-year and
the Early Capacity Auction for delivery in 2017/18 concluded on 3rd February 2017 cleared at £6.95/kW-year. (National
Grid Energy Market Reform Delivery Body)
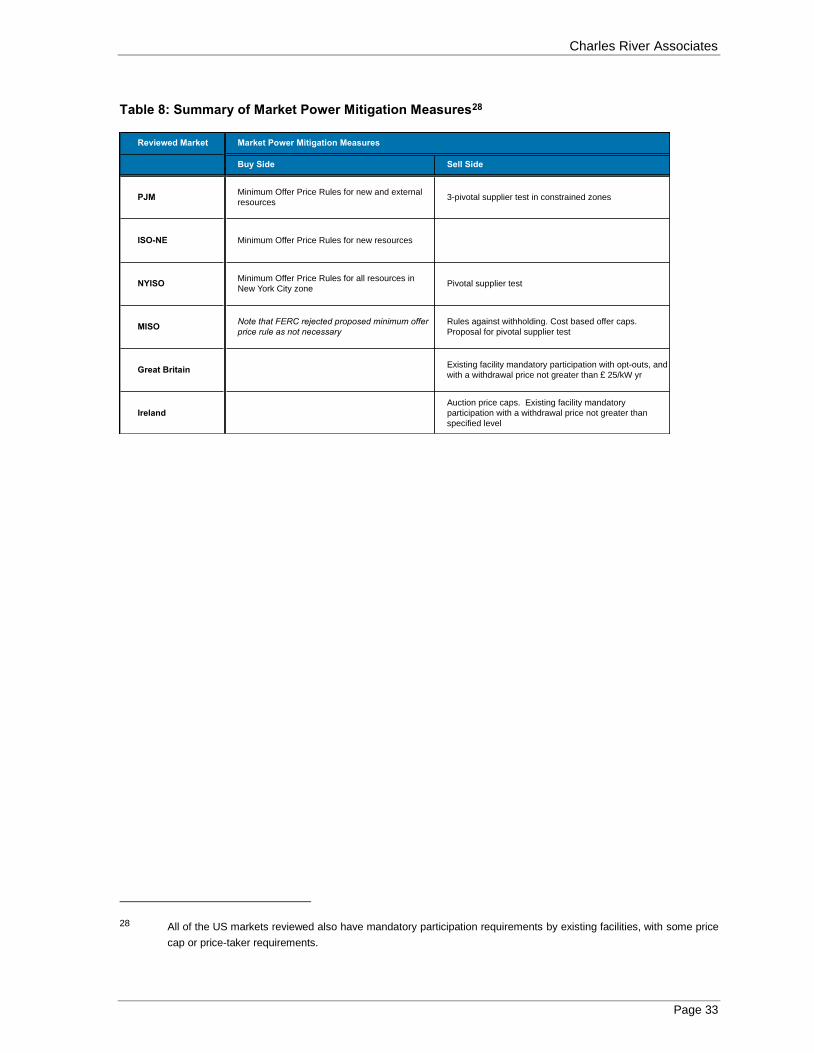
Charles River Associates
Page 33
Table 8: Summary of Market Power Mitigation Measures28
28 All of the US markets reviewed also have mandatory participation requirements by existing facilities, with some price
cap or price-taker requirements.
Reviewed Market Market Power Mitigation Measures
Buy Side Sell Side
PJMMinimum Offer Price Rules for new and external
resources3-pivotal supplier test in constrained zones
ISO-NE Minimum Offer Price Rules for new resources
NYISOMinimum Offer Price Rules for all resources in
New York City zone Pivotal supplier test
MISONote that FERC rejected proposed minimum offer
price rule as not necessary
Rules against withholding. Cost based offer caps.
Proposal for pivotal supplier test
Great BritainExisting facility mandatory participation with opt-outs, and
with a withdrawal price not greater than £ 25/kW yr
Ireland
Auction price caps. Existing facility mandatory
participation with a withdrawal price not greater than
specified level
Charles River Associates
Page 34
5. Lessons Learned and Common Practices
Capacity market designs continue to evolve. The contemporary designs have evolved considerably
compared to their initial designs and implementation, often changing to address challenges that were
unanticipated or that went unaddressed in early versions of their design. As jurisdictions have gained
experience with the performance of the contemporary designs, further fine-tuning has occurred.
Through the learning and evolution of design, some common practices in capacity market design have
emerged. This section provides a brief summary of the lessons learned and the emergence of common
design practices. Section 5.1 outlines some of the lessons learned, and the capacity market design
modifications implemented as a result of this learning. Section 5.2 describes the common practices.
5.1. Lessons learned
5.1.1. Ensuring resource adequacy at least cost
The primary objective of a capacity market is to maintain supply adequacy in the most cost effective
manner. This can be assessed in terms of the ability of the capacity market to attract and clear enough
capacity to maintain the targeted reliability requirement from year to year and to allow cost effective
entry and exit. Early designs were challenged to realize this objective for at least three reasons.29
First, the early design of capacity markets operated by ISOs required LSEs to maintain sufficient
capacity resources to meet their peak demands plus a planning reserve margin and imposed a
deficiency payment on those that did not meet their obligations. These deficiency payments acted as a
de facto price cap on capacity prices. The cap limited the capacity payments available to generators
below what was required to offset the gap between their going forward cost and the revenues earned
in the energy and ancillary service markets. All jurisdictions that operate capacity markets now establish
caps that better account for the actual cost of new entry. This cap is typically based on the gross CONE
and/or a multiple of the net CONE.
Second, the early capacity markets were effectively short-term spot markets that required delivery of
the capacity only days or months after procurement. These short-term markets limited the ability of new
potential entrants to participate in the market; it exposed them to significant risk as they would have to
commit to enter before securing a capacity price. Faced with less competition, this increased the
potential for existing generators to exercise market power. All markets, with the exception of NYISO
29 The discussion in this section draws on Paul Joskow, “Competitive Electricity Markets and Investment in New
Generating Capacity,” The New Energy Paradigm. (Dieter Helm, ed.), Oxford University Press, 2007.
Charles River Associates
Page 35
and MISO,30 have moved to longer forward periods of three to four years so as to reduce the risk for
new entrants and enable more competition. NYISO has, on different occasions, studied the benefits of
moving to a longer forward period. The studies have generally concluded that while a longer forward
period might provide benefits from the perspectives of reliability and new resource development
incentives, the move to a longer forward period was neither necessary nor warranted in consideration
of then-current market and system conditions, and the relatively successful experience with the existing
structure.31
Similarly, with the exception of NYISO and MISO, jurisdictions are now providing new generation with
a multi-year commitment period to allow them to lock into a longer price commitment upon entry. This
again reduces the risk for new generation and enables more competition in the capacity market thereby
reducing the potential for market power.
Third, early capacity mechanisms employed system wide capacity obligations that did not reflect
transmission congestion and local area reliability criteria. This led to local area capacity shortages and
reliability issues. All US markets now operate different capacity markets with separate zonal capacity
requirements and the potential for different zonal pricing to reflect transmission constraints on
deliverability.
A cursory review of the performance of the more contemporary markets to date indicates that capacity
markets have achieved their primary objective--the maintenance of supply adequacy--with only a few
exceptions, typically in localized zones.32 To illustrate, Figure 1 presents a comparison of the quantity
cleared in the auction to the targeted reliability requirement in four markets, PJM, ISO-NE, MISO and
GB.33 The time series covered for each jurisdiction in Figure 1 differs as each jurisdiction started its
current capacity market design in different years.
30 MISO applied to FERC to move to a forward market design in those zones that operate competitive retail markets.
FERC rejected MISO’s proposal although the reason for the rejections focused on concerns over the potential
interactions between the two parallel capacity markets systems and a lack of positive support for this proposal. That
MISO was looking to move to a forward capacity market provides a recognition of the preference for forward capacity
market designs over short-term spot market designs.
31 P. Hibbard, T. Schatzki, C. Aubuchon, C. Wu. ”NYISO Capacity Market: Evaluation of Options,” Analysis Group,
2015. Available at http://www.analysisgroup.com/uploadedfiles/content/insights/publishing/nyiso_capacity_mar-
ket_evaluation_of_options.pdf (and citations of earlier studies within).
32 Spees, Newell, Pfeifenberger, “Capacity Markets: Lessons Learned from the First Decade,” Economics of Energy &
Environmental Policy. Vol. 2, No. 2 September 2013, page 14. Short-falls are typically resolved in the supplementary
auctions.
33 We do not present data on Ireland as it has yet to run its market, nor do we present data on NYISO as it operates
monthly markets which is a different time scale from the annual auctions of the other markets.

Charles River Associates
Page 36
Since its inception, PJM has been able to attract sufficient capacity to maintain its reserve requirement.
As discussed further below, this has occurred in the face of considerable coal retirements due to the
implementation of more stringent environmental requirements.
Figure 1: Cleared Capacity as a Percentage of Target Capacity
In ISO-NE, the system was long for the first seven auctions. However, the eighth auction cleared short
of the capacity requirement. The external market monitor indicated that the shortage was caused when
the ISO invoked a market power price mitigation measure called the “insufficient competition” rule which
capped the price paid to existing resources at an administratively determined amount. The rule is
triggered when existing resources are insufficient to clear the market and hence offers from new entry
is required. The insufficient competition rule caused 278 MW of existing resources to de-list and the
ISO ultimately procured 153 MW less than its system-wide requirement.34
Additionally, until the eighth auction, ISO-NE used a vertical demand curve in the auction which may
have suppressed the signal for the need for new capacity in the previous years when the system was
34 Potomac Economics (June 2015), “2014 Assessment of the ISO New England Electricity Markets,” page 43. Available
at https://www.iso-ne.com/static-assets/documents/2015/06/isone_2014_emm_report_6_16_2015_final.pdf.
90%
95%
100%
105%
110%
115%
120%
Delivery Year
PJM ISO-NE MISO GB
Sources: SNL, Potomac Economics, MISO, PJM, ISO-NE, and National Grid Electricity Market Reform

Charles River Associates
Page 37
long. They implemented a downward sloping demand curve to replace the vertical demand curve in the
ninth auction conducted in February 2015 for the 2018/19 delivery period.35
The introduction of the downward sloping demand curve also reduces the risk of market power that the
insufficient competition rule is intended to protect against. For this reason, ISO-NE is discontinuing the
use of the rule.
In terms of the ability of capacity markets to induce cost-effective entry and exit the conclusions are
mixed. There are existing studies that have considered and evaluated capacity markets success in this
regard.
The American Public Power Association (APPA) has produced studies that conclude that capacity
markets have not incented investment in new generation facilities.36 These studies examine data of
new generation capacity that was completed and began operating in the US in 2013 and 2014, and the
financial arrangements behind the capacity. The authors conclude that almost all new capacity was
constructed under either a long-term contract (66% in 2013 and 52.1% in 2014) or utility or customer
ownership (31.6% in 2013 and 43.1% in 2014). By comparison, only 2.4% and 4.8% of the new capacity
built was built for sale into a market.37
Furthermore, the papers argue that only a small percentage of all capacity was built in markets with
mandatory capacity markets (6% in 2013 and 14% in 2014), even though these markets represent
almost a quarter of the MWhs of energy consumed in the US.
A recent study conducted by the Independent Market Monitor (IMM) of PJM challenges the APPA
findings as they relate to PJM.38 The report presents analysis of new generation capacity in the PJM
capacity market from the period of its inception in 2007/2008 through the 2018/2019 auction. The IMM
argues that the APPA reports erroneously consider all long-term contracts as being non-market based
power purchase agreements and hence overstate the percentage of non-market based and funded
investments. The IMM report concludes that over the period reviewed, 59.5% of the new investment
35 ISO New England (May 2016), “ISO New England’s Internal Market Monitor 2015 Annual Markets Report,” page 24.
Available at https://www.iso-ne.com/static-assets/documents/2016/05/2015_imm_amr_final_5_25_2016.pdf.
36 APPA (October 2014) “Power Plants are Not Built on Spec, 2014 Update.” Available at
http://www.publicpower.org/files/PDFs/Power_Plants_Not_Built_on_Spec_2014.pdf. and APPA (December 2015),
“Capacity Markets Do NOT Incent New Electric Generation.” Available at http://appanet.files.cms
plus.com/PDFs/94%202015%20Power%20Plant%20Study%20Update%20Final.pdf.
37 Ibid.
38 Monitoring Analytics (May 4, 2016) “New Generation in the PJM Capacity Market: MW and Funding Sources for
Delivery Years 2007/2008 through 2018/2019,” The Independent Market Monitor for PJM. Available at http://www.mon-
itoringanalytics.com/reports/Reports/2016/New_Generation_in_the_PJM_Capacity_Market_20160504.pdf.
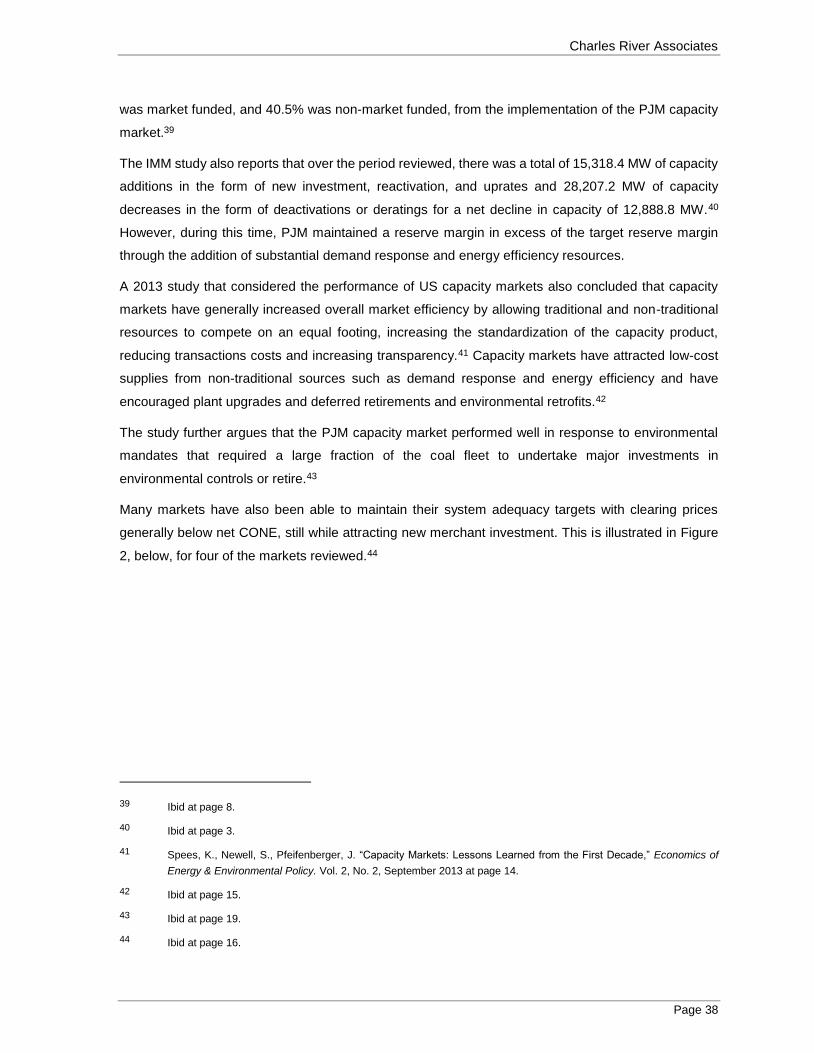
Charles River Associates
Page 38
was market funded, and 40.5% was non-market funded, from the implementation of the PJM capacity
market.39
The IMM study also reports that over the period reviewed, there was a total of 15,318.4 MW of capacity
additions in the form of new investment, reactivation, and uprates and 28,207.2 MW of capacity
decreases in the form of deactivations or deratings for a net decline in capacity of 12,888.8 MW.40
However, during this time, PJM maintained a reserve margin in excess of the target reserve margin
through the addition of substantial demand response and energy efficiency resources.
A 2013 study that considered the performance of US capacity markets also concluded that capacity
markets have generally increased overall market efficiency by allowing traditional and non-traditional
resources to compete on an equal footing, increasing the standardization of the capacity product,
reducing transactions costs and increasing transparency.41 Capacity markets have attracted low-cost
supplies from non-traditional sources such as demand response and energy efficiency and have
encouraged plant upgrades and deferred retirements and environmental retrofits.42
The study further argues that the PJM capacity market performed well in response to environmental
mandates that required a large fraction of the coal fleet to undertake major investments in
environmental controls or retire.43
Many markets have also been able to maintain their system adequacy targets with clearing prices
generally below net CONE, still while attracting new merchant investment. This is illustrated in Figure
2, below, for four of the markets reviewed.44
39 Ibid at page 8.
40 Ibid at page 3.
41 Spees, K., Newell, S., Pfeifenberger, J. “Capacity Markets: Lessons Learned from the First Decade,” Economics of
Energy & Environmental Policy. Vol. 2, No. 2, September 2013 at page 14.
42 Ibid at page 15.
43 Ibid at page 19.
44 Ibid at page 16.
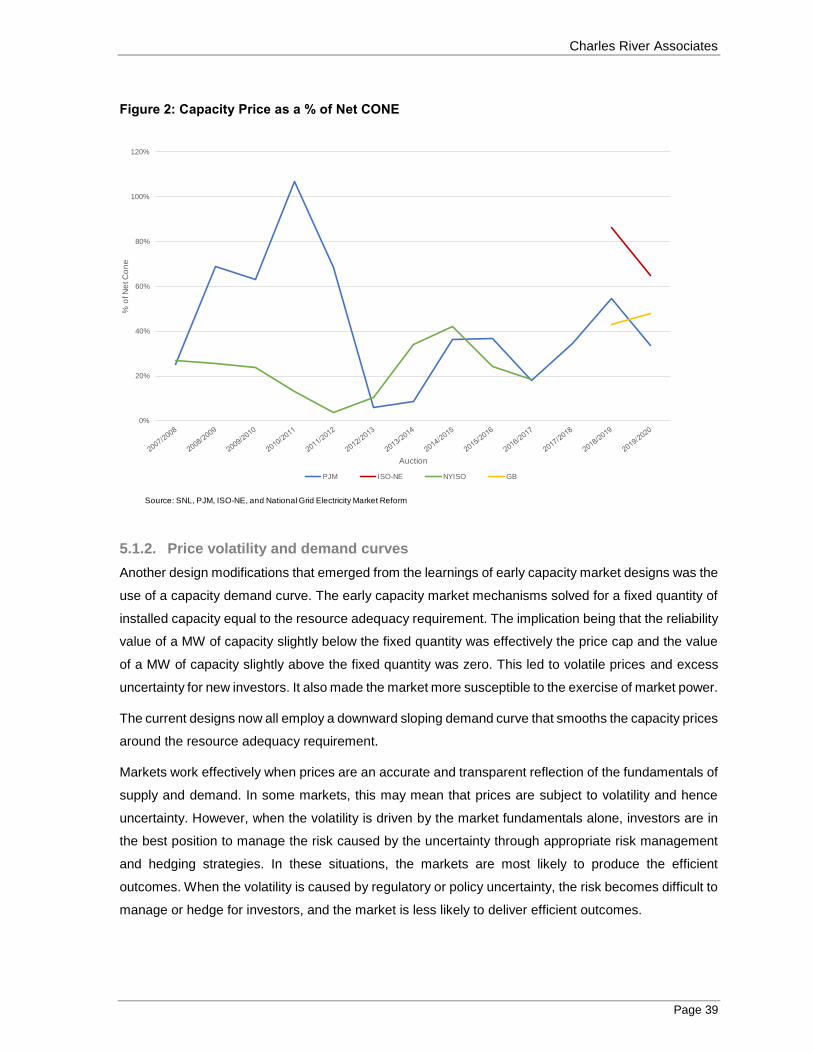
Charles River Associates
Page 39
Figure 2: Capacity Price as a % of Net CONE
5.1.2. Price volatility and demand curves
Another design modifications that emerged from the learnings of early capacity market designs was the
use of a capacity demand curve. The early capacity market mechanisms solved for a fixed quantity of
installed capacity equal to the resource adequacy requirement. The implication being that the reliability
value of a MW of capacity slightly below the fixed quantity was effectively the price cap and the value
of a MW of capacity slightly above the fixed quantity was zero. This led to volatile prices and excess
uncertainty for new investors. It also made the market more susceptible to the exercise of market power.
The current designs now all employ a downward sloping demand curve that smooths the capacity prices
around the resource adequacy requirement.
Markets work effectively when prices are an accurate and transparent reflection of the fundamentals of
supply and demand. In some markets, this may mean that prices are subject to volatility and hence
uncertainty. However, when the volatility is driven by the market fundamentals alone, investors are in
the best position to manage the risk caused by the uncertainty through appropriate risk management
and hedging strategies. In these situations, the markets are most likely to produce the efficient
outcomes. When the volatility is caused by regulatory or policy uncertainty, the risk becomes difficult to
manage or hedge for investors, and the market is less likely to deliver efficient outcomes.
0%
20%
40%
60%
80%
100%
120%
% o
f N
et C
on
e
Auction
PJM ISO-NE NYISO GB
Source: SNL, PJM, ISO-NE, and National Grid Electricity Market Reform

Charles River Associates
Page 40
A recent study commissioned by the ISO/RTO Council supports this view. The study finds that above
all factors, investment decisions are driven by energy revenues and the belief that energy demand will
grow or that supply will decrease with plant retirements due to age or environmental regulations.45 In
jurisdictions that operate capacity markets, investors have expressed their support of capacity markets
as they provide a backstop to energy revenues and greater certainty of future cash flows.46 However,
investors have raised concern regarding the volatility of capacity market prices, and hence revenues,
and the uncertainty that this creates. The study notes that capacity market price volatility has caused
many financial institutions to heavily discount capacity revenues when considering financing new
investment projects. By comparison, balance sheet-backed investors were less inclined to discount
capacity revenues as they felt they were better capable of modeling these revenues.
Capacity market prices may exhibit volatility, even when based on supply and demand fundamentals.
This is due to the relative steepness (inelasticity) of the capacity supply curves and the lumpiness of
investments. Most of the existing generation facilities have relatively low going forward avoidable costs
and will offer at a low price in the capacity market. New generation has higher going forward avoidable
costs and offer at a higher price. The large difference in offer prices can lead to a near vertical supply
curve between the offers of existing and new generation.
The steepness or inelasticity of the capacity supply curve can depend on the length of the forward
period. In markets such as NYSO and MISO,47 where the forward period is quite short, suppliers must
commit to either exit or enter the market long before the auction clears. Once fully committed, they
either offer low (committed and hence low going forward avoidable cost) or not at all (not committed
and hence not able to qualify to offer). In contrast, in markets such as PJM, ISO-NE, and GB, the
suppliers can offer capacity in advance of making a commitment to exit or enter and hence can offer at
their expected avoided cost which provides more competition and more elasticity to the supply curve.
The steepness of the capacity supply curve can also be attenuated by allowing broader participation in
the market by demand response resources and imports as these resources can enter or exit more
easily.
The shape of the demand curve can also affect the level of price volatility. The choice of an extremely
flat demand curve can lead to very little price volatility, but could inefficiently dampen the effects of the
45 A recent report commissioned for the IRC ISO/RTO Council concluded that the key driver of investment in any mar-ket is strong supply and demand fundamentals. Page 18, http://www.isorto.org/Documents/Report/201505_IRCRe-sourceInvestmentReport.pdf .
46 Ibid. It should be noted that the investment risks of price volatility in an energy-only market may be more acute than
the investment risk from capacity price volatility, which speaks to the noted support of investors interviewed in this
study.
47 MISO did not receive approval for, or implement, longer forward periods proposed for competitive retail zones.

Charles River Associates
Page 41
supply-side fundamentals, causing too strong a price signal during times of capacity surplus and a
dampened signal during times of shortage. In contrast, experience has shown that a perfectly inelastic
demand curve can lead to excessive volatility when combined with a steep supply curve.
Price volatility caused by changes in the auction parameters such as CONE, net CONE and load
forecasts exacerbate risk for investors as these risks cannot be as easily predicted or hedged. For this
reason, it is important to have transparency and consistency in the methodologies used to establish
these parameters.
Price volatility caused by political intervention in the market, a lack of concerted policy action, or
perpetual tweaking of market rules can be of great concern to investors as these risks cannot be hedged
or managed.48
Figure 3 plots the clearing prices in the different jurisdictions and for select zones within jurisdictions
that operate zonal capacity markets.
Figure 3: Capacity Prices ($/kW-year)
48 Ibid at page 26.
$0
$20
$40
$60
$80
$100
$120
$140
$160
$180
$200
$/k
W -
ye
ar
Delivery Year
COMED (PJM) PJM RTO (PJM) NEMA-Boston (ISO-NE) ISO-NE NYC (NYISO)
NYCA (NYISO) MISO Z7 (MISO) MISO Z4 (MISO) Great Britain

Charles River Associates
Page 42
5.1.3. Capacity product delivery
Capacity product delivery is another area where lessons have worked to evolve the design. Capacity
product delivery relates to the availability of the committed capacity resources to perform when called
upon during periods of shortage or scarcity. Committed capacity, after all, has limited value if resources
with capacity commitments cannot or will not perform during periods of system stress. Accordingly,
most capacity constructs are developed with requirements associated with availability and market offers
during peak periods.
They may also incorporate systems of penalties and rewards associated with performing during times
of highest need. An effective system will not only seek to promote good behavior during such times –
encouraging availability and efficient market offers – but will also incent resources to make efficient
capital investments and business decisions to ensure that they are able to operate reliably when
needed most. Such measures might include upgrades to increase reliability and decrease unscheduled
outages, improved forward planning and coordination to avoid planned outages during likely
performance assessment periods, and fuel arrangements to ensure supplies are available even during
disruptive events.
The early mechanisms of capacity product delivery did not tie capacity payments to the actual
performance to be available during capacity shortages. Instead they relied on the prospects of high
energy prices to incent generators to be available and provide energy. However, for the reasons
described above, these prices often did not rise high or often enough to incent the desired performance.
With the exception of Ireland, all current reviewed market designs employ a must-offer requirement in
the energy or ancillary services markets and impose penalties on generators that do not make
themselves available. PJM and ISO-NE have recently implemented new performance incentives that
penalize poor performers and reward exceptional performers to drive further availability performance.
Two jurisdictions that have focused on the issue of the performance of capacity resources are PJM and
ISO-NE. This issue came to a head during the polar vortex events of the winter of 2013/2014. Unusually
cold weather conditions caused both high electric demand, plant outages due to hardware failures, and
fuel supply shortages caused by both heating demand, coal pile freezing and pipeline delivery issues.
In ISO-NE, during the most severe period, of 31,700 MW of resource with Capacity Supply Obligations,
just less than 24,000 MW were available. At this time, the ISO was able to serve load plus maintain a
reserve margin with only 44 MW to spare.49 Had one resource gone offline at that time, the system
would have become severely short of reserves. Over the same days, PJM had as much as 29% of its
49 ISO New England (2014), “January 2014 FECR Data Request,” page 9. Available at https://www.iso-ne.com/static-
assets/documents/pubs/spcl_rpts/2014/iso_ne_response_ferc_data_request_january_2014.pdf.

Charles River Associates
Page 43
generation unavailable due to outages or derates caused by either weather or fuel supply issues.50
These circumstances were viewed in part as a failure of the capacity market rules to provide appropriate
signals to capacity resource to be available when needed most.
Both PJM and ISO-NE responded with strategic initiatives to revise their market rules to ensure that
capacity resources were not only paid for maintaining assets, but for ensuring that those assets were
available to the system when they were most needed. In PJM, the resulting rules were called “Capacity
Performance” and in ISO-NE they were called “Pay-for-Performance.” While they vary somewhat in
their execution, they rely on similar principles that have been agreed to by FERC, which include:
Establishment of performance assessment periods, which occur infrequently and are based on
system conditions
Substantial penalties for non-performance that count against capacity revenues
Opportunities for bonus payments for over-performance that can augment capacity revenues
Penalty pool is used to pay bonuses
Limited excuses for non-performance
The constructs in both PJM and ISO-NE are relatively new. Due to mild weather conditions and
generally good system performance, neither has yet been tested. Accordingly, empirical measures of
success of the new rules are not yet available. One point of reference, however, is statements made
by PJM in the proceeding in which Capacity Performance was approved. PJM stated that, based on
historical data, hours that might have met the criteria of performance incentive periods would have had
a balancing ratio of approximately 85%.51 This was expected to rise to closer to 93% with the program
implementation. In ISO-NE, historical performance during periods of system scarcity have been closer
to 70%.52 Though CRA is not aware of any projections of how that will change under the Pay-for-
Performance rules, if they are successful at accomplishing their goals future periods of system strain
will see markedly improved performance.
5.1.4. Appropriate treatment of demand response
Concern over resource performance in capacity markets has been particularly acute as it relates to DR
resources. Two questions have been particularly relevant in US RTO markets:
50 FERC (April 2014), “Winter 2013-2014 Operations and Market Performance in RTOs and ISOs,” page 8. Available at
https://www.ferc.gov/legal/staff-reports/2014/04-01-14.pdf.
51 Balancing ratio is a measure of unit availability roughly equal to the quotient of total resource performance divided by
the total committed capacity on the system.
52 Based on ISO-NE data during periods during which Reserve Constraint Penalty Factors were activated.

Charles River Associates
Page 44
1. What constitutes a reasonable set of performance expectations for DR resources?
2. What should be the requirements incumbent upon DR resources to ensure that capacity market
offers are based on actual capability and are not speculative in nature?
The first discussion, related to performance expectations, involves recognizing both the need to procure
dependable (and comparable) capacity resources while recognizing that DR resources often have
inherent limitations. On the one hand, capacity markets that clear one product at a single clearing price
should ensure that all resources that receive market revenues are capable of providing the same, or at
least a very similar, service. On the other hand, while DR is likely part of a cost-effective capacity
portfolio, DR resources are often incapable of performing the same tasks as a generator. For example,
assets that provide curtailment services may be limited by time of day, season, duration of interruption,
and frequency of interruption. Bearing these considerations, market rules should strive to ensure that
DR can feasibly qualify to participate in capacity markets, while also being sufficiently strict to guard
against concerns that DR resources are being provided an equivalent payment to provide an inferior
service. PJM, for instance, has seen an evolution in its expectations for DR capacity resources or as
non-participants to reduce peak demands in order to reduce capacity cost allocation. In the years prior
to the capacity performance rules, defined quantities of DR resources could offer different levels of
availability, different interruption frequency and duration requirements, and a range of hours of the day
during which curtailment could be requested. To create a more uniform and high-performing resources
on par with generators, capacity performance rules have only one category of capacity DR that must
be available all year, for an unlimited number and duration of interruptions, and across a broad number
of hours during the day.53
The second issue, over the legitimacy of DR offers into forward auctions, concerns the dependability of
capacity offers and the nature of the capacity market as a non-speculative physical market. This is
particularly relevant in capacity constructs with longer forward periods. For example, in PJM, the base
residual auction often clears at higher prices than the annual, incremental auctions. DR resources have
been accused of placing speculative bids into the three-year-forward capacity auctions and then, if
prices haven’t risen high enough to attract customers, buying out of their positions in the incremental
auctions.
Complainants have argued that such bids are inappropriate in the capacity market, which is a tool to
maintain reliability and therefore not an appropriate forum for financial speculation. To address these
issues, the RTO has implemented additional information requirements for DR offers, requiring detailed
53 The discussion about the proper treatment of capacity DR in PJM nonetheless continues. The most recent proposal,
which has yet to be approved by FERC, would allow seasonal resources to offer into RPM and then be aggregated by
the system operator to create a product that is equivalent to a single resource that could operate all year.

Charles River Associates
Page 45
information about business plans and the subscribed or prospective customers. These showings are
intended to ensure that any DR offered into capacity markets represents a real, dependable resource
that will contribute to system reliability in the delivery year.
Another variable when discussing DR participation in capacity markets is whether curtailable demand
should be considered on the supply or demand side of the equation. Generally, the discussion of DR
performance presumes the treatment of DR as a supply resource. In jurisdictions like the US, this is a
fair working assumption because most end-use customers are not exposed to wholesale rates, like
capacity cost, nor are they directly responsible for procuring sufficient capacity to serve their demand.
Therefore, there is no mechanism for them to express their willingness-to-pay for capacity nor the level
above which they would opt not to pay. However, in alternative constructs, there could be an opportunity
to have demand participate more meaningfully in capacity markets on the demand side. Such
circumstances would require a jurisdiction with a flexible demand curve formulation and sophisticated
capacity purchasers able to calculate a price at which it is cost-effective to purchase capacity and
possessing an alternative means of reducing their capacity needs or procuring alternative sources of
supply. PJM’s price responsive demand (PRD) program represents an attempt to achieve this objective.
5.2. Common capacity market design practices
This section draws on the discussion of Section 4 and Section 5.1 to summarize the commonly
accepted practices in capacity market design.
A general observation gleaned from the reviewed markets is that capacity markets have been designed
to operate in the context of pre-existing institutions and regulatory frameworks, and to interact with pre-
existing energy and ancillary services markets to achieve the overarching goal of resource adequacy
expectation. There are some generally applicable common practices, but for many features of capacity
market design, the selection of a practice is situational.
A second observation from the review is that jurisdictions are continuously fine-tuning or tweaking their
designs as each learns from its actual performance and as external drivers may develop. There is thus
an ongoing tension between the need for market design stability to mitigate perceived investor risk and
the need for market design evolution to respond to lessons learned and changes. For those reviewed
markets with actual performance history, there is no evidence that this tension has been fatal to the
operation of the market. In other words, this tension can be resolved.
Our review of the selected jurisdictions has identified the following commonly accepted practices:

Charles River Associates
Page 46
Supply adequacy is based on loss of load.
The supply adequacy standard in all jurisdictions is based on a LOLE that is either approved or
endorsed by government or a relevant regulator. The system operator then converts that standard
into a targeted capacity amount that is used for auction-based procurement.
Supply obligation placed on LSEs with centralized auctions administered by the system
operator.
The obligation to procure capacity varies across jurisdictions and is largely influenced by the pre-
existing institutions, government policies and regulatory frameworks. Many jurisdictions place the
obligation on pre-existing load-serving entities to secure capacity to satisfy their share of the supply
adequacy requirement. In all the capacity market jurisdictions (i.e. excluding CAISO) reviewed
however, the system operator runs a centralized auction to procure at least a portion of the system’s
capacity obligations and allocates the cost of this procurement across LSEs or customers. These
markets have adopted annual auction cycles with longer primary auction forward periods and
longer new generation commitment periods than other markets. This practice is designed to avoid
what might otherwise be considered excessive risk associated with new generation investment.
Downward sloping demand curves reflective of net CONE.
All jurisdictions use a downward sloping demand curve for procuring capacity in the auction
process. The demand curve is derived using the target capacity amount determined by the system
operator and from estimates of the cost of new entry of a benchmark generation facility. The
downward sloping demand curve reduces excess volatility and uncertainty for new investors and
mitigates market power. Demand curves generally reflect, in some way, the system operators
estimated net CONE.
Lengthier forward periods are in place to mitigate risk for new generation investment.
Most jurisdictions are electing to use forward capacity markets that procure capacity three to four
years in advance. This is designed to avoid what might otherwise be considered excessive risk
associated with new generation investments. It also increases the degree of competition in the
capacity market.
Jurisdictions with longer forward periods typically also have rebalancing auctions.
Jurisdictions that use longer forward periods also typically run supplementary or rebalancing
auctions after the base auction and leading up to the start of the commitment period. These
auctions are used to adjust the capacity commitment to the changing supply and demand
conditions. They allow adjustments to correct for demand forecast errors. Some allow sellers to
trade in and out of their base capacity auction obligations where it is economical to do so.

Charles River Associates
Page 47
Single-year commitment periods.
Most jurisdictions operate capacity markets annually with a common one-year commitment period
on the capacity providers. A common practice is to offer new generation a longer commitment
period (three years in PJM and 15 years in GB, for example).
Technological neutrality.
All jurisdictions strive for technological neutrality by permitting conventional resources and
unconventional resources such as variable generation, demand response, and, in some cases,
energy efficiency and imports. Promoting technological neutrality requires the capacity product to
be defined carefully so that a MW from each resource represents an equivalent reliability value.
This requires careful treatment of demand response resources and energy efficiency resources.
The standards to this treatment are still evolving.
Cleared resources must-offer into the energy or ancillary services market.
All jurisdictions but for Ireland place a must-offer into the energy or ancillary service markets
obligation on those resources that clear the capacity market. The purpose of the must-offer
obligation is to ensure that the energy or ancillary services from the committed capacity are
physically available when most needed. The must-offer obligation is generally implemented within
the pre-existing day-ahead markets or, in the case of GB, through a four-hour advance warning.
The Ireland capacity market design is characterized as a reliability option and relies on financial
incentives rather than physical obligations to support the availability of energy or ancillary services
when needed. This type of reliability option approach is yet untested.
Locational capacity markets which recognize transmission constraints.
All reviewed US jurisdictions operate capacity markets in which the capacity price can vary between
zones; this reflects the locational pricing structure of their energy markets. The zonal capacity
markets recognize transmission constraints that may limit the ability of energy to be delivered
between zones under stress conditions. GB and Ireland operate uniform capacity markets
consistent with their energy markets, although Ireland recognizes deliverability limitations on
procuring capacity and makes out-of-merit payments to attract the required capacity in the
constrained zones.
All capacity commitments are settled at the auction clearing price.
The standard practice is that all capacity commitments arising from auction processes are settled
at the auction clearing prices following delivery of the capacity service and subject to any
compliance-related or performance-related adjustments. To the extent that parties undertake
bilateral contracts in support of ISO approved self-supply arrangements, the respective settlements
among those parties are privately negotiated.

Charles River Associates
Page 48
Regulatory oversight is in place.
All reviewed markets exhibited a degree of government or regulatory involvement in setting the
adequacy standard and the demand curve, and providing regulatory oversight of the capacity
market rules and processes.
Market power mitigation measures are in place.
All reviewed markets incorporate measures for market power mitigation, although the specifics vary
among the markets according to their structure and concerns.

Charles River Associates
Page 49
6. Key Characteristics of Alberta and Considerations for Capacity
Market Design
This section discusses key characteristics of the Alberta marketplace that may influence the choice of
certain capacity market design elements. These market characteristics include: market scale,
concentration, financing arrangements, interconnection capability, load and supply shape, natural gas
and fuel-specific issues, the role of industrial cogeneration facilities, planned coal phase-out, large-
scale renewable procurement; wholesale energy market design, transmission policy, market
institutions, and retail structure. Each of these characteristics is addressed in successive sections below
followed by a brief discussion on capacity market design considerations.
6.1. Market scale, market concentration and financing new investment
The Alberta electricity market is unique in that it is relatively small scale compared to the other
jurisdictions reviewed (except for Ireland). For example, total annual demand in Alberta was 80TWh in
2016 as compared to average total load of 337 TWh in 2015 across all other jurisdictions reviewed.54
On an hourly basis, Alberta’s internal load averaged 9,162 MW in 2015, with a maximum of 11,229
MW.55
The market is also relatively concentrated, which may be a product of the scale of the market. According
to the Market Surveillance Administrator’s most recent assessment of offer control, five firms control
the output of 66.7% of the province’s generation capability.56 The oligopolistic framework of the energy
market has enabled generators, each acting unilaterally, to exercise market power in times of near-
shortage. This practice has, until recent years, maintained energy price expectations at levels sufficient
to support new generation investment. The capacity market is intended to provide a different means for
the support of needed new investment. Market concentration and individual market power are potential
hindrances to the efficiency of the proposed new framework.
Furthermore, most investment to date has largely been by incumbent suppliers, and balance sheet
financing has been the predominant means of funding new investment.57
54 See Table 1: Market Statistics
55 AESO 2015 Annual Market Statistics.
56 Market Surveillance Administrator. Market Share Offer Control 2016. Concentration of market share in the energy
should tend to increase on the 2020 term date of the present Power Purchase Arrangements, irrespective of any
impacts from earlier abrogation.
57 Market Surveillance Administration (2012), “State of the Market 2012 Alberta Wholesale Electricity Market.” Available at https://albertamsa.ca/uploads/pdf/Archive/0-2013/State_of_the_Market_ESC_130405FINAL.pdf.

Charles River Associates
Page 50
Capacity Market Design Considerations:
Addressing the level of concentration may be a factor considered in the design of the capacity market.
The length of the forward period and the use of mutli-period commitments for new generation are both
a means of promoting new market entry by a diverse set of participants. As discussed in Section 5, it
is common practice to choose longer forward periods and to offer multi-year commitment to new
investment. Longer forward periods and multi-period commitments avoid what might otherwise be
considered excessive risk associated with new generation investment. They can also increase the
degree of competition in the capacity market. Furthermore, longer forward periods and multi-year
commitment periods are more likely to attract a diverse set of participants with varied financing
arrangements.
6.2. Interconnections
The Alberta grid has AC interconnections to WECC jurisdictions in Montana and in BC, with potential
for wheeling. The nominal capacity of these interties58 is frequently limited by a joint restraint, resulting
in average 2015 combined ATC of 688 MW import and 650 MW export, with joint maxima of 950 import
and 935 export.59 Net imports over these paths averaged 55 MW in 2015, even at the low electricity
prices then prevailing in Alberta.
The DC (and therefore controllable) intertie with Saskatchewan shows maximum import/export ATC
and nominal capacity of 153 MW, with the average in 2015 of 124 MW import and 122 MW export.
Alberta was a small net exporter to Saskatchewan in 2014 and 2015, having been an importer in
previous years.
The northern BC town of Fort Nelson is served by a radial connection from the Alberta transmission
system, but is not interconnected with the BC grid. It averages a mere 2 MW supply from Alberta, but
this can rise to 28 MW of its 33 MW total load.
58 Aggregate nominal combined intertie capacity of some 1,480 MW import and 1,300 MW import.
59 This and most other statistics in this section are drawn from AESO 2015 Annual Market Statistics.

Charles River Associates
Page 51
Capacity Market Design Considerations:
Both the WECC interconnection and the Saskatchewan interconnection contribute to the efficiency of
the Alberta energy market, and may offer additional efficiencies as a source of external capacity to
serve the Alberta market. Including imports in the capacity market is common amongst the reviewed
markets. Qualification of any external source as importable capacity would require firm commitments
and operating protocols supported by agreements between the AESO and the relevant system and
transmission operators. It may take some time to develop such arrangements to the point where po-
tential participants can qualify external capacity resources for capacity market participation.
Additionally, to the extent that there is interest from neighbouring jurisdictions to procure capacity from
Alberta-based resources, it may be worth considering rules for allowing firm energy exports from
capacity sold externally.
Finally, the radial connection with Fort Nelson may raise issues in the detail of the capacity market
design, particularly related to the obligation to serve the load in the area and to the associated capacity
cost allocation to this load.
6.3. Load shape and supply shape
The Alberta internal load is characterized by a number of features:
The high proportion of industrial load60 results in a relatively flat load shape, both seasonal and
intraday. The annual load factor for Alberta internal load was 82% in 2015. Please refer to Figure
4, in which the hourly load pattern has been averaged over all of the approximately 91 days for
each quarter of 2015. Consistent with the high load factor, the pattern is very flat within each day
and shows small variation from season to season compared with most markets.
Winter peaks are historically higher than summer peaks, by 5% or more. Winter peaks have
continued to grow slightly faster than summer peaks (2.3% vs 2.0% over the past 12 years).
The supply side is characterized by the following features:
The coal plants have relatively flat capability, whereas the gas turbine fleet (cogen, CCGT and
peaker) will show significant temperature sensitivity and negative correlation with summer-peaking
load.
Hydroelectric generation shows highest production in the spring and early summer (May to July)
when snowmelt peaks. Its storage capacity may be sufficient to enable it to realize its full capacity
60 In 2015, based on AESO 2015 Market Statistics and the AESO retail market statistics, industrial energy consumption
including self-retail represents some 77% of the Alberta Internal Load or 70% of total system load.

Charles River Associates
Page 52
contribution at other times. Figure 5 shows the average hourly pattern within each day for each
quarter.61
Wind production is highest in the winter season when there is little intraday variation. Summer
production is less than half of winter production, with the highest average production occurring
overnight. Please refer to Figure 6, but recognize that the average is far from representative of
variability between days or within any actual day.
The seasonal and intraday pattern of solar should result in somewhat positive correlation with
summer-peaking load. Please refer to Figure 7.
Figure 4: Alberta Internal Load Quarterly Intra-day Pattern, 2015
Source: Analysis based on: https://www.aeso.ca/download/listedfiles/Hourly-Load-Data-for-Years-2005-to-2015.pdf.
Accessed through: https://www.aeso.ca/market/market-and-system-reporting/data-requests/
61 Note that the “quarters” are defined differently for the load chart and the generation charts, as indicated in the key to
each chart, in each instance to select the set of months over which patterns are most consistent.
0
2000
4000
6000
8000
10000
12000
1 2 3 4 5 6 7 8 9 10 11 12 13 14 15 16 17 18 19 20 21 22 23 24
MW
Hour endingDec-Feb Mar-May Jun-Aug Sep-Nov

Charles River Associates
Page 53
Figure 5: Hydro Generation Quarterly Intra-day Pattern, 2015
Source: AESO actual hourly production data for 2015
0
50
100
150
200
250
300
350
1 2 3 4 5 6 7 8 9 10 11 12 13 14 15 16 17 18 19 20 21 22 23 24
MW
Hour ending
Nov-Jan Feb-Apr May-Jul Aug-Oct

Charles River Associates
Page 54
Figure 6: Wind Generation Quarterly Intra-day Pattern, 2015
Source: AESO actual hourly production data for 2015
0
100
200
300
400
500
600
700
1 2 3 4 5 6 7 8 9 10 11 12 13 14 15 16 17 18 19 20 21 22 23 24
MW
Hour endingNov-Jan Feb-Apr May-Jul Aug-Oct
Charles River Associates
Page 55
Figure 7: Solar Generation Quarterly Intra-day pattern, 2015
Source: AESO expected hourly production data for 2015
As the generation fleet converts from a coal to gas turbine base, the summer capacity could become
increasingly critical. For some period of time, the winter and summer conditions may become critical,
but at different MW capacity requirements.62
Capacity Market Design Considerations:
Alberta is a winter peaking jurisdiction, but places considerable importance on gas units to meet both
winter and summer peak demands. The gas units show significant temperature sensitivity and negative
correlation with summer-peaking demand. This may merit a capacity market design that uses different
seasonal capacity requirements and recognizes different seasonal capabilities.
With the exception of GB, it is common practice to allow variable generation to participate in the capacity
market. Both solar and wind generation contribute to reducing system loss-of-load probability and,
therefore, serve the reliability objective of a capacity market by reducing the need for other forms of
62 While summer peak loads are lower than winter peak, the summer capability of CCGTs and gas turbine peakers is
lower in summer, and the wind supply is lower in summer.
0
0.1
0.2
0.3
0.4
0.5
0.6
0.7
1 2 3 4 5 6 7 8 9 10 11 12 13 14 15 16 17 18 19 20 21 22 23 24
MW
Hour ending
Nov-Jan Feb-Apr May-Jul Aug-Oct

Charles River Associates
Page 56
capacity. Their contribution is typically only a relatively small percentage of their installed capacity. The
actual percentage will depend on season, on production patterns at each location, and on geographical
diversity of the (i.e. wind) resource. As is the case in other jurisdictions, protocols would need to be
established to determine such percentage allowances, including for any locational variation of such
percentages. If variable generation resources are included in the capacity market, careful consideration
of the interaction between the renewable energy program contracts and the capacity market would be
needed to avoid distortion of the capacity market by subsidized resources.
Storage technologies are expected to have an increasing ability to provide economic services in elec-
tricity markets, initially in ancillary services applications. Capacity market designs may consider the
accommodation of such storage facilities, recognizing that they remain net energy consumers. In the
context of Alberta’s relatively flat intraday load shape, the greatest capacity benefit may be in firming
up the production from variable generation. The allocation of capacity value to large scale storage may
therefore have to recognize the interaction between variable generation and storage and the concept
of aggregation.
6.4. Natural gas generation and fuel-specific issues
The general pattern of market-based generation investment in Alberta and elsewhere has been one of
strong bias to natural gas fueled facilities. Natural gas facilities typically represent the lowest capital
cost per unit of capacity, and the linkage between electricity price and gas price in markets with high
gas penetration provides a natural hedge on the electricity price exposure. Natural gas facilities thus
become a market-based generation investment with the lowest investor risk, and are represented in
calculations of CONE.
The special opportunity for mine-mouth coal generation facilities in Alberta is now closed, so most future
investment without countervailing incentives (i.e. for renewables) can be expected to be in gas fired
generation. Concerns have been expressed in some jurisdictions over excessive reliance on natural
gas using pipeline systems that are inherently somewhat constrained and could be vulnerable to con-
tingency events and/or competing fuel demands which could represent a systemic threat to electricity
supply. These concerns have typically arisen in areas such as New England that are remote from fuel
resources. Alberta has an abundant supply of natural gas resources in the province and a gas pipeline
system that appears robust enough to avoid systemic threat to the electricity system. While AESO
would no doubt wish to monitor for possible development of such systemic risk, there is no apparent
need to account for it in capacity market design.
Capacity Market Design Considerations:
As discussed above, all the reviewed jurisdictions strive to design their capacity markets to be
technologically neutral and to be consistent with the reliability objectives they were created to achieve,
namely, resource adequacy. Technological neutrality is best achieved if the product is defined so that

Charles River Associates
Page 57
one MW from each resource represents an equivalent reliability value. None of the jurisdictions
reviewed have defined the product to procure additional operational attributes such as quick-start or
fast ramping capabilities. Instead, they rely on properly designed energy and ancillary services markets
to incentivize the investment in these attributes. This approach arguably promotes more efficient market
outcomes. This design is also likely well-suited for attracting new gas generation facilities with the
appropriate operational aspects. Given the expected future dependency on natural gas, this may be a
good starting point for the design of the Alberta capacity market.
6.5. Role of industrial cogeneration facilities
Some 22% of Alberta electricity supply comes from on-site generation, principally large industrial
cogeneration units operated at a steady high-capacity factor output dictated by the host steam
requirements, and providing relatively little surplus electricity to the grid. The AESO’s dispatch of this
industrial cogeneration is either on a gross or net basis, varying from facility to facility.
Capacity Market Design Considerations:
In view of the unique scale (relative to the market) of this generation in Alberta, it will be important to
define appropriate treatment of cogeneration in the capacity market. In PJM and ISO-NE, BTMG may
participate in the capacity market. However, if the BTMG is cleared as a capacity resource, it must not
be netted from the customer’s load for the purpose of calculating the peak demand on which the
capacity cost is allocated to the customer. This seems like it could also be a good starting point for
capacity market design in Alberta.
6.6. Planned coal phase-out and renewables contracting
Alberta will need to replace some 6,300 MW of coal fired capacity by 2030. The firm dependable
capacity contribution from the planned 5,000 MW of renewable generation is likely to be limited,
particularly if most of this is wind generation. The capacity market will be expected to provide support
for existing generator operations as well as the non-renewable element of replacement capacity and
the natural growth in electricity demand. It is essential to the efficient working of the capacity market
that the coal phase-out, renewable procurements, and conservation measures follow a consistent and
transparent plan. The coal phase-out plan and renewables procurement plan (the supply-side plans)
will have to be complemented by a demand forecast that will be the basis for setting capacity targets in
the auction. The supply-side plans and the demand forecast will establish in a transparent manner, the
supply gaps that will have to be filled by investment under the capacity market.

Charles River Associates
Page 58
Capacity Market Design Considerations:
The coal-phase out and renewable procurement plans and forecast remain outside the scope of the capacity
market design itself, but are essential to the establishment of credibility and sustenance of confidence in the
capacity market as the primary mechanism to support investment in firm dependable capacity.
The planned phase-out of all coal fired generation will remove from the capacity market the opportunity,
which has existed in other markets, to stimulate investment for purposes of life extension or upgrades
of mature coal facilities. Opportunities will remain to stimulate new investment in demand reduction,
coal to gas conversion, new or expanded generation, and possibly import commitments.
The removal of coal plant life extension from being an element of the market will thus change the
dynamics from those experienced in other North American capacity markets. This may affect price
volatility, with an unusually steep supply curve over the range of prices below new or expanded facility
investment, and may thus need to be recognized when designing the demand curve. To the extent that
conversion of existing coal facilities is contemplated in the coal phase out agreements, it will be im-
portant to understand possible interactions with the capacity market around timing of retirement (as
coal) and of re-entry (as gas).
6.7. Wholesale energy market design and transmission policy
There are four features of the current Alberta wholesale energy market design worth noting in the con-
text of capacity market design considerations:
The market operates in real-time only, with informational schedules available day-ahead.
All units are self-committed by the generation operator, without any cost recovery guarantee except
for the AESO’s limited and rarely used ability to commit long lead time units in anticipation of supply
short-fall.
All available capacity must be offered between $ 0 and $999.99/ MWh, but with an acknowledged
right of any generator to exercise unilateral market power and offer prices above cost.
Alberta also has a “congestion-free” transmission policy; the AESO is required to ensure that the
transmission system internal to Alberta is appropriately reinforced so that, under normal operating
conditions, about 95% of expected wholesale transactions can be realized without transmission
congestion.
Capacity Market Design Considerations:
The lack of a day-ahead market in Alberta may raise design questions with respect to the imposition of
“must-offer” obligations in the energy market for those that clear the capacity auction. There is a range
of actual practices indicated in reviewed markets, from “must-offer” obligations in all hours of day-ahead
and real-time markets, through “must-offer” obligations applicable in the GB market at times of limited
Charles River Associates
Page 59
supply cushion, to no physical obligation in the Irish “reliability option” framework. In US markets with
pre-existing day-ahead energy markets, the normal practice has been to specify a primary obligation
for a “must-offer” in that day-ahead market. Notwithstanding the existence in GB of a day-ahead market,
the capacity market obligation is based on the real-time market. Absent a day-ahead market, the
choices are: real-time must-offer in all hours, real-time must-offer in response to a low supply cushion,
and no obligation. The reviewed markets offer no clear “best practice” guideline amongst these, as all
appear to be feasible in the context of the existing Alberta energy and ancillary service market frame-
work, and none is fully proven within the reviewed markets. On the other hand, physical performance
obligations are the more broadly accepted practices and have not been found deficient in principle,
suggesting some form of physical “must-offer” obligation is the default practice against which any other
should be assessed.
If the reliability option framework is adopted, it would be important to consider the effectiveness of price
formation in the current energy market. The reliability option model relies on energy price as the sole
incentive mechanism to ensure cleared capacity is available during periods of scarcity.
The obligation to offer energy is, in most markets with a capacity obligation, associated with that
capacity obligation. It is questionable whether the obligation to offer should apply to non-capacity
resources.
The Alberta capacity market would provide resource adequacy by providing the means for capacity
resources to earn the missing money necessary to support any investment in generation necessary for
system adequacy. This overlaps with the historical expectation that generators would use their pricing
power in the energy-only market to secure returns that would support such investment. There may be
a case to argue that this right to exercise energy market power is no longer necessary or appropriate.
On the other hand, there is a case that scarcity pricing in the energy market remains an essential signal
to all market participants as it incentivizes efficient demand response and investment by generators in
key operational characteristics such as quick start or fast ramping characteristics. Arguably, the
unilateral exercise of market power in the energy market could continue as the source of such a price
signal.
Alberta currently operates a uniform energy market and common practice suggest that alignment of the
capacity market with the energy market may be a reasonable starting point. All reviewed US
jurisdictions operate capacity markets in which the capacity price can vary between zones. This reflects
the locational pricing structure of their energy markets. The zonal capacity markets recognize
transmission constraints that may limit the ability of energy to be delivered between zones under stress
conditions. GB and Ireland operate uniform capacity markets consistent with their energy markets,
although Ireland recognizes deliverability limitations procuring capacity and makes “out-of-off merit”
payments to attract the required capacity in the constrained zones.
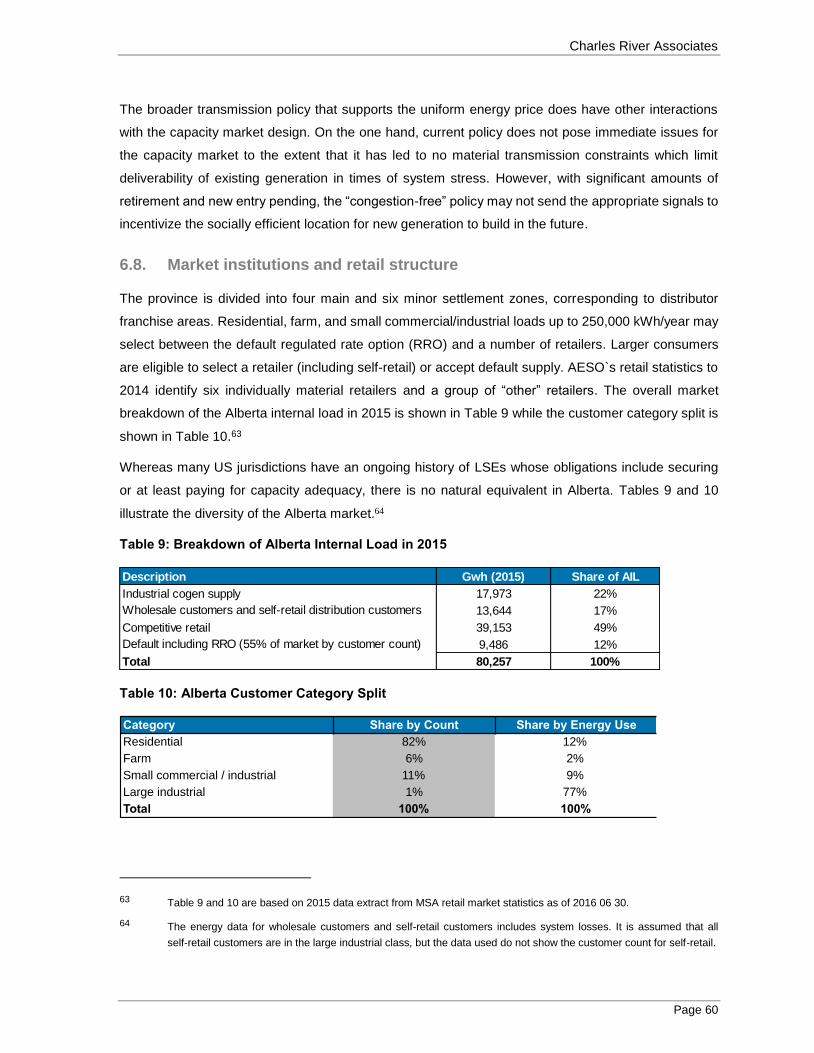
Charles River Associates
Page 60
The broader transmission policy that supports the uniform energy price does have other interactions
with the capacity market design. On the one hand, current policy does not pose immediate issues for
the capacity market to the extent that it has led to no material transmission constraints which limit
deliverability of existing generation in times of system stress. However, with significant amounts of
retirement and new entry pending, the “congestion-free” policy may not send the appropriate signals to
incentivize the socially efficient location for new generation to build in the future.
6.8. Market institutions and retail structure
The province is divided into four main and six minor settlement zones, corresponding to distributor
franchise areas. Residential, farm, and small commercial/industrial loads up to 250,000 kWh/year may
select between the default regulated rate option (RRO) and a number of retailers. Larger consumers
are eligible to select a retailer (including self-retail) or accept default supply. AESO`s retail statistics to
2014 identify six individually material retailers and a group of “other” retailers. The overall market
breakdown of the Alberta internal load in 2015 is shown in Table 9 while the customer category split is
shown in Table 10.63
Whereas many US jurisdictions have an ongoing history of LSEs whose obligations include securing
or at least paying for capacity adequacy, there is no natural equivalent in Alberta. Tables 9 and 10
illustrate the diversity of the Alberta market.64
Table 9: Breakdown of Alberta Internal Load in 2015
Table 10: Alberta Customer Category Split
63 Table 9 and 10 are based on 2015 data extract from MSA retail market statistics as of 2016 06 30.
64 The energy data for wholesale customers and self-retail customers includes system losses. It is assumed that all
self-retail customers are in the large industrial class, but the data used do not show the customer count for self-retail.
Description Gwh (2015) Share of AIL
Industrial cogen supply 17,973 22%
Wholesale customers and self-retail distribution customers 13,644 17%
Competitive retail 39,153 49%
Default including RRO (55% of market by customer count) 9,486 12%
Total 80,257 100%
Category Share by Count Share by Energy Use
Residential 82% 12%
Farm 6% 2%
Small commercial / industrial 11% 9%
Large industrial 1% 77%
Total 100% 100%
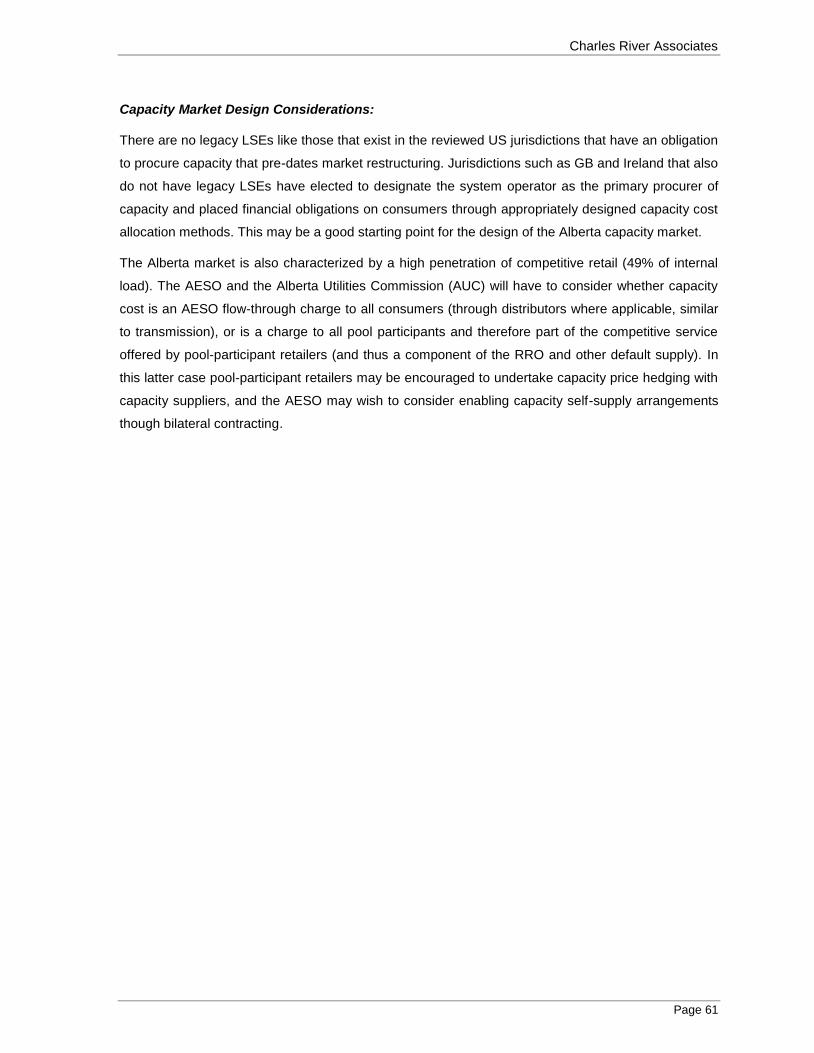
Charles River Associates
Page 61
Capacity Market Design Considerations:
There are no legacy LSEs like those that exist in the reviewed US jurisdictions that have an obligation
to procure capacity that pre-dates market restructuring. Jurisdictions such as GB and Ireland that also
do not have legacy LSEs have elected to designate the system operator as the primary procurer of
capacity and placed financial obligations on consumers through appropriately designed capacity cost
allocation methods. This may be a good starting point for the design of the Alberta capacity market.
The Alberta market is also characterized by a high penetration of competitive retail (49% of internal
load). The AESO and the Alberta Utilities Commission (AUC) will have to consider whether capacity
cost is an AESO flow-through charge to all consumers (through distributors where applicable, similar
to transmission), or is a charge to all pool participants and therefore part of the competitive service
offered by pool-participant retailers (and thus a component of the RRO and other default supply). In
this latter case pool-participant retailers may be encouraged to undertake capacity price hedging with
capacity suppliers, and the AESO may wish to consider enabling capacity self-supply arrangements
though bilateral contracting.
Related Documents