A bottom-up analysis of household energy consumption in Amsterdam Resolving policy barriers in the residential building sector Author: Frithjof Laubinger Student Nr: 10394486 Major: Science Amsterdam University College Supervisors: Dr. Eric Koomen VU University Amsterdam Dr. Michiel van Drunen Amsterdam University College Tutor: Dr. Maxim Kupovykh Amsterdam University College Reader: Dr. Ir. Bart Verheggen Amsterdam University College Capstone Thesis submitted in partial fulfillment of the requirements for the degree of Bachelor of Science. Date: 27-05-2015 Word Count: 12.114 words

Welcome message from author
This document is posted to help you gain knowledge. Please leave a comment to let me know what you think about it! Share it to your friends and learn new things together.
Transcript

A bottom-up analysis of household energy consumption in Amsterdam
Resolving policy barriers in the residential building sector
Author: Frithjof Laubinger
Student Nr: 10394486 Major: Science
Amsterdam University College
Supervisors: Dr. Eric Koomen
VU University Amsterdam
Dr. Michiel van Drunen Amsterdam University College
Tutor:
Dr. Maxim Kupovykh Amsterdam University College
Reader:
Dr. Ir. Bart Verheggen Amsterdam University College
Capstone Thesis submitted in partial fulfillment of the requirements for the degree of Bachelor of Science. Date: 27-05-2015
Word Count: 12.114 words


Abstract
Buildings in Amsterdam consume up to 70% of the city’s total energy use. Reducing energy consumption in the household sector can greatly influence the overall emission budget of the
city. To date, mitigation attempts focus mainly on new building projects. However, due to the long lifetime and slow turnover of Amsterdam’s building stock, the largest mitigation potential
lies in improving energy performance of existing energy devouring housing. A multivariate linear regression analysis is used in this research project to assess the factors influencing household
energy use in Amsterdam. Next the effectiveness of current mitigation strategies for existing buildings has been evaluated and adjustments to the existing policy set are proposed using the
results of the empirical analysis as scientific basis.
The analysis proved that old buildings are particularly energy-intensive. Occupant characteristics influence the energy use with a higher overall consumption in the low-income and the elderly
residents groups. Moreover, a rebound effect partly offsets efficiency gains in energy-efficient buildings by increased demand of occupants. Policy barriers such as the landlord-tenant split and
the established rent ceiling for social housing currently impede implementation of efficiency measures in the identified energy-intensive group of buildings (rental buildings with low-income
occupants). To overcome barriers this paper suggests increasing economic incentives by raising the rent ceiling for energy efficient rental dwellings. Further, it is recommended to implement
prescriptive building codes in order to close large efficiency gaps. No single policy can capture the entire potential for energy-efficiency, but a diverse set of policies is required for buildings to
effectively reduce energy use. A ranked list of supplementary policy approaches is provided.
Figure 1: Location of study site, Amsterdam Municipality in the Netherlands
Keywords: Household energy use End-use analysis Building stock Carbon reduction Rebound- effect Energy policy Amsterdam
i

Table of Contents Abstract ........................................................................................................................................................... i
Acknowledgements ...................................................................................................................................... v
Chapter 1: Introduction ............................................................................................................................... 1 Purpose and Rationale ............................................................................................................................ 2
Thesis outline ........................................................................................................................................... 2
Chapter 2: The building sector and its energy use ................................................................................... 3
2.1 A review of existing studies ............................................................................................................. 3 2.2 A review of existing policies ............................................................................................................ 5
2.3 Amsterdam and its building stock .................................................................................................. 6
Chapter 3: Analysis of household energy use in Amsterdam ................................................................ 9
3.1 Methodology ...................................................................................................................................... 9 3.1.1 Why natural gas as energy resource? ....................................................................................... 9
3.1.2 Data collection & preparation ............................................................................................... 10 3.1.3 Statistical analysis ..................................................................................................................... 14
3.1.4 Data projection & validation .................................................................................................. 15 3.2 Results ............................................................................................................................................... 16
3.3 Discussion ........................................................................................................................................ 19 3.3.1 Rebound effect ......................................................................................................................... 20
Chapter 4: How can energy use be reduced? ......................................................................................... 24 4.1 Energy policies in the building sector .......................................................................................... 24
4.2 Legislation & Cooperation ............................................................................................................. 26 4.3 Subsidies ........................................................................................................................................... 27
4.4 Landlord-tenant split ....................................................................................................................... 28 4.5 Energy consumption and behavior ............................................................................................... 29
4.5.1 Feedback on energy use .......................................................................................................... 29 4.5.2 Rebound effect ......................................................................................................................... 31
4.6 Energy from waste heat .................................................................................................................. 31 4.7 Evaluating policy additions ............................................................................................................ 33
Chapter 5: Conclusions ............................................................................................................................. 36
ii

Chapter 6: Discussion ................................................................................................................................ 38
6.1 Limitations & Research agenda ..................................................................................................... 38 6.1.1 Empirical analysis .................................................................................................................... 38
6.1.2 Proposed policy measures ...................................................................................................... 39 6.2 Final words ....................................................................................................................................... 40
Bibliography ................................................................................................................................................ 42
Appendix A: Results linear regression analysis ...................................................................................... 47
Appendix B: Empirical data used for analysis ........................................................................................ 49 Appendix B1: Gas use per m2 ............................................................................................................. 49
Appendix B2: Percentage of elderly .................................................................................................... 50 Appendix B3: Population density (OAD2010) ................................................................................. 51
Appendix B4: Building age ................................................................................................................... 52 Appendix B5: Average monthly income ............................................................................................ 53
Appendix B6: Model prediction of gas use per m2 ........................................................................... 54
Curriculum Vitae ........................................................................................................................................ 55
iii

List of Tables Table 1: Description of each considered parameter.............................................................................. 14 Table 2: Descriptive statistics of the dependent variable and predictors ........................................... 14 Table 3: Model output of Bayesian linear regression for selected sample and predictors. .............. 16 Table 4: Pros and cons of suggested policy additions for the existing building sector .................... 34 Table 5: Goodness of fit of previous studies investigating energy end-use dynamics. .................... 39
List of Figures Figure 1: Location of study site, Amsterdam Municipality ..................................................................... i Figure 2: Buildings in Amsterdam equipped with double-glazing ........................................................ 7 Figure 3: Methodological process of bottom-up end-use analysis ........................................................ 9 Figure 4: Spatial delineation of relevant datasets for a sample in Amsterdam. ................................. 12 Figure 5: Projected annual gas consumption per m2, based on identified predictors. ..................... 17 Figure 7: Average annual gas consumption vs. building age................................................................ 21 Figure 8: Average annual gas consumption vs. energy performance .................................................. 22 Figure 9: Patterns of Dutch energy efficiency policies in for the residential building sector.. ....... 26 Figure 10: Existing heat network in Amsterdam ................................................................................... 32
List of Appendices
Appendix A: Results linear regression analysis ...................................................................................... 47
Appendix B: Empirical data used for analysis ........................................................................................ 49
Appendix B1: Gas use per m2 ............................................................................................................. 49 Appendix B2: Percentage of elderly .................................................................................................... 50
Appendix B3: Population density (OAD2010) ................................................................................. 51 Appendix B4: Building age ................................................................................................................... 52
Appendix B5: Average monthly income ............................................................................................ 53 Appendix B6: Model prediction of gas use per m2 ........................................................................... 54
iv

Acknowledgements
Foremost I would like to thank the people who have directly and indirectly contributed to
making writing this thesis more than just a 60-page long essay, but literally a “capstone” to three years of dedicated studies. In particular I would like to thank my supervisors Dr. Eric Koomen
and Dr. Michiel Van Drunen for their continuous support during the research and their patience, inspiration and enthusiasm. Numerous meetings and endless email conversations have helped me
to keep focused and motivated throughout the entire period of writing. My thanks also go to Maarten Hilferink and Martin Van der Beek for providing me with data. To Laura Hakvoort
from the Municipality for more data and a fruitful discussion of my policy analysis. To Briggite, Alex and Clea for proofreading and to Dr. Ir. Bart Verheggen for agreeing to being the second
reader (only 55 pages to go!).
v

vi

Chapter 1: Introduction
Within the European Union, the residential building sector is responsible for one third of the overall energy consumption and thus plays an important role in terms of greenhouse gas
emissions (EEA, 2012). Worldwide it is predicted that building energy use will further increase and even double within the next 50 years, due to an increasing level of wealth and change of
lifestyle (IPCC, 2014). In 2009, with the so-called 20-20-20 targets Europe’s leaders agreed to reduce CO2 emissions within the EU by at least one fifth below the 1990 threshold and to
drastically reduce primary energy consumption by improving energy efficiency (European Commission, 2008).
Policy makers and scientists have increasingly recognized the potential of the building sector to
contribute to such reductions in energy consumption and CO2 emissions (Ürge-Vorsatz, 2009; Pacala & Socolow, 2004; Enkvist et al., 2007). Mitigation measures in this sector seem to be very
cost-effective, the technology is widely available, and mitigation potential is large. The Intergovernmental Panel of Climate Change (IPCC) indicates that globally 29% of the projected
GHG emissions can be reduced cost-effectively by focusing on the residential and commercial building sector alone, which is the highest saving potential of all sectors investigated. Thereby the
largest portion of carbon savings can be made by improving the performance of existing buildings, due to the slow turnover of the building stock (IPCC, 2014).
Cities make a significant contribution to the overall energy budget of a country and many
municipalities have developed their own climate action plans and strategies on top of national regulations to help reduce energy use (Kern et al., 2008). Besides transport, the building sector is
a focal point in urban energy consumption and is commonly targeted with environmental policy packages (IEA, 2012). This study is focused on Amsterdam and its ambitious goal to reduce CO2
emissions by 40% until 2025 (Municipality Amsterdam, 2014). In Amsterdam up to 70% of the energy consumed is used by buildings for heat and electricity (Municipality Amsterdam, 2010).
Reducing energy use in the building sector or encouraging a transition towards more renewable energy use in households would greatly influence the overall energy budget of Amsterdam and
The Netherlands. In view of meeting local and European emission targets there is a large potential in focusing on Amsterdam’s household sector and a need for an empirical analysis of
current household energy dynamics and policies. This study assesses household (gas) energy
1

consumption and evaluates the effectiveness of the current policy-set in order to highlight strategies for optimization.
Purpose and Rationale This study is relevant for two reasons. Firstly, the building sector in Amsterdam seems to be the
largest end-use factor in the city and not much is known about the city’s household energy dynamics. Secondly, the city of Amsterdam has strong ambitions in meeting the 2025 emission
targets. This study could highlight areas, socioeconomic groups or other drivers, which target-specific policies should focus on to overcome policy barriers, maximize effectiveness and achieve
optimal emission reductions in the future.
The aim of this research is to conduct a bottom-up spatial analysis in order to gain a thorough understanding of building energy end-use patterns in the Amsterdam specific context. This helps
to identify factors that drive household energy consumption within the municipality and informs the discussion on how this knowledge can be transferred into effective policy measures. The
primary focus lies on gas consumption, since gas accounts for more than 80% of the total fuel use within Amsterdam’s building sector (ECN, 2012).
Thesis outline This research paper is divided into six chapters. Subsequent to this introductory chapter, the
scientific literature on the main influential factors of household energy use is reviewed in Chapter 2. Further, a summary of the relevant political efforts that have been made towards improving
energy efficiency in buildings in Amsterdam and background information on the characteristics of Amsterdam’s residential building sector are included. The empirical analysis, including
methodology, results and interpretation are described in Chapter 3. An evaluation of the effectiveness of existing policies, based on the results of the analysis, conclude the thesis in
Chapter 4 with recommendations of policy measures to further reduce the environmental impact of Amsterdam’s residential building sector in the future.
2

Chapter 2: The building sector and its energy use
The building sector plays a dominant role in the overall energy budget of a city (IPCC, 2014).
This chapter outlines variables and factors that have been found to be influential in determining household (gas) energy use in the current literature. It reviews the national and local policy-
efforts that have been made to improve energy efficiency in the building sector and provides a brief overview of relevant characteristics of Amsterdam’s building stock.
2.1 A review of existing studies Multiple studies have looked into patterns of energy consumption in the urban household sector
and identified what drives energy end-use (Jones, Lannon & Williams, 2001; Santin et al., 2009; Boonekamp, 2007). Various bottom-up building stock models have been developed, in order to
analyze energy dynamics of households for different areas in the UK, Belgium or Sweden (Kavgic et al., 2009; Swan & Ugursal, 2009). One study by Howard et al. (2011) is of particular
interest as it adopts a similar methodology to the one used in this study. Building end-use for space and water heating of New York City was thereby assessed using gas consumption data and
a multivariate linear regression analysis in order to investigate potential drivers. It concluded that the age of the building and building function had the most notable effect on its gas consumption.
Building characteristics have a significant influence on energy performance of households.
According to several studies building age is an important characteristic as, in general, older dwellings require more energy for heating than newer dwellings (Liao & Chang, 2002). Linear
correlations were also found between energy use (mainly for heating) and household size (Jones, Lannon & Williams, 2001). In Amsterdam buildings are commonly heated using natural gas.
Therefore it can be expected that physical properties are significant predictors for the gas consumption of households in this study.
Although literature agrees that physical factors have a substantial influence on energy use, there
often seems to be a large variation amongst dwellings with similar building characteristics (Santin et al., 2009; Beerepoot & Beerepoot, 2007; Santamouris et al., 2007). This is partly attributed to
socio-economic drivers. Household income for instance has been proven to be an important factor in determining energy consumption. Vringer et al. (2007) found that a 1% increase in
income results in a 0.63% increase of energy use amongst Dutch households. Biesiot and
3

Noorman (1999) compared overall household expenditure with energy prices and consumption and found an almost linear relationship between overall expenditure and energy use of
households in the Netherlands. Although this relationship holds for both electricity and gas consumption, it is generally found to be weaker for gas, as affluent people own and use more
electrical appliances, but do not necessarily heat their apartments substantially warmer.
Besides quantifiable factors, motivation and overall environmental attitude are thought to cause additional variation in energy consumption of households with similar physical characteristics.
According to some authors, occupant behavior affects gas energy use almost to the same extent as physical factors (Haas et al., 1998). Behavior patterns comprise the presence at home of
residents, their environmental motivation and awareness of resource use (Santin et al., 2009). People who were provided feedback on their resource use responded with reduced consumption
by up to 10% (Darby, 2001). The influence of behavior patterns of occupants, disregarding the thermal quality of the dwelling should thus not be underestimated.
Building stock models for energy consumption are widely recognized as a useful tool to
understand building energy dynamics and assist with efficient implementation of policies (Kavgic et al., 2009; Swan & Ugursal, 2009). In a Dutch specific context the Netherlands Environmental
Assessment Agency (PBL) developed a model to project future energy demand and usage of the built environment. Factors that were taken into account to estimate energy demand were
amongst others building type and age, as well as socioeconomic characteristics of residents and the function of a building. The model however only works on a 1ha grid cell resolution, which
makes it suitable for national level predictions, but less effective for specific local applications such as on Amsterdam municipal level (PBL, 2012). Furthermore the model’s simulations are
based on many assumptions about the way physical and socioeconomic factors influence energy use, thus outcomes should be treated with caution. At local level, the municipality has set up a
focus group to collect empirical data in collaboration with energy producers, distributors and other companies engaged in energy management of the city. Parts of this data have recently been
made available to the public, but at the time of writing no quantitative analysis has been conducted using this dataset to estimate household energy consumption patterns (Boogert et al.,
2014).
This review showed that a broad range of mechanical building properties in combination with socioeconomic conditions of occupants influence energy use of a household. No empirical
4

analysis has as yet investigated household energy dynamics in Amsterdam. This study is thus the first to conduct a quantitative analysis of domestic energy use in the Amsterdam area. Results
from this analysis can be used to suggest policy improvements for effective future emission reduction.
2.2 A review of existing policies The IPCC and various national and local assessments have recognized the potential of buildings
being one of the most cost-effective mitigation measures (IPCC, 2014; ECN, 2012; EEA, 2012; Enkvist et al., 2007). Increasing energy efficiency could reduce energy demand by up to 50%
(IPCC, 2014). However, not much is known about the factors that drive residential energy use in Amsterdam and only little policy attention has been paid to the building sector so far. The only
significant operative policies for household energy reduction in the Netherlands were adopted in 2007 as part of the Dutch National Energy Efficiency Action Plan, in order to comply with the
2006 EU Directive on Energy Performance of Buildings (Ministry of the Interior, 2011). Emphasis of the policy set lies on new built buildings by setting minimum standards and energy
certifications for new construction projects (European Commission, 2010). Only few effective policies and incentives that aim to promote energy reduction and increase efficiency in the built
environment are in place so far.
Amsterdam’s building stock is old and not very dynamic; more than three quarters of the existing buildings have been constructed before 1990 and due to the long lifetime of buildings and the
fact that large parts of the urban building stock are heritage protected, only little turnover and urban renewal can be expected in the near future (O&S Amsterdam, 2015). Directives targeting
new buildings will consequently only achieve a limited emission reduction. Energy savings could be more effectively achieved by focusing on the existing building stock, where legislations are
currently still lacking. Only existing buildings that are offered for sale or (renewed) rent are required to obtain an energy label. The rationale is that homes with a better energy label are more
attractive to potential buyers or tenants, which will encourage owners to invest in energy-saving measures (Milieucentraal, 2015). The municipality is setting an example for homeowners by
making all municipal buildings and schools climate neutral by 2015 (Municipality Amsterdam, 2010).
5

With the “more with less” (Meer met Minder) agreement, the national government further intends to provide financial incentives to increase energy efficiency of buildings. Since 2008
homeowners are able to take out low interest loans an receive subsidies to finance energy saving measures in their homes. Further collaborations with housing associations are planned to also
promote making rental accommodations more energy efficient. The objective is to make 3.2 million homes 20-30% more efficient by 2020. However, not much progress has been made
towards target achievement and until 2015 only about 100.000 households make use of the subsidies nation-wide (Ministry of the Interior, 2011). If the Municipality of Amsterdam wants to
meet its ambitious emission targets, more effective and stringent measures addressing the existing building stock, its owners and tenants are thus necessary in the near future.
The lack of effective policies addressing this issue is partly due to the fact that insufficient
information is known about what drives domestic energy use in Amsterdam and which building-types and social groups are the “biggest emitters” and should be targeted with such local policies.
Understanding the dynamics of household energy use is an essential precondition in order to design local target specific policies in the future.
2.3 Amsterdam and its building stock With a population of about 800.000 inhabitants Amsterdam is the most populous city in the Netherlands. Amsterdam is densely urbanized with 4.450 inhabitants per km2 and 2.270 houses
per km2 in the city proper. Due to the age of the city more than three-quarters of the buildings were constructed before 1990 (O&S Amsterdam, 2015). Especially in and around the canal rings
houses are often constructed in the 1920s or earlier. Effective insulation of buildings varies widely depending on which insulation technology was available at time of construction and
whether renovations were performed afterwards. Only about 50% of the houses constructed before 1945 are equipped with double-glazing, whereas more than 90% of the building stock
younger than 1980 have double-glazing implemented (fig. 2).
6

Figure 2: Buildings in Amsterdam equipped with double-glazing, grouped by building age. [Source: O&S Amsterdam, 2013]
Consequently energy demand for heating can vary widely depending on the age of a dwelling due to differences in insulation. Additionally to the fact that the majority of Amsterdam’s building
stock is very old, great parts of the inner canals is UNESCO world heritage protected, which further complicates major exterior renovations and makes retrofitting more costly (UNESCO,
2015).
Less than one-third of all buildings in Amsterdam are privately owned or owner-occupied (O&S Amsterdam, 2015). Previous studies indicate that rental houses are less likely to have energy-
efficiency measures implemented (Leth-Petersen & Togeby, 2001). Improving energy efficiency in rental dwellings is the responsibility of the landlord, whereas the tenant commonly receives the
savings in energy costs. Landlords may feel that there are no benefits from making investments if the rent cannot be raised adequately. Since large housing associations own and administer more
than 75% of all rental dwellings in Amsterdam, this gives us an indicator about potential target groups for future energy policy designs.
Emission targets of Amsterdam’s Municipality are ambitious; the city strives to reduce its CO2
emissions by 40% until 2025 (Municipality Amsterdam, 2014). This is higher than the European target of 20% for 2020 and even beyond the national aim of 30% reduction by 2025. Reducing
emissions of the building sector has great potential, but also faces challenges. Although most of Amsterdam’s building stock is relatively old, little urban renewal can be expected in the near
future, as large parts of the city center are world heritage protected.
0%10%20%30%40%50%60%70%80%90%
100%
<1945 1946-1980 >1980 total
no double-glazing
partly double-glazing
fully double-glazing
7

A unique characteristic of Amsterdam is, that a part the building stock receives its heat from a central district-heating network, efficiently using excess heat emitted by Amsterdam’s waste
incinerator and power plants. 62.000 connections were present by 2013 and plans are drafted to triple the capacity for 2040, which is expected to have a great mitigation effect (AEB, 2014).
Overall it is evident that reducing the impact of the existing energy-devouring building stock is
imperative if 2025 emission targets want to be met. In order to do so optimally, energy end-use dynamics need to be well understood and high-consumer households need to be identified,
which is further elaborated on in the following chapter.
8

Chapter 3: Analysis of household energy use in Amsterdam
Energy end-use analysis and modeling seeks to quantify energy requirements as a function of
driving parameters. Previous studies have shown that a bottom-up investigation of energy use can successfully identify such parameters for the residential sector (Swan & Ugursal, 2009; Santin
et al., 2009). Bottom-up modeling is a useful tool to gain a deeper understanding into domestic energy dynamics and to provide a scientific basis for policy decisions on mitigation strategies. As
part of this research a bottom-up analysis of gas consumption was conducted for municipal Amsterdam. The purpose of this chapter is to: a) outline the methodological approach of this
research, b) state the main outcomes of the statistical analysis and c) discuss the implications of the outcomes.
3.1 Methodology A stepwise multivariate regression analysis was conducted on gas use for households in
Amsterdam, using ArcMap for spatial aggregation of the data and SPSS for statistical analyses (Kleinbaum et al., 2013). The process of this analysis is divided into three steps: 1) data collection
and preparation, 2) statistical analysis and 3) model projection and validation.
Figure 3: Methodological process of bottom-up end-use analysis
3.1.1 Why natural gas as energy resource? Fuel consumption in the building sector in the Netherlands is dominated by natural gas,
accounting for 80% of the total domestic energy use (ECN, 2012). The vast majority of Amsterdam’s dwellings use gas for space heating, hot water and cooking (Visscher et al., 2012).
In 2012, the year of data analysis, a total of 19.3 PJ energy was consumed in Amsterdam’s
Data collection & preparation• Collect data from different sources• Import in ArcMap• Aggregation of spatial datasets• [ArcMap]
Statistical analysis• Exclude outliers & irrelevant data• Stepwise multivariate regression
analysis• [SPSS[
Data projection• Import results of regression
analysis in ArcMap• Project modeled end-use and create
difference map• [ArcMap]
9

residential sector, 15.9 PJ in form of natural gas and only 3.4 PJ as electricity (O&S Amsterdam, 2013). A better understanding of domestic gas consumption can help limit this major component
of overall energy use in Amsterdam.
3.1.2 Data collection & preparation In order to successfully capture household energy consumption in a combination of relevant
parameters, a large array of data with a high level of detail is required. Hence data collection and preparation is a crucial step in this bottom-up analysis. Though, access to current and detailed
data is often limited due to privacy issues and information on dwelling properties and income are difficult to obtain. Efforts to collect data of energy consumption and potential predictors resulted
in the following raw datasets from different sources. Liander, the energy network manager of Amsterdam provided annual gas consumption data for 2012 in a spatial dataset. Associates of Liander made certain mentionable preliminary adjustments
to the raw data, which could not be influenced. Due to privacy reasons end-use data was aggregated to a minimum of five connections and assigned with a mean value of the cluster.
Additionally Liander associates computed annual gas consumption per m2, using surface area values from the “Basisregistraties Adressen en Gebouwen “ (BAG) dataset by the Dutch
cadastral register. The number of stories of a building was taken into account, though no information was made available about the exact methodological approach of their computation.
For this research, the computed Gas_m2 value was used as dependent variable, as it adjusts for differences in surface area of dwellings, which was information that could not be obtained as
seperate variable. It is important to note that weather causes large variation in year-to-year energy consumption, with gas consumption highly correlating with the number of heating-degree days.
For the year 2012 no substantial change in heating and cooling days was recorded compared to the previous decade. A temperature anomaly of approximately one degree was measured
compared to the 1961-1990-reference period (CBS, 2013; KNMI, 2013). This indicates that choosing consumption data from this year does not cause major bias due to extreme weather
conditions. Though being marginally warmer than the 30-year average, it is a suitable representative for future warmer climate with altered energy demands in the Netherlands.
Information about building stock characteristics was provided by Netherlands Environmental
Assessment Agency (PBL). The same spatial BAG dataset, which Liander used to derive surface areas, provided information of the construction year on building block level. Literature on
10

bottom-up building stock models for energy consumption states that generally the assumption is made that only constructions after the 1960s began to incorporate improved insulation measures,
as response to increasing fuel prices (Kavgic et al., 2010; Swan & Ugursal, 2009). This methodological approach was also adopted for this study and the parameter building age was
recoded to represent “additional years after 1965”.
A separate spatial dataset by PBL provided information on the function of registered addresses on PC6 postcode level, depicted as center-points per individual postcode area. Since the purpose
of this analysis is to investigate domestic energy use, only postcodes and building blocks with predominantly residential function (>90%) were selected.
A dataset containing energy labels of buildings was retrieved from the public geodatabase of the
Municipality of Amsterdam. It depicts center points of each labeled building bock. Energy labels for buildings were determined using the energy performance index (EPI), which was originally
applied differently for residential and utilitarian use. Since only fully residential building blocks were considered, it is assumed that all EPIs used in this research were derived using a consistent
EPI methodology.
Socio-economic data, aggregated on PC6 postcode level was acquired from Statistics Netherlands (CBS), dating the year 2010. Amongst others this dataset provided information on population
density, average monthly income of households and demographic characteristics. The percentage of elderly within a postcode was derived and defined as the fraction of citizens older than 65
years. As indicator for population density the variable “area address density” (OAD) was used, defined as the number of addresses within a one-kilometer radius around each postcode center-
point (CBS, 2010). Since this parameter seeks to express the concentration of human activities it was assumed to be an appropriate representative for population density.
Finally information on existing central heating infrastructure, as well as public and private
buildings that are connected to the heat grid, could be obtained from the Spatial Planning department of the Municipality of Amsterdam.
11

Figure 4: Spatial delineation of relevant datasets for a sample in Amsterdam.
All individual datasets were aggregated on PC6 postcode level using ArcMap. Figure 4 depicts the
visualization for a small sample in Amsterdam. Polygons represent BAG building blocks, containing information on gas use of individual buildings and building age. Blue points represent
energy labels, if available for a building and black points illustrate center points of postcodes. In order to join all data on a coherent level, several assumptions were made. Since all data had to be
aggregated on PC6 points (being the smallest common data-level), it was assumed that the building block closest to each center point of PC6 postcodes is a logical representative for all
buildings covered within the postcode area. Thereby only postcode points that were located in or within a 4m radius around a building block were considered (i.e. point B obtains the value of the
nearest building, whereas point A is excluded from further analysis, fig. 4). A similar procedure was applied to join energy labels and postcode points, though using a more generous radius of
20m. This approach allowed accounting for PC6 points and Energielabels belonging to the same building block, but being located in different parts of the building (see point C as example, fig. 4).
Ultimately all PC6 points that obtained gas consumption data from building blocks connected to
12
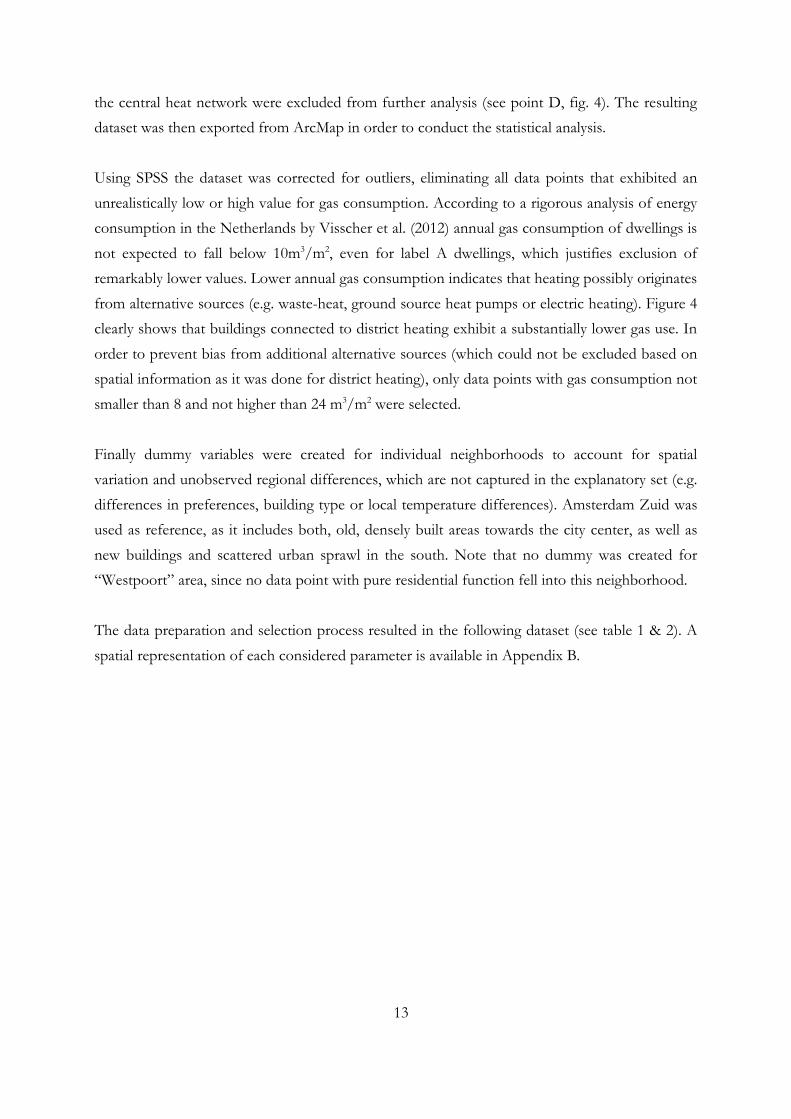
the central heat network were excluded from further analysis (see point D, fig. 4). The resulting dataset was then exported from ArcMap in order to conduct the statistical analysis.
Using SPSS the dataset was corrected for outliers, eliminating all data points that exhibited an
unrealistically low or high value for gas consumption. According to a rigorous analysis of energy consumption in the Netherlands by Visscher et al. (2012) annual gas consumption of dwellings is
not expected to fall below 10m3/m2, even for label A dwellings, which justifies exclusion of remarkably lower values. Lower annual gas consumption indicates that heating possibly originates
from alternative sources (e.g. waste-heat, ground source heat pumps or electric heating). Figure 4 clearly shows that buildings connected to district heating exhibit a substantially lower gas use. In
order to prevent bias from additional alternative sources (which could not be excluded based on spatial information as it was done for district heating), only data points with gas consumption not
smaller than 8 and not higher than 24 m3/m2 were selected.
Finally dummy variables were created for individual neighborhoods to account for spatial variation and unobserved regional differences, which are not captured in the explanatory set (e.g.
differences in preferences, building type or local temperature differences). Amsterdam Zuid was used as reference, as it includes both, old, densely built areas towards the city center, as well as
new buildings and scattered urban sprawl in the south. Note that no dummy was created for “Westpoort” area, since no data point with pure residential function fell into this neighborhood.
The data preparation and selection process resulted in the following dataset (see table 1 & 2). A
spatial representation of each considered parameter is available in Appendix B.
13
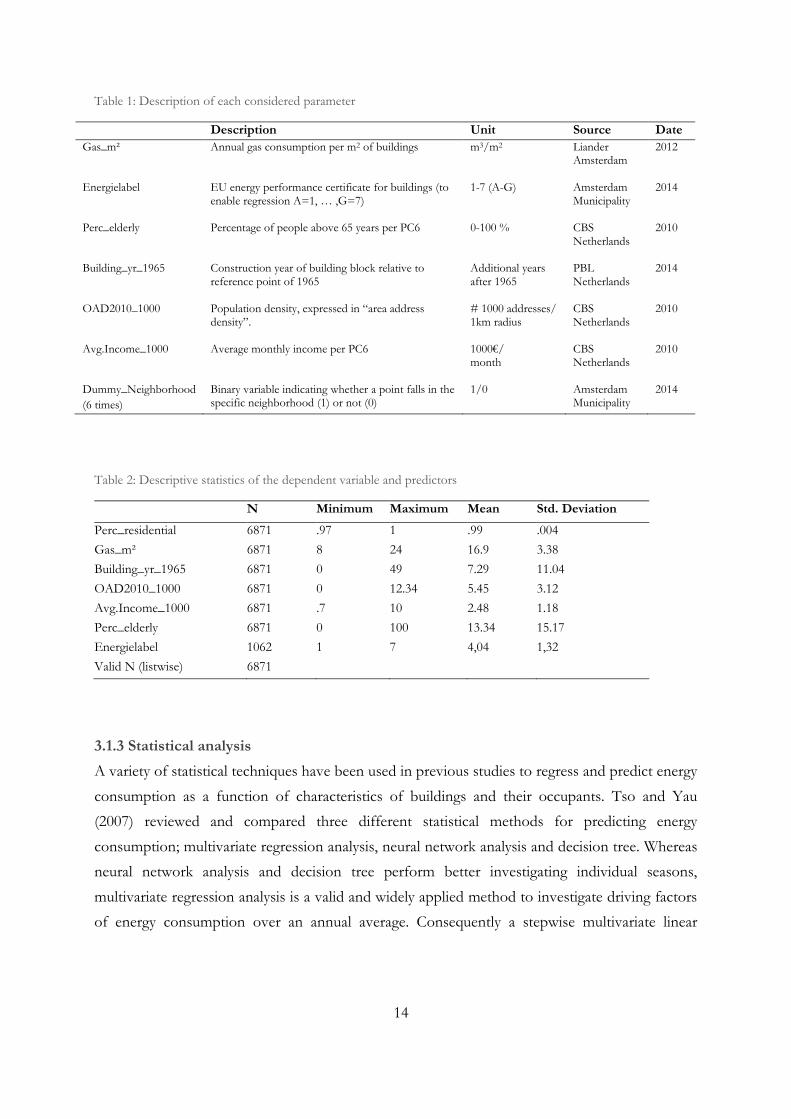
Table 1: Description of each considered parameter
Description Unit Source Date Gas_m² Annual gas consumption per m2 of buildings
m3/m2 Liander Amsterdam
2012
Energielabel EU energy performance certificate for buildings (to enable regression A=1, … ,G=7)
1-7 (A-G) Amsterdam Municipality
2014
Perc_elderly Percentage of people above 65 years per PC6
0-100 % CBS Netherlands
2010
Building_yr_1965 Construction year of building block relative to reference point of 1965
Additional years after 1965
PBL Netherlands
2014
OAD2010_1000 Population density, expressed in “area address density”.
# 1000 addresses/ 1km radius
CBS Netherlands
2010
Avg.Income_1000 Average monthly income per PC6 1000€/ month
CBS Netherlands
2010
Dummy_Neighborhood (6 times)
Binary variable indicating whether a point falls in the specific neighborhood (1) or not (0)
1/0 Amsterdam Municipality
2014
Table 2: Descriptive statistics of the dependent variable and predictors
N Minimum Maximum Mean Std. Deviation
Perc_residential 6871 .97 1 .99 .004 Gas_m² 6871 8 24 16.9 3.38 Building_yr_1965 6871 0 49 7.29 11.04 OAD2010_1000 6871 0 12.34 5.45 3.12 Avg.Income_1000 6871 .7 10 2.48 1.18 Perc_elderly 6871 0 100 13.34 15.17 Energielabel 1062 1 7 4,04 1,32 Valid N (listwise) 6871
3.1.3 Statistical analysis A variety of statistical techniques have been used in previous studies to regress and predict energy
consumption as a function of characteristics of buildings and their occupants. Tso and Yau (2007) reviewed and compared three different statistical methods for predicting energy
consumption; multivariate regression analysis, neural network analysis and decision tree. Whereas neural network analysis and decision tree perform better investigating individual seasons,
multivariate regression analysis is a valid and widely applied method to investigate driving factors of energy consumption over an annual average. Consequently a stepwise multivariate linear
14

regression was conducted in this study (Kleinbaum et al., 2013). It was decided to exclude the parameter “Energielabel” as explanatory variable, because of insufficient coverage (only 1062 of
6871 considered building blocks had an energy label assigned, see table 2). However, energy labels were used separately in direct comparison with gas use later in the study (see section 3.3.1).
The following Bayesian linear regression function intended to express variance in gas use, with 𝜀𝜀 being a constant and the parameters xi being representatives for the remaining predictors listed in table 1, which were stepwise added to the linear regression model.
𝐺𝐺𝐺𝐺𝐺𝐺 𝑚𝑚2 = 𝛽𝛽1𝑥𝑥1 + 𝛽𝛽2𝑥𝑥2 + 𝛽𝛽3𝑥𝑥3 + ⋯+ 𝛽𝛽i𝑥𝑥i + 𝜀𝜀
The stepwise analysis was conducted with the aim to obtain the best-fitting regression model (based on R2-value).
3.1.4 Data projection & validation After the statistical analysis was conducted, the energy consumption for all PC6-zones in the study area could be projected using the formula above in combination with the estimated beta
coefficients and characteristics of all individual PC6-points. Having done so a difference map was computed by dividing the measured gas use with the predicted value, in order to identify whether
the model performs particularly good/bad in certain areas.
15

3.2 Results Stepwise multiple linear regression analysis resulted in the following model to predict household gas consumption, with a goodness of fit of R2=0.32. All explanatory variables and most dummy
variables were found to have a significant effect on gas consumption of a household. Table 3: Model output of Bayesian linear regression for selected sample and predictors.
Model β Std. Error Significance (Constant) 19.629 .196 .000 Building_yr_1965 -.171 .003 .000 Perc_elderly .006 .002 .014 OAD2010_1000 -.104 .018 .000
Avg.Income_1000 -.294 .032 .000
Dummy_Zuidoost .407 .171 .017
Dummy_Nieuw_West -.610 .141 .000
Dummy_West -.163 .120 .177
Dummy_Oost -.453 .125 .000
Dummy_Noord -.616 .150 .000
Dummy_Center -.433 .197 .028
n=6871, R2=0.32
It is evident that the age of a building has a substantial effect on gas use, with every year older
causing a marginal increase in gas consumption by 17% until 1965. The affluence of occupants also affects gas consumption, with every hundred-euro increase in monthly income causing a
decrease of 2.5%. Demographics of occupants, such as the fraction of elderly people living in a building block increases gas use by one percent with each percent increase of elderly inhabitants.
Population density causes a decrease in gas consumption.
Additional variation seems to occur based on influences that are not covered with explanatory variables. Buildings in Zuidoost exhibit an overall higher consumption compared to the reference
Amsterdam Zuid. Significant lower consumption was found for the neighborhoods Oost, Noord, Center and Nieuw West, in respect to Amsterdam Zuid as reference.
16

Based on the outcomes of the explanatory analysis the energy consumption for all pc6-zones in the study area was projected using the estimated beta coefficients (see fig. 5). This enables gaining
an overview of areas that were excluded of the analysis but more importantly it points out zones with predominantly energy-intensive households. This knowledge could be useful in deciding on
future mitigation strategies (i.e. which area should be connected to district heating to achieve largest emission savings).
Figure 5: Projected annual gas consumption per m2, based on identified predictors.
It appears that most urban blocks within the Center and Westpoort were excluded, due to the fact that buildings in such areas are not of purely residential function (Westpoort mainly industry
and Center primarily offices and retail). Energy-intensive residential households seem to cluster in the outer neighborhoods of the city, such as Sloterdijk, Amsterdam-Zuid and
Watergraafsmeer.
17

Comparing the predicted energy use to the measured value shows that for most data points gas use could be predicted within +/- 15% accuracy by using the set of explanatory variables (see fig.
6). A modest pattern is noticeable that data points in the city center are largely overestimated, whereas data points in the outer areas are underestimated. Underestimation of data points in
some areas of Amsterdam North and Amsterdam Nieuw West could be caused by the presence of water bodies in the neighborhood, which creates a cooler climate and thus increases energy
demand.
Figure 6: Relative difference between modeled and measured annual gas consumption. Blue dots depict underpredicted values (model prediction <-15% smaller than measured value), red dots represent overestimations.
18

3.3 Discussion The results of the empirical analysis show that domestic energy consumption is influenced by a wide array of driving factors. It supports the hypothesis that older buildings are substantially less
energy efficient and that large efficiency gains can be made in improving thermal quality of old buildings.
Elderly in Amsterdam seem to have overall higher energy use. Younger occupants are regularly
absent during workdays, whereas elderly and retired people commonly spend more time at home and consequently have a constant demand for energy (Santin, 2010).
No evidence was found that gas consumption increases in larger households. Neither household
size included as continuous variable, nor dummies created for different household categories (e.g. single vs. multi person families) increased the goodness of fit of the model. Literature predicted
that household size affects gas use to a lesser extent than electricity (Biesiot & Noorman, 1999). Energy use for electrical appliances is likely to increase with more inhabitants, whereas space
heating creates a certain base-demand for gas, independent of the number of occupants. Only demand for hot water and cooking would increase in larger households, which is a rather trivial
component of the overall gas consumption.
The analysis shows that higher population density within a postcode slightly decreases gas consumption. Revising the definition of the variable population density as it is expressed in this
study (“area address density”) reveals, that the variable is computed by counting the number of addresses registered within a 1km radius. Thus the variable represents not only population
density, but also urban building density. The reducing effect on energy use with increasing density is therefore not necessarily explained by variation in population density in a postcode, but
rather by density-variation of the built environment. Logically urban sprawl with freestanding homes causes higher average gas consumption (particular for heating) than densely built row
houses or apartment blocks (Kahn, 2006). Although this knowledge is of little use to improve the energy performance of existing buildings, it provides a scientific basis on which higher building
density for new construction projects can be encouraged in the future.
Higher income levels are associated with a decrease in energy consumption of residents. This contradicts our hypothesis of an increasing effect of the income parameter, which was based on
19
previous results by Vringer et al. (2008) for the entire Dutch household sector. Although their findings were statistically significant, the authors remarked that there was a substantial bandwidth
within each income group, which might be caused by other factors that are associated with income level, such as time spent at home or education level. Also in this study some variation
captured by the income variable might be due to other, correlating factors. It seems reasonable that generally in order to earn a high income, one has to spend more time outside of the house,
which reduces energy demand during the day. Poortinga et al. (2004) argue that the level of education of residents also reduces household energy use. Since level of education is not an
independent parameter in this study, but commonly correlates with income levels, this might be another reason why the income variable is negative. Additionally one can presume that high-
income residents more often own the dwelling they inhabit. Private ownership is assumed to reduce energy use compared to rental dwellings for the reason that private owners are more
inclined to commit to efficiency investments with long payback time (Santin et al., 2009). Also ownership could not be obtained as separate variable due to privacy reasons, but is presumably a
large collinear factor contributing to the negative effect of income level on energy use. Furthermore the level of income is often associated with dwelling size (Isaac & Van Vuuren,
2009). In absolute terms larger buildings consume more energy for heating. However, marginal increase is possibly non-linear as bigger buildings become more efficient in energy use for heating
per m2 (less outer walls and windows per m2 of floor space). This logarithmic relationship of heating demand with dwelling size was not accounted for in this study, but is likely to further
alter the negative effect of the income variable.
3.3.1 Rebound effect In the field of energy economics and policy it is widely recognized that actual savings through
efficiency improvements can be less than expected, as increased efficiency and consequent fuel savings lead to increases in demand of consumption for the sake of additional goods (Sorrell et
al., 2009). Efficiency gains are thereby offset by behavioral responses of consumers and increased consumption, a so-called rebound effect or take back effect. Next to vehicle use in the transport
sector, rebound effects for residential energy consumption are widely acknowledged in the literature (IPCC, 2009; Greening et al., 2000). As buildings become more energy-efficient, the
decreased energy bill facilitates an increase in consumption, for instance to heat the dwelling marginally warmer, which then counteracts to efficiency gains to some extent. In the building
20

sector the rebound effect is thereby of particular importance because of the high proportion of energy efficiency potential and subsequent high mitigation losses compared to other sectors
(IPCC, 2009). Sorrell et al. (2009) reviewed 12 experimental studies and summarized that the mean energy take-back for residential space heating is estimated at around 20%. To illustrate, if a
50% improvement in heating efficiency results in only a 40% drop in gas use, there is a 20%
rebound effect ((50 − 40)50� = 20%). The same study found a mean temperature take back of 1
degree due to increased heating.
Kok et al. (2014) used cross-sectional data of 560.000 Dutch households and recorded significant deviations between predicted and actual gas consumption of buildings. A rebound effect of more
than 25% for owner-occupied dwellings and up to 40% for rental dwellings could be recorded. Another study validates the findings, and estimates a rebound effect for space heating within the
range of 0-30% for the Netherlands (Berkhout et al., 2000). Temperature take backs thereby appear to be higher for low-income households, as savings in energy costs are spent to provide
additional (seemingly necessary) energetic goods.
Figure 7: Average annual gas consumption [m3/m2] compared to building age of buildings in the Amsterdam dataset applied in this study (n=6871).
Comparing gas consumption to the construction year of buildings in the Amsterdam dataset
showed that gas use linearly declines with newer buildings due to improved thermal insulation
21

(fig. 7). Though the linear relationship does not hold for the most modern buildings, where energy consumption is substantially higher, indicating that, despite the improved thermal quality,
residents in new buildings consume on average substantially more energy.
Figure 8: Average annual gas consumption [m3/m2] compared to energy performance of all buildings with assigned energy labels in the Amsterdam dataset of this study. [Note: 1=A, 2=B,…,7=G] (n=1062).
The take-back effect is even stronger for energy use of buildings in respect to their labeled energy
performance. A general decline is visible for buildings with more efficient labeling (fig. 8). Yet, average gas consumption increases for buildings labeled with the most efficient A-label. In line
with the conclusions of the other two studies conducted on Dutch households these findings suggest that a rebound effect in Amsterdam’s building sector is occurring for new, modern
buildings, as well as existing buildings that obtain a label A through implementing efficiency measures. Comparing the means of the labels indicates a net-increase in consumption, which
would entail a rebound effect of more than 100%, much higher than rebound effects found in literature (fig. 8; Kok et al., 2014; Berkhout et al., 2000). Though this conclusion should be
treated with caution. Accurate estimation of the magnitude of the rebound effect is far from straightforward, requires a large and accurate dataset and goes beyond the scope of this study.
Nevertheless it should certainly be kept in mind that empirical data indicates a partial offset of energy efficiency gains by behavioral responses of occupants in Amsterdam.
22

Overall the empirical analysis indicates specific groups of buildings and residents that should be
focused on for optimal emission reductions. The largest part of energy use in a dwelling is influenced by physical building characteristics, with a drastic increase in energy consumption for
older buildings and reduced energy demand for densely built urban environments. Occupant characteristics and behavior notably affects energy use, with elderlies and low-income groups
using more energy. Energy savings through improving thermal quality are possibly less effective than predicted, as behavioral responses offset efficiency gains to some extent. It becomes evident
that there is a large mitigation potential amongst Amsterdam’s buildings. Using the results of this analysis as a scientific basis the following chapter reviews and discusses several mitigation
strategies and policies that are currently in act and proposes policy adjustments based on the precedent evaluation.
23

Chapter 4: How can energy use be reduced?
Following the assessment of the drivers of household energy consumption in Amsterdam,
different policy measures are evaluated. This chapter starts with describing the diverse policy approaches and mitigation strategies that are generally used to reduce energy use from the
building sector. Subsequently individual policy tools are evaluated, barriers and potential market failures identified and adjustments suggested. The chapter concludes with ranking each proposed
mitigation measure based on its cost-effectiveness.
4.1 Energy policies in the building sector Three policy approaches are generally used to encourage energy savings in the building sector: 1. Judicial instruments (command & control policies), 2. Economic instruments (subsidies and
taxation) and 3. Communicative instruments (supplying information) (Somanathan et al., 2014; Metz, 2009). This section briefly introduces each individual policy measure, after which the
following sections discuss measures in more detail.
Judicial instruments, such as legislations and regulations impose a norm for a desired behavior or performance. In the context of domestic energy use, examples of a legislative policy are
prescriptive building codes and minimal environmental standards. Mandatory building performances do only exist for new building projects; no regulations are yet defined for
sustainable urban renovation. Direct regulations can be an inexpensive but effective tool to reduce energy consumption, though only if high compliance is assured. Enforcement of
compliance can be problematic and result in high institutional costs and inefficiency of the policy tool if a performance standard is set too ambitious. Moreover standards need to be renewed
regularly, in order to adopt and incorporate technological advancements. Furthermore performance regulations do not provide an incentive for homeowners to exceed the often-
conservative minimum control and thereby only have a limited effect. Economic incentives can encourage homeowners to improve energy performance beyond the legally required minimum.
Economic instruments provide incentives of either positive (subsidies) or negative (taxation)
nature to reduce energy use (Somanathan et al., 2014). Positive economic incentives can shorten the payback time of investments and thereby make insulation-measures more cost-effective.
However such subsidies need to be high to provide an effective incentive, which makes this
24
policy tool very costly if applied on a larger scale. The high complexity of bureaucracy of many subsidy procedures are often not appealing for the mainstream homeowner, which, instead of
encouraging investments, makes subsidies rather a reward for property owners who would have implemented insulation measures either way. The so-called free-rider effect for energy subsidies
in the Netherlands is estimated to be as high as 60%, making this policy rather ineffective (Egmond et al., 2006). Negative economic incentives like fuel taxation have a similar effect on
benefit returns of efficiency investments and can beyond that stimulate innovation. But equity is an issue. This analysis showed that low-income groups are more likely to live in energy-inefficient
housing, which means that the weakest would be the worst hit by a policy scenario of fuel taxation in Amsterdam. Consequently there is a risk of low-income groups falling into fuel
poverty, meaning that they cannot afford to heat their dwellings adequately warm at reasonable costs anymore. Especially as low-income groups often do not have the economic capital to invest
in energy-saving measures this policy would create more harm than good in the Amsterdam specific case.
Communication tools provide information with the aim to create social support and increase
awareness amongst residents. An example relevant for Amsterdam’s building sector is Europe’s Energy Performance Directive for buildings, which requires energy certifications for new-built
buildings and for existing buildings at moments of transaction (i.e. sale and rent) (European Commission, 2010). Energy labeling creates a uniform informative ranking of energy
performance and intends to change preferences, indirectly leading to increases in property value. So far energy labels only have a descriptive function of providing information about the energy
performance of a building. In future the established energy certificate framework can be a useful unit for implementing prescriptive minimum performance standards.
Voluntary agreements and cooperation between energy-intensive building groups and the
government can lead to efficiency improvements beyond the regulatory setting (Somanathan et al., 2014). As discussed in the following section, working towards carbon reductions in
cooperation with large housing associations has been a focal point of past mitigation approaches and can remain an effective measure in the future.
25

4.2 Legislation & Cooperation
Figure 9: Patterns of Dutch energy efficiency policies in for the residential building sector. (Policy tools: “Coop”: Co-operative Measures, “Cros”: Cross-cutting with sector-specific characteristics, “Fina”: Financial, “Fisc”: Fiscal/Tariffs, “Info”: Information/Education, “Le/I”: Legislative/Informative, “Le/N”: Legislative/Normative; source: ECN, 2012).
Most effective policies targeting energy efficiency in the Netherlands are currently of cooperative
or legislative nature (see fig. 9; ECN, 2012). No detailed data was accessible on house ownership of independent dwellings for this statistical analysis, though it is known that overall more than
70% of the housing stock are rental dwellings, of which approximately three quarters are owned by large housing associations (O&S Amsterdam, 2015). Cooperation and agreements with
housing associations in Amsterdam have been the focal point on the political agenda since 2004, being part of the “Meer met Minder” energy saving project (fig. 9; ECN, 2012). Though beyond
only voluntary agreements, more stringent legislations should be considered to increase energy efficiency. Implementing a mandatory minimum building code not only for new-built buildings,
but also for the existing rental building stock would show action from the local government and could create notable improvements in energy performance for large parts of existing buildings.
Lee and Yik (2004) reviewed regulatory approaches for enhancing building energy efficiency and remarked that implementing such legislation could be very effective to close efficiency gaps from
highly inefficient buildings, such as monuments. As long as efficiency regulations can be implemented at negative private costs (meaning investing in insulation creates a net-gain through
fuel savings) such a command and control policy would receive little resistance by landlords.
26

However, if efficiency targets are too ambitious, compliance would not be guaranteed and enforcement and monitoring would result in high institutional costs and inefficiency. This
explains why only moderate or no efficiency targets have been set in the past. It also indicates that only a rather conservative performance minimum is feasible in order to ensure compliance.
As already discussed there is no incentive to exceed the considerably low standard, without supplementary policy tools. In respect to Amsterdam, the fact that the majority of houses are
owned centralized by housing associations would ease regulatory control and enforcement. Cooperation with housing associations could be a cost-effective way to agree upon a more
stringent building code level and still achieve wide compliance. It is important to satisfy negative private costs to ensure compliance of homeowners. Yet, generally it is the social cost of
regulation, rather than the private cost that is more relevant for public policy of the local government. Ideally this means that co-benefits and externalities of improved energy efficiency
(i.e. reduced local air pollution, improved amenities & health) are taken into account in cost-benefit analyses, which can justify more stringent regulations.
4.3 Subsidies Building performance standards alone (assuming standards would be in place and compliance is
ensured) will not sufficiently and effectively lead to reduced fuel consumption and carbon savings. Supplementary policy instruments are required to provide an incentive to exceed the
minimum control. Economic incentives can encourage homeowners to improve energy performance beyond the required level.
A diverse set of economic instruments and subsidies, aiming at (financially) encouraging
efficiency improvements exists in the Netherlands. However, subsidies provide insufficient economic incentive, because efficiency investments are very high and for most retrofitting
measures the economic payback spans over multiple decades (Sunnikka, 2006). This is in particular a barrier to reaching low-income groups who more commonly live in energy-inefficient
housing. Although subsidized funds with low interest loans are available to finance energy saving technologies, low-income households are not likely to commit to such large investments.
Additionally senior resident households might be hesitant as economic savings are unlikely to return investments within their lifetime. Both groups were identified being energy-intensive
consumers in Amsterdam, which suggests that subsidies with such small financial incentives currently miss reaching the most pressing target groups.
27

This is different for high-income households, where subsidies might have stimulated the
investment in efficiency technologies, such as wall-insulation or thermally better performing glazing. Cost-benefit analyses in efficiency improvement measures of buildings conclude that a
large part of benefits from retrofitting investments are not necessarily of economic nature in form of utility cost savings, but enhance life quality in form of improved indoor environment and
better health and productivity (Fisk, 2000; Ürge-Vorsatz, 2009). Jakob (2006) estimates that such co-benefits may almost amount to the same magnitude as financial benefits in cost savings,
creating a market failure. High-income households, which are less dependent on mere financial returns are more likely to invest in insulation measures as they can afford non-monetisable co-
benefits. Assuming that co-benefits and externalities are the major motivation trigger to invest in efficiency-measures, the current small subsidies are more an additional reward for (high-income)
homeowners who want to commit to investments due to other reasons anyway. Regarding Amsterdam’s building stock, financial subsidies might have a slight impact on energy efficiency
investments in high-income groups, whereas low-income occupants possibly largely failed to be reached. Although it is difficult to address such positive externalities in private cost-benefit
analyses, homeowners should be made aware of the magnitude of co-benefits that come with insulation measures.
4.4 Landlord-tenant split Most residents in Amsterdam are tenants and consequently do not own the house which they
inhabit. As pointed out tenants have little to no incentive to commit to large insulation investments, especially if they consider moving out in the short- or medium term. Likewise
landlords see limited benefit in making investments in energy efficiency, as investments can often only partly be offset with increases in rent, creating a so-called landlord-tenant split in motivation
(Gillingham et al., 2012). Moreover, the rent payable for rental housing is subject to a ceiling in Amsterdam. The maximum rent is calculated by using a rent point system, where points are
awarded based on property condition, size, location and levels of comfort. Since 2012 points are also assigned for the quality of insulation, depending on the energy label of the building. Logically
energy-efficient properties are awarded more points than properties that score lower. Improving the performance of a dwelling such that it receives a higher energy label adds 4 extra points and
allows a rise of the monthly rent ceiling by up to €15 (National Government Netherlands, 2015). Though large parts of the housing stock, such as social housing are additionally assigned with an
28

absolute ceiling of €711, disregarding the awarded points. As rent prices are very competitive in Amsterdam, this ceiling is often reached with a comparatively weak energy performance.
Consequently, housing associations, which own 75% of the rental stock and are responsible for social housing in Amsterdam, have no benefit in improving their buildings and obtaining a better
energy label as costs cannot be transferred to tenants (L. Hakvoort, personal communication, May 13, 2015). The landlord-tenant split in combination with the prescriptive rent ceiling creates
the probably most severe barrier in domestic energy policy for Amsterdam’s buildings. Recall that in this study an energy-intensive consumption pattern for low-income groups (who are more
likely to live in social housing) was found, which indicates that social housings are energetically inefficient and supports the hypothesis of the policy barrier. Two things should be considered to
overcome this issue. Firstly the (short-term) benefit of an insulation investment should be guaranteed for the tenant. If the tenant wishes to invest in insulation measures by himself, he/she
should be compensated by the landlord when moving out. This creates an incentive for tenants to invest even if the dwelling is only occupied for a short term. However, it is not very feasible to
implement such guarantees and even if established, this is not likely to improve conditions for low-income households, as insufficient capital is available amongst low-income residents to
commit to investments. Secondly, it should be considered to give landlords of low-income housing (i.e. housing associations) a greater financial incentive to conduct energy improvements
in their housing stock, for instance by assigning a larger point bonus to energy labels and accepting a rent beyond the fixed rent ceiling for label A buildings. Thereby landlords of
dwellings where rent ceilings limit the transfer of investment costs to the tenant would regain an incentive to implement insulation measures. In order for such a policy tool not to meet resistance
by tenants, it is essential to provide clear information upfront, emphasizing that utility savings will offset the marginal rent increase in the long-term, such that the net rent-price does not
drastically increase. Recalling the findings of the empirical analysis it should thereby be kept in mind that net fuel abatement is most likely less than predicted due to a rebound-effect.
4.5 Energy consumption and behavior
4.5.1 Feedback on energy use People generally know little about the energy they use related to their behavior, which creates an additional market failure due to lack of information (Steg, 2008). The only way residents can keep
track of their energy use is from regular meter readings. But even this is not always possible, for instance in master-metered rental apartments. Even if a meter is available it only provides
29

information about the total energy use, which is difficult to relate to as a consumer. Smart meters, providing detailed real-time feedback on individual energy consumption and related costs and
savings can be an effective tool to raise awareness and reduce consumption (Fischer, 2008). Generally supplying information of consumption patterns is estimated to reduce consumption by
the order of 10% (Darby, 2001). A social experiment conducted in the United States concluded that direct real-time feedback on energy consumption and costs reduced consumption by 7%
compared to the control group (Faruqui et al., 2010). The influence of human behavior on a household’s energy use and the potential lack of information should also be considered in policy
making. Specific communication tools to increase people’s knowledge and address their concern to energy related issues promote energy conservation and could reduce demand. Implementing
smart meter devices in large parts of the rental stock in Amsterdam in cooperation with housing associations could be much more cost-effective than improving the thermal energy performance
of dwellings itself (which is often very costly and subject to a rebound-effect). However, it needs to be assured that people are willing to use such tools and change their behavior based on the
advice given. Many policies aiming to influence environmental behavior have shown difficulties to achieve durable effects, as people were not willing to change their routine and habits (Carter,
2007). It is essential to carefully design a user-friendly interface for smart-meter devices and assure acceptance by residents, in order for this mitigation measure to be effective. Fischer (2008)
used psychological models to analyze which sort of feedback on electricity consumption is most successful to achieve savings. Adopting her findings and transferring her conclusions to gas
demand and Amsterdam’s building characteristics this study suggests the following features, which should be incorporated in the design of smart-meters for Amsterdam’s housing stock in
order to achieve most-effective reductions. Feedback should be:
• Presented in a clear and understandable way
• Given frequently (ideally daily)
• Involve interactions and programmable timers (ideally remotely accessible by phone)
• Provide information on short- and long-term costs and savings
• Provide historical comparisons
• Involve end-use specific breakdown.
30

4.5.2 Rebound effect The statistical analysis provided clear evidence for a rebound effect in Amsterdam’s residential
energy use. It is important to keep in mind that energy conservation policies ultimately should be designed to achieve actual savings, not just to increase the energetic efficiency of buildings. Cost
benefit analyses of energy efficiency programs (e.g. subsidies and rebates) are calculated based on engineered efficiency gains, while behavioral responses are not included, but might alter
paybacks. Although the rebound effect should be “no excuse for inaction”, it should be taken into account in energy end-use models and cost-benefit analyses that governments use to
evaluate policy gains (Gillingham et al., 2013). Stricter energy-efficiency legislation can be implemented alongside with options that reduce the impact of rebound effect, such as increasing
awareness of consumers (Kok et al., 2014).
4.6 Energy from waste heat Emission savings can not only be achieved by increasing efficiency and reducing demand, but also by substituting gas with alternative energy fuels. A part of Amsterdam’s housing stock
receives heat from a central district-heating network. A waste-to-energy plant located in the west of Amsterdam incinerates domestic waste and provides households with electricity and heat.
“Diemen 34” and “Heimweg 9”, two newly built gas-fired power plants contribute up to 260 thermal megawatt hours of waste heat for the urban heat network (Siemens, 2013). AEB, the
carrier of the waste heat-network, claims that the system currently provides heat for up to 62.000 residential and public connections in the Amsterdam area and the municipality has the ambition
to expand the system to more than 200.000 connections by 2040 (AEB, 2014). So far only domestic waste is used for incineration. In future also industrial waste could potentially be
incinerated to produce electricity and heat as well (Boogert et al., 2014). Amsterdam produces approximately 840 million kilogram of industrial waste. This waste is highly diverse, but
approximately 50% can be assumed suitable for incineration, which would result in a total waste-heat potential of 1.1 PJ according to Boogert et al. (2014).
31

Figure 10: Existing heat network in Amsterdam. (Source: Amsterdam Municipality)
Figure 10 provides an overview of the current heat network. Expanding the district heat network
would allow for more efficient resource use and could lead to great emission savings in the future. Particularly in the Sloterdijk-area energy-intensive households seem to be located close to
an existing infrastructure. Spatial analysis concludes that around 40.000 connections lie within 100m radius of existing heat pipelines, proving a large potential of connecting households to the
current pipelines without major expansion efforts of the infrastructure (Appendix A). However, the transition to waste-heat needs to be critically evaluated. It uses resources of the conventional
energy system more efficiently, makes smart use of existing infrastructure and effectively improves carbon performances of energy intensive buildings on the short-term, but it also
increases the dependency on conventional energy sources and creates a lock-in to using non-renewable fuels. At present the city is already very reliant of the waste incinerator as an energy
source, so that often waste has to be imported from neighboring provinces or even countries to satisfy the energy demand (Gosden, 2014). In the long term a transitioning towards cleaner fuels
is discouraged because of this demand. Therefore if the municipality decides on expanding a decentralized heating system possibilities of using alternative heat sources (e.g. heat pumps) to
32

substitute conventional heat from incinerator and gas fired power plants in the future should be examined.
4.7 Evaluating policy additions After the previous sections of chapter four have assessed existing policy approaches and elaborated on limitations and potential policy adjustments and additions, this section assesses and
compares each proposed policy measure based on its advantages and disadvantages. Results of the comparison are shown in table 4.
33

Table 4: Pros and cons of suggested policy additions for the existing building sector
Policy instrument Pros Cons Increased rent ceiling in social housing for label A
• Addresses energy-intensive low-income households
• Overcomes market failure (landlord-tenant split)
• Shortens payback time of energy investments for owners
• Acceptance by housing associations
• Resistance by tenants, if transparency is not assured; supplementary communication tools required
• Rent ceiling assigned on national level, difficult for Municipality to adjust
Minimum performance standards, building codes (cooperation with housing associations)
• Addresses entire housing stock • Creates a level playing field for housing
associations • Ensures minimum levels in the housing
stock • Signal action from local government • Closes large efficiency gaps (monuments) • Likely to result in negative social & private
costs
• No incentive to exceed the – presumably conservative – minimum
• Incurs high institutional costs if target is too ambitious
• Risk of non-compliance if too ambitious • Requires publicly funded investment, where
private capital is not available
Feedback on energy use (smart meters) in rental stock
• Effective to increase awareness of resource consumption
• Cost-effective measure of reaching (up to 10% reduction)
• Only an indication of energy use, no tangible direct savings
• Challenging to change habits, risk of small and imprecise impact
• User friendly interface essential
Expansion of district heating • Efficient use of resources and existing infrastructure
• Potential of using infrastructure to distribute heat from heat pumps in future
• 40.000 connections located near existing heat-pipelines
• High implementation cost of constructing new infrastructure
• No immediate GHG savings due to long construction time (5-10 years)
• Lock-in: discourages energy transition, dependency on heat from incinerator and GFP
• Public resistance, difficult to change habits (i.e. gas vs. electric cooking), transparency and supplementary communication tools required
Increase of rebates for home-owners • Shortens payback time of energy-saving investments
• Public acceptance
• Price incentive needs to be high enough to become effective
• Creates high costs for government • Risk of free-riding • Stopping subsidies can have negative effect • Conflicts with EU’s polluter pays principle
Fuel taxation • Help reduce energy use and GHG emissions
• Shortens payback time for investment • Has same effect on existing and new-built
buildings • May encourage innovation
• Equity: hard on low-income households in energy-inefficient dwellings
• Increases risk of fuel poverty • Provides no additional incentive in rental
sector as tenant pays utility bill • Public resistance and disapproval
Note: GFP, Gas-fired power plant; GHG, Greenhouse gas
34

Policies were evaluated on institutional efforts and costs and the potential emission savings they create, drawing on findings of the empirical study. After a careful evaluation of each policy tool
the following priority list for individual measures is proposed:
1. Increased rent ceiling in social housing for label A 2. Regulation on minimum performance
3. Feedback on energy use (smart meters) 4. Expansion of district heating network
5. Increase of rebates for home-owners 6. Fuel taxation
Even though this assessment ranks different measures, it needs to be pointed out that no single
policy instrument can capture the entire potential for energy-efficiency and only a diverse set and combination of different policy tools will effectively achieve energy savings, taking advantage of
synergistic effects (e.g. building codes in combination with improved feedback to reduce rebound-effect). Based on the empirical analysis, the focus should be on low-income households
and rental dwellings. Both target groups can be addressed by allowing an increase of the rent ceiling for energy-efficient social housing. In addition minimum regulations can close large
efficiency gaps and thereby achieve notable energy savings and create a level playing field for landlords and housing associations. Such a limit should be carefully defined, ideally in
collaboration with housing associations, in order to ensure broad compliance. Additional financial incentives (i.e. increase rent ceiling and increase subsidies for home-owners) could
encourage energy efficiency investments beyond legislative minimum levels. Informative tools and feedback on energy use, especially in energy-intensive households (i.e. low-income groups,
rental dwellings), can reduce energy demand and further contribute towards meeting emission targets. Expanding the heat network allows a more efficient use of resources in the conventional
energy system. However, the infrastructure is costly to implement, does not create immediate savings due to long construction times and will discourage an energy transition away from the
conventional system in the long-term. Increasing rebates and subsidies for homeowners can make the current subsidy policies more effective. In order to achieve this objective, price
incentives would have to be drastically increased, which makes this policy costly and rather ineffective. Fuel taxations are not advisable as such a policy hits the weakest (low-income groups)
most and creates a higher risk of fuel poverty.
______________________
This section was written in consultation with Laura Hakvoort, an associate of the Bureau for Environment and Spatial Planning
of the Municipality of Amsterdam.
35

Chapter 5: Conclusions
The objectives of this thesis were to identify driving factors for residential energy consumption,
review existing policies regarding energy efficiency in buildings, research household energy dynamics in Amsterdam, evaluate existing policies and lastly, based on the empirical analysis and
policy evaluation, propose policy adjustments and strategies to reduce carbon emissions from Amsterdam’s (residential) building sector in the future.
A review of existing energy end-use models summarized drivers of household gas
consumption that were found significant in literature. Results highlighted that in addition to the obvious physical properties of buildings (i.e. building age, dwelling size, number of windows) the
occupant characteristics, such as their socio-economic standard and related behavior play a substantial role in the overall household energy use.
A diverse set of policy instruments is in place aiming to reduce building energy use in the
Netherlands. Though policies mainly target new construction projects and only insufficiently focus on improving efficiency of the existing building stock. Due to the slow turnover and the
age of Amsterdam’s buildings, a large mitigation potential lies in the existing building stock, often even at negative costs. In order to design target specific policies, understanding the dynamics of
household energy consumption in Amsterdam is essential.
Multivariate linear regression analysis concludes that building age has the largest effect on consumption with older buildings exhibiting substantially higher energy use. Building density
reduces average gas use. The level of income of occupants notably reduces energy consumption, presumably due to the fact that more financial capital is accessible to implement energy saving
measures. Also collinear factors such as home ownership, level of education and dwelling size, which were not measured separately, are expected to influence the negative correlation of this
variable. Elderly people have higher gas consumption, presumably due to spending more time at home.
A rebound effect seems to offset efficiency gains in Amsterdam’s building sector to some
extent. A take-back is visible for new-built buildings (younger than 2009), though it is even more distinct for all buildings featured with a label A certificate, disregarding its age. Subsequently
retrofitting existing buildings likely results in less energy savings than predicted, due to behavioral
36

responses (according to literature around -30%). This finding should be no excuse for inaction to implement efficiency measures, but should be taken into account in energy end-use modeling of
efficiency gains that are used by the government for cost-benefit analyses and policy decision-making.
Evaluating the current policy set revealed several barriers and market failures that currently
hinder energy efficiency improvements: 1) Subsidies and rebates provide insufficient incentives to homeowners. 2) The landlord-tenant split creates a barrier to implementing energy-efficiency
measures in the rental building stock. 3) The rent ceiling for social housing prevents efficiency improvements in the parts of the housing stock that are in greatest need of improvement; rental
dwellings and low-income households.
Several policy adjustments were proposed and ranked based on its cost-effectiveness and mitigation potential. Although there is no “silver bullet” to optimize carbon mitigation in the
building sector, priorities should be set to overcome policy barriers in the social housing (rental) stock by allowing an increase in rent ceiling for label A buildings. In addition a prescriptive
building code regulation should be implemented to signal action from government and close large efficiency gaps. It is important to stress that no single policy instrument can capture the
entire potential for energy-efficiency in the building sector. A diverse portfolio of policy instruments is required to effectively reduce energy use in buildings and comply with set 2040
emission targets.
37

Chapter 6: Discussion
This research adds to the body of evidence that a successful modeling of household energy use
can provide valuable information for defining policies. The results of this thesis clearly demonstrate the complex and interdisciplinary nature of energy end-use modeling in the building
sector, proving correlations with urban density, building age, but also showing the great influence of socio-economic characteristics as in level of income and fraction of elderly. But it also
becomes evident that such variables cannot solely explain variations of energy end-use. Additional physical and socio-economic factors, which were not included, seem to play a
substantial contributing role.
6.1 Limitations & Research agenda
6.1.1 Empirical analysis The empirical analysis focused on gas consumption only. The major end-use groups of households are: 1) space heating, 2) domestic hot water and 3) (electric) appliances and lighting.
Since most households in Amsterdam use gas for space & water heating and cooking, two major consumption groups and more than three quarters of the total household energy could therewith
be covered and analyzed (Swan & Ugursal, 2009). A significant part of the energy use, in form of electricity was not investigated. Further research could conduct a similar bottom-up analysis to
understand consumption patterns of electricity use in Amsterdam.
The statistical analysis was strictly limited to the data that was accessible. Several datasets of explanatory variables that were expected to have an influence were not available due to privacy
reasons (e.g. surface area of dwelling, information on home ownership). For this reason the explanatory variables obtained in this study are presumed to partly capture collinear effects.
Including additional parameters would have most likely improved the model and potentially lead to additional conclusions. Moreover the dependent variable (Gas_m2) was computed upfront by
associates of Liander, using the BAG dataset for surface area. Height and number of stories of buildings seems to have been taken into account, but the exact methodology of how this data was
derived to compute “Gas_m2“ is not available.
38

Table 5: Goodness of fit of previous studies investigating energy end-use dynamics.
Authors Date Study site Sample size (N) R2
Brandon & Lewis 1999 City of Bath 180 0.134
Poortinga et al. 2004 The Netherlands 455 0.17
Santin et al. 2009 The Netherlands 14.800 0.38
Kok et al. 2014 The Netherlands 1.664.113 0.225
The energy end-use model of this study concluded with an R2 of 31,1%. Compared to relating studies, this value lies within the expected range, rendering the results as significant (see table 5).
Again, a higher goodness of fit could have been obtained if a broader set of explanatory parameters was available.
Finally data from different years was used: Percentage elderly (2010), average income (2010), gas
consumption (2012), Energy label (2014) (see table 1, section 3.1.2). Gas consumption varies depending on climatic conditions, but no substantial temperature anomaly was found for the year
2012, which makes it a suitable representative. Though demographics and income of certain neighborhoods may have changed over the past 5 years.
6.1.2 Proposed policy measures Policy improvements were suggested based on the current policy set and the gained knowledge from the empirical analysis. The feasibility of each policy adjustment was discussed with Laura
Hakvoort, a delegate of the Department for Spatial Planning and Sustainability of the Municipality of Amsterdam. Policy suggestions were evaluated based on pros and cons, which
resulted in a prioritized list of policy suggestions. To analyze each policy in detail is beyond the scope of this study. Nevertheless the evaluation provides an overview of the most pressing
issues. A more extensive analysis should investigate the feasibility, costs, potential synergies, tradeoffs and gaps of the policies. A multi-criteria analysis could be a neat way to accurately rank
policy measures based on economic, environmental and social criteria in a follow-up study.
39

Moreover the possibilities of mitigation strategies discussed in chapter four are certainly not exhaustive. Follow-up studies should look into additional options, such as transitioning to
renewable energy fuels (i.e. solar PV, solar boiler facilities or geothermal heat pumps). Electrification of the heating system in combination with demand-side management and electric
boilers taking up abundant intermittent electricity could be another promising option that deserves investigation.
National and local governments are not the only authorities that can encourage more efficient
energy use. Nongovernmental organizations (NGO) play an important role in reaching out to the public and raising awareness of resource use and energy efficiency. The Dutch NGO “0 op de
meter” is only one example of a NGO that has been proven to be effective to promote household energy efficiency and contribute to carbon savings. Collaborating and supporting
NGOs in their campaigns is an imperative in addition to any governmental policies.
Large parts of Amsterdam’s buildings are heritage protected, which leads to additional barriers of implementing insulation measures. Due to their old age such buildings are also likely to be
amongst the most energy-inefficient. No detailed data could be accessed on monuments and buildings, which are heritage protected. Therefore in this study it can only be presumed that such
buildings are indeed high consumers. A regulated minimum level on energy performance would target such buildings inclusively and can close large efficiency gaps. But as higher insulation costs
make non-compliance more likely, enforcement efforts for such buildings should be increased accordingly.
6.2 Final words Large emission reductions can be achieved in the building sector, particularly in rental buildings of low-income residents. A composition of diverse, synergistic policy measures would effectively
encourage mitigation of emissions from existing buildings. Reducing energy demand is often undervalued as a mitigation option in energy policy. Supply-side mitigation options, such as
transitioning to cleaner fuels are more popular in the political debate. Looking at Amsterdam’s energy policy agenda it is clearly evident that emphasis is given on such policy measures. Supply-
side tools, such as plans to expand waste-district-heating and encouragements to invest in solar panels seem to have priority and are possibly much more accepted by the general public
40

(Zonatlas Amsterdam, 2015). Although public acceptance is important, essentially the aim for energy policies is to reduce CO2 emissions and not to be appealing. This research emphasizes
that most the cost-effective emission reductions can be achieved through demand-side policy tools by encouraging the implementation of insulation measures in a defined subgroup of existing
buildings. This does not only reduce emissions, but also generates co-benefits for residents (i.e. improved indoor air quality, productivity and health), often resulting in negative social cost of
implementation. A shift in energy policy with more emphasis on demand-reduction is thus advocated. If done so, it is certainly not infeasible for Amsterdam to comply with the set 2025
emission targets.
41

Bibliography Abrahamse, W., Steg, L., Vlek, C., & Rothengatter, T. (2005). A review of intervention studies aimed at household energy conservation. Journal of environmental psychology, 25(3), 273-291. AEB (2014). Energy from Waste in Amsterdam: Helps provide green certified power for the tram, metro and city. Afval Energie Bedrijf (AEB), Amsterdam. Retrieved from: http://www.cewep.eu/information/energyclimate/goodpractice/m_929 Beerepoot, M., & Beerepoot, N. (2007). Government regulation as an impetus for innovation: Evidence from energy performance regulation in the Dutch residential building sector. Energy Policy, 35(10), 4812-4825. Berkhout, P. H., Muskens, J. C., & Velthuijsen, J. W. (2000). Defining the rebound effect. Energy policy, 28(6), 425-432. Biesiot, W., & Noorman, K. J. (1999). Energy requirements of household consumption: a case study of The Netherlands. Ecological Economics, 28(3), 367-383. Boogert, G. et al. (2014). Energy Atlas, Amsterdam South East. Municipality Amsterdam. Retrieved from: www.amsterdam.nl/publish/pages/603695/energy_atlas_amsterdam_april2014_english.pdf Boonekamp, P. G. (2007). Price elasticities, policy measures and actual developments in household energy consumption–A bottom up analysis for the Netherlands. Energy Economics, 29(2), 133-157. Brandon, G., & Lewis, A. (1999). Reducing household energy consumption: a qualitative and quantitative field study. Journal of Environmental Psychology, 19(1), 75-85. Carter, N. (2007). The politics of the environment: ideas, activism, policy. Second edition. Cambridge University Press. CBS (2010). “Technische Toelichting, Kerncijfers Postcodegebieden 2008-2010”. Statistics Netherlands (CBS). Retrieved from: http://www.cbs.nl/nl-NL/menu/themas/dossiers/nederland-regionaal/cijfers/incidenteel/maatwerk/default.htm CBS (2013). “Environmental Accounts of the Netherlands, 2013”. Retrieved from: http://www.cbs.nl/NR/rdonlyres/42847379-478D-476A-8422-661B0A9D7F1A/0/2014Environmentalaccountsfirstresultspub.pdf Darby, S. (2001). Making it obvious: designing feedback into energy consumption. In Energy efficiency in household appliances and lighting (pp. 685-696). Springer Berlin Heidelberg. ECN (2012). “Energy Efficiency Policies and Measures in The Netherlands”. Energy Research Centre of the Netherlands (ECN). Retrieved from: http://www.odyssee-mure.eu/publications/national-reports/energy-efficiency-netherlands.pdf Egmond, C., Jonkers, R., & Kok, G. (2006). One size fits all? Policy instruments should fit the segments of target groups. Energy Policy, 34(18), 3464-3474. Enkvist, P., Nauclér, T., & Rosander, J. (2007). A cost curve for greenhouse gas reduction. McKinsey Quarterly, 1, 34.
42

European Commission (2008). “Mitigation potentials and costs in 2020”. Retrieved from: http://ec.europa.eu/clima/policies/package/docs/ir_07_nonco2_en.pdf European Commission (2010). “Directive on Energy Performance of Buildings”. Retrieved from: http://eur-lex.europa.eu/legal-content/EN/TXT/PDF/?uri=CELEX:32010L0031&from=EN EEA (2012). “End-user GHG emissions from energy: Reallocation of emissions from energy industries to end users 2005-2010”. European Environmental Agency (EEA). Retrieved from: http://www.eea.europa.eu/publications/end-user-ghg-emissions-energy Faruqui, A., Sergici, S., & Sharif, A. (2010). The impact of informational feedback on energy consumption—A survey of the experimental evidence. Energy, 35(4), 1598-1608. Fischer, C. (2008). Feedback on household electricity consumption: a tool for saving energy? Energy efficiency, 1(1), 79-104. Fisk, W. J. (2000). Health and productivity gains from better indoor environments and their relationship with building energy efficiency. Annual Review of Energy and the Environment, 25(1), 537-566. Gillingham, K., Harding, M., & Rapson, D. (2012). Split incentives in residential energy consumption. Energy Journal, 33(2), 37-62. Gillingham, K., Kotchen, M. J., Rapson, D. S., & Wagner, G. (2013). Energy policy: The rebound effect is overplayed. Nature, 493(7433), 475-476. Gosden, E. (2014). How UK household rubbish is powering Amsterdam’s red lights. The Telegraph. Retrieved from: http://www.telegraph.co.uk/news/earth/businessandecology/recycling/11038783/How-UK-household-rubbish-is-powering-Amsterdams-red-lights.html Greening, L. A., Greene, D. L., & Difiglio, C. (2000). Energy efficiency and consumption - the rebound effect - a survey. Energy policy, 28(6), 389-401. Haas, R., Auer, H., & Biermayr, P. (1998). The impact of consumer behavior on residential energy demand for space heating. Energy and buildings, 27(2), 195-205. Howard, B., Parshall, L., Thompson, J., Hammer, S., Dickinson, J., & Modi, V. (2012). Spatial distribution of urban building energy consumption by end use. Energy and Buildings, 45, 141-151. IEA (2012). Urban Energy Policy Design. International Energy Agency (IEA). Retrieved from: http://www.iea.org/newsroomandevents/news/2012/june/name,28079,en.html IPCC (2014). Summary for Policymakers. In: Climate Change 2014: Impacts, Adaptation, and Vulnerability. Cambridge University Press, Cambridge, United Kingdom and New York, NY, USA, pp. 1-32. Isaac, M., & Van Vuuren, D. P. (2009). Modeling global residential sector energy demand for heating and air conditioning in the context of climate change. Energy Policy, 37(2), 507-521. Jakob, M. (2006). Marginal costs and co-benefits of energy efficiency investments: The case of the Swiss residential sector. Energy policy, 34(2), 172-187.
43

Jones, P. J., Lannon, S., & Williams, J. (2001). Modelling building energy use at urban scale. In: Proceedings of the seventh international IBPSA conference, Rio de Janeiro, Brazil (pp. 175-180). Kahn, M. E. (2006). Green cities: urban growth and the environment. Washington, DC: Brookings Institution Press. Kavgic, M., Mavrogianni, A., Mumovic, D., Summerfield, A., Stevanovic, Z., & Djurovic-Petrovic, M. (2010). A review of bottom-up building stock models for energy consumption in the residential sector. Building and Environment, 45(7), 1683-1697. Kern, K., Alber, G., Energy, S., & Policy, C. (2008). Governing climate change in cities: modes of urban climate governance in multi-level systems. Competitive Cities and Climate Change, 171. Kleinbaum, D., Kupper, L., Nizam, A., & Rosenberg, E. (2013). Applied regression analysis and other multivariable methods. Fourth edition. Cengage Learning. Kok, N., Brounen, D., Aydin, E. (2014). Energy Efficiency and Household Behavior: The Rebound effect in the residential sector. European Centre for Corporate Engineering, Working paper. Retrieved from: http://corporate-engagement.com/files/publication/ABK%20Rebound%20NK010314.pdf KNMI (2013). “Tracking changes in European Climate”. Koninklijk Nederlands Meteorologisch Instituut (KNMI). Retrieved from: http://cib.knmi.nl/mediawiki/index.php/European_Temperature Leth-Petersen, S., & Togeby, M. (2001). Demand for space heating in apartment blocks: measuring effects of policy measures aiming at reducing energy consumption. Energy Economics, 23(4), 387-403. Lee, W. L., & Yik, F. W. H. (2004). Regulatory and voluntary approaches for enhancing building energy efficiency. Progress in Energy and Combustion Science, 30(5), 477-499. Liao, H. C., & Chang, T. F. (2002). Space-heating and water-heating energy demands of the aged in the US. Energy Economics, 24(3), 267-284. Metz, B. (2009). Controlling climate change. Ch. 7: Buildings. Cambridge University Press. Milieucentraal (2015). Energielabel woningen. Retrieved from: http://www.energielabel.nl/woningen/ Ministry of the Interior (2011). Plan of Action Energy Saving in Built Environment. Retrieved from: http://www.government.nl/issues/energy-policy/documents-and-publications/reports/2011/02/25/plan-of-action-energy-saving-in-built-environment.html Municipality Amsterdam (2010). 2040, Energy Strategy. Physical Planning and Sustainability. Amsterdam, the Netherlands. Retrieved from: http://www.amsterdam.nl/gemeente/organisatie/ruimte-economie/ruimte-duurzaamheid/ruimte-duurzaamheid/making-amsterdam/publications/sustainability-0/2040_energy_strategy_0/ National Government Netherlands (Rijksoverheid) (2015). Puntensysteem en Energieprestatie. Retrieved from: http://www.rijksoverheid.nl/onderwerpen/huurwoning/puntensysteem-huurwoning/puntensysteem-en-energielabel O & S Amsterdam (2015). Amsterdam in numbers. Retrieved from: http://www.os.amsterdam.nl/feiten-en-cijfers/
44

PBL (2012). Data and Methods for the Vesta Spatial Energy Model For The Built Environment. Netherlands Environmental Assessment, Planbureau voor Leefomgeving (PBL), Den Haag. Retrieved from: http://www.pbl.nl/sites/default/files/cms/publicaties/PBL-2012-vesta-ruimtelijk-energiemodel-voor-de-gebouwde-omgeving-data-en-methoden-500264001.pdf Pacala, S., & Socolow, R. (2004). Stabilization wedges: solving the climate problem for the next 50 years with current technologies. Science, 305(5686), 968-972. Poortinga, W., Steg, L., & Vlek, C. (2004). Values, environmental concern, and environmental behavior a study into household energy use. Environment and behavior, 36(1), 70-93. Santin, O. G., Itard, L., & Visscher, H. (2009). The effect of occupancy and building characteristics on energy use for space and water heating in Dutch residential stock. Energy and buildings, 41(11), 1223-1232. Siemens (2013). Hemweg 9 and Diemen 34 CC power plants officially inaugurated in the Netherlands. Retrieved from: http://www.siemens.com/press/pool/de/pressemitteilungen/2013/energy/fossil-power-generation/EFP201306041e.pdf Somanathan E., T. Sterner, T. Sugiyama, D. Chimanikire, N.K. Dubash, J. Essandoh-Yeddu, S. Fifita, L. Goulder, A. Jaffe, X. Labandeira, S. Managi, C. Mitchell, J. P. Montero, F. Teng, and T. Zylicz, (2014). National and Sub-national Policies and Institu- tions. In: Climate Change 2014: Mitigation of Climate Change. Contribution of Working Group III to the Fifth Assessment Report of the Intergovernmental Panel on Climate Change. Cambridge University Press, Cambridge, United Kingdom and New York, NY, USA. Sorrell, S., Dimitropoulos, J., & Sommerville, M. (2009). Empirical estimates of the direct rebound effect: A review. Energy policy, 37(4), 1356-1371. Steg, L. (2008). Promoting household energy conservation. Energy policy, 36(12), 4449-4453. Santamouris, M., Kapsis, K., Korres, D., Livada, I., Pavlou, C., & Assimakopoulos, M. N. (2007). On the relation between the energy and social characteristics of the residential sector. Energy and Buildings, 39(8), 893-905. Sunikka, M. (2006). Energy efficiency and low-carbon technologies in urban renewal. Building Research & Information, 34(6), 521-533. Swan, L. G., & Ugursal, V. I. (2009). Modeling of end-use energy consumption in the residential sector: A review of modeling techniques. Renewable and sustainable energy reviews, 13(8), 1819-1835. Tso, G. K., & Yau, K. K. (2007). Predicting electricity energy consumption: A comparison of regression analysis, decision tree and neural networks. Energy, 32(9), 1761-1768. UNESCO (2015). Seventeenth-century canal ring area of Amsterdam inside the Singelgracht. Retrieved from: http://whc.unesco.org/en/list/1349 Ürge-Vorsatz, D., Novikova, A., & Sharmina, M. (2009). Counting good: quantifying the co-benefits of improved efficiency in buildings. In European Council for an Energy Efficient Economy. La Colle sur Loup, France. 185-195 pp. Visscher, H. J., Majcen, D., & Itard, L. C. M. (2009). Effectiveness of energy performance certification for the existing housing stock. In RICS COBRA 2012, Proceedings of the Construction, Building and Real Estate Conference, Cape Town, South Africa, 10-11. Arizona State University.
45

Vringer, K., Aalbers, T., & Blok, K. (2007). Household energy requirement and value patterns. Energy Policy, 35(1), 553-566. Zonatlas Amsterdam (2015). Wat is een Zonatlas? Retrieved from: http://www.zonatlas.nl/amsterdam/
46

Appendix A: Results linear regression analysis
Descriptive Statistics N Minimum Maximum Mean Std. Deviation
Gas_m² 6871 8 24 16.90 3.383
perc_elderly 6871 0 100 13.34 15.173
perc_residential 6871 .9701 1.0000 .999202 .0042800
OAD_1000 6871 .0000 12.3420 5.456462 3.1257517
Avg.Income_1000 6871 .7000 10.0000 2.483088 1.1848138
Building_yr_1965 6871 0 49 7.29 11.045
Dummy_Zuidoost 6871 0 1 .10 .305
Dummy_Nieuw_West 6871 0 1 .15 .359
Dummy_Zuid 6871 0 1 .21 .407
Dummy_West 6871 0 1 .19 .389
Dummy_Westpoort 6871 0 0 .00 .000
Dummy_Oost 6871 0 1 .15 .357
Dummy_Noord 6871 0 1 .16 .370
Dummy_Center 6871 .00 1.00 .0365 .18762
Valid N (listwise) 6871
Descriptive Statistics_separate variables
N Minimum Maximum Mean Std. Deviation
avg_household_size 6849 1.00 4.33 1.9039 .50539
Energielabel 1062 1 7 4,04 1,319
47

Model Summary
Model R R Square
Adjusted R
Square
Std. Error of the
Estimate
1 .558a .311 .310 2.810
a. Predictors: (Constant), Dummy_Center, perc_elder, BOUW_1965,
Dummy_Oost, fis_1000, Dummy_Nieuw_West, Dummy_Noord,
Dummy_Zuidoost, Dummy_West, OAD_1000
Coefficientsa
Model
Unstandardized Coefficients
Standardized
Coefficients
t Sig. B Std. Error Beta
1 (Constant) 19.629 .196 100.107 .000
BOUW_1965 -.171 .003 -.557 -50.753 .000
perc_elder .006 .002 .026 2.449 .014
OAD_1000 -.104 .018 -.096 -5.724 .000
fis_1000 -.294 .032 -.103 -9.075 .000
Dummy_Zuidoost .407 .171 .037 2.383 .017
Dummy_Nieuw_West -.610 .141 -.065 -4.327 .000
Dummy_West -.163 .120 -.019 -1.351 .177
Dummy_Oost -.453 .125 -.048 -3.623 .000
Dummy_Noord -.616 .150 -.067 -4.102 .000
Dummy_Center -.433 .197 -.024 -2.192 .028
a. Dependent Variable: Gas_m² Connections within 100m to existing district heat pipeline:
Descriptive Statistics
N Sum Mean
Aansluitingen 482 38580 80,04
Valid N (listwise) 482
48
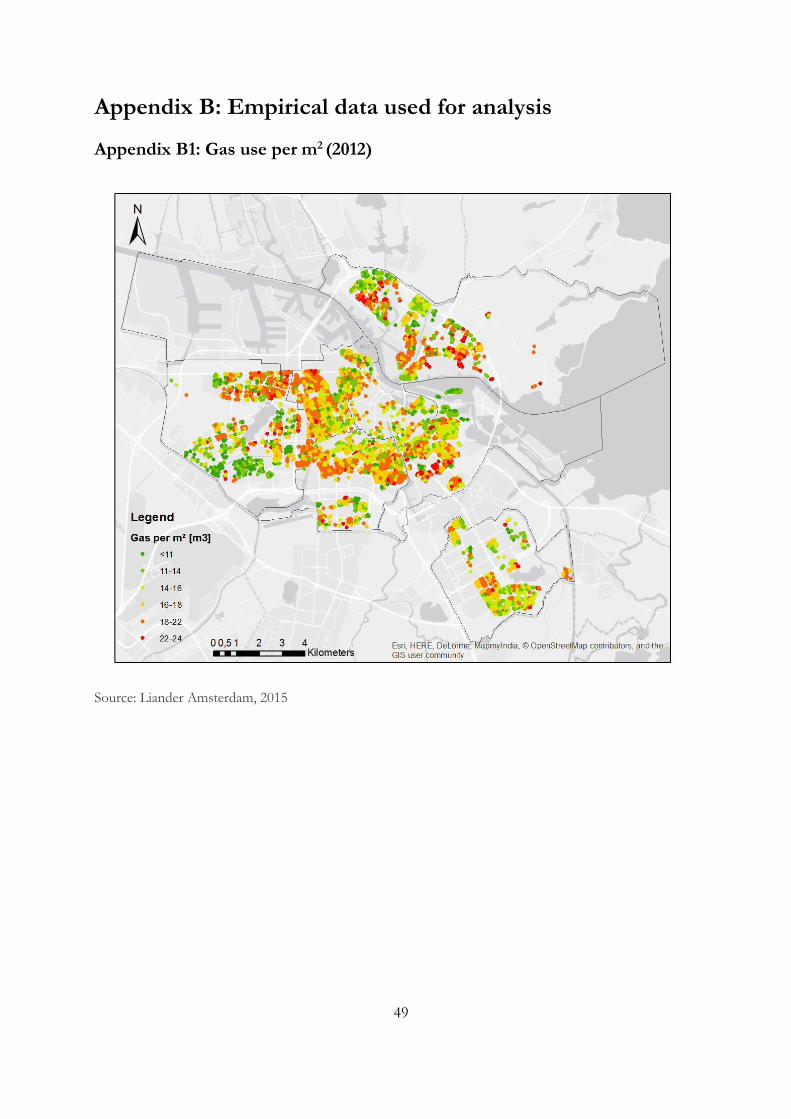
Appendix B: Empirical data used for analysis
Appendix B1: Gas use per m2 (2012)
Source: Liander Amsterdam, 2015
49

Appendix B2: Percentage of elderly
Source: CBS (Statistics Netherlands), 2015
50

Appendix B3: Population density (OAD2010)
Source: CBS (Statistics Netherlands), 2015
51

Appendix B4: Building age (after 1965)
Source: BAG dataset (Basisregistraties Adressen en Gebouwen); Dutch Cadastral Register, 2015
52

Appendix B5: Average monthly income
Source: CBS (Statistics Netherlands), 2015
53

Appendix B6: Model prediction of gas use per m2
54

Curriculum Vitae
Frithjof Laubinger Date of Birth: 02-07-1992 Contact: [email protected]
Education Degree: Honors Bachelor of Science degree in the Liberal Arts and Sciences
Amsterdam University College Field of study: Sciences: Environmental Science
Duration: September 2012 – June 2015 (expected)
Notable Classes:
• Energy, Climate and Sustainability (Dr M. van Drunen, Dr. Ir. B. Verheggen, AUC)
• Environmental Law and Policy (Dr. T. Etty, AUC)
• Urban Environment Lab (Dr. E. Koomen, VU Amsterdam)
• Land Use Change (D. E. Koomen, VU Amsterdam)
• Sustainable City (Dr. P. Mulder, VU Amsterdam)
• Environmental Economics (Dr. E.H. Ansink, VU Amsterdam)
• Environment, Sustainability and Ecotourism (Dr. D. Whiley, University of Queensland, Australia)
• Academic English (D. M. Van Der Heijden, W. Geary, AUC)
• Introduction to GIS (Dr. A.C. Seijmonsbergen, University of Amsterdam)
• Basic Research Methods and Statistics (Dr. C. Zonneveld, AUC)
55
Related Documents