A Biotic Index for the Southeastern United States: Derivation and List of Tolerance Values, with Criteria for Assigning Water-Quality Ratings Author(s): David R. Lenat Source: Journal of the North American Benthological Society, Vol. 12, No. 3 (Sep., 1993), pp. 279-290 Published by: Society for Freshwater Science Stable URL: http://www.jstor.org/stable/1467463 . Accessed: 18/09/2014 17:13 Your use of the JSTOR archive indicates your acceptance of the Terms & Conditions of Use, available at . http://www.jstor.org/page/info/about/policies/terms.jsp . JSTOR is a not-for-profit service that helps scholars, researchers, and students discover, use, and build upon a wide range of content in a trusted digital archive. We use information technology and tools to increase productivity and facilitate new forms of scholarship. For more information about JSTOR, please contact [email protected]. . Society for Freshwater Science is collaborating with JSTOR to digitize, preserve and extend access to Journal of the North American Benthological Society. http://www.jstor.org This content downloaded from 163.178.101.228 on Thu, 18 Sep 2014 17:13:21 PM All use subject to JSTOR Terms and Conditions

Welcome message from author
This document is posted to help you gain knowledge. Please leave a comment to let me know what you think about it! Share it to your friends and learn new things together.
Transcript
A Biotic Index for the Southeastern United States: Derivation and List of Tolerance Values,with Criteria for Assigning Water-Quality RatingsAuthor(s): David R. LenatSource: Journal of the North American Benthological Society, Vol. 12, No. 3 (Sep., 1993), pp.279-290Published by: Society for Freshwater ScienceStable URL: http://www.jstor.org/stable/1467463 .
Accessed: 18/09/2014 17:13
Your use of the JSTOR archive indicates your acceptance of the Terms & Conditions of Use, available at .http://www.jstor.org/page/info/about/policies/terms.jsp
.JSTOR is a not-for-profit service that helps scholars, researchers, and students discover, use, and build upon a wide range ofcontent in a trusted digital archive. We use information technology and tools to increase productivity and facilitate new formsof scholarship. For more information about JSTOR, please contact [email protected].
.
Society for Freshwater Science is collaborating with JSTOR to digitize, preserve and extend access to Journalof the North American Benthological Society.
http://www.jstor.org
This content downloaded from 163.178.101.228 on Thu, 18 Sep 2014 17:13:21 PMAll use subject to JSTOR Terms and Conditions
J. N. Am. Benthol. Soc., 1993, 12(3):279-290 ? 1993 by The North American Benthological Society
A biotic index for the southeastern United States: derivation and list of tolerance values, with criteria for assigning
water-quality ratings
DAVID R. LENAT
North Carolina Division of Environmental Management, Water Quality Section, 4401 Reedy Creek Road, Raleigh, North Carolina 27607 USA
Abstract. North Carolina's Division of Environmental Management has a large number of semi- quantitative stream macroinvertebrate collections that have been assigned water-quality ratings. These semiquantitative data use abundance values of Rare = 1, Common = 3, and Abundant = 10, allowing the calculation of mean abundance (range = 0-10) for each taxon across five water-quality classes. This information was used to derive tolerance values and classification criteria for a south- eastern biotic index. Classification criteria were adjusted for both season and ecoregion, but no corrections were required for stream size. Tolerance values are listed for >500 North Carolina taxa, and are compared with a similar Wisconsin data base.
Key words: biotic index, benthic macroinvertebrates, streams, water quality, pollution, biological monitoring, North Carolina.
Benthic macroinvertebrates are often collect- ed to help evaluate water quality and/or habitat
quality. This task involves collection of repre- sentative samples, accurate taxonomy, and some
system to convert invertebrate data into water-
quality ratings. North American stream ecolo-
gists have struggled to establish such ratings for over 50 years, and a bewildering array of methods have been proposed (Cairns and Pratt
1993). Currently, more than one type of data
summary (metric) is often used to summarize invertebrate data, with a final evaluation of wa- ter quality based on several independent meth- ods. Many of the proposed metrics, however, are applicable only to a particular type of col- lection, a single habitat, or a single geographic area.
The most widely used metrics are taxa rich- ness and "biotic indices". Taxa richness is as- sumed to be inversely related to the degree of stress, whereas biotic indices attempt to sum- marize information on the tolerance of the mac- roinvertebrate community. The North Carolina
(NC) Division of Environmental Management (DEM) uses taxa richness of the most intolerant invertebrate groups (Ephemeroptera + Plecop- tera + Trichoptera, or "EPT") and a biotic index similar to that of Hilsenhoff (1987). Both metrics are weighted equally in assigning water-quality ratings (NC DEM 1992). We have invested sub- stantial efforts in testing and evaluating both methods, both in deriving criteria and in mak- ing adjustments for the effects of ecoregions,
stream size, and season. The EPT taxa richness criteria have been in use for many years, but we have only recently derived biotic index cri- teria. This paper describes the method used to
produce the North Carolina Biotic Index (NCBI) and gives tolerance values for taxa in south- eastern USA. The emphasis was on the objective derivation of tolerance values, because other
investigators have already demonstrated the
utility and accuracy of a biotic index (Chutter 1972, Hilsenhoff 1982, 1987, 1988, Narf et al. 1984, Jones et al. 1981).
The first North Carolina biotic index was es- tablished in 1980, using "expert opinions" to
assign tolerance values for each taxon. Trial val- ues were assigned by NC DEM biologists, and
adjusted following discussion at a meeting of benthic ecologists from North Carolina, South Carolina and Georgia. This index (with poten- tial values ranging from 0-5) was modeled on that of Hilsenhoff (1977), which was, in turn, derived from Chutter's (1972) index:
Sum TV,N, Total N
where TV, is the tolerance value of the ith taxa, N, is the abundance of the ith taxa, and Total N is the number of individuals in the sample. Total N may be based on either actual densities (No./m2, etc.) or abundance categories (see Methods).
Ideally, such an index would be used to target specific kinds of stress. For example, a species
279
This content downloaded from 163.178.101.228 on Thu, 18 Sep 2014 17:13:21 PMAll use subject to JSTOR Terms and Conditions
D. R. LENAT
might be sensitive to metal toxicity, but tolerant of low dissolved oxygen. Rather than a single index, an array of indices would be used to assess water quality and/or habitat quality. Un-
fortunately, this level of information for species tolerance is not available. Dr. Hilsenhoff tar-
geted his index at organic pollution, although it is used by other investigators to look at many other kinds of stress. The NCBI is intended for examination of the general level of pollution, regardless of source.
The utility and accuracy of such an index is
only as good as the system used to derive the tolerance values. The use of expert opinion val- ues proved to be unreliable in North Carolina, as biotic index ratings frequently conflicted with
ratings from EPT taxa richness values or ratings based on professional judgment. Unbiased as-
signment of tolerance values requires a large number of invertebrate collections that have
already received some kind of water-quality rat-
ing. To my knowledge, only Hilsenhoff (1987) has used such a method to derive tolerance val- ues. Other lists of invertebrate tolerance in use within the United States are modifications of Hilsenhoff's list with "expert opinion" modi- fications for taxa not found in Wisconsin. North Carolina biologists saw a need for indepen- dently deriving tolerance values for southeast- ern species, as well as deriving criteria for biotic index values that could be adjusted for differ- ences in ecoregion, season, and stream size.
Methods
The NC DEM has a data set of >2000 mac- roinvertebrate stream samples collected during water-quality surveys between 1983 and 1992. These samples have been assigned to five water-
quality categories (bioclassifications): Poor (n =
299), Fair (n = 392), Good-Fair (n = 481), Good
(n = 492), and Excellent (n = 424); they include both standardized qualitative samples (Lenat 1988) and collections limited to Ephemeroptera, Plecoptera, and Trichoptera (Eaton and Lenat 1991). Classification is based on EPT taxa rich- ness and an earlier version of the NCBI.
A variety of information is associated with each sample, including ecoregion, date, and stream size. The abundance information for each taxon is semiquantitative, being tabulated as ei- ther Rare (1-2/sample), Common (3-9/sample) or Abundant (>10/sample), and it is coded in
the computer system, respectively, as 1, 3 or 10. Calculations of mean abundance for this study also included zero values, since I used all sam- ples in a particular water-quality category, not just samples where this taxon occurred. Similar abundance categories are used with the Chan- dler Score, a European biotic index (Chandler 1970).
The primary measurement used to compute the tolerance value for any taxon was the av-
erage abundance (range = 0-10) in each water-
quality category. I computed how far each taxon
(starting from Excellent) extended into the areas of poorer water quality. The abundance values (by water-quality category) were converted into cumulative percentiles and graphed vs. the wa-
ter-quality score (1 = Excellent, 2 = Good, 3 = Good-Fair, 4 = Fair, 5 = Poor). I tried a 50th percentile, a 75th percentile, and a 90th per- centile value; the 75th percentile produced the
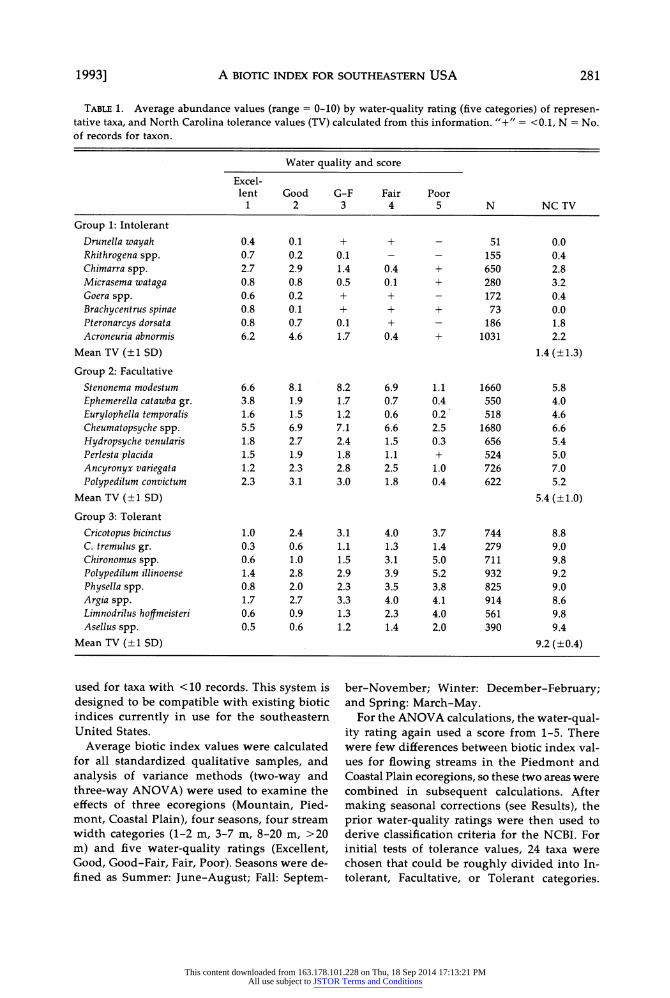
greatest separation of intolerant and tolerant species (Table 1), while still leaving the facul- tative species with values near the midrange. Calculations of such percentiles usually re-
quired the use of simple linear interpolation between categories. For example, the mean abundance data (number per sample, by water-
quality class) for Cricotopus bicinctus in Table 1 is: Excellent (1): 1.0, Good (2): 2.4, Good-Fair (3): 3.1, Fair (4): 4.0, and Poor (5): 3.7. Convert- ing these abundance values to a cumulative per- centage produces: 7.0, 23.9, 45.8, 73.9, 100.0. This indicates that the 75th percentile for the water-
quality score lies between Fair (4) and Poor (5) and yields by interpolation a value of 4.04.
This procedure produced a range of prelim- inary tolerance values generally between 1.0 and 4.5, but the desired range (to be comparable with Hilsenhoff 1987) was 0-10. If the 1-4.5
range is graphed vs. the 0-10 range (with 1 and 4.5 being the x and y intercepts), a conversion formula for tolerance value (TV) is derived:
Final TV = 2(1.43 x Preliminary TV - 1.43).
The 75th percentile technique was best suited for taxa with substantial amounts of data. If only a few data points were available, then the 75th percentile value often was too high. Review of our data base suggested that the 75th percentile was suitable for taxa with at least 25 observa- tions (out of the 2000 samples). For taxa with
only 10-24 collections, a 50th percentile was used, and the old "expert opinion" values were
280 [Volume 12
This content downloaded from 163.178.101.228 on Thu, 18 Sep 2014 17:13:21 PMAll use subject to JSTOR Terms and Conditions
A BIOTIC INDEX FOR SOUTHEASTERN USA
TABLE 1. Average abundance values (range = 0-10) by water-quality rating (five categories) of represen- tative taxa, and North Carolina tolerance values (TV) calculated from this information. "+" = <0.1, N = No. of records for taxon.
Water quality and score
Excel- lent Good G-F Fair Poor
1 2 3 4 5 N NC TV
Group 1: Intolerant
Drunella wayah Rhithrogena spp. Chimarra spp. Micrasema wataga Goera spp. Brachycentrus spinae Pteronarcys dorsata Acroneuria abnormis
Mean TV (?1 SD)
Group 2: Facultative
Stenonema modestum
Ephemerella catawba gr. Eurylophella temporalis Cheumatopsyche spp. Hydropsyche venularis Perlesta placida Ancyronyx variegata Polypedilum convictum
Mean TV (?1 SD)
Group 3: Tolerant
Cricotopus bicinctus C. tremulus gr. Chironomus spp. Polypedilum illinoense
Physella spp. Argia spp. Limnodrilus hoffmeisteri Asellus spp.
Mean TV (?1 SD)
0.4 0.7 2.7 0.8 0.6 0.8 0.8 6.2
6.6 3.8 1.6 5.5 1.8 1.5 1.2 2.3
1.0 0.3 0.6 1.4 0.8 1.7 0.6 0.5
0.1 0.2 2.9 0.8 0.2 0.1 0.7 4.6
8.1 1.9 1.5 6.9 2.7 1.9 2.3 3.1
2.4 0.6 1.0 2.8 2.0 2.7 0.9 0.6
+ 0.1 1.4 0.5 + +
0.1 1.7
8.2 1.7 1.2 7.1 2.4 1.8 2.8 3.0
3.1 1.1 1.5 2.9 2.3 3.3 1.3 1.2
+
0.4 0.1 + + +
0.4
6.9 0.7 0.6 6.6 1.5 1.1 2.5 1.8
4.0 1.3 3.1 3.9 3.5 4.0 2.3 1.4
- 51 - 155
+ 650 + 280
- 172 + 73
186 + 1031
1.1 0.4 0.2 2.5 0.3 + 1.0 0.4
3.7 1.4 5.0 5.2 3.8 4.1 4.0 2.0
1660 550 518
1680 656 524 726 622
744 279 711 932 825 914 561 390
0.0 0.4 2.8 3.2 0.4 0.0 1.8 2.2
1.4 (+1.3)
5.8 4.0 4.6 6.6 5.4 5.0 7.0 5.2
5.4 (?1.0)
8.8 9.0 9.8 9.2 9.0 8.6 9.8 9.4
9.2 (?0.4)
used for taxa with <10 records. This system is designed to be compatible with existing biotic indices currently in use for the southeastern United States.
Average biotic index values were calculated for all standardized qualitative samples, and analysis of variance methods (two-way and three-way ANOVA) were used to examine the effects of three ecoregions (Mountain, Pied- mont, Coastal Plain), four seasons, four stream width categories (1-2 m, 3-7 m, 8-20 m, >20 m) and five water-quality ratings (Excellent, Good, Good-Fair, Fair, Poor). Seasons were de- fined as Summer: June-August; Fall: Septem-
ber-November; Winter: December-February; and Spring: March-May.
For the ANOVA calculations, the water-qual- ity rating again used a score from 1-5. There were few differences between biotic index val- ues for flowing streams in the Piedmont and Coastal Plain ecoregions, so these two areas were combined in subsequent calculations. After making seasonal corrections (see Results), the prior water-quality ratings were then used to derive classification criteria for the NCBI. For initial tests of tolerance values, 24 taxa were chosen that could be roughly divided into In- tolerant, Facultative, or Tolerant categories.
1993] 281
This content downloaded from 163.178.101.228 on Thu, 18 Sep 2014 17:13:21 PMAll use subject to JSTOR Terms and Conditions
D. R. LENAT
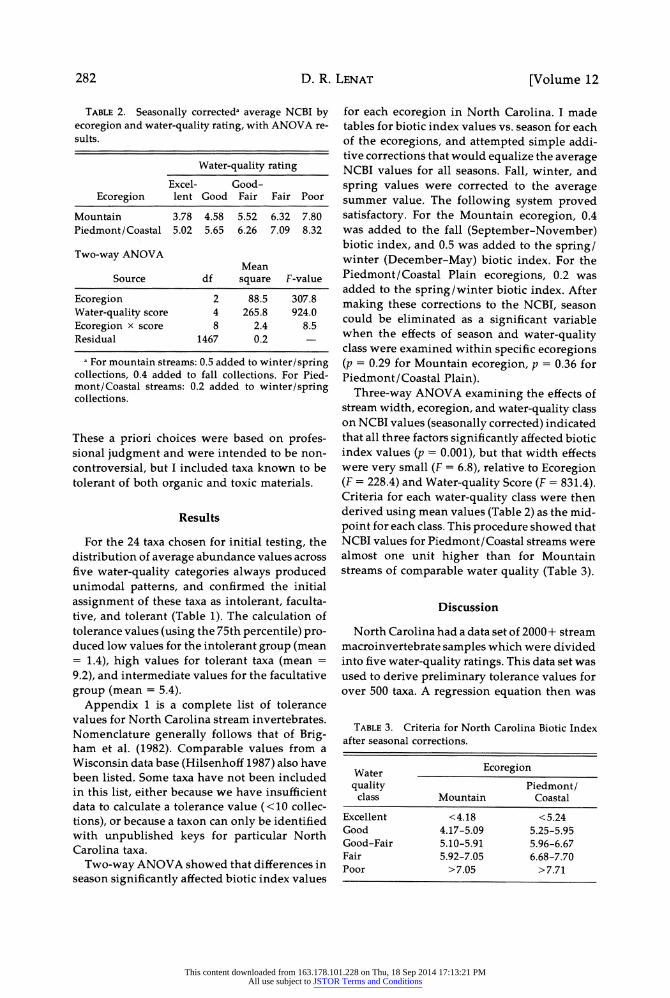
TABLE 2. Seasonally correcteda average NCBI by ecoregion and water-quality rating, with ANOVA re- sults.
Water-quality rating
Excel- Good- Ecoregion lent Good Fair Fair Poor
Mountain 3.78 4.58 5.52 6.32 7.80 Piedmont/Coastal 5.02 5.65 6.26 7.09 8.32
Two-way ANOVA Mean
Source df square F-value
Ecoregion 2 88.5 307.8
Water-quality score 4 265.8 924.0
Ecoregion x score 8 2.4 8.5 Residual 1467 0.2 -
a For mountain streams: 0.5 added to winter/spring collections, 0.4 added to fall collections. For Pied- mont/Coastal streams: 0.2 added to winter/spring collections.
These a priori choices were based on profes- sional judgment and were intended to be non- controversial, but I included taxa known to be tolerant of both organic and toxic materials.
Results
For the 24 taxa chosen for initial testing, the distribution of average abundance values across five water-quality categories always produced unimodal patterns, and confirmed the initial
assignment of these taxa as intolerant, faculta- tive, and tolerant (Table 1). The calculation of tolerance values (using the 75th percentile) pro- duced low values for the intolerant group (mean = 1.4), high values for tolerant taxa (mean =
9.2), and intermediate values for the facultative
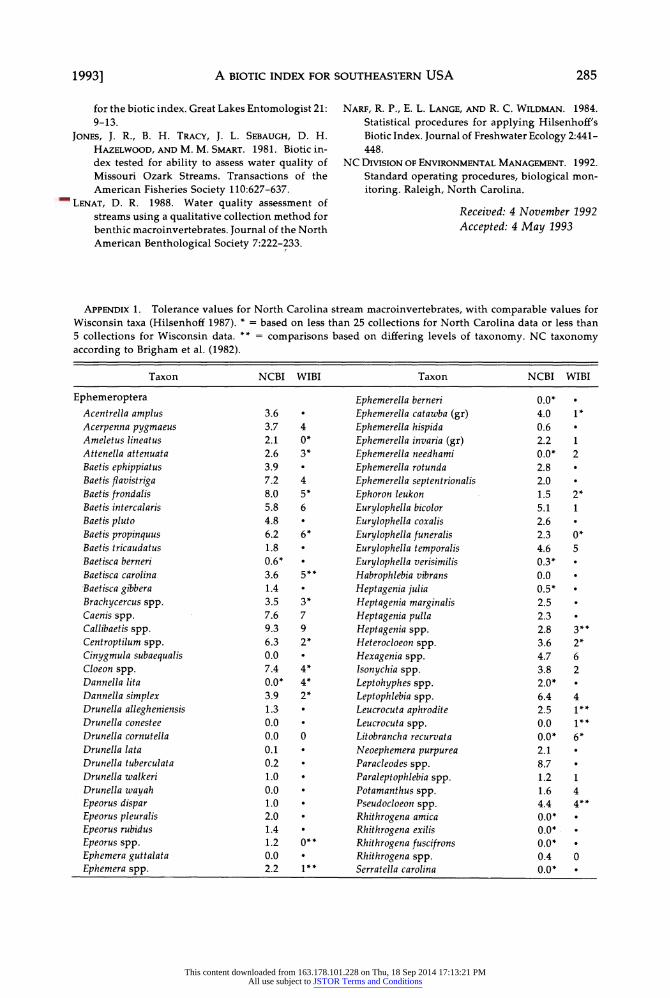
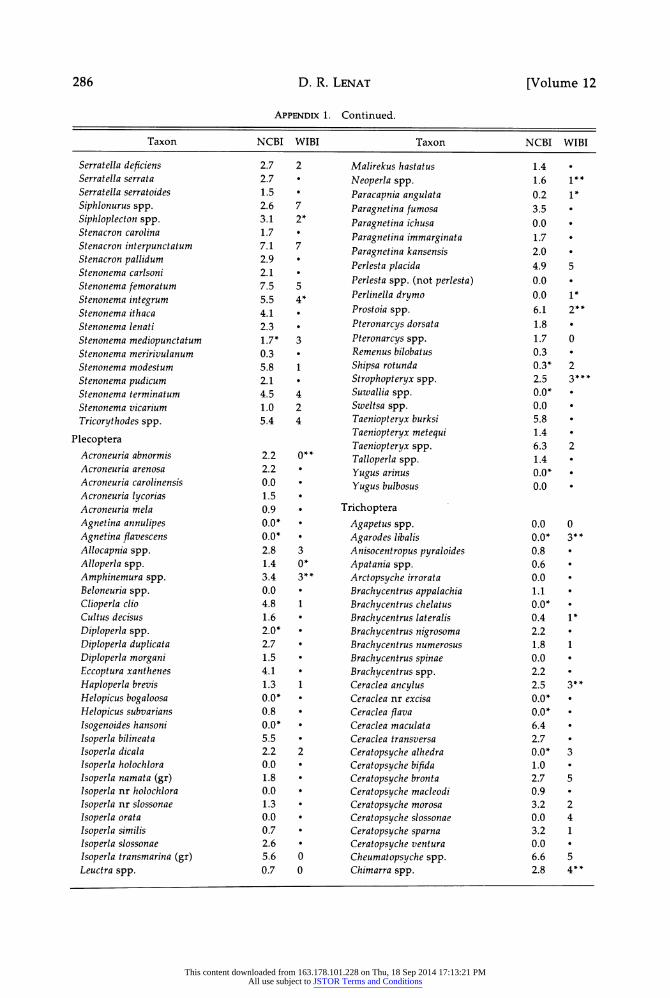
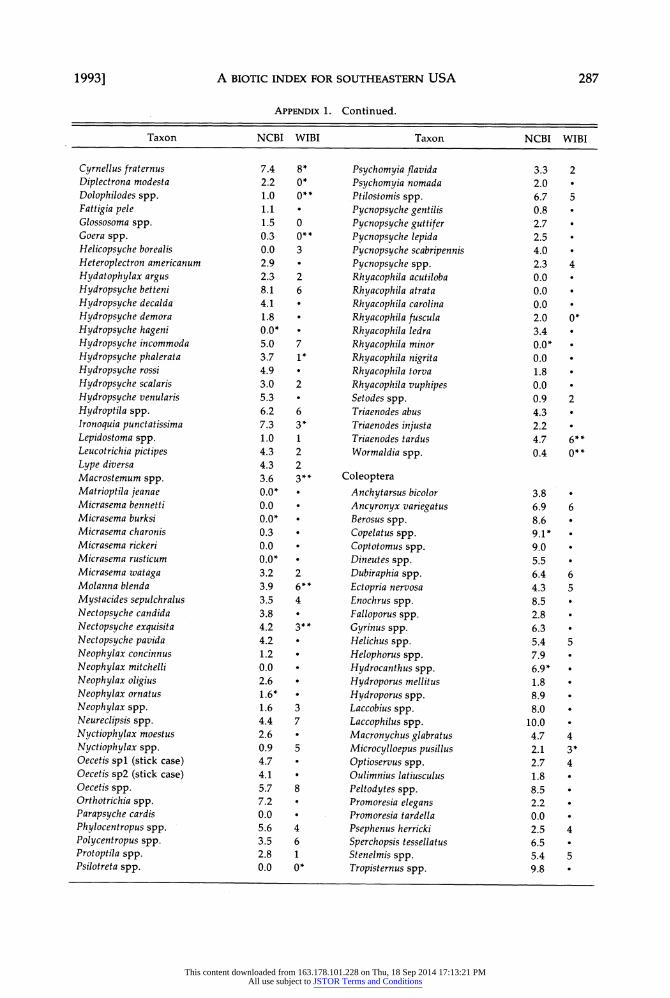
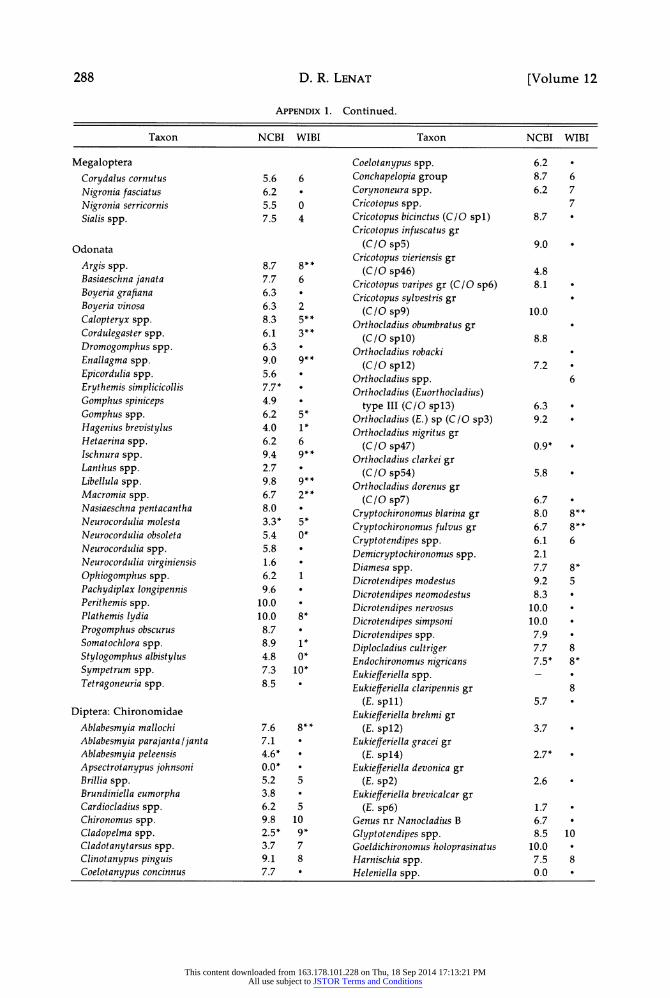
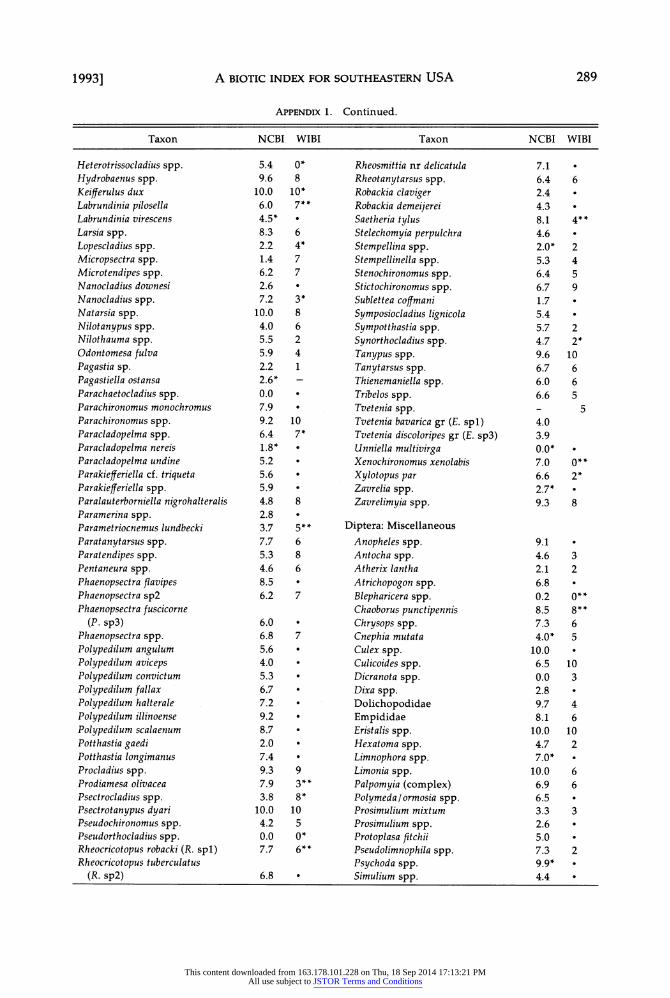
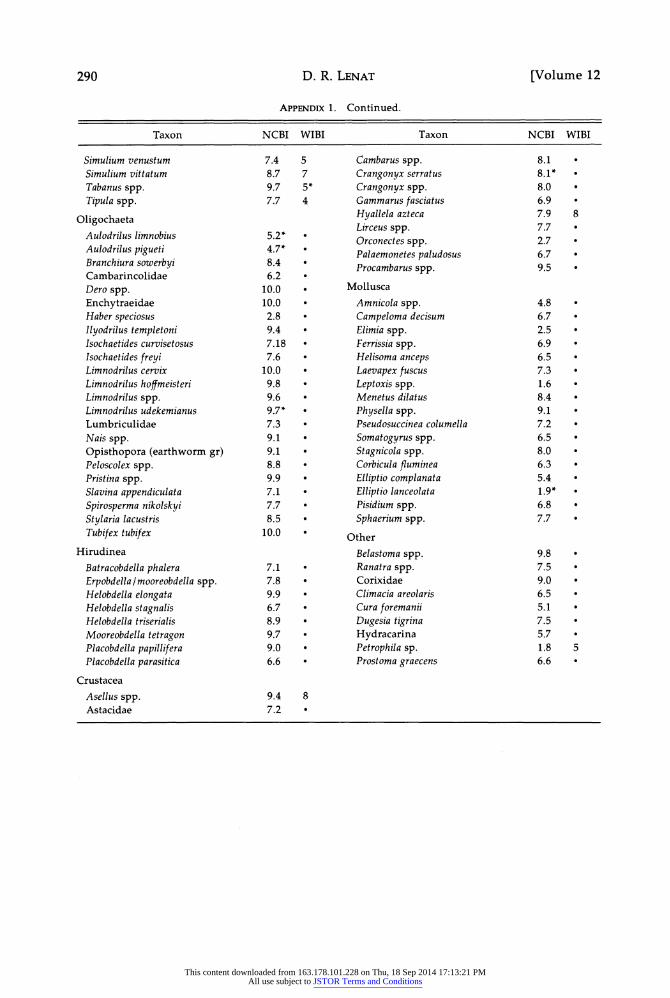
group (mean = 5.4). Appendix 1 is a complete list of tolerance
values for North Carolina stream invertebrates. Nomenclature generally follows that of Brig- ham et al. (1982). Comparable values from a Wisconsin data base (Hilsenhoff 1987) also have been listed. Some taxa have not been included in this list, either because we have insufficient data to calculate a tolerance value (<10 collec- tions), or because a taxon can only be identified with unpublished keys for particular North Carolina taxa.
Two-way ANOVA showed that differences in season significantly affected biotic index values
for each ecoregion in North Carolina. I made tables for biotic index values vs. season for each of the ecoregions, and attempted simple addi- tive corrections that would equalize the average NCBI values for all seasons. Fall, winter, and spring values were corrected to the average summer value. The following system proved satisfactory. For the Mountain ecoregion, 0.4 was added to the fall (September-November) biotic index, and 0.5 was added to the spring/ winter (December-May) biotic index. For the Piedmont/Coastal Plain ecoregions, 0.2 was added to the spring/winter biotic index. After making these corrections to the NCBI, season could be eliminated as a significant variable when the effects of season and water-quality class were examined within specific ecoregions (p = 0.29 for Mountain ecoregion, p = 0.36 for Piedmont/Coastal Plain).
Three-way ANOVA examining the effects of stream width, ecoregion, and water-quality class on NCBI values (seasonally corrected) indicated that all three factors significantly affected biotic index values (p = 0.001), but that width effects were very small (F = 6.8), relative to Ecoregion (F = 228.4) and Water-quality Score (F = 831.4). Criteria for each water-quality class were then derived using mean values (Table 2) as the mid- point for each class. This procedure showed that NCBI values for Piedmont/Coastal streams were almost one unit higher than for Mountain streams of comparable water quality (Table 3).
Discussion
North Carolina had a data set of 2000+ stream macroinvertebrate samples which were divided into five water-quality ratings. This data set was used to derive preliminary tolerance values for over 500 taxa. A regression equation then was
TABLE 3. Criteria for North Carolina Biotic Index after seasonal corrections.
Water Ecoregion quality Piedmont/
class Mountain Coastal
Excellent <4.18 <5.24 Good 4.17-5.09 5.25-5.95 Good-Fair 5.10-5.91 5.96-6.67 Fair 5.92-7.05 6.68-7.70 Poor >7.05 >7.71
282 [Volume 12
This content downloaded from 163.178.101.228 on Thu, 18 Sep 2014 17:13:21 PMAll use subject to JSTOR Terms and Conditions
A BIOTIC INDEX FOR SOUTHEASTERN USA
used to stretch the initial range of water-quality scores (1-4.5) to a 0-10 range (NCBI). I then tested for the effects of season, stream size, and
ecoregion on NCBI. Simple additive seasonal corrections were derived, correcting spring, fall and winter values to the mean summer NCBI values. Stream size did not have a large effect on NCBI values (relative to ecoregion and water
quality), but Piedmont/Coastal streams had NCBI values about one unit higher than Moun- tain streams (Table 2).
Hilsenhoff (1987) used similar procedures to derive tolerance values for Wisconsin streams from a data set of 2000+ invertebrate collec- tions. His initial tolerance values were based on
expert opinion, but were later modified based on the mean biotic index value for sites where
any given taxon was collected. This procedure produced a range of values from 1.4-3.9 on a
possible scale of 0-5 (W. L. Hilsenhoff, Univer-
sity of Wisconsin, personal communication). These numbers were then "stretched" to cover the entire range of a 0-10 scale. Dr. Hilsenhoff's values, however, were based on means, while the NC values used a 75th percentile figure. Furthermore, the Hilsenhoff Biotic Index (HBI) was only intended to monitor organic pollu- tion, while the NCBI measures any stress that either lowers EPT taxa richness or promotes the
development of tolerant species. The North Carolina tolerance values func-
tioned well to separate examples of intolerant, facultative, and tolerant taxa (24 taxa: Table 1). Comparisons of these tolerance values with Hil- senhoff's (1987) data were complicated by a number of problems. Sometimes no comparable values could be found (3 taxa), sometimes com-
parisons could only be made by using different
species in the same genus (2 taxa), and some- times tolerance values were listed at a species level in one data set, but at the generic level in the other data set (9 taxa). Using the most com-
parable information from the Wisconsin data set, mean tolerance values for the Intolerant, Facultative and Tolerant groups in Table 1 were 0.6, 4.1, and 6.1. Although the trend for the mean tolerance values is similar to the North Carolina data (Table 1), the values for the Tol- erant examples showed considerable difference: 6.1 vs. 9.2.
Some species had North Carolina populations that were rated as more tolerant than compa- rable Wisconsin populations. For example, the
mayfly flies Stenonema modestum and species in the Ephemerella catawba group are fairly tolerant, abundant, and widespread in North Carolina. Wisconsin data, however, had suggested that these are very intolerant species. It is possible that these "populations" actually are different
species that are not separable with current tax- onomic keys. These problems illustrate the per- ils of using a biotic index outside its intended
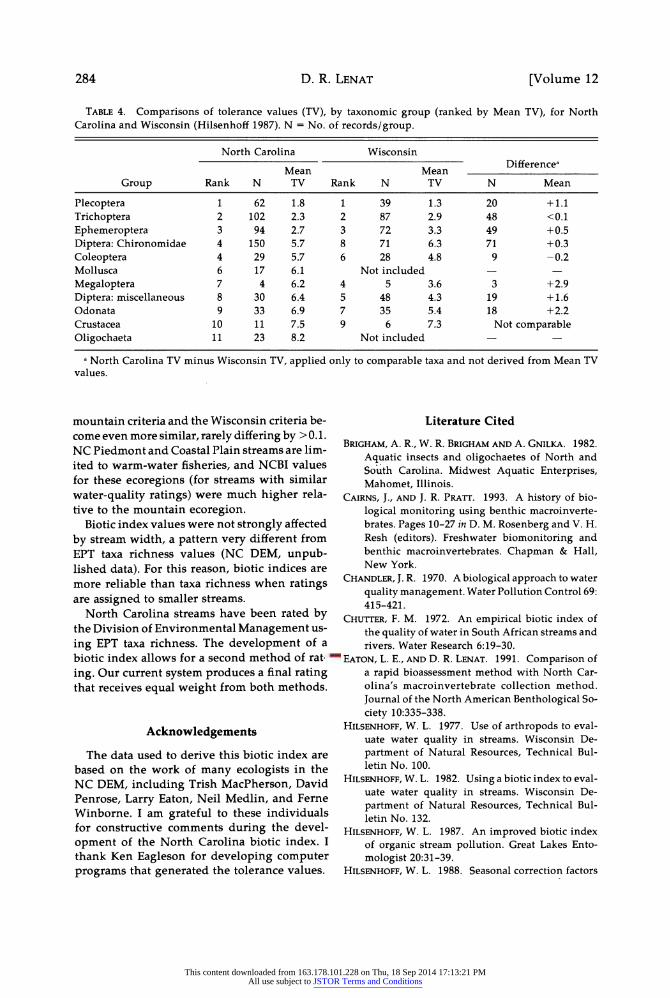
geographic range. Mean tolerance values for the major taxonom-
ic groups were similar for the North Carolina and Wisconsin data sets (Table 4). In particular, both the tolerance values and the rankings for
Ephemeroptera, Plecoptera and Trichoptera were very close. Chironomidae (as a group) were ranked somewhat differently for the two data sets, but comparable taxa were often similar in their tolerance values. The greatest between-
region differences occurred for Megaloptera and Odonata.
Some of the differences between North Car- olina and Wisconsin tolerance values may re- flect differences in collection methods. The Wis- consin samples were limited to riffle samples, whereas North Carolina uses multiple-habitat collection methods. More slow-water species (especially Odonata) would occur in the mul- tiple-habitat collections, and possibly affect the
assignment of tolerance values. Both our data and Hilsenhoff's data showed
that biotic index values vary with season. Hil- senhoff's values are standardized for spring and fall collections, with a subtraction of 0.5 during summer months (Hilsenhoff 1988). North Car- olina data, however, are standardized for sum- mer collections, with some corrections for other periods of the year. For mountain streams, I have suggested adding 0.4-0.5 during non- summer months, similar to the corrections pro- posed for Wisconsin streams. During periods of expected change (late spring, fall), stream rat- ings should be made with caution.
Biotic index values also appear to vary with ecoregion. This may be related to differences in stream temperature, although other variables also may affect between-ecoregion differences. North Carolina mountain streams and Hilsen- hoff's Wisconsin streams had similar criteria ranges; both areas support cold-water fish spe- cies (especially trout). If the Wisconsin data are seasonally corrected for summer collections (subtract 0.5, Hilsenhoff 1988), then the NC
1993] 283
This content downloaded from 163.178.101.228 on Thu, 18 Sep 2014 17:13:21 PMAll use subject to JSTOR Terms and Conditions
D. R. LENAT
TABLE 4. Comparisons of tolerance values (TV), by taxonomic group (ranked by Mean TV), for North Carolina and Wisconsin (Hilsenhoff 1987). N = No. of records/group.
North Carolina Wisconsin Differencea
Mean Mean Group Rank N TV Rank N TV N Mean
Plecoptera 1 62 1.8 1 39 1.3 20 +1.1
Trichoptera 2 102 2.3 2 87 2.9 48 <0.1
Ephemeroptera 3 94 2.7 3 72 3.3 49 +0.5
Diptera: Chironomidae 4 150 5.7 8 71 6.3 71 +0.3
Coleoptera 4 29 5.7 6 28 4.8 9 -0.2 Mollusca 6 17 6.1 Not included - -
Megaloptera 7 4 6.2 4 5 3.6 3 +2.9
Diptera: miscellaneous 8 30 6.4 5 48 4.3 19 +1.6 Odonata 9 33 6.9 7 35 5.4 18 +2.2 Crustacea 10 11 7.5 9 6 7.3 Not comparable Oligochaeta 11 23 8.2 Not included
a North Carolina TV minus Wisconsin TV, applied only to comparable taxa and not derived from Mean TV values.
mountain criteria and the Wisconsin criteria be- come even more similar, rarely differing by > 0.1. NC Piedmont and Coastal Plain streams are lim- ited to warm-water fisheries, and NCBI values for these ecoregions (for streams with similar
water-quality ratings) were much higher rela- tive to the mountain ecoregion.
Biotic index values were not strongly affected
by stream width, a pattern very different from EPT taxa richness values (NC DEM, unpub- lished data). For this reason, biotic indices are more reliable than taxa richness when ratings are assigned to smaller streams.
North Carolina streams have been rated by the Division of Environmental Management us-
ing EPT taxa richness. The development of a biotic index allows for a second method of rat-
ing. Our current system produces a final rating that receives equal weight from both methods.
Acknowledgements
The data used to derive this biotic index are based on the work of many ecologists in the NC DEM, including Trish MacPherson, David Penrose, Larry Eaton, Neil Medlin, and Ferne Winborne. I am grateful to these individuals for constructive comments during the devel-
opment of the North Carolina biotic index. I thank Ken Eagleson for developing computer programs that generated the tolerance values.
Literature Cited
BRIGHAM, A. R., W. R. BRIGHAM AND A. GNILKA. 1982.
Aquatic insects and oligochaetes of North and South Carolina. Midwest Aquatic Enterprises, Mahomet, Illinois.
CAIRNS, J., AND J. R. PRATT. 1993. A history of bio-
logical monitoring using benthic macroinverte- brates. Pages 10-27 in D. M. Rosenberg and V. H. Resh (editors). Freshwater biomonitoring and benthic macroinvertebrates. Chapman & Hall, New York.
CHANDLER, J. R. 1970. A biological approach to water
quality management. Water Pollution Control 69: 415-421.
CHUTTER, F. M. 1972. An empirical biotic index of the quality of water in South African streams and rivers. Water Research 6:19-30.
EATON, L. E., AND D. R. LENAT. 1991. Comparison of a rapid bioassessment method with North Car- olina's macroinvertebrate collection method. Journal of the North American Benthological So-
ciety 10:335-338. HILSENHOFF, W. L. 1977. Use of arthropods to eval-
uate water quality in streams. Wisconsin De-
partment of Natural Resources, Technical Bul- letin No. 100.
HILSENHOFF, W. L. 1982. Using a biotic index to eval- uate water quality in streams. Wisconsin De-
partment of Natural Resources, Technical Bul- letin No. 132.
HILSENHOFF, W. L. 1987. An improved biotic index of organic stream pollution. Great Lakes Ento-
mologist 20:31-39. HILSENHOFF, W. L. 1988. Seasonal correction factors
284 [Volume 12
This content downloaded from 163.178.101.228 on Thu, 18 Sep 2014 17:13:21 PMAll use subject to JSTOR Terms and Conditions
A BIOTIC INDEX FOR SOUTHEASTERN USA
for the biotic index. Great Lakes Entomologist 21: 9-13.
JONES, J. R., B. H. TRACY, J. L. SEBAUGH, D. H. HAZELWOOD, AND M. M. SMART. 1981. Biotic in- dex tested for ability to assess water quality of Missouri Ozark Streams. Transactions of the American Fisheries Society 110:627-637.
LENAT, D. R. 1988. Water quality assessment of streams using a qualitative collection method for benthic macroinvertebrates. Journal of the North American Benthological Society 7:222-233.
NARF, R. P., E. L. LANGE, AND R. C. WILDMAN. 1984.
Statistical procedures for applying Hilsenhoff's Biotic Index. Journal of Freshwater Ecology 2:441- 448.
NC DIVISION OF ENVIRONMENTAL MANAGEMENT. 1992. Standard operating procedures, biological mon-
itoring. Raleigh, North Carolina.
Received: 4 November 1992
Accepted: 4 May 1993
APPENDIX 1. Tolerance values for North Carolina stream macroinvertebrates, with comparable values for Wisconsin taxa (Hilsenhoff 1987). * = based on less than 25 collections for North Carolina data or less than 5 collections for Wisconsin data. ** = comparisons based on differing levels of taxonomy. NC taxonomy according to Brigham et al. (1982).
Taxon NCBI WIBI Taxon NCBI WIBI
Ephemeroptera Acentrella amplus Acerpenna pygmaeus Ameletus lineatus Attenella attenuata Baetis ephippiatus Baetis flavistriga Baetis frondalis Baetis intercalaris Baetis pluto Baetis propinquus Baetis tricaudatus Baetisca berneri Baetisca carolina Baetisca gibbera Brachycercus spp. Caenis spp. Callibaetis spp. Centroptilum spp. Cinygmula subaequalis Cloeon spp. Dannella lita Dannella simplex Drunella allegheniensis Drunella conestee Drunella cornutella Drunella lata Drunella tuberculata Drunella walkeri Drunella wayah Epeorus dispar Epeorus pleuralis Epeorus rubidus
Epeorus spp. Ephemera guttalata Ephemera spp.
3.6 3.7 2.1 2.6 3.9 7.2 8.0 5.8 4.8 6.2 1.8 0.6* 3.6 1.4 3.5 7.6 9.3 6.3 0.0 7.4 0.0* 3.9 1.3 0.0 0.0 0.1 0.2 1.0 0.0 1.0 2.0 1.4 1.2 0.0 2.2
4 0* 3*
4 5* 6
6*
5**
3* 7 9 2*
4* 4* 2*
0
0**
1**
Ephemerella berneri
Ephemerella catawba (gr) Ephemerella hispida Ephemerella invaria (gr) Ephemerella needhami
Ephemerella rotunda
Ephemerella septentrionalis Ephoron leukon
Eurylophella bicolor
Eurylophella coxalis
Eurylophella funeralis Eurylophella temporalis Eurylophella verisimilis
Habrophlebia vibrans
Heptagenia julia Heptagenia marginalis Heptagenia pulla Heptagenia spp. Heterocloeon spp. Hexagenia spp. Isonychia spp. Leptohyphes spp. Leptophlebia spp. Leucrocuta aphrodite Leucrocuta spp. Litobrancha recurvata
Neoephemera purpurea Paracleodes spp. Paraleptophlebia spp. Potamanthus spp. Pseudocloeon spp. Rhithrogena amica
Rhithrogena exilis
Rhithrogena fuscifrons Rhithrogena spp. Serratella carolina
0.0* 4.0 0.6 2.2 0.0* 2.8 2.0 1.5 5.1 2.6 2.3 4.6 0.3* 0.0 0.5* 2.5 2.3 2.8 3.6 4.7 3.8 2.0* 6.4 2.5 0.0 0.0* 2.1 8.7 1.2 1.6 4.4 0.0* 0.0* 0.0* 0.4 0.0*
1*
1 2
2* 1
0* 5
3** 2* 6 2
4 1** 1** 6*
1 4 4**
0
1993] 285
This content downloaded from 163.178.101.228 on Thu, 18 Sep 2014 17:13:21 PMAll use subject to JSTOR Terms and Conditions
D. R. LENAT
APPENDIX 1. Continued.
Taxon NCBI WIBI Taxon NCBI WIBI
Serratella deficiens Serratella serrata Serratella serratoides
Siphlonurus spp. Siphloplecton spp. Stenacron carolina Stenacron interpunctatum Stenacron pallidum Stenonema carlsoni Stenonema femoratum Stenonema integrum Stenonema ithaca Stenonema lenati Stenonema mediopunctatum Stenonema meririvulanum Stenonema modestum Stenonema pudicum Stenonema terminatum Stenonema vicarium
Tricorythodes spp.
Plecoptera Acroneuria abnormis Acroneuria arenosa Acroneuria carolinensis Acroneuria lycorias Acroneuria mela
Agnetina annulipes Agnetina flavescens Allocapnia spp. Alloperla spp. Amphinemura spp. Beloneuria spp. Clioperla clio Cultus decisus
Diploperla spp. Diploperla duplicata Diploperla morgani Eccoptura xanthenes
Haploperla brevis
Helopicus bogaloosa Helopicus subvarians
Isogenoides hansoni
Isoperla bilineata Isoperla dicala
Isoperla holochlora
Isoperla namata (gr) Isoperla nr holochlora
Isoperla nr slossonae
Isoperla orata
Isoperla similis
Isoperla slossonae
Isoperla transmarina (gr) Leuctra spp.
2.7 2 2.7 1.5 2.6 7 3.1 2* 1.7 7.1 7 2.9 2.1 7.5 5 5.5 4* 4.1 2.3 1.7* 3 0.3 5.8 1 2.1 4.5 4 1.0 2 5.4 4
2.2 2.2 0.0 1.5 0.9 0.0* 0.0* 2.8 1.4 3.4 0.0 4.8 1.6 2.0* 2.7 1.5 4.1 1.3 0.0* 0.8 0.0* 5.5 2.2 0.0 1.8 0.0 1.3 0.0 0.7 2.6 5.6 0.7
0**
3 0*
3**
1
1
2
0 0
Malirekus hastatus
Neoperla spp. Paracapnia angulata Paragnetina fumosa Paragnetina ichusa
Paragnetina immarginata Paragnetina kansensis Perlesta placida Perlesta spp. (not perlesta) Perlinella drymo Prostoia spp. Pteronarcys dorsata
Pteronarcys spp. Remenus bilobatus
Shipsa rotunda
Strophopteryx spp. Suwallia spp. Sweltsa spp. Taeniopteryx burksi
Taeniopteryx metequi Taeniopteryx spp. Talloperla spp. Yugus arinus
Yugus bulbosus
Trichoptera
Agapetus spp. Agarodes libalis
Anisocentropus pyraloides Apatania spp. Arctopsyche irrorata
Brachycentrus appalachia Brachycentrus chelatus
Brachycentrus lateralis
Brachycentrus nigrosoma Brachycentrus numerosus
Brachycentrus spinae Brachycentrus spp. Ceraclea ancylus Ceraclea nr excisa Ceraclea flava Ceraclea maculata Ceraclea transversa
Ceratopsyche alhedra
Ceratopsyche bifida Ceratopsyche bronta
Ceratopsyche macleodi
Ceratopsyche morosa
Ceratopsyche slossonae
Ceratopsyche sparna Ceratopsyche ventura
Cheumatopsyche spp. Chimarra spp.
1.4 1.6 0.2 3.5 0.0 1.7 2.0 4.9 0.0 0.0 6.1 1.8 1.7 0.3 0.3* 2.5 0.0* 0.0 5.8 1.4 6.3 1.4 0.0* 0.0
0.0 0.0* 0.8 0.6 0.0 1.1 0.0* 0.4 2.2 1.8 0.0 2.2 2.5 0.0* 0.0* 6.4 2.7 0.0* 1.0 2.7 0.9 3.2 0.0 3.2 0.0 6.6 2.8
1*
1
1*
0
2**
0
2 3**
2
0 3*
1*
1
3*
3
5
2 4 1
5 4**
286 [Volume 12
This content downloaded from 163.178.101.228 on Thu, 18 Sep 2014 17:13:21 PMAll use subject to JSTOR Terms and Conditions
A BIOTIC INDEX FOR SOUTHEASTERN USA
APPENDIX 1. Continued.
Taxon NCBI WIBI Taxon NCBI WIBI
Cyrnellus fraternus Diplectrona modesta
Dolophilodes spp. Fattigia pele Glossosoma spp. Goera spp. Helicopsyche borealis
Heteroplectron americanum
Hydatophylax argus Hydropsyche betteni
Hydropsyche decalda
Hydropsyche demora
Hydropsyche hageni Hydropsyche incommoda
Hydropsyche phalerata Hydropsyche rossi
Hydropsyche scalaris
Hydropsyche venularis
Hydroptila spp. Ironoquia punctatissima Lepidostoma spp. Leucotrichia pictipes Lype diversa Macrostemum spp. Matrioptila jeanae Micrasema bennetti Micrasema burksi Micrasema charonis Micrasema rickeri Micrasema rusticum Micrasema wataga Molanna blenda
Mystacides sepulchralus Nectopsyche candida
Nectopsyche exquisita Nectopsyche pavida Neophylax concinnus
Neophylax mitchelli
Neophylax oligius Neophylax ornatus
Neophylax spp. Neureclipsis spp. Nyctiophylax moestus
Nyctiophylax spp. Oecetis spl (stick case) Oecetis sp2 (stick case) Oecetis spp. Orthotrichia spp. Parapsyche cardis
Phylocentropus spp. Polycentropus spp. Protoptila spp. Psilotreta spp.
7.4 2.2 1.0 1.1 1.5 0.3 0.0 2.9 2.3 8.1 4.1 1.8 0.0* 5.0 3.7 4.9 3.0 5.3 6.2 7.3 1.0 4.3 4.3 3.6 0.0* 0.0 0.0* 0.3 0.0 0.0* 3.2 3.9 3.5 3.8 4.2 4.2 1.2 0.0 2.6 1.6* 1.6 4.4 2.6 0.9 4.7 4.1 5.7 7.2 0.0 5.6 3.5 2.8 0.0
8*
0* 0**
0 0
0**
3
2 6
7 1*
2
6 3* 1 2 2 3**
2 6** 4
3**
3 7
5
8
4 6 1 0*
Psychomyia flavida Psychomyia nomada Ptilostomis spp. Pycnopsyche gentilis Pycnopsyche guttifer Pycnopsyche lepida Pycnopsyche scabripennis Pycnopsyche spp. Rhyacophila acutiloba
Rhyacophila atrata Rhyacophila carolina Rhyacophila fuscula Rhyacophila ledra
Rhyacophila minor
Rhyacophila nigrita Rhyacophila torva
Rhyacophila vuphipes Setodes spp. Triaenodes abus Triaenodes injusta Triaenodes tardus Wormaldia spp.
Coleoptera
Anchytarsus bicolor
Ancyronyx variegatus Berosus spp. Copelatus spp. Coptotomus spp. Dineutes spp. Dubiraphia spp. Ectopria nervosa Enochrus spp. Falloporus spp. Gyrinus spp. Helichus spp. Helophorus spp. Hydrocanthus spp. Hydroporus mellitus Hydroporus spp. Laccobius spp. Laccophilus spp. Macronychus glabratus Microcylloepus pusillus Optioservus spp. Oulimnius latiusculus Peltodytes spp. Promoresia elegans Promoresia tardella Psephenus herricki Sperchopsis tessellatus Stenelmis spp. Tropisternus spp.
3.3 2.0 6.7 0.8 2.7 2.5 4.0 2.3 0.0 0.0 0.0 2.0 3.4 0.0* 0.0 1.8 0.0 0.9 4.3 2.2 4.7 0.4
2
4
0* O*
2
6**
0"*
6
6 5
5
4 3* 4
4
5
3.8 6.9 8.6 9.1* 9.0 5.5 6.4 4.3 8.5 2.8 6.3 5.4 7.9 6.9* 1.8 8.9 8.0
10.0 4.7 2.1 2.7 1.8 8.5 2.2 0.0 2.5 6.5 5.4 9.8
1993] 287
This content downloaded from 163.178.101.228 on Thu, 18 Sep 2014 17:13:21 PMAll use subject to JSTOR Terms and Conditions
D. R. LENAT
APPENDIX 1. Continued.
Taxon NCBI WIBI Taxon NCBI WIBI
Megaloptera
Corydalus cornutus
Nigronia fasciatus Nigronia serricornis Sialis spp.
5.6 6.2 5.5 7.5
Odonata
Argis spp. Basiaeschna janata Boyeria grafiana Boyeria vinosa
Calopteryx spp. Cordulegaster spp. Dromogomphus spp. Enallagma spp. Epicordulia spp. Erythemis simplicicollis Gomphus spiniceps Gomphus spp. Hagenius brevistylus Hetaerina spp. Ischnura spp. Lanthus spp. Libellula spp. Macromia spp. Nasiaeschna pentacantha Neurocordulia molesta Neurocordulia obsoleta Neurocordulia spp. Neurocordulia virginiensis Ophiogomphus spp. Pachydiplax longipennis Perithemis spp. Plathemis lydia Progomphus obscurus Somatochlora spp. Stylogomphus albistylus Sympetrum spp. Tetragoneuria spp.
Diptera: Chironomidae
Ablabesmyia mallochi
Ablabesmyia parajanta/janta Ablabesmyia peleensis Apsectrotanypus johnsoni Brillia spp. Brundiniella eumorpha Cardiocladius spp. Chironomus spp. Cladopelma spp. Cladotanytarsus spp. Clinotanypus pinguis Coelotanypus concinnus
6
0 4
8.7 8** 7.7 6 6.3 6.3 2 8.3 5** 6.1 3** 6.3 9.0 9** 5.6 7.7* 4.9 6.2 5* 4.0 1* 6.2 6 9.4 9** 2.7 9.8 9** 6.7 2** 8.0 3.3* 5* 5.4 0* 5.8 1.6 6.2 1 9.6
10.0 10.0 8* 8.7 8.9 1* 4.8 0* 7.3 10* 8.5
7.6 8** 7.1 4.6* 0.0* 5.2 5 3.8 6.2 5 9.8 10 2.5* 9* 3.7 7 9.1 8 7.7
Coelotanypus spp. Conchapelopia group Corynoneura spp. Cricotopus spp. Cricotopus bicinctus (C/O spl) Cricotopus infuscatus gr
(CIO sp5) Cricotopus vieriensis gr
(CIO sp46) Cricotopus varipes gr (C/O sp6) Cricotopus sylvestris gr
(C/O sp9) Orthocladius obumbratus gr
(C/O splO) Orthocladius robacki
(C/O spl2) Orthocladius spp. Orthocladius (Euorthocladius)
type III (C/O spl3) Orthocladius (E.) sp (C/O sp3) Orthocladius nigritus gr
(C/O sp47) Orthocladius clarkei gr
(C/O sp54) Orthocladius dorenus gr
(C/O sp7) Cryptochironomus blarina gr Cryptochironomus fulvus gr Cryptotendipes spp. Demicryptochironomus spp. Diamesa spp. Dicrotendipes modestus
Dicrotendipes neomodestus
Dicrotendipes nervosus
Dicrotendipes simpsoni Dicrotendipes spp. Diplocladius cultriger Endochironomus nigricans Eukiefferiella spp. Eukiefferiella claripennis gr
(E. spll) Eukiefferiella brehmi gr
(E. spl2) Eukiefferiella gracei gr
(E. spl4) Eukiefferiella devonica gr
(E. sp2) Eukiefferiella brevicalcar gr
(E. sp6) Genus nr Nanocladius B
Glyptotendipes spp. Goeldichironomus holoprasinatus Harnischia spp. Heleniella spp.
6.2 8.7 6 6.2 7
7 8.7
9.0
4.8 8.1
10.0
8.8
7.2 6
6.3 9.2
0.9*
5.8
6.7 8.0 6.7 6.1 2.1
*
8** 8**
6
7.7 8* 9.2 5 8.3
10.0 10.0 7.9 7.7 8 7.5* 8*
8 5.7
3.7
2.7*
2.6
1.7 6.7 8.5 10
10.0 7.5 8 0.0
288
I I
[Volume 12
This content downloaded from 163.178.101.228 on Thu, 18 Sep 2014 17:13:21 PMAll use subject to JSTOR Terms and Conditions
A BIOTIC INDEX FOR SOUTHEASTERN USA
APPENDIX 1. Continued.
Taxon NCBI WIBI Taxon NCBI WIBI
Heterotrissocladius spp. Hydrobaenus spp. Keifferulus dux Labrundinia pilosella Labrundinia virescens Larsia spp. Lopescladius spp. Micropsectra spp. Microtendipes spp. Nanocladius downesi Nanocladius spp. Natarsia spp. Nilotanypus spp. Nilothauma spp. Odontomesa fulva Pagastia sp. Pagastiella ostansa Parachaetocladius spp. Parachironomus monochromus Parachironomus spp. Paracladopelma spp. Paracladopelma nereis
Paracladopelma undine
Parakiefferiella cf. triqueta Parakiefferiella spp. Paralauterborniella nigrohalteralis Paramerina spp. Parametriocnemus lundbecki
Paratanytarsus spp. Paratendipes spp. Pentaneura spp. Phaenopsectra flavipes Phaenopsectra sp2 Phaenopsectra fuscicorne
(P. sp3) Phaenopsectra spp. Polypedilum angulum Polypedilum aviceps Polypedilum convictum
Polypedilum fallax Polypedilum halterale
Polypedilum illinoense
Polypedilum scalaenum Potthastia gaedi Potthastia longimanus Procladius spp. Prodiamesa olivacea Psectrocladius spp. Psectrotanypus dyari Pseudochironomus spp. Pseudorthocladius spp. Rheocricotopus robacki (R. spl) Rheocricotopus tuberculatus
(R. sp2)
5.4 0* 9.6 8
10.0 10* 6.0 7** 4.5* 8.3 6 2.2 4* 1.4 7 6.2 7 2.6 7.2 3*
10.0 8 4.0 6 5.5 2 5.9 4 2.2 1 2.6* -
0.0 7.9 9.2 10 6.4 7* 1.8* 5.2 5.6 5.9 4.8 8 2.8 3.7 5** 7.7 6 5.3 8 4.6 6 8.5 6.2 7
6.0 6.8 5.6 4.0 5.3 6.7 7.2 9.2 8.7 2.0 7.4 9.3 7.9 3.8
10.0
7
9 3** 8*
10
Rheosmittia nr delicatula
Rheotanytarsus spp. Robackia claviger Robackia demeijerei Saetheria tylus Stelechomyia perpulchra Stempellina spp. Stempellinella spp. Stenochironomus spp. Stictochironomus spp. Sublettea coffmani Symposiocladius lignicola Sympotthastia spp. Synorthocladius spp. Tanypus spp. Tanytarsus spp. Thienemaniella spp. Tribelos spp. Tvetenia spp. Tvetenia bavarica gr (E. spl) Tvetenia discoloripes gr (E. sp3) Unniella multivirga Xenochironomus xenolabis
Xylotopus par Zavrelia spp. Zavrelimyia spp.
Diptera: Miscellaneous
Anopheles spp. Antocha spp. Atherix lantha
Atrichopogon spp. Blepharicera spp. Chaoborus punctipennis Chrysops spp. Cnephia mutata Culex spp. Culicoides spp. Dicranota spp. Dixa spp. Dolichopodidae Empididae Eristalis spp. Hexatoma spp. Limnophora spp. Limonia spp. Palpomyia (complex) Polymeda / ormosia spp. Prosimulium mixtum
4.2 5 Prosimulium spp. 0.0 O* Protoplasa fitchii 7.7 6** Pseudolimnophila spp.
Psychoda spp. 6.8 * Simulium spp.
7.1 6.4 6 2.4 4.3 8.1 4** 4.6 2.0* 2 5.3 4 6.4 5 6.7 9 1.7 5.4 5.7 2 4.7 2* 9.6 10 6.7 6 6.0 6 6.6 5
5 4.0 3.9 0.0* 7.0 0** 6.6 2* 2.7* 9.3 8
9.1 4.6 3 2.1 2 6.8 0.2 0** 8.5 8** 7.3 6 4.0* 5
10.0 6.5 10 0.0 3 2.8 9.7 4 8.1 6
10.0 10 4.7 2 7.0*
10.0 6 6.9 6 6.5 3.3 3 2.6 5.0 7.3 2 9.9* 4.4
1993] 289
This content downloaded from 163.178.101.228 on Thu, 18 Sep 2014 17:13:21 PMAll use subject to JSTOR Terms and Conditions
APPENDIX 1. Continued.
Taxon NCBI WIBI Taxon NCBI WIBI
Simulium venustum Simulium vittatum Tabanus spp. Tipula spp.
Oligochaeta Aulodrilus limnobius Aulodrilus pigueti Branchiura sowerbyi Cambarincolidae Dero spp. Enchytraeidae Haber speciosus Ilyodrilus templetoni Isochaetides curvisetosus Isochaetides freyi Limnodrilus cervix Limnodrilus hoffmeisteri Limnodrilus spp. Limnodrilus udekemianus Lumbriculidae Nais spp. Opisthopora (earthworm gr) Peloscolex spp. Pristina spp. Slavina appendiculata Spirosperma nikolskyi Stylaria lacustris
Tubifex tubifex
Hirudinea
Batracobdella phalera Erpobdella / mooreobdella spp. Helobdella elongata Helobdella stagnalis Helobdella triserialis Mooreobdella tetragon Placobdella papillifera Placobdella parasitica
Crustacea
Asellus spp. Astacidae
7.4 5 8.7 7 9.7 5* 7.7 4
5.2* 4.7* 8.4 6.2
10.0 10.0 2.8 9.4 7.18 7.6
10.0 9.8 9.6 9.7* 7.3 9.1 9.1 8.8 9.9 7.1 7.7 8.5
10.0
7.1 7.8 9.9 6.7 8.9 9.7 9.0 6.6
Cambarus spp. Crangonyx serratus
Crangonyx spp. Gammarus fasciatus Hyallela azteca Lirceus spp. Orconectes spp. Palaemonetes paludosus Procambarus spp.
Mollusca
Amnicola spp. Campeloma decisum Elimia spp. Ferrissia spp. Helisoma anceps Laevapex fuscus Leptoxis spp. Menetus dilatus
Physella spp. Pseudosuccinea columella
Somatogyrus spp. Stagnicola spp. Corbicula fluminea Elliptio complanata Elliptio lanceolata Pisidium spp. Sphaerium spp.
Other
Belastoma spp. Ranatra spp. Corixidae Climacia areolaris Cura foremanii Dugesia tigrina Hydracarina Petrophila sp. Prostoma graecens
9.4 8 7.2
8.1 8.1* 8.0 6.9 7.9 8 7.7 2.7 6.7 9.5
4.8 6.7 2.5 6.9 6.5 7.3 1.6 8.4 9.1 7.2 6.5 8.0 6.3 5.4 1.9* 6.8 7.7
9.8 7.5 9.0 6.5 5.1 7.5 5.7 1.8 5 6.6
D. R. LENAT [Volume 12 290
This content downloaded from 163.178.101.228 on Thu, 18 Sep 2014 17:13:21 PMAll use subject to JSTOR Terms and Conditions
Related Documents