A Benchmarking Tool for MAV Visual Pose Estimation Gim Hee Lee * , Markus Achtelik † , Friedrich Fraundorfer * , Marc Pollefeys * , and Roland Siegwart † * Computer Vision and Geometry Laboratory, Department of Computer Science, ETH Z¨ urich † Autonomous Systems Laboratory, Department of Mechanical Engineering, ETH Z¨ urich [email protected], [email protected], [email protected], [email protected], [email protected] Abstract—The large collections of datasets for researchers working on the Simultaneous Localization and Mapping problem are mostly collected from sensors such as wheel encoders and laser range finders mounted on ground robots. The recent grow- ing interest in doing visual pose estimation with cameras mounted on micro-aerial vehicles however has made these datasets less useful. In this paper, we describe our work in creating new datasets collected from a sensor suite mounted on a quadrotor platform. Our sensor suite includes a forward looking camera, a downward looking camera, an inertial measurement unit and a Vicon system for groundtruth. We propose the use our datasets as benchmarking tools for future works on visual pose estimation for micro-aerial vehicles. We also show examples of how the datasets could be used for benchmarking visual pose estimation algorithms. Index Terms—Micro-Aerial Vehicles, Quadrotor, Visual SLAM, Benchmarking Tool. I. INTRODUCTION Over the past two decades, the problem of Simultaneous Localization and Mapping (SLAM) for ground robots has been actively researched on by a large number of researchers [5]– [7]. In many cases, the most convenient way to assess a SLAM algorithm would be to test it on offline datasets collected from a sensor suite mounted on the robot which was driven through the environment. This approach has made it easier for researchers to focus on algorithm developments while eliminating hardware and data synchronization issues. Robot trajectories and maps produced from the SLAM algorithms are usually benchmarked against architectural blueprints for indoor environments or global positioning system (GPS) for outdoor environments. Consequently, a large number of repositories hosting these offline datasets could be found [1]–[3]. The most common sensor suite consists of the inertial measurement units (IMUs), wheel encoders, laser range finders, ultra-sonic sensors, and GPS for outdoor environments. In the recent years, the research focus of SLAM is grad- ually moving towards using cameras as the main sensor [9], [10]. This is largely due to the fact that the 2D laser range finder, which has been the most popular choice for doing SLAM on ground robots, could only provide very limited information from its planar point cloud readings. In contrast, images obtained from cameras could be used to extract 3D information of the environment, and more importantly, rich information given by the color and pixel intensity could also be used for scene recognition which has been proven to be more superior for the detection of loop closure opportunities [8]. In even more recent years, there is a strong growing interest among various research groups on using Micro-Aerial Vehicles (MAVs) for autonomous navigation in challenging environments due to its locomotive advantages over ground robots. Higher maneuverability and limited payload of flying robots imply that cameras would be a nature choice for its main sensor. However, the paradigm shift in the robotics platforms and sensors means that the large collections of offline datasets, which are available in many repositories, for SLAM would no longer be useful. Hence, in this paper we describe our work on creating datasets collected from a sensor suite mounted on a MAV as a benchmarking tool for MAV visual pose estimation. Our sensor suite includes a forward looking and a downward looking camera, an IMU unit with 3 axis gyroscopes, 3 axis accelerometers and a magnetometer, and a Vicon system. Pose measurements from the Vicon system are used as the groundtruth which is very useful for benchmarking visual pose estimation of a MAV flying in indoor environments where it would be impossible to justify using 2D architectural blueprints. In addition, ARToolKitPlus markers [14], which can be used to estimate the camera poses, are placed on known positions on the ground and the flightpaths are choreographed to ensure that the markers are always within the line-of-sight of the downward looking camera. The paper is structured as follows. In Section II, we describe our MAV platform and the sensor suite used for data collection as well as the environment setup. In Section III, we describe the procedures for synchronizing the readings collected from different sensors. We will also discuss about the camera calibration procedures. In Section IV, we describe the content of the benchmarking datasets and provide information on how to obtain a copy of it. Finally, in Section V, we show examples of the usage of our dataset to quantify existing visual pose estimation algorithms such as the 5-point algorithm [15], 4- point algorithm [18] and ARToolKitPlus [14] compared to the groundtruth from the Vicon system. II. MAV PLATFORM AND ENVIRONMENT SETUP Figure 1(a) shows a “Pelican” quadrotor from Ascend- ing Technologies 1 which we used for data collection. The quadrotor has an inbuilt MEMS IMU equipped with 3 axis gyroscopes, 3 axis accelerometers and a magnetometer which respectively gives the measurements of the attitude rates, accelerations and absolute heading. A filter within the IMU 1 http://www.asctec.de/

Welcome message from author
This document is posted to help you gain knowledge. Please leave a comment to let me know what you think about it! Share it to your friends and learn new things together.
Transcript

A Benchmarking Tool for MAV Visual Pose Estimation
Gim Hee Lee∗, Markus Achtelik†, Friedrich Fraundorfer∗, Marc Pollefeys∗, and Roland Siegwart†
∗Computer Vision and Geometry Laboratory, Department of Computer Science, ETH Zurich†Autonomous Systems Laboratory, Department of Mechanical Engineering, ETH Zurich
[email protected], [email protected], [email protected], [email protected], [email protected]
Abstract—The large collections of datasets for researchersworking on the Simultaneous Localization and Mapping problemare mostly collected from sensors such as wheel encoders andlaser range finders mounted on ground robots. The recent grow-ing interest in doing visual pose estimation with cameras mountedon micro-aerial vehicles however has made these datasets lessuseful. In this paper, we describe our work in creating newdatasets collected from a sensor suite mounted on a quadrotorplatform. Our sensor suite includes a forward looking camera, adownward looking camera, an inertial measurement unit and aVicon system for groundtruth. We propose the use our datasetsas benchmarking tools for future works on visual pose estimationfor micro-aerial vehicles. We also show examples of how thedatasets could be used for benchmarking visual pose estimationalgorithms.
Index Terms—Micro-Aerial Vehicles, Quadrotor, VisualSLAM, Benchmarking Tool.
I. INTRODUCTION
Over the past two decades, the problem of Simultaneous
Localization and Mapping (SLAM) for ground robots has been
actively researched on by a large number of researchers [5]–
[7]. In many cases, the most convenient way to assess a SLAM
algorithm would be to test it on offline datasets collected
from a sensor suite mounted on the robot which was driven
through the environment. This approach has made it easier
for researchers to focus on algorithm developments while
eliminating hardware and data synchronization issues. Robot
trajectories and maps produced from the SLAM algorithms are
usually benchmarked against architectural blueprints for indoor
environments or global positioning system (GPS) for outdoor
environments. Consequently, a large number of repositories
hosting these offline datasets could be found [1]–[3]. The
most common sensor suite consists of the inertial measurement
units (IMUs), wheel encoders, laser range finders, ultra-sonic
sensors, and GPS for outdoor environments.
In the recent years, the research focus of SLAM is grad-
ually moving towards using cameras as the main sensor [9],
[10]. This is largely due to the fact that the 2D laser range
finder, which has been the most popular choice for doing
SLAM on ground robots, could only provide very limited
information from its planar point cloud readings. In contrast,
images obtained from cameras could be used to extract 3D
information of the environment, and more importantly, rich
information given by the color and pixel intensity could also
be used for scene recognition which has been proven to be
more superior for the detection of loop closure opportunities
[8]. In even more recent years, there is a strong growing
interest among various research groups on using Micro-Aerial
Vehicles (MAVs) for autonomous navigation in challenging
environments due to its locomotive advantages over ground
robots. Higher maneuverability and limited payload of flying
robots imply that cameras would be a nature choice for its
main sensor.
However, the paradigm shift in the robotics platforms and
sensors means that the large collections of offline datasets,
which are available in many repositories, for SLAM would no
longer be useful. Hence, in this paper we describe our work on
creating datasets collected from a sensor suite mounted on a
MAV as a benchmarking tool for MAV visual pose estimation.
Our sensor suite includes a forward looking and a downward
looking camera, an IMU unit with 3 axis gyroscopes, 3 axis
accelerometers and a magnetometer, and a Vicon system.
Pose measurements from the Vicon system are used as the
groundtruth which is very useful for benchmarking visual
pose estimation of a MAV flying in indoor environments
where it would be impossible to justify using 2D architectural
blueprints. In addition, ARToolKitPlus markers [14], which can
be used to estimate the camera poses, are placed on known
positions on the ground and the flightpaths are choreographed
to ensure that the markers are always within the line-of-sight
of the downward looking camera.
The paper is structured as follows. In Section II, we describe
our MAV platform and the sensor suite used for data collection
as well as the environment setup. In Section III, we describe
the procedures for synchronizing the readings collected from
different sensors. We will also discuss about the camera
calibration procedures. In Section IV, we describe the content
of the benchmarking datasets and provide information on how
to obtain a copy of it. Finally, in Section V, we show examples
of the usage of our dataset to quantify existing visual pose
estimation algorithms such as the 5-point algorithm [15], 4-
point algorithm [18] and ARToolKitPlus [14] compared to the
groundtruth from the Vicon system.
II. MAV PLATFORM AND ENVIRONMENT SETUP
Figure 1(a) shows a “Pelican” quadrotor from Ascend-
ing Technologies 1 which we used for data collection. The
quadrotor has an inbuilt MEMS IMU equipped with 3 axis
gyroscopes, 3 axis accelerometers and a magnetometer which
respectively gives the measurements of the attitude rates,
accelerations and absolute heading. A filter within the IMU
1http://www.asctec.de/

(a) (b)
Fig. 1. (a) The “Pelican” quadrotor equipped with a forward looking camera, adownward looking camera, an IMU, and three reflective markers for the Viconsystem. (b) Group of ARToolKitPLus markers placed in known location.
fuses the attitude rates, accelerations and heading at a rate of
1KHz to give absolute attitude measurements.
For our objective of visual pose estimation, we added
a forward looking and a downward looking camera. Both
cameras are PointGrey USB-Firefly 2 cameras which run at
a maximum framerate of 30 frames per second. The forward
looking camera is equipped with a 6mm CS-mount lens with
80◦ field of view and the downward looking camera has a
fisheye lens with 150◦ field of view to increase the coverage.
The IMU and the cameras are connected to an onboard
computer providing UART and USB interfaces. This computer
is equipped with a 1.6GHz Intel Atom processor and 1GB
RAM and thus is able to run standard x86 operating systems
such as Ubuntu 9.10 in our case.
For data-capturing, we make use of the ROS [4] framework.
We wrote nodes to receive IMU data over a serial interface
at 200Hz as well as for capturing images from the cameras.
These nodes publish IMU- and image-messages that are logged
into binary “bag”-files onto a USB stick using the ROS-tool
“rosbag” and are later exported via scripts to matlab-files.
Furthermore, to have a preview, images are streamed at lower
quality via a wireless 802.11n connection to a laptop serving
as ground station.
The quadrotor was flown in a 10m×10m×10m indoor
environment equipped with eight Vicon cameras mounted on
the four sides of the ceiling walls. Three reflective markers
are mounted asymmetrically and rigidly onto the quadrotor for
the motion capture. Pose estimation from the Vicon system is
performed at a separate computer system at a precise frequency
of 200Hz. Furthermore, a group of ARToolkit markers is
placed on the floor at known locations with respect to the Vicon
coordinate origin. Figure 1(b) shows the group of ARToolK-
itPLus markers used in our setup. The ARToolKitPLus was
originally created for tracking camera poses in the augmented
reality applications, but is used in our experimental setup for
enhancing features on the floor for the images.
III. DATA SYNCHRONIZATION AND CAMERA
CALIBRATION
A. Data Synchronization
The camera images, Vicon and IMU data are not useful
for benchmarking visual pose estimation algorithms on MAVs
2http://www.ptgrey.com/products/fireflymv/index.asp
unless they are perfectly synchronized. There are no synchro-
nization issues between the camera and IMU since these data
were captured on the same computer evaluating embedded
timestamps from the respective hardware. Synchronization
between the Vicon system and IMU/camera poses a problem
since these data were collected on different computers. The
IMU and Vicon data however could not be synchronized by
direct comparison because the IMU measures the attitude rates
in the body frame but the Vicon system measures the Euler
angles with respect to its frame of reference. We therefore
took the advantage of the precise sampling rate of the Vicon
system to overcome this problem. We would differentiate the
Euler angles and transform them into the body frame. Equation
1 shows the relationship between the attitude rates (p, q, r)
in the body frame and the Euler angles (φ, θ, ψ). fv is the
frequency of the Vicon system.
p
q
r
= fv
1 0 −sin(θ)0 cos(φ) cos(θ)sin(φ)0 −sin(φ) cos(θ)cos(φ)
∆φ∆θ∆ψ
(1)
Figure 2 shows the IMU and Vicon roll and pitch angular
rates in the body frame. Both data are clearly out of phase
from each other. To synchronize the IMU and Vicon data, we
create distinctive attitude rate profiles before and after flying
the quadrotor by manually rotating the quadrotor around the
roll and pitch directions respectively. We would then do a
cross-correlation between the two data to find the time-shift
between them. Figure 3 shows the correlation coefficients plot
for both roll and pitch angular rates.
Fig. 2. Unsynchronized Vicon and IMU roll and pitch angular rates in thebody frame.
Finally, we generate the synchronized data by compensating
for the time-shift. An important factor to note is that cross-
correlation in the discrete domain requires the signals to have
the same sampling interval. We ensure that both the Vicon
and IMU data have the same sampling intervals by cubic spline
interpolation. Figure 4 shows the IMU and Vicon roll and pitch
angular rates after synchronization. It is interesting to note
that the cross-correlation done for both roll and pitch angular
rates also results with a synchronization of the yaw angular
rates as shown in Figure 5. This shows the accuracy of our
synchronization method.
B. Camera Calibration
The first step to many visual algorithms is to find the
camera intrinsic value and distortion coefficients. We have to

Fig. 3. Cross-correlation factors for unsynchronized roll and pitch bodyrates. The time-shift between two signals corresponds to the highest positivecorrelation.
Fig. 4. IMU and Vicon roll and pitch angular rates after time synchronization.
Fig. 5. IMU and Vicon yaw angular rates after time synchronization.
use two different camera calibration methods for the 6mm CS-
mount lens and the fisheye lens due to the difference in the
camera models. The “Bouguet Camera Calibration Toolbox”
[11] and “Scaramuzza Omni-directional Camera Calibration
Toolbox” [12], [13] were used to calibrate the 6mm CS-mount
lens and the fisheye lens respectively. Both toolboxes provide
functions to undistort the images after calibration. Figures 6
and 7 show examples of the calibration images before and
after undistortion. It should be noted that the camera intrinsic
values are not explicit results from the “Scaramuzza Omni-
directional Camera Calibration Toolbox” for the fisheye lens.
It must be computed from Equation 2 after the calibration
and undistortion processes. sf is the zoom factor specified
by the user during the undistortion process. The borders of an
undistorted image usually contains artifacts, and sf determines
the size of these borders to be removed after the undistortion
process. iw is the image width, and iwc and ihc are the image
center coordinates.
Fig. 6. Images from downward looking camera before and after undistortion.
Fig. 7. Images from forward looking camera before and after undistortion.
K =
iwsf
0 iwc
0 iwsf
ihc
0 0 1
(2)
The transformation matrix quadTcam that relates the camera
frame to the quadrotor body frame in the Vicon system must be
known for accurate comparison of any visual pose estimation
with the Vicon system groundtruth. We made use of the
Vicon system to find out quadTcam since physical measure-
ments will not give satisfactory results. Three Vicon reflective
markers were fixed onto the image calibration board during
the calibration process and this gives us the transformationV iconTcalib that relates the calibration board frame to the Vicon
frame. The reflective markers on the quadrotor body gives us
the transformation V iconTquad that relates the quadrotor body
frame to the Vicon frame. The transformation matrix calibTcamcan be obtained from the camera extrinsic values after the
camera calibration and hence we are able to compute quadTcamfrom Equation 3.
quadTcam = inv(V iconTquad)V iconTcalib
calibTcam (3)
IV. BENCHMARKING DATASET PACKAGE
Five synchronized datasets - 1LoopDown, 2LoopsDown,
3LoopsDown, hoveringDown and randomFront are created
from this work. These datasets are collected from the quadrotor
flying 1, 2 and 3 loop sequences, hovering within a space of
approximately 1m×1m×1m, and flying randomly within the
sight of the Vicon system. These datasets consist of images
from the camera, accelerations, attitude rates, absolute angles
and absolute headings from the IMU, and groundtruth from
the Vicon system with their respective timestamps. Images
from the first 4 datasets are from the downward looking
camera and images from the last dataset are from the forward
looking camera. Synchronized datasets for the calibrations of
the forward and downward cameras are also provided.
We propose to measure the quality of any pose estimation
algorithm with cosine similarity. The quality of each axis is
measured separately, and the measurements for each of these
axes could be obtained from the pose estimation algorithm
and groundtruth as n-dimensional vectors denoted by E and
G. The cosine similarity α is given by Equation 4 and has a
range of [−1 1] when the estimates exactly disagree or match
the groundtruth. The matlab script that computes the cosine
similarity is provided. Our datasets are available for download
on http://projects.asl.ethz.ch/sfly/doku.php?id=mav datasets.
α =E.G
‖E‖ ‖G‖(4)
V. POSE ESTIMATION WITH DATASET
A. Visual Odometry from the 5-point Algorithm
Fig. 8. Comparison of 5-point algorithm measurements to ground truth. Theplots show roll, pitch, yaw, x, y, z values for 120 keyframes extracted fromthe 1LoopDown dataset. The high α value for yaw measurements shows thatit is very accurate.
In this example, we computed the visual odometry using
the 5-point algorithm for 120 keyframes extracted from the
1LoopDown dataset and compared it to the ground truth. First,
we extracted the SIFT features [17] in all the keyframes and
performed feature matching for each consecutive keyframe
pair. Next, we computed the essential matrix using the 5-point
algorithm [15] for each keyframe pair. Finally, the rotation
matrix R and translation vector t that relates each image pair
are extracted from the essential matrix. The RANSAC [16]
algorithm is used for a more robust estimation of the essential
matrix.
Figure 8 shows the comparison of the rotation and trans-
lation values. Each subplot shows the 5-point algorithm mea-
surement (blue graphs) against the groundtruth measurement
(black graphs). The translation vector t from both the 5-point
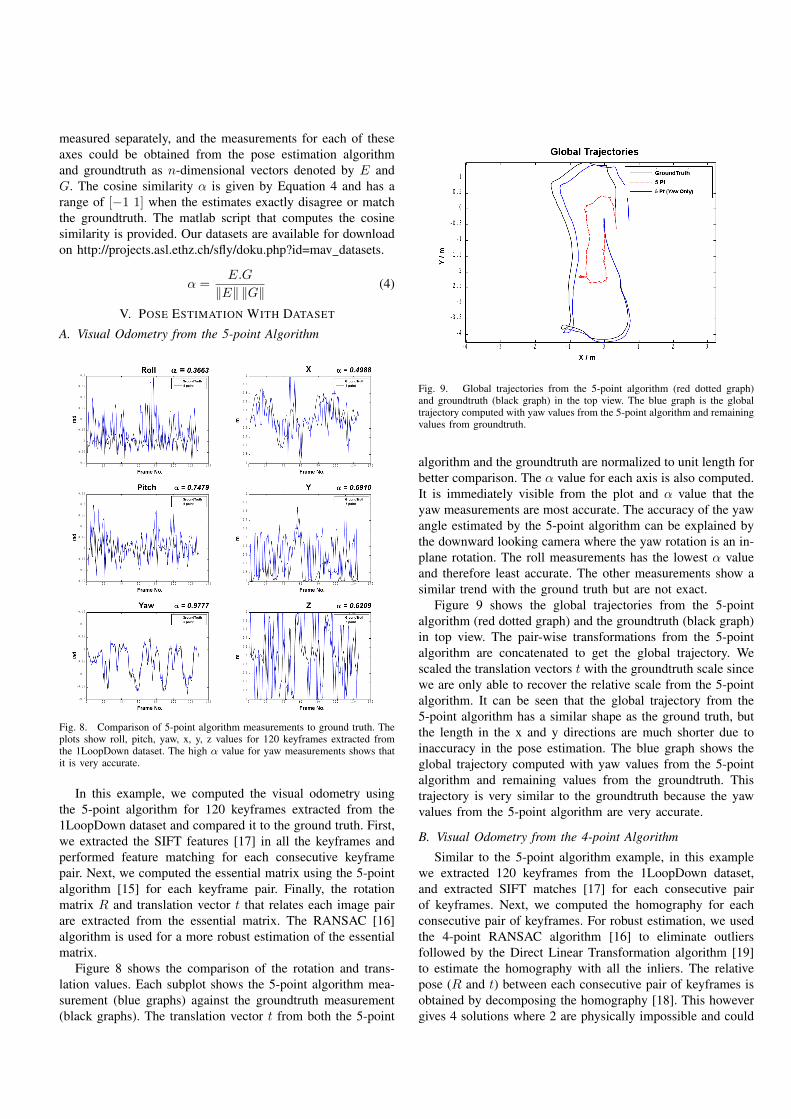
Fig. 9. Global trajectories from the 5-point algorithm (red dotted graph)and groundtruth (black graph) in the top view. The blue graph is the globaltrajectory computed with yaw values from the 5-point algorithm and remainingvalues from groundtruth.
algorithm and the groundtruth are normalized to unit length for
better comparison. The α value for each axis is also computed.
It is immediately visible from the plot and α value that the
yaw measurements are most accurate. The accuracy of the yaw
angle estimated by the 5-point algorithm can be explained by
the downward looking camera where the yaw rotation is an in-
plane rotation. The roll measurements has the lowest α value
and therefore least accurate. The other measurements show a
similar trend with the ground truth but are not exact.
Figure 9 shows the global trajectories from the 5-point
algorithm (red dotted graph) and the groundtruth (black graph)
in top view. The pair-wise transformations from the 5-point
algorithm are concatenated to get the global trajectory. We
scaled the translation vectors t with the groundtruth scale since
we are only able to recover the relative scale from the 5-point
algorithm. It can be seen that the global trajectory from the
5-point algorithm has a similar shape as the ground truth, but
the length in the x and y directions are much shorter due to
inaccuracy in the pose estimation. The blue graph shows the
global trajectory computed with yaw values from the 5-point
algorithm and remaining values from the groundtruth. This
trajectory is very similar to the groundtruth because the yaw
values from the 5-point algorithm are very accurate.
B. Visual Odometry from the 4-point Algorithm
Similar to the 5-point algorithm example, in this example
we extracted 120 keyframes from the 1LoopDown dataset,
and extracted SIFT matches [17] for each consecutive pair
of keyframes. Next, we computed the homography for each
consecutive pair of keyframes. For robust estimation, we used
the 4-point RANSAC algorithm [16] to eliminate outliers
followed by the Direct Linear Transformation algorithm [19]
to estimate the homography with all the inliers. The relative
pose (R and t) between each consecutive pair of keyframes is
obtained by decomposing the homography [18]. This however
gives 4 solutions where 2 are physically impossible and could

Fig. 10. Comparison of 4-point algorithm measurements to Vicon groundtruth. The plots show roll, pitch, yaw, x, y, z values for 120 keyframesextracted from the 1LoopDown dataset. Similar to the 5-point algorithm, theyaw measurements is very accurate with a high α value.
Fig. 11. Global trajectories from the 4-point algorithm (red dotted graph)and groundtruth (black graph) in the top view. The blue graph is the globaltrajectory computed with rotation values from the 4-point algorithm andremaining values from groundtruth.
be eliminated. In our implementation, the correct solution is the
one from the remaining 2 solutions which gives the smallest
difference in R when compared with the IMU readings.
Figure 10 shows plots of the relative rotation and translation
values between consecutive keyframes (blue graphs) overlaid
with the Vicon groundtruth (black graphs). For better compar-
ison, the translation values from the 4-point algorithm and the
groundtruth are normalized to unit length. Similar to the 5-
point algorithm, the yaw measurements is very accurate with
a high α value. The most interesting observation is that the
4-point algorithm failed to detect changes for roll, pitch and
z directions. The failure of the 4-point algorithm to detect
changes in the roll, pitch and z directions is probably because
the relative changes in these directions are significantly smaller
than the remaining directions.
Figure 11 shows the global trajectories from the 4-point
algorithm (red dotted graph) and the Vicon groundtruth (black
graph). Similar to the 5-point algorithm, the pair-wise trans-
formations from the 4-point algorithm are concatenated to
get the global trajectory. We scaled the translation vectors t
with the groundtruth scale since we are only able to recover
the relative scale from the 4-point algorithm. We observed
that the global trajectories from the 4-point algorithm deviates
significantly from the groundtruth. This deviation is mainly due
to the erroneous translation values. The blue graph is the global
trajectory with the rotation values from the 4-point algorithm
and remaining values from the groundtruth. The similarity
between the two trajectories shows that the yaw estimates from
the 4-point algorithm are accurate.
C. Pose Estimation with ARToolKitPlus
Fig. 12. Comparison of ARToolKitPlus measurements to ground truth. Theplots show x, y, z, roll, pitch, yaw values for the 1LoopDown dataset. Thetranslation values and yaw measurements are very precise with α values closeto 1.
The final example that we show in this paper is the pose
estimation results from the ARToolKitPlus software [14] as
compared to the Vicon groundtruth. A group of 44 ARToolK-
itPlus markers was placed on the ground at known poses with
respect to the reference frame of the Vicon system. This would
allow us to obtain the pose of the MAV with respect to the

Fig. 13. Comparison of ARToolKitPlus pose estimates to ground truth (topview). The black graph is the groundtruth. A smoother trajectory after medianfiltering is shown by the blue graph.
reference frame of the Vicon system and direct comparison
with the pose estimated from the Vicon system would be
possible. Unlike the two previous examples which extracted
keyframes, in this example we processed every single frame
from the 1LoopDown dataset.
Figure 12 shows the comparison of the absolute rotation
and translation values from ARToolKitPlus with the Vicon
groundtruth (black graphs). It is clear from these plots and
α values that the translation and yaw measurements from
ARToolKitPlus (blue graphs) are very precise with the ex-
ception of occasional glitches. Roll and pitch measurements
are significantly less accurate. This is probably due to the
small changes which are harder to measure. Figure 13 shows
the computed trajectory from the ARToolKitPlus software
(red dotted graph) overlaid with the groundtruth from the
Vicon system (black graph) in top view. We observed that
the occasional glitches in the ARToolKitPlus pose estimate
caused “jumps” to the trajectory. Nevertheless, the problem of
occasional glitches in the ARToolKitPlus pose estimate can be
easily alleviated by smoothing the estimates with a median
filter (in this example, size=5). The blue graph in Figure
13 shows the estimated trajectory after filtering. The filtered
trajectory is obviously smoother and closer to the groundtruth.
VI. CONCLUSIONS
In this paper, we have pointed out the need for a new bench-
marking toolset for evaluating pose estimation algorithms on
MAVs. We have created synchronized datasets from a forward
looking camera, a downward looking camera and IMU on a
quadrotor platform, and groundtruth from the Vicon system.
We have also showed examples of using these datasets for
benchmarking some existing visual pose estimation algorithms.
Our datasets are made available for public access with the hope
that they could be useful for future researchers working on
pose estimation algorithms on MAVs.
ACKNOWLEDGMENTS
This work is part of the sFly project, funded by
the European Community’s Seventh Framework Programme
(FP7/2007-2013) under grant agreement #231855. It is also
partially supported by the Swiss National Science Foundation
(SNF) under grant number #200021-125017. The authors
would like to thank Professor D’Andrea Raffaello and Sergei
Lupashin from the Institute of Dynamic Systems and Control
at ETH Zurich for providing the Vicon system and giving
assistance with the Vicon data collection.
REFERENCES
[1] Andrea Bonarini, Wolfram Burgard, Giulio Fontana, Matteo Matteucci,Domenico Giorgio Sorrenti and Juan Domingo Tardos, “RAWSEEDS:Robotics Advancement through Web-publishing of Sensorial and Elab-orated Extensive Data Sets”, in proceedings of IROS’06 Workshop on
Benchmarks in Robotics Research, 2006.[2] Cyrill Stachniss, Udo Frese and Giorgio Grisetti, “OpenSLAM.org”, http:
//openslam.org/.[3] Andrew Howard and Nicholas Roy, “The Robotics Data Set Repository
(Radish)”, http://radish.sourceforge.net/, 2003.[4] Willow Garage, “ROS - Robotics Open Source”, http://www.ros.org.[5] Hugh Durrant-Whyte and Tim Bailey, “Simultaneous Localization and
Mapping: Part I”, in IEEE Robotics and Automation Magazine, June2006.
[6] Hugh Durrant-Whyte and Tim Bailey, “ Simultaneous Localization andMapping: Part II”, in IEEE Robotics and Automation Magazine, June2006.
[7] Thrun, S. and Burgard, W. and Fox, D., “Probabilistic Robotics”, MIT
Press, 2005.[8] Paul Newman and Kin Ho, “SLAM-Loop Closing with Visually Salient
Features”, in Proceedings of the IEEE International Conference on
Robotics and Automation (ICRA), 18-22 April 2005.[9] Andrew J. Davison, Ian Reid, Nicholas Molton and Olivier Stasse,
“MonoSLAM: Real-Time Single Camera SLAM”’, in IEEE Transactions
on Pattern Analysis and Machine Intelligence (PAMI), 2007.[10] Agrawal, M., and Konolige K., “FrameSLAM: From Bundle Adjustment
to Real-Time Visual Mapping”, in IEEE Transactions on Robotics,October 2008
[11] Bouguet, J., “Camera calibration toolbox for Matlab”, 2006. http://www.vision.caltech.edu/bouguetj/calib\ doc/htmls/parameters.html
[12] Scaramuzza, D., Martinelli, A. and Siegwart, R., “A Toolbox for EasyCalibrating Omnidirectional Cameras”, in Proceedings to IEEE Inter-
national Conference on Intelligent Robots and Systems (IROS), October7-15, 2006.
[13] Scaramuzza, D., Martinelli, A. and Siegwart, R., “A Flexible Techniquefor Accurate Omnidirectional Camera Calibration and Structure fromMotion”, in Proceedings of IEEE International Conference of Vision
Systems (ICVS), New York, January 5-7, 2006.[14] Wagner Daniel, Schmalstieg Dieter, “ARToolKitPlus for Pose Tracking
on Mobile Devices”, Proceedings of 12th Computer Vision Winter
Workshop, February 2007.[15] D. Nister, “An efficient solution to the five-point relative pose problem”,
in Proceedings IEEE Computer Society Conference on Computer Vision
and Pattern Recognition (CVPR 2003), Volume 2, pages. 195-202, 2003.[16] Fischler, Martin A. and Bolles, Robert C.,“Random sample consensus:
a paradigm for model fitting with applications to image analysis and au-tomated cartography”, in Readings in computer vision: issues, problems,
principles, and paradigms, 1987, pp. 726–740.[17] David G. Lowe, “Distinctive image features from scale-invariant key-
points”, in International Journal of Computer Vision, 2004, pp. 91-110.[18] Yi Ma, Stefano Soatto, Jana Kosecka, and Shankar S. Sastry, “An
invitation to 3-D vision: From images to geometrical approaches”,Springer-Verlag, November 2003.
[19] Hartley, R. I. and Zisserman, A., “Multiple View Geometry in ComputerVision”, Second Edition, Cambridge University Press, 2004.
Related Documents