A Benchmarking Assessment of Known Visual Cryptography Algorithms by Disa E. Walden B.S.M.E. Valparaiso University 2010 A thesis submitted in partial fulfillment of the requirements for the degree of Master of Science in the Chester F. Carlson Center for Imaging Science Rochester Institute of Technology May 16, 2012 Signature of the Author Accepted by Graduate Program Director Date i

Welcome message from author
This document is posted to help you gain knowledge. Please leave a comment to let me know what you think about it! Share it to your friends and learn new things together.
Transcript
A Benchmarking Assessment of Known Visual Cryptography
Algorithms
by
Disa E. Walden
B.S.M.E. Valparaiso University 2010
A thesis submitted in partial fulfillment of the
requirements for the degree of Master of Science
in the Chester F. Carlson Center for Imaging Science
Rochester Institute of Technology
May 16, 2012
Signature of the Author
Accepted byGraduate Program Director Date
i
CHESTER F. CARLSON CENTER FOR IMAGING SCIENCE
ROCHESTER INSTITUTE OF TECHNOLOGY
ROCHESTER, NEW YORK
CERTIFICATE OF APPROVAL
M.S. DEGREE THESIS
The M.S. Degree Thesis of Disa E. Waldenhas been examined and approved by thethesis committee as satisfactory for the
thesis required for theM.S. degree in Imaging Science
Dr. Roger Dube, Thesis Advisor
Dr. Carl Salvaggio
Dr. Nate Cahill
Date
ii
A Benchmarking Assessment of Known Visual Cryptography
Algorithms
by
Disa E. Walden
Submitted to theChester F. Carlson Center for Imaging Science
in partial fulfillment of the requirementsfor the Master of Science Degree
at the Rochester Institute of Technology
Abstract
With the growth of digital media, it is becoming more prevalent to find a method to protectthe security of that media. An effective method for securely transmitting images is found in thefield of Visual Cryptography. While this method is effective for securely transmitting images,many methods have been developed since the first algorithm was proposed in 1994 by Naor andShamir. A benchmarking scheme is proposed to give the algorithm capabilities, understand theimplementation method, evaluate the algorithm development, and provide image reconstructioninformation. Additionally, the algorithms are ranked according to a Visual Cryptography standard.This would allow an easy way to differentiate between algorithms and determine the ideal algorithmfor a given task or project.
iii

Acknowledgments
I would like to acknowledge the help and guidance of my advisor during this project, the loveand support of my parents who have always believed in my dreams, the companionship of myofficemate Whitney who introduced me to Visual Cryptography, and the project sponsorship fromSandia National Laboratories.
iv

I would like to dedicate this thesis to the man who was my boyfriend when I began this journey,who proposed to me halfway though it, and who married me near its completion. Thank you foreverything. I could not have done this without you.
v
Contents
1 Introduction 1
2 Visual Cryptography Background 32.1 History of Visual Cryptography . . . . . . . . . . . . . . . . . . . . . . . . . . . . . 32.2 Proof of Concept - Binary Images . . . . . . . . . . . . . . . . . . . . . . . . . . . . 42.3 Extension to Gray and Color Images . . . . . . . . . . . . . . . . . . . . . . . . . . 7
2.3.1 Gray Images . . . . . . . . . . . . . . . . . . . . . . . . . . . . . . . . . . . 72.3.2 Color Images . . . . . . . . . . . . . . . . . . . . . . . . . . . . . . . . . . . 10
2.4 Observations and Additional Information . . . . . . . . . . . . . . . . . . . . . . . 12
3 Benchmarking Analysis 133.1 History of Benchmarking . . . . . . . . . . . . . . . . . . . . . . . . . . . . . . . . . 133.2 Necessary Content for Benchmarking Scheme . . . . . . . . . . . . . . . . . . . . . 153.3 Benchmarking Scheme . . . . . . . . . . . . . . . . . . . . . . . . . . . . . . . . . . 15
3.3.1 Benchmarking Scorecard . . . . . . . . . . . . . . . . . . . . . . . . . . . . . 203.4 Results of Benchmarking Scheme . . . . . . . . . . . . . . . . . . . . . . . . . . . . 21
3.4.1 Binary Algorithm . . . . . . . . . . . . . . . . . . . . . . . . . . . . . . . . . 213.4.2 Gray Algorithm . . . . . . . . . . . . . . . . . . . . . . . . . . . . . . . . . . 233.4.3 Gray and Color Algorithm . . . . . . . . . . . . . . . . . . . . . . . . . . . . 253.4.4 Binary, Gray, and Color Algorithm . . . . . . . . . . . . . . . . . . . . . . . 27
3.5 Observations and Additional Information . . . . . . . . . . . . . . . . . . . . . . . 28
4 Importance of Findings 294.1 Project Significance . . . . . . . . . . . . . . . . . . . . . . . . . . . . . . . . . . . 294.2 Project Relevance . . . . . . . . . . . . . . . . . . . . . . . . . . . . . . . . . . . . . 30
5 Conclusions 31
6 Future Work & Expansion 33
vi
List of Figures
2.1 Shares Most Commonly Used for Visual Cryptography Algorithms [12] . . . . . . . 42.2 Visual Cryptography Scheme for Binary Images [7] . . . . . . . . . . . . . . . . . . 52.3 Binary Image Used to Illustrate Original Visual Cryptography Scheme . . . . . . . 62.4 Shares of Binary Image Generated with Original Visual Cryptography Algorithm . 62.5 Shares of Binary Image Generated with Original Visual Cryptography Algorithm . 72.6 Visual Cryptography Scheme for Gray Images Using Circle Pixels [12] . . . . . . . 82.7 Shares of Binary Image Generated with Original Visual Cryptography Algorithm . 82.8 Visual Cryptography Scheme for Color Images Using CMY Shares and Mask [6] . 102.9 Visual Cryptography Scheme for Color Images Using CMY Subpixels [6] . . . . . . 112.10 Visual Cryptography Scheme for Color Images Using Improved CMY Subpixels [6] 12
3.1 Results of Region Incrementing Algorithm . . . . . . . . . . . . . . . . . . . . . . . 233.2 Results of Dithering Algorithm . . . . . . . . . . . . . . . . . . . . . . . . . . . . . 233.3 Results of Two Color Algorithms . . . . . . . . . . . . . . . . . . . . . . . . . . . . 25
vii
List of Tables
3.1 Information for Step 1 of the Benchmarking Scheme . . . . . . . . . . . . . . . . . 163.2 Information for Step 3 of the Benchmarking Scheme . . . . . . . . . . . . . . . . . 173.3 Information for Step 5 of the Benchmarking Scheme . . . . . . . . . . . . . . . . . 193.4 Example Scorecard for Benchmarking Scheme . . . . . . . . . . . . . . . . . . . . . 203.5 Scorecard for a Benchmarked Binary Image Algorithm . . . . . . . . . . . . . . . . 223.6 Scorecard for a Benchmarked Gray Image Algorithm . . . . . . . . . . . . . . . . . 243.7 Scorecard for a Benchmarked Gray and Color Image Algorithm . . . . . . . . . . . 263.8 Scorecard for a Benchmarked Binary, Gray, and Color Image Algorithm . . . . . . 27
viii
Chapter 1
Introduction
With the increase in digital media, the need for methods to protect such information is becoming
more necessary. The source of digital media’s growth can be linked to the wealth of information
provided by the Internet. The amount of information that is downloaded and uploaded increases
on a daily basis, with data ranging from simple text documents to photos of individuals to hyper-
spectral image cubes of the world. The Internet provides an ease of access that demands knowledge
of the best way to protect the visual information available on the Internet from theft, replication,
or unauthorized use.
The field of Visual Cryptography has been developed over the last several years. The original
method was proposed by Naor and Shamir [12] for binary images. This provides a perfectly
secure system where secret messages are contained in “shares”. Individually these shares resemble
random noise, but when they are stacked and aligned perfectly, their message is decrypted using
only the human visual system. While this method gives security for text and binary images, the
growth of digital media requires the expansion of this technique to provide security for gray and
color images. Several methods have been developed for securing gray and color images, including
halftoning [14], dithering [10], color subpixel groupings [6], and meaningful image shares [11, 2].
Through this expansion of the original method, Visual Cryptography provides a secure way to
1
CHAPTER 1. INTRODUCTION 2
store and transmit text, binary images, gray images, and color images.
Since the original method was released in 1994, there have been an abundance of variations,
modifications, and improvements added to the collection of available Visual Cryptography tech-
niques. As the number of published methods increase, a technique for evaluating the effectiveness,
quality, and ideal use of each of the algorithms is necessary. Currently, this information can be
determined by reading through the paper, evaluating its contents, and determining if it is a suit-
able method for a given project. While it is possible to perform this process on several algorithms
before deciding on the final method to be used, it would be beneficial for a set of standards and
performance metrics to be available for use in determining the ideal Visual Cryptography method
for a specified project. The development of a proper benchmarking scheme would allow these stan-
dards and performance metrics to exist in one uniform format. The contents of this benchmarking
scheme would contain information regarding the capabilities of the algorithms. It would determine
the primary approach and methodology used to generate the image shares. Also, it would provide
external implementation and validation of the code presented to execute the algorithm. Addition-
ally, it would provide information on image reconstruction, overall quality of reconstructed images,
and a ranking (or grade) of the algorithm compared to a given Visual Cryptography standard.
Ideally, the benchmarking scheme would result in a report card that could be read to determine
whether or not the algorithm would be a suitable method for a given project. These report cards
could either be required when publishing a new algorithm or published on the Internet for easy
access and search. The development of this benchmarking scheme would allow easy access to
the information available from published Visual Cryptography algorithms and provide a standard
metric for evaluating their capabilities and performance.
The structure of this thesis is as follows: Chapter 2 reviews the history of Visual Cryptography,
along with a proof of concept for binary, gray and color image share generation. Chapter 3
discusses the details of the proposed benchmarking scheme along with results from some algorithms.
Chapter 4 looks into the importance of the benchmarking scheme and and the project relevance
for the Visual Cryptography community. The conclusions of the thesis are found in Chapter 5 and
potential future work and project expansion are found in Chapter 6.
Chapter 2
Visual Cryptography Background
In order for the benchmarking scheme to be properly developed and executed, a developer
needs to have an awareness of the history of Visual Cryptography. The developer also needs an
understanding of the underlying concepts of Visual Cryptography and how they are used to generate
shares of binary images. Recently, Visual Cryptography has been extended to accommodate shares
of gray and color images, further extending its capabilities and versatility. This understanding of
Visual Cryptography is necessary to allow an objective comparison of all the different types of
algorithms.
2.1 History of Visual Cryptography
The field of Visual Cryptography has evolved over the past several years. The first Visual
Cryptography method was proposed by Moni Naor and Adi Shamir in 1994 [12]. Their paper
focused on a process for perfectly encrypting digital media that could be decoded using solely the
human visual system. This idea would allow written material to be digitally transmitted without
concern that the message could be intercepted and accidentally revealed to unauthorized parties.
The primary description associated with Visual Cryptography is the message being encoded into
two shares. When looked at individually, these shares reveal no information about the message
3
CHAPTER 2. VISUAL CRYPTOGRAPHY BACKGROUND 4
contained in them and resemble random noise. However, when these shares are printed on trans-
parencies, overlaid, and perfectly aligned, the message contained in the shares is revealed. The
message is revealed without additional calculation or manipulation. This feature assures that the
secure process can be used by someone who has no previous knowledge of Visual Cryptography,
programming background, or cryptographic analysis experience. Since the development of this
idea, several different variations and modifications have been developed to explore many diverse
aspects of Visual Cryptography. Some of these include an algorithm for encrypting specific image
regions [15], an algorithm using share rotation for revelation [13], and an algorithm which uses
a probabilistic scheme for share generation [3]. As these algorithms are explored and developed,
they have different approaches and techniques but the fundamental underlying architecture draws
directly from the original Visual Cryptography technique.
2.2 Proof of Concept - Binary Images
The process behind Visual Cryptography allows messages to be contained in seemingly random
shares. The generation of these shares demonstrates the concept of Visual Cryptography along
with its strengths and limitations. Assuming that the message being encrypted is a binary image
with p pixels, each of these pixels are separately encoded with a subpixel grouping with s pixels.
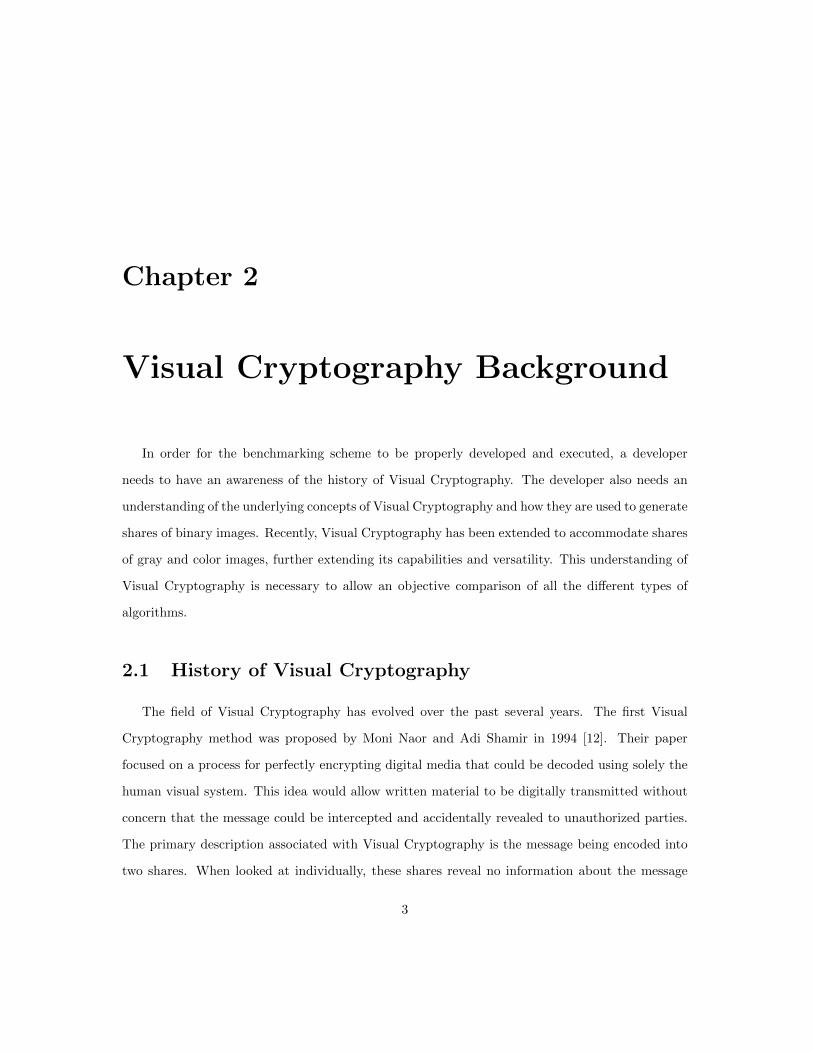
This allows n shares to be generated using these subpixel groupings. “Each share is a collection of
Figure 2.1: Shares Most Commonly Used for Visual Cryptography Algorithms [12]
m black and white subpixels, which are printed in close proximity to each other so that the human
visual system averages their individual black/white contributions.” [12] These subpixel groupings
are typically square ( s2x
s2 ) to not distort the aspect ratio of the original image. However, subpixel
CHAPTER 2. VISUAL CRYPTOGRAPHY BACKGROUND 5
groupings that are not square do happen in Visual Cryptography algorithms and the aspect ratio
of the image is altered accordingly.
The most frequently used subpixel groupings in Visual Cryptography algorithms are shown in
Figure 2.1. The image is encoded in n shares and the message can be revealed by stacking k of
those n shares. However, if k − 1 shares are stacked together, the encoded message cannot be
seen. This provides security by the fact that the messages cannot be revealed unless a minimum
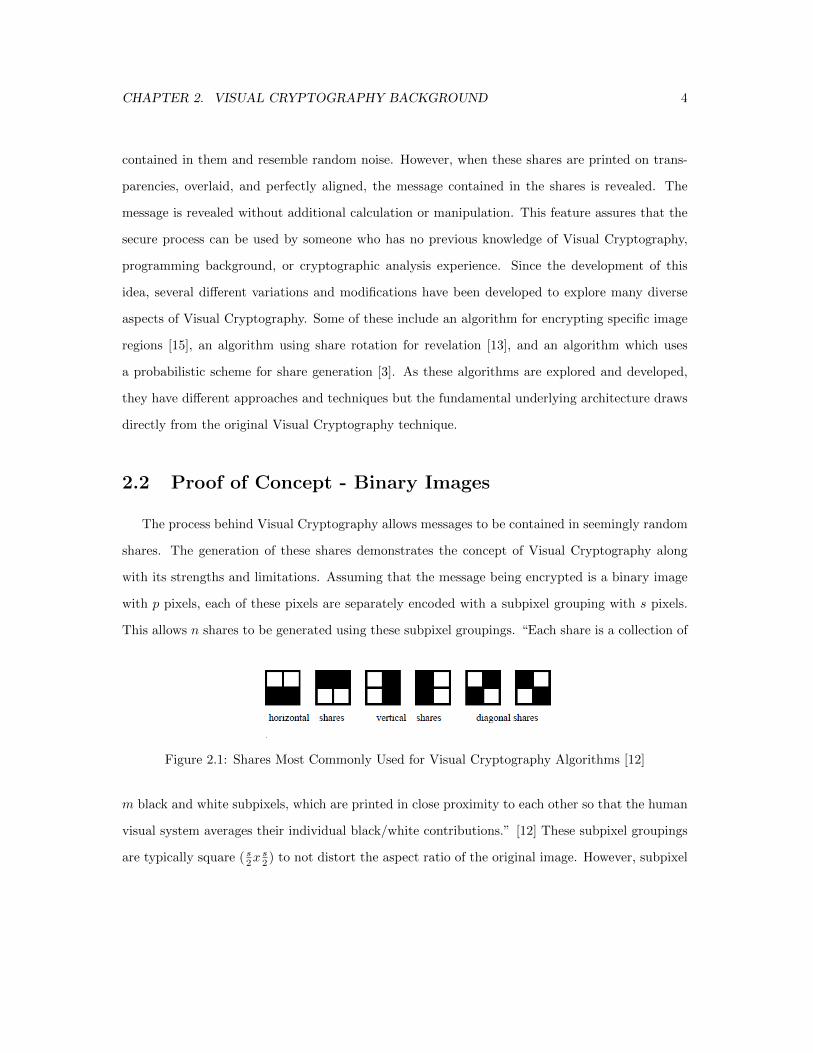
Figure 2.2: Visual Cryptography Scheme for Binary Images [7]
number of shares are stacked together, in addition to the security of seemingly random shares. The
generation of the shares is based on the value of the pixel and the probability of a subpixel group
occurring. A share generation scheme corresponding to k = 2 and n = 2 is shown in Figure 2.2.
This is applied to a binary image by assigning the corresponding subpixel grouping to the pixels
throughout the image. This results in two random shares where the message cannot be identified.
The mathematical proof of this scheme and its perfect encryption are shown in the original paper
by Naor and Shamir “Visual Cryptography” [12].
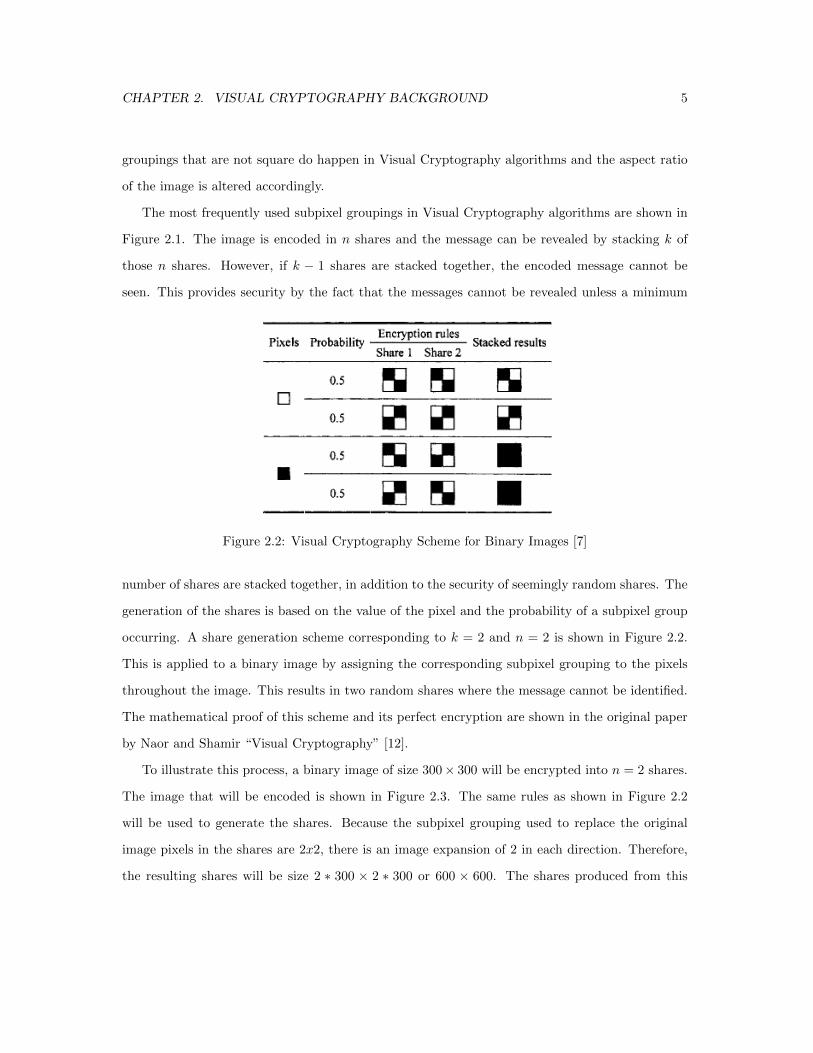
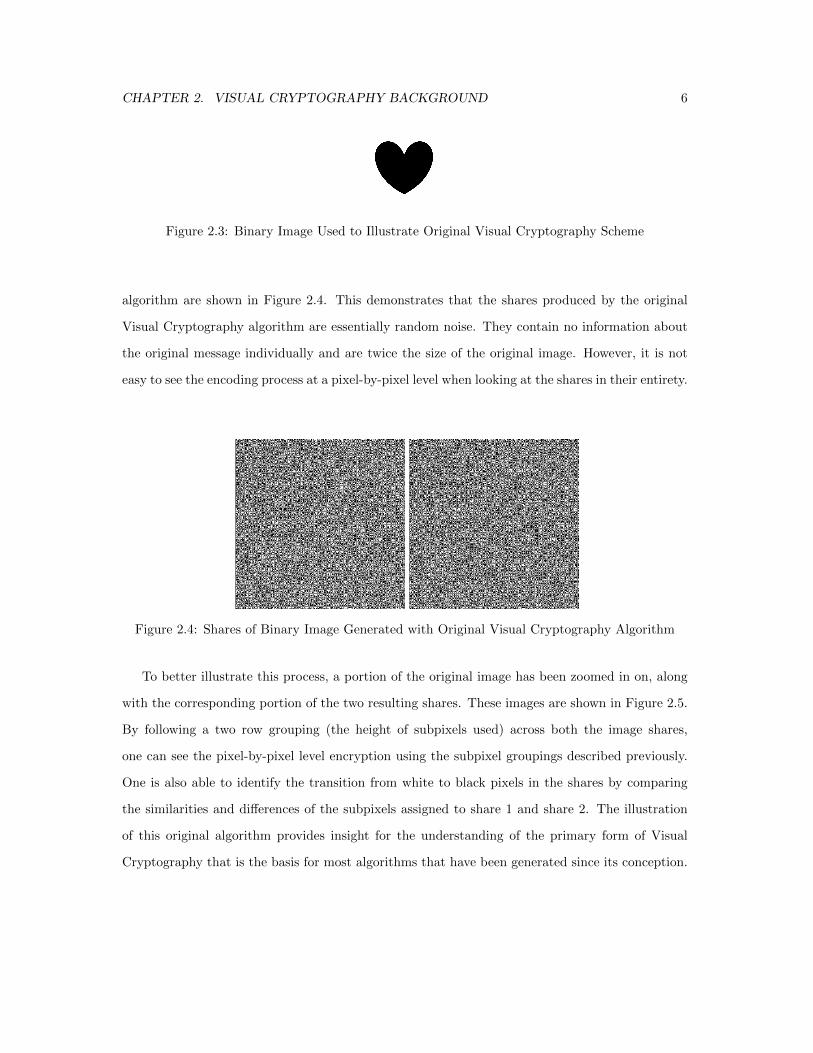
To illustrate this process, a binary image of size 300× 300 will be encrypted into n = 2 shares.
The image that will be encoded is shown in Figure 2.3. The same rules as shown in Figure 2.2
will be used to generate the shares. Because the subpixel grouping used to replace the original
image pixels in the shares are 2x2, there is an image expansion of 2 in each direction. Therefore,
the resulting shares will be size 2 ∗ 300 × 2 ∗ 300 or 600 × 600. The shares produced from this
CHAPTER 2. VISUAL CRYPTOGRAPHY BACKGROUND 6
Figure 2.3: Binary Image Used to Illustrate Original Visual Cryptography Scheme
algorithm are shown in Figure 2.4. This demonstrates that the shares produced by the original
Visual Cryptography algorithm are essentially random noise. They contain no information about
the original message individually and are twice the size of the original image. However, it is not
easy to see the encoding process at a pixel-by-pixel level when looking at the shares in their entirety.
Figure 2.4: Shares of Binary Image Generated with Original Visual Cryptography Algorithm
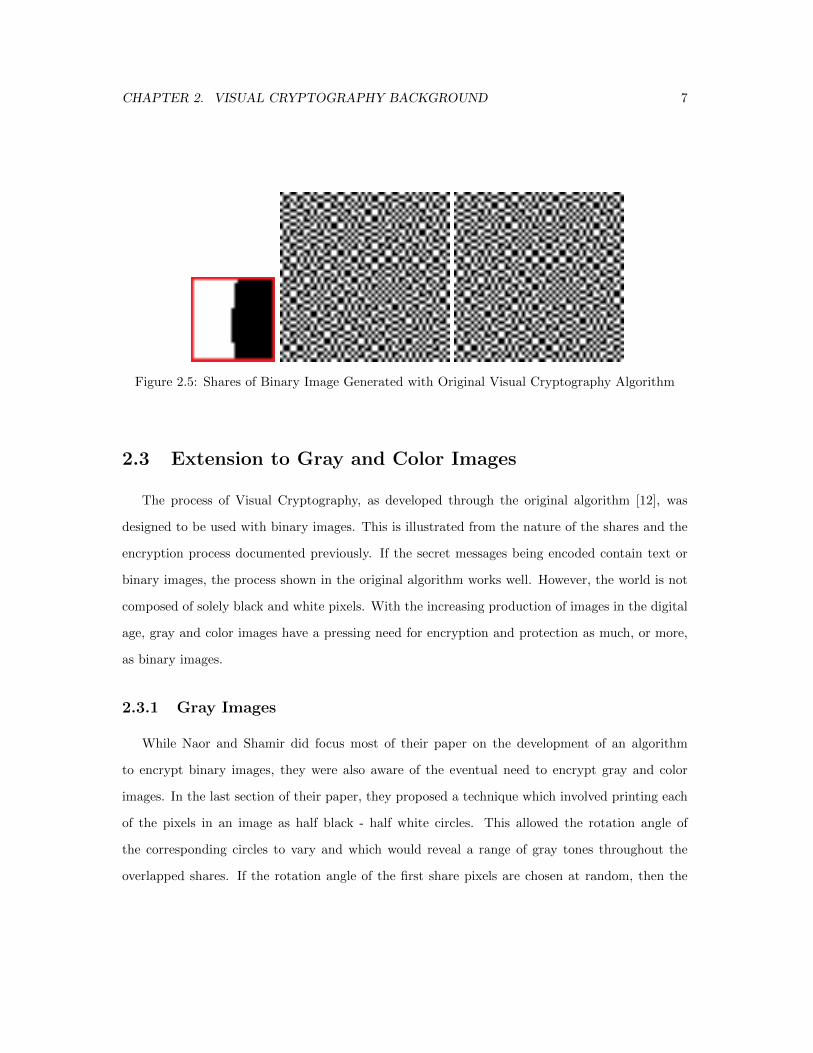
To better illustrate this process, a portion of the original image has been zoomed in on, along
with the corresponding portion of the two resulting shares. These images are shown in Figure 2.5.
By following a two row grouping (the height of subpixels used) across both the image shares,
one can see the pixel-by-pixel level encryption using the subpixel groupings described previously.
One is also able to identify the transition from white to black pixels in the shares by comparing
the similarities and differences of the subpixels assigned to share 1 and share 2. The illustration
of this original algorithm provides insight for the understanding of the primary form of Visual
Cryptography that is the basis for most algorithms that have been generated since its conception.
CHAPTER 2. VISUAL CRYPTOGRAPHY BACKGROUND 7
Figure 2.5: Shares of Binary Image Generated with Original Visual Cryptography Algorithm
2.3 Extension to Gray and Color Images
The process of Visual Cryptography, as developed through the original algorithm [12], was
designed to be used with binary images. This is illustrated from the nature of the shares and the
encryption process documented previously. If the secret messages being encoded contain text or
binary images, the process shown in the original algorithm works well. However, the world is not
composed of solely black and white pixels. With the increasing production of images in the digital
age, gray and color images have a pressing need for encryption and protection as much, or more,
as binary images.
2.3.1 Gray Images
While Naor and Shamir did focus most of their paper on the development of an algorithm
to encrypt binary images, they were also aware of the eventual need to encrypt gray and color
images. In the last section of their paper, they proposed a technique which involved printing each
of the pixels in an image as half black - half white circles. This allowed the rotation angle of
the corresponding circles to vary and which would reveal a range of gray tones throughout the
overlapped shares. If the rotation angle of the first share pixels are chosen at random, then the
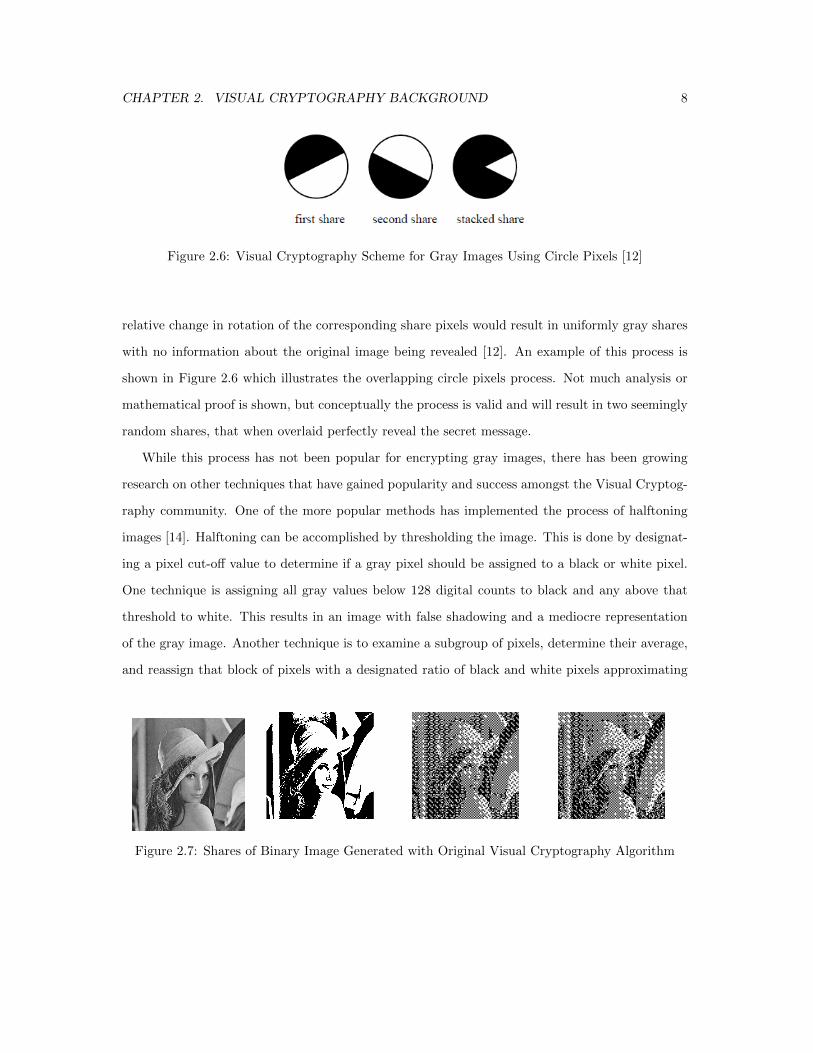
CHAPTER 2. VISUAL CRYPTOGRAPHY BACKGROUND 8
Figure 2.6: Visual Cryptography Scheme for Gray Images Using Circle Pixels [12]
relative change in rotation of the corresponding share pixels would result in uniformly gray shares
with no information about the original image being revealed [12]. An example of this process is
shown in Figure 2.6 which illustrates the overlapping circle pixels process. Not much analysis or
mathematical proof is shown, but conceptually the process is valid and will result in two seemingly
random shares, that when overlaid perfectly reveal the secret message.
While this process has not been popular for encrypting gray images, there has been growing
research on other techniques that have gained popularity and success amongst the Visual Cryptog-
raphy community. One of the more popular methods has implemented the process of halftoning
images [14]. Halftoning can be accomplished by thresholding the image. This is done by designat-
ing a pixel cut-off value to determine if a gray pixel should be assigned to a black or white pixel.
One technique is assigning all gray values below 128 digital counts to black and any above that
threshold to white. This results in an image with false shadowing and a mediocre representation
of the gray image. Another technique is to examine a subgroup of pixels, determine their average,
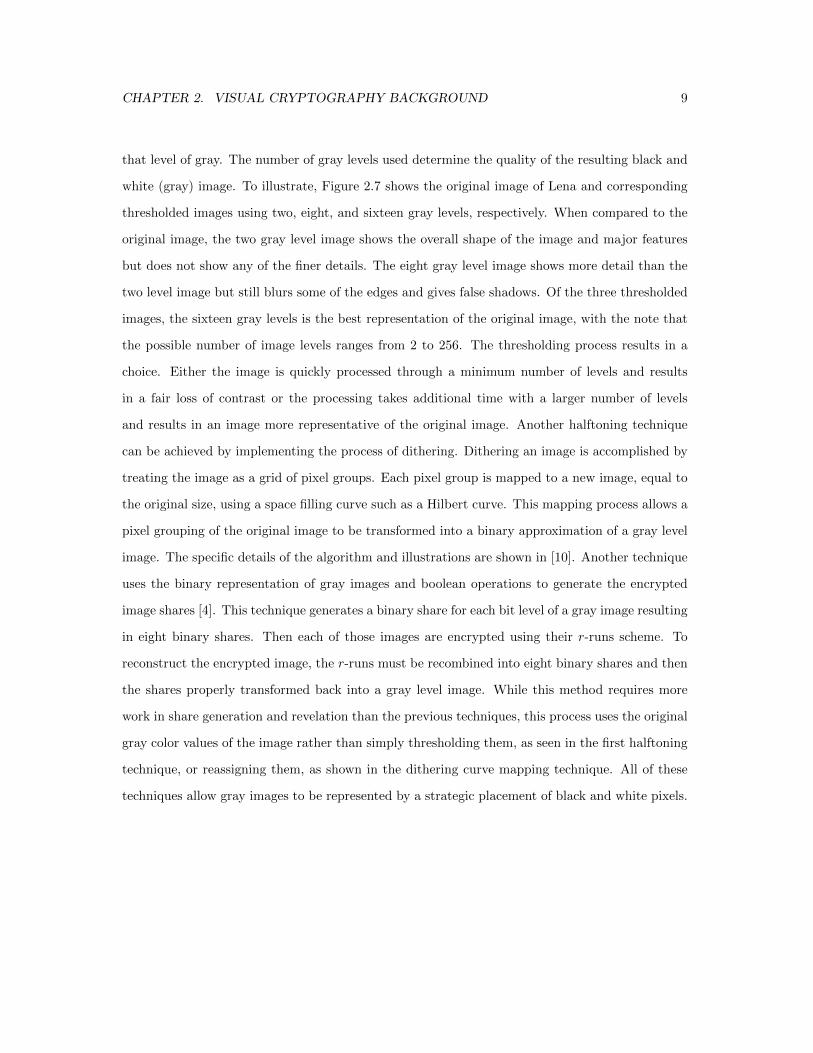
and reassign that block of pixels with a designated ratio of black and white pixels approximating
Figure 2.7: Shares of Binary Image Generated with Original Visual Cryptography Algorithm
CHAPTER 2. VISUAL CRYPTOGRAPHY BACKGROUND 9
that level of gray. The number of gray levels used determine the quality of the resulting black and
white (gray) image. To illustrate, Figure 2.7 shows the original image of Lena and corresponding
thresholded images using two, eight, and sixteen gray levels, respectively. When compared to the
original image, the two gray level image shows the overall shape of the image and major features
but does not show any of the finer details. The eight gray level image shows more detail than the
two level image but still blurs some of the edges and gives false shadows. Of the three thresholded
images, the sixteen gray levels is the best representation of the original image, with the note that
the possible number of image levels ranges from 2 to 256. The thresholding process results in a
choice. Either the image is quickly processed through a minimum number of levels and results
in a fair loss of contrast or the processing takes additional time with a larger number of levels
and results in an image more representative of the original image. Another halftoning technique
can be achieved by implementing the process of dithering. Dithering an image is accomplished by
treating the image as a grid of pixel groups. Each pixel group is mapped to a new image, equal to
the original size, using a space filling curve such as a Hilbert curve. This mapping process allows a
pixel grouping of the original image to be transformed into a binary approximation of a gray level
image. The specific details of the algorithm and illustrations are shown in [10]. Another technique
uses the binary representation of gray images and boolean operations to generate the encrypted
image shares [4]. This technique generates a binary share for each bit level of a gray image resulting
in eight binary shares. Then each of those images are encrypted using their r-runs scheme. To
reconstruct the encrypted image, the r-runs must be recombined into eight binary shares and then
the shares properly transformed back into a gray level image. While this method requires more
work in share generation and revelation than the previous techniques, this process uses the original
gray color values of the image rather than simply thresholding them, as seen in the first halftoning
technique, or reassigning them, as shown in the dithering curve mapping technique. All of these
techniques allow gray images to be represented by a strategic placement of black and white pixels.
CHAPTER 2. VISUAL CRYPTOGRAPHY BACKGROUND 10
2.3.2 Color Images
Just as images in the world cannot be solely represented by binary images, gray images are not
sufficient either. Representation of the world in color images is important for our understanding of
the world and allows the storage of information linked to the human visual system’s interpretation
of the world. The incorporation of color into Visual Cryptography would offer security to a majority
of the digital media being generated today.
The original Visual Cryptography paper did not explicitly state an expansion of their method
that would allow shares to be generated of color images. However, they did consider the possibility
of concealing secret messages within innocent looking images with little visible tampering. While
this does not directly allow shares to be generated with color images, it is the basis for several
color Visual Cryptography methods.
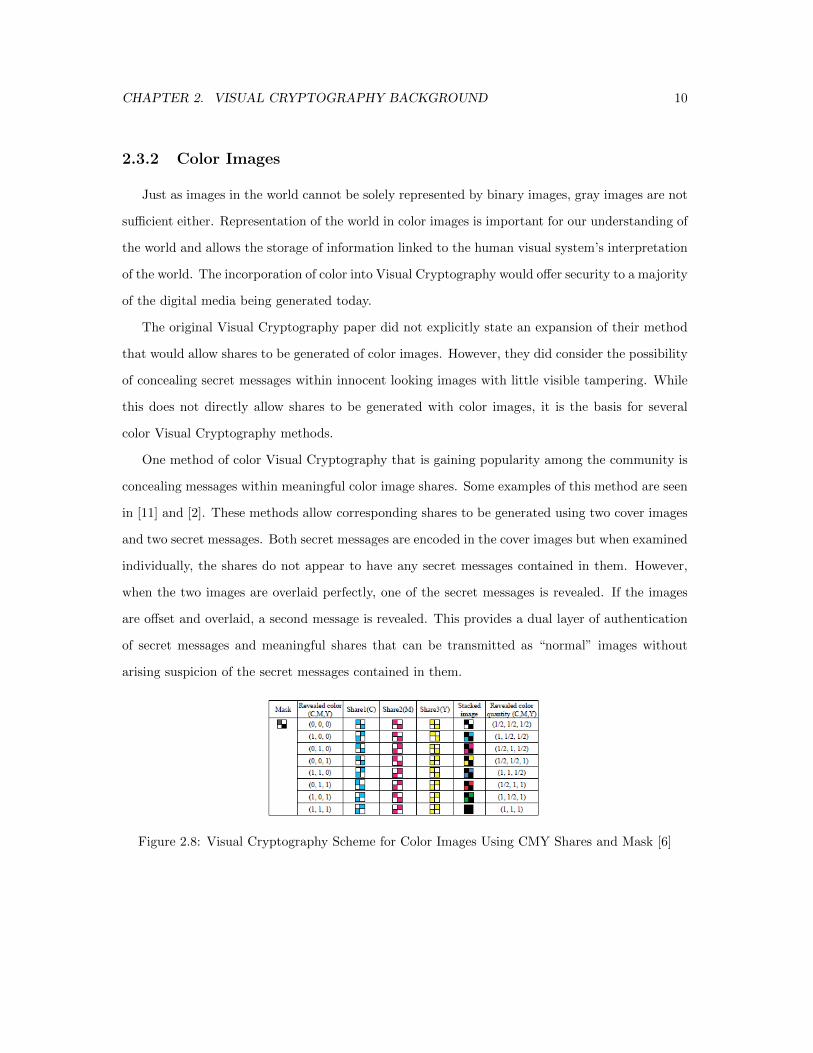
One method of color Visual Cryptography that is gaining popularity among the community is
concealing messages within meaningful color image shares. Some examples of this method are seen
in [11] and [2]. These methods allow corresponding shares to be generated using two cover images
and two secret messages. Both secret messages are encoded in the cover images but when examined
individually, the shares do not appear to have any secret messages contained in them. However,
when the two images are overlaid perfectly, one of the secret messages is revealed. If the images
are offset and overlaid, a second message is revealed. This provides a dual layer of authentication
of secret messages and meaningful shares that can be transmitted as “normal” images without
arising suspicion of the secret messages contained in them.
Figure 2.8: Visual Cryptography Scheme for Color Images Using CMY Shares and Mask [6]
CHAPTER 2. VISUAL CRYPTOGRAPHY BACKGROUND 11
Another method of color Visual cryptography stems from the original method by attempting
to encrypt colored pixels of an image. Some examples of this are seen in [6]. One method from
this paper uses a process that generates three halftone color shares from the CMY components of
the image. For revelation, the three shares are stacked and a mask is placed over the three shares
to remove unwanted color components, revealing a halftoned version of the original image. This
process is shown in Figure 2.8 with the various pixel subgroupings and revelation processes. This
automatically generates a minimum of four shares which adds to the complexity of how the image
revelation occurs. Another method from this paper uses a subpixel groupings of four pixels (cyan,
magenta, yellow, and white) and distributes the various groupings so their overlapping corresponds
to the approximate color of the image in that location. The various colors and positions in the
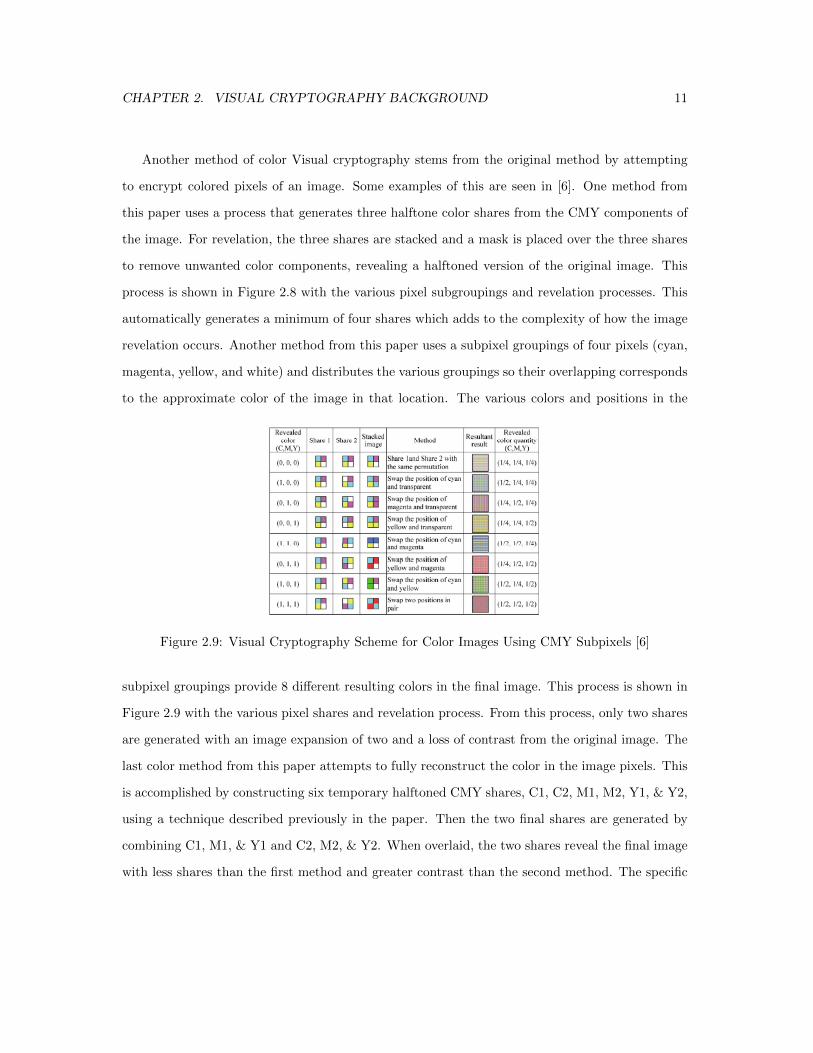
Figure 2.9: Visual Cryptography Scheme for Color Images Using CMY Subpixels [6]
subpixel groupings provide 8 different resulting colors in the final image. This process is shown in
Figure 2.9 with the various pixel shares and revelation process. From this process, only two shares
are generated with an image expansion of two and a loss of contrast from the original image. The
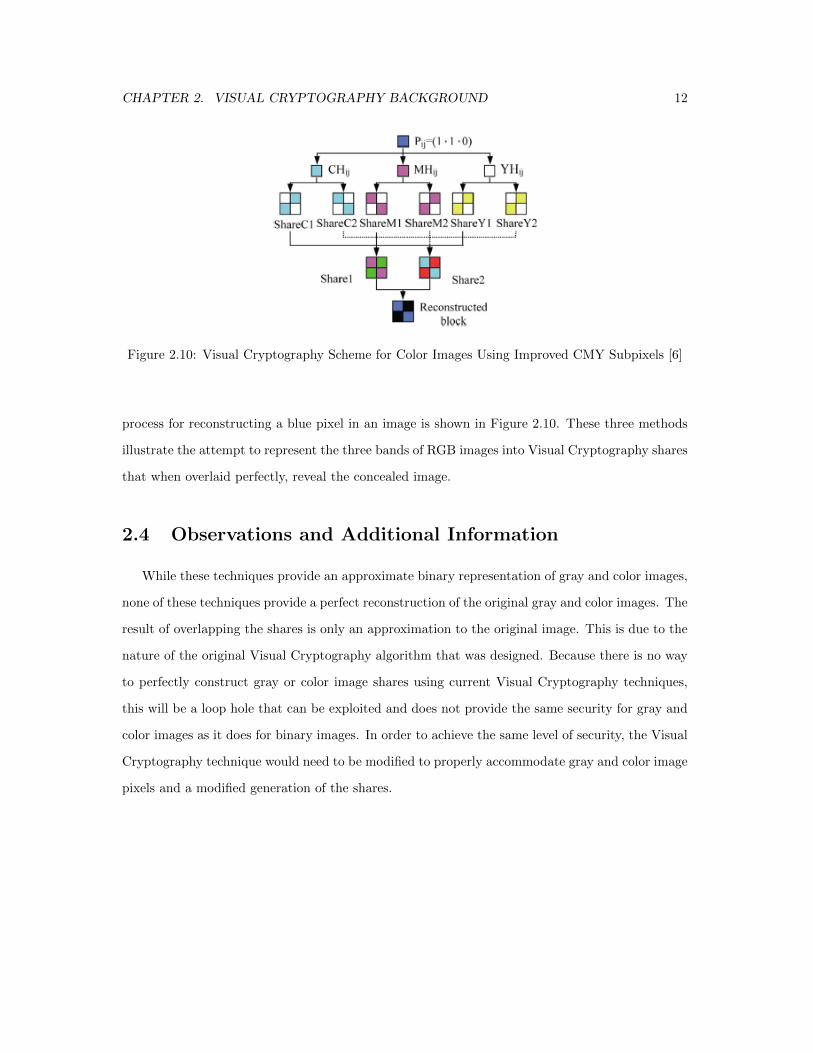
last color method from this paper attempts to fully reconstruct the color in the image pixels. This
is accomplished by constructing six temporary halftoned CMY shares, C1, C2, M1, M2, Y1, & Y2,
using a technique described previously in the paper. Then the two final shares are generated by
combining C1, M1, & Y1 and C2, M2, & Y2. When overlaid, the two shares reveal the final image
with less shares than the first method and greater contrast than the second method. The specific
CHAPTER 2. VISUAL CRYPTOGRAPHY BACKGROUND 12
Figure 2.10: Visual Cryptography Scheme for Color Images Using Improved CMY Subpixels [6]
process for reconstructing a blue pixel in an image is shown in Figure 2.10. These three methods
illustrate the attempt to represent the three bands of RGB images into Visual Cryptography shares
that when overlaid perfectly, reveal the concealed image.
2.4 Observations and Additional Information
While these techniques provide an approximate binary representation of gray and color images,
none of these techniques provide a perfect reconstruction of the original gray and color images. The
result of overlapping the shares is only an approximation to the original image. This is due to the
nature of the original Visual Cryptography algorithm that was designed. Because there is no way
to perfectly construct gray or color image shares using current Visual Cryptography techniques,
this will be a loop hole that can be exploited and does not provide the same security for gray and
color images as it does for binary images. In order to achieve the same level of security, the Visual
Cryptography technique would need to be modified to properly accommodate gray and color image
pixels and a modified generation of the shares.
Chapter 3
Benchmarking Analysis
As seen from the previous chapter, there are many different types of Visual Cryptography
algorithms. They all stem from the same original algorithm by Naor and Shamir [12] but they
cover many different aspects, ranging from concealing secret messages in binary image shares
to messages hidden in meaningful color image shares. The growth of the available number of
algorithms is increasing and will likely continue to increase as the interest in the field of Visual
Cryptography grows. Because of this growth, a scheme to evaluate the effectiveness, quality,
and ideal use of each algorithm becomes more pertinent. Developing a benchmarking scheme
would allow each of the algorithms to be properly evaluated, compared to an established Visual
Cryptography standard, and assessed for their strengths and weaknesses.
3.1 History of Benchmarking
The origins of the benchmarking process in the business world find its roots at the Xerox
Corporation in the 1970s [5]. The engineers at the company were aiming to understand how the
Japanese were producing a better product at a lower cost. They “adopted process engineering
techniques to scrutinize every step of its own manufacturing procedures and those of its rivals”
[5]. Through this process, they improved their processes, beat out the competition, and were able
13
CHAPTER 3. BENCHMARKING ANALYSIS 14
to successfully apply this technique to all aspects of the company. The formal documentation of
the benchmarking process was first published by Robert C. Camp, who is still considered to be a
leading expert on the benchmarking process.
“The Japanese word dantosu – striving to be the best of the best – captures the essence of
benchmarking” [1]. The process of benchmarking has been well established in the business world
and has been successfully applied to many different companies with noticeable results achieved.
There are five phases that encompass the process of benchmarking. The first phase is planning.
This phase identifies what aspect or product from the company will be benchmarked. It also
determines who the competitors are and how the data will be collected. If a company has never
implemented a benchmarking scheme, this process could consume the most amount of time and
require much revision before the benchmarking scheme is actually executed by the company. The
second phase is information gathering. Through surveys, algorithms, and public domain infor-
mation, the actual data is acquired and gathered. This phase can be laborious due to the large
amount of data that needs to be collected. The third phase is analysis and integration. This
is where the data is analyzed and the results of the benchmarking process are determined. This
allows the company to be numerically compared to the competition and develop a performance gap
which is either positive, negative, or zero. Ideally, when the company is benchmarked, it should
have superior performance as compared to the competition, indicated by a positive performance
gap. The fourth phase is implementation and execution. After the results are discovered, they are
presented to upper management for acceptance. This allows a plan of action to be developed and
implemented to reduce the difference between the competition or maintain the positive edge. It is
also crucial at this phase that the plan of action is continuously followed by the company and its
employees. The fifth and final phase is recalibration. The phase allows the benchmarking process
to be under review and analysis while it is being implemented and after the plan of action has been
established. It also allows necessary adjustments to be made to enable the company to maintain
its competitive edge as new information is obtained and benchmarking has been established as an
effective technique. [8] The process of benchmarking is constantly evolving to suite different needs
and requires evaluation, revision, and updating to be a successful technique.

CHAPTER 3. BENCHMARKING ANALYSIS 15
3.2 Necessary Content for Benchmarking Scheme
In order to develop a benchmarking scheme for Visual Cryptography algorithms, the business
practices must be redefined to accommodate the process of Visual Cryptography and a standard
developed to determine the effectiveness of a given algorithm. The benchmarking scheme would
need to be able to identify the capabilities of the algorithm with regards to handling binary, gray,
and color images. It would also be necessary to categorize the type of approach used to generate
the image shares, such as the original Visual Cryptography technique, dithering, wavelet transform,
meaningful shares, or other methods. An evaluation of the pseudo code provided would also need to
be assessed and evaluated for its clarity, descriptivity, and content. The reconstruction of the image
from the shares would also need to be evaluated for its method, difficulty, and overall reconstructed
image quality. There would also need to be a section corresponding to general observations,
comparison to other algorithms, the rank (or grade) of the algorithm, and any other comments
or notes. Compiling this information would allow a scorecard to be generated encompassing all
of this information in an organized fashion. This benchmarking scheme hinges on the ability of
assigning numerical rankings and scores to these Visual Cryptography concepts.
3.3 Benchmarking Scheme
The proposed benchmarking scheme is presented in this section. The specific details of each
benchmarking step will be discussed and elaborated on to illustrate the process. This benchmarking
scheme successfully incorporates the necessary content listed above and provides a method for
evaluating Visual Cryptography algorithms and determining their strengths and limitations.
The first step of the benchmarking scheme is to gather information about the algorithm. Some
important information to acquire is the name and paper reference to include with the final score-
card. Additionally, several algorithm capabilities need to be identified, one of which is the type of
images the algorithm is capable of handling. Although this information should be readily available
in the name of the algorithm or abstract, this is not always the case and is sometimes is a mislead-
CHAPTER 3. BENCHMARKING ANALYSIS 16
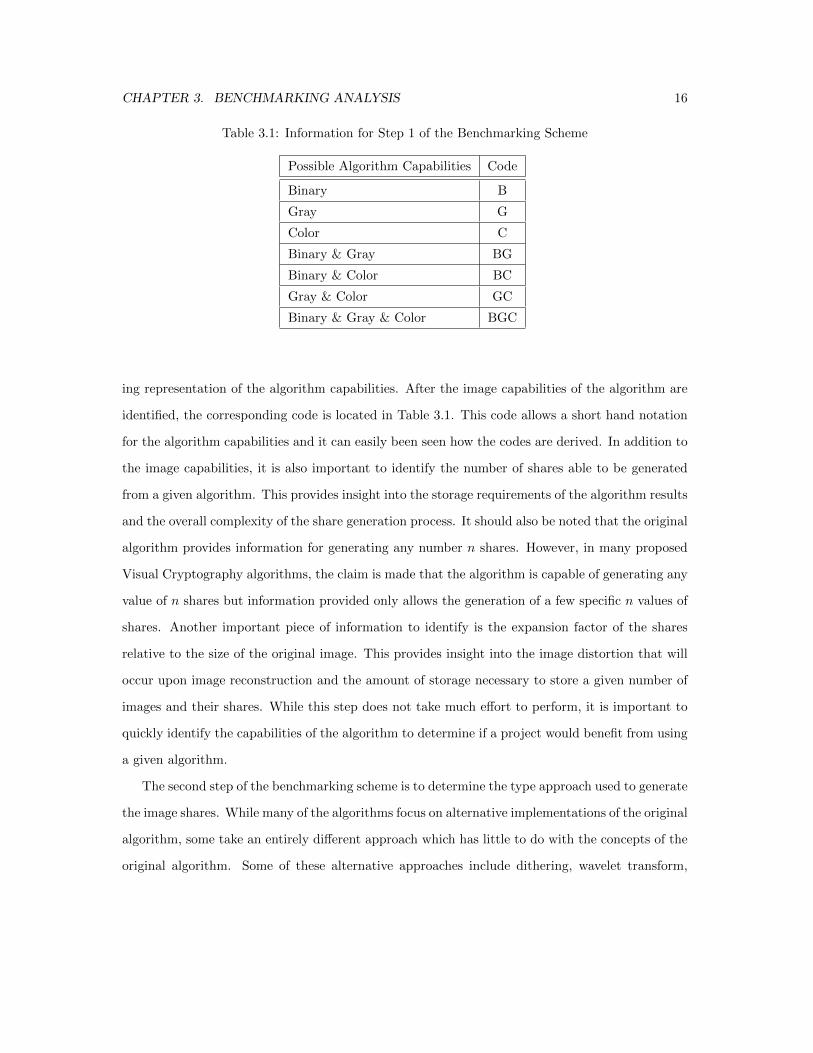
Table 3.1: Information for Step 1 of the Benchmarking Scheme
Possible Algorithm Capabilities Code
Binary B
Gray G
Color C
Binary & Gray BG
Binary & Color BC
Gray & Color GC
Binary & Gray & Color BGC
ing representation of the algorithm capabilities. After the image capabilities of the algorithm are
identified, the corresponding code is located in Table 3.1. This code allows a short hand notation
for the algorithm capabilities and it can easily been seen how the codes are derived. In addition to
the image capabilities, it is also important to identify the number of shares able to be generated
from a given algorithm. This provides insight into the storage requirements of the algorithm results
and the overall complexity of the share generation process. It should also be noted that the original
algorithm provides information for generating any number n shares. However, in many proposed
Visual Cryptography algorithms, the claim is made that the algorithm is capable of generating any
value of n shares but information provided only allows the generation of a few specific n values of
shares. Another important piece of information to identify is the expansion factor of the shares
relative to the size of the original image. This provides insight into the image distortion that will
occur upon image reconstruction and the amount of storage necessary to store a given number of
images and their shares. While this step does not take much effort to perform, it is important to
quickly identify the capabilities of the algorithm to determine if a project would benefit from using
a given algorithm.
The second step of the benchmarking scheme is to determine the type approach used to generate
the image shares. While many of the algorithms focus on alternative implementations of the original
algorithm, some take an entirely different approach which has little to do with the concepts of the
original algorithm. Some of these alternative approaches include dithering, wavelet transform,
CHAPTER 3. BENCHMARKING ANALYSIS 17
meaningful shares, color subpixels, and multiple others. The variations with respect to the original
algorithm are often correlated with its ability to handle gray and color images. With this knowledge
of the approach used to generate the image shares, the approach can be listed on the scorecard
in the form of a short description (1-4 words). This provides an initial conceptualization of the
algorithm and its method of implementation. It also leads into the construction of the algorithm
and what approach the authors use to generate the image shares.
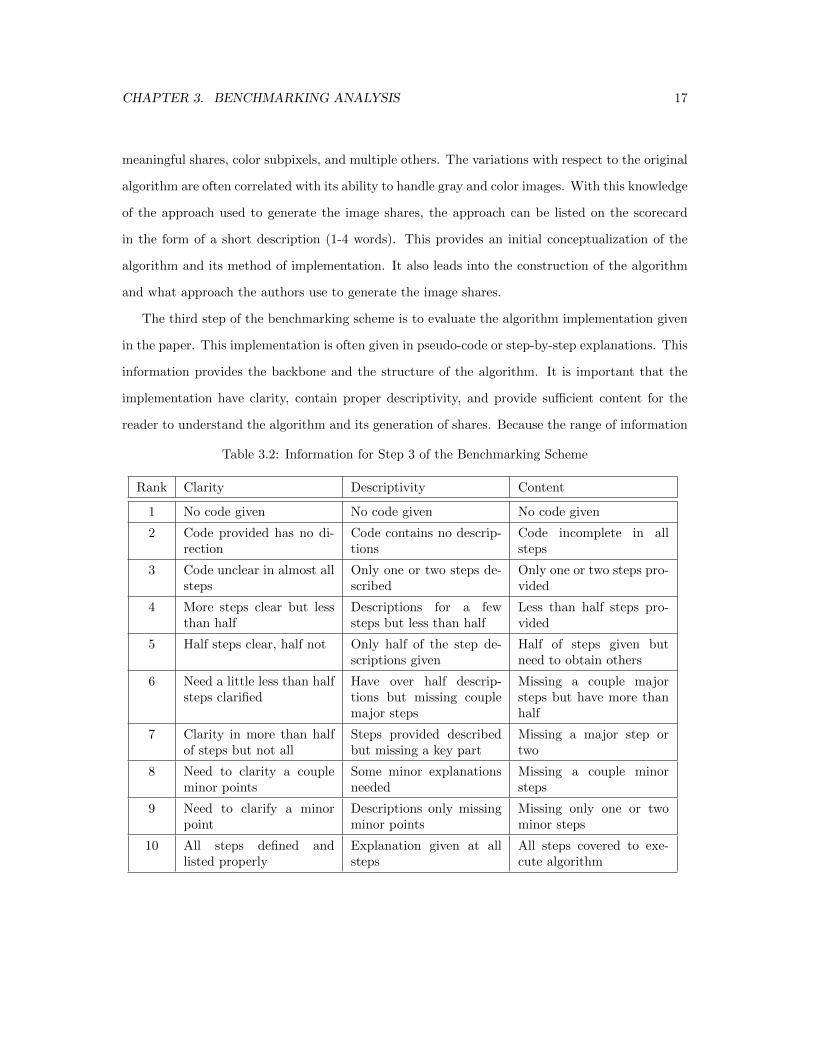
The third step of the benchmarking scheme is to evaluate the algorithm implementation given
in the paper. This implementation is often given in pseudo-code or step-by-step explanations. This
information provides the backbone and the structure of the algorithm. It is important that the
implementation have clarity, contain proper descriptivity, and provide sufficient content for the
reader to understand the algorithm and its generation of shares. Because the range of information
Table 3.2: Information for Step 3 of the Benchmarking Scheme
Rank Clarity Descriptivity Content
1 No code given No code given No code given
2 Code provided has no di-rection
Code contains no descrip-tions
Code incomplete in allsteps
3 Code unclear in almost allsteps
Only one or two steps de-scribed
Only one or two steps pro-vided
4 More steps clear but lessthan half
Descriptions for a fewsteps but less than half
Less than half steps pro-vided
5 Half steps clear, half not Only half of the step de-scriptions given
Half of steps given butneed to obtain others
6 Need a little less than halfsteps clarified
Have over half descrip-tions but missing couplemajor steps
Missing a couple majorsteps but have more thanhalf
7 Clarity in more than halfof steps but not all
Steps provided describedbut missing a key part
Missing a major step ortwo
8 Need to clarity a coupleminor points
Some minor explanationsneeded
Missing a couple minorsteps
9 Need to clarify a minorpoint
Descriptions only missingminor points
Missing only one or twominor steps
10 All steps defined andlisted properly
Explanation given at allsteps
All steps covered to exe-cute algorithm
CHAPTER 3. BENCHMARKING ANALYSIS 18
provided in pseudo-code, the algorithm being evaluated will be ranked on a scale of one to ten in the
three categories listed above: clarity, descriptivity, and content. The numerical ranking depends
on a number of factors and information provided. The specific amount assigned is determined from
Table 3.2 which contains the meaning of each numerical ranking assignment. This ranking has the
potential to be subjective to personal opinion and capabilities with regards to code implementation
and perception. To remove some of this bias, it is recommended that three or more independent
people evaluate the pseudo-code provided to determine their rankings and opinions. Then, these
three or more responses are averaged to give a reduced bias final ranking. This evaluation of
the algorithm implementation provides an understanding of the algorithm that is essential for
determining if this algorithm would be applicable to a specific project and if the team has the
capabilities to implement it.
The fourth step of the benchmarking scheme is to gain insight into the image reconstruction
process. Standardly, reconstructed images are revealed by printing the shares on transparencies,
overlapping them, and perfectly aligning them. This process is tedious and often time consuming.
Therefore, alternative reconstruction processes are often proposed in Visual Cryptography papers.
For the original algorithm, the transparency overlap process can be digitally approximated using
the exclusive or (xor) operator. This process can be applied to some of the proposed algorithms as
well. Other algorithms require an “inverse” scheme to be developed which reconstructs the image
from the given information in the shares. This image reconstruction process is documented using
key characteristics such as the method of reconstruction, ease of implementation, and an image
quality metric (PSNR, noise correlation, etc.). Similarly to the type of approach used generated
the image shares, the reconstruction methods should be characterized in a short description. The
ease of implementation should be classified as either easy, medium, or hard. The easiest method is
considered to be using the xor operation and the hardest method is considered implementation of
completely different algorithm to reconstruct the image from the shares. The image quality metric
is a comparison of the original image to the reconstructed image. This allows the overall quality of
the algorithm to be assessed from the perception of the reconstructed image. For binary images,
the PSNR metric does not produce good results so an alternative metric such as noise correlation
CHAPTER 3. BENCHMARKING ANALYSIS 19
can also be reported. The visual perception of the images can also be reported in the comments
section to clarify the results and note any discrepancies from the metric. This step is important
in understanding the reconstruction process and the quality of images that are reconstructed from
the shares.
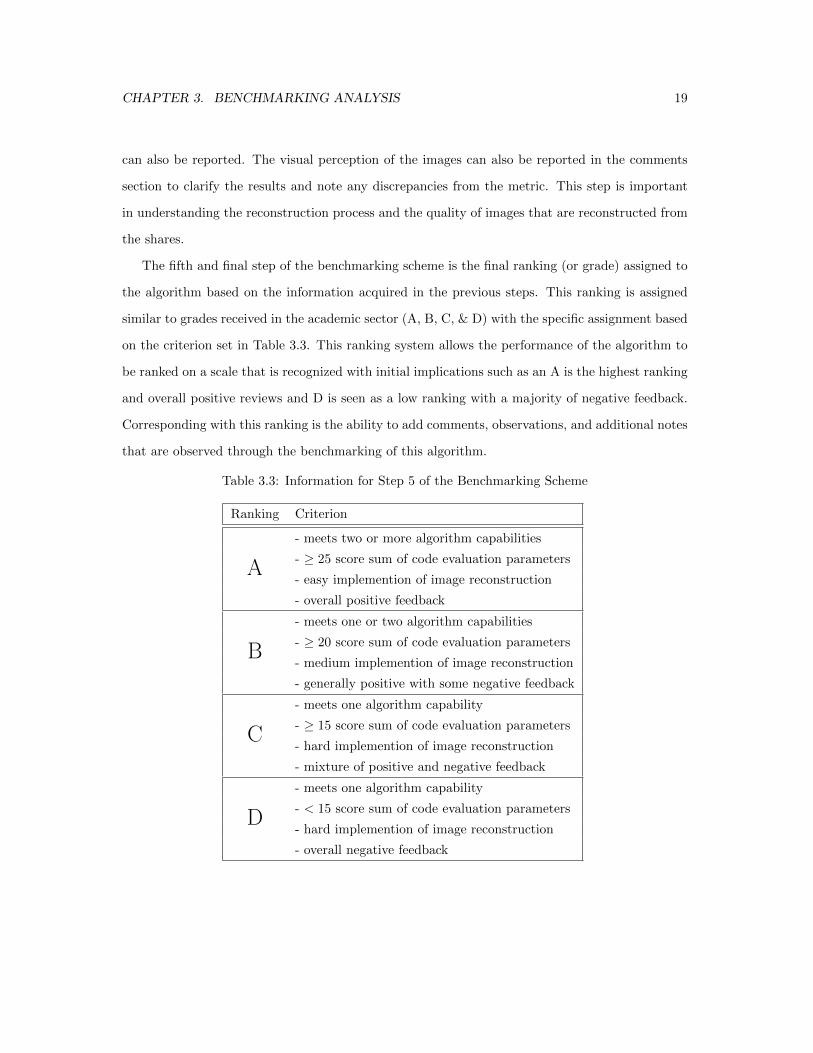
The fifth and final step of the benchmarking scheme is the final ranking (or grade) assigned to
the algorithm based on the information acquired in the previous steps. This ranking is assigned
similar to grades received in the academic sector (A, B, C, & D) with the specific assignment based
on the criterion set in Table 3.3. This ranking system allows the performance of the algorithm to
be ranked on a scale that is recognized with initial implications such as an A is the highest ranking
and overall positive reviews and D is seen as a low ranking with a majority of negative feedback.
Corresponding with this ranking is the ability to add comments, observations, and additional notes
that are observed through the benchmarking of this algorithm.
Table 3.3: Information for Step 5 of the Benchmarking Scheme
Ranking Criterion
A
- meets two or more algorithm capabilities
- ≥ 25 score sum of code evaluation parameters
- easy implemention of image reconstruction
- overall positive feedback
B
- meets one or two algorithm capabilities
- ≥ 20 score sum of code evaluation parameters
- medium implemention of image reconstruction
- generally positive with some negative feedback
C
- meets one algorithm capability
- ≥ 15 score sum of code evaluation parameters
- hard implemention of image reconstruction
- mixture of positive and negative feedback
D
- meets one algorithm capability
- < 15 score sum of code evaluation parameters
- hard implemention of image reconstruction
- overall negative feedback
CHAPTER 3. BENCHMARKING ANALYSIS 20
While this benchmarking scheme does not follow the standard practice business model, it does
provide a method for differentiating between given Visual Cryptography algorithms. It also allows
them to be properly assessed for their strengths and weaknesses. This benchmarking process
covers obtaining information about the algorithm, identifying its image capabilities, determining
the process used to generate the shares, a numerical ranking of the algorithm code provided, an
understanding of the reconstructed images from the shares, and an overall score for the algorithm
in the form of a letter grade.
3.3.1 Benchmarking Scorecard
The organization of the data obtained from the benchmarking scheme is crucial for allowing
readers to use the information available to make an educated decision about the best algorithm
for their task or project. To present the benchmarking data, the following design is proposed in
Table 3.4: Example Scorecard for Benchmarking Scheme
Title of AlgorithmX
Paper Reference
Algorithm Capabilities XXX
Number of shares (min-max) # - #
Expansion factor (x, y) (#,#)
Type of Approach Used Description
Code Evaluation
clarity #
descriptivity #
content #
Total Σ
Image Reconstruction from Shares
Method Description
Ease of Implementation Difficulty
PSNR (original to reconstructed) #
Comments/Notes/Observations
white space available
CHAPTER 3. BENCHMARKING ANALYSIS 21
Table 3.4. This design prominently displays the title and overall rank of the algorithm. It also lists
the data obtained from each of the steps of the benchmarking scheme. Lastly, it leaves a space for
additional comments, notes, and observations seen while benchmarking the algorithm. The layout
of the card provides the optimum amount of information to help in making a decision about the
algorithm, while not overwhelming the reader with too much extraneous information.
3.4 Results of Benchmarking Scheme
The process of the benchmarking scheme for Visual Cryptography algorithms is intended to
be performed on any and all available algorithms. The versatility allows the same standards to
be upheld whether the algorithm is capable of handling solely binary images or all binary, gray,
and color images. To demonstrate the process of benchmarking, several algorithms have been
selected and will be analyzed with a final scorecard generated for each corresponding algorithm.
The algorithms are listed in individual sections with their final scorecard shown at the end of each
corresponding section.
The original algorithm has not been benchmarked in this thesis. This is due to the algorithm
being the basis for the benchmarking process and also due to time constraints. The original
algorithm could be benchmarked but it would not be essential due to the incorporation of the
algorithm in many different algorithms. Ideally, the original algorithm would score the highest
grade from the benchmarking scheme and is considered the primary reference for generating new
algorithms.
3.4.1 Binary Algorithm
The first algorithm being benchmarked is by Ran-Zan Wang titled “Region Incrementing Visual
Cryptography” [15]. The premise behind this paper is encrypting portions of an image to have
different levels of secrecy. For example, if three shares of an image are generated, overlapping any
two would result in the same message and overlaying all three images would result in the message
from overlaying two shares and an additional secret level message. This provides a dual layer of
CHAPTER 3. BENCHMARKING ANALYSIS 22
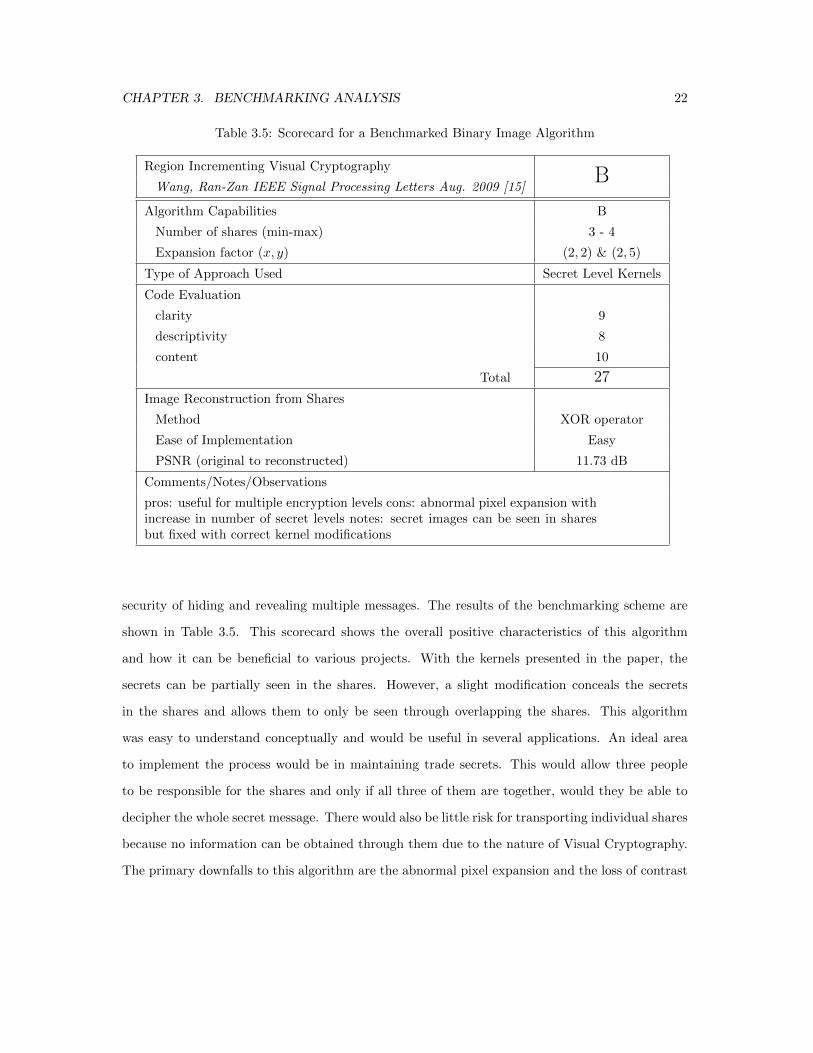
Table 3.5: Scorecard for a Benchmarked Binary Image Algorithm
Region Incrementing Visual CryptographyB
Wang, Ran-Zan IEEE Signal Processing Letters Aug. 2009 [15]
Algorithm Capabilities B
Number of shares (min-max) 3 - 4
Expansion factor (x, y) (2, 2) & (2, 5)
Type of Approach Used Secret Level Kernels
Code Evaluation
clarity 9
descriptivity 8
content 10
Total 27
Image Reconstruction from Shares
Method XOR operator
Ease of Implementation Easy
PSNR (original to reconstructed) 11.73 dB
Comments/Notes/Observations
pros: useful for multiple encryption levels cons: abnormal pixel expansion withincrease in number of secret levels notes: secret images can be seen in sharesbut fixed with correct kernel modifications
security of hiding and revealing multiple messages. The results of the benchmarking scheme are
shown in Table 3.5. This scorecard shows the overall positive characteristics of this algorithm
and how it can be beneficial to various projects. With the kernels presented in the paper, the
secrets can be partially seen in the shares. However, a slight modification conceals the secrets
in the shares and allows them to only be seen through overlapping the shares. This algorithm
was easy to understand conceptually and would be useful in several applications. An ideal area
to implement the process would be in maintaining trade secrets. This would allow three people
to be responsible for the shares and only if all three of them are together, would they be able to
decipher the whole secret message. There would also be little risk for transporting individual shares
because no information can be obtained through them due to the nature of Visual Cryptography.
The primary downfalls to this algorithm are the abnormal pixel expansion and the loss of contrast
CHAPTER 3. BENCHMARKING ANALYSIS 23
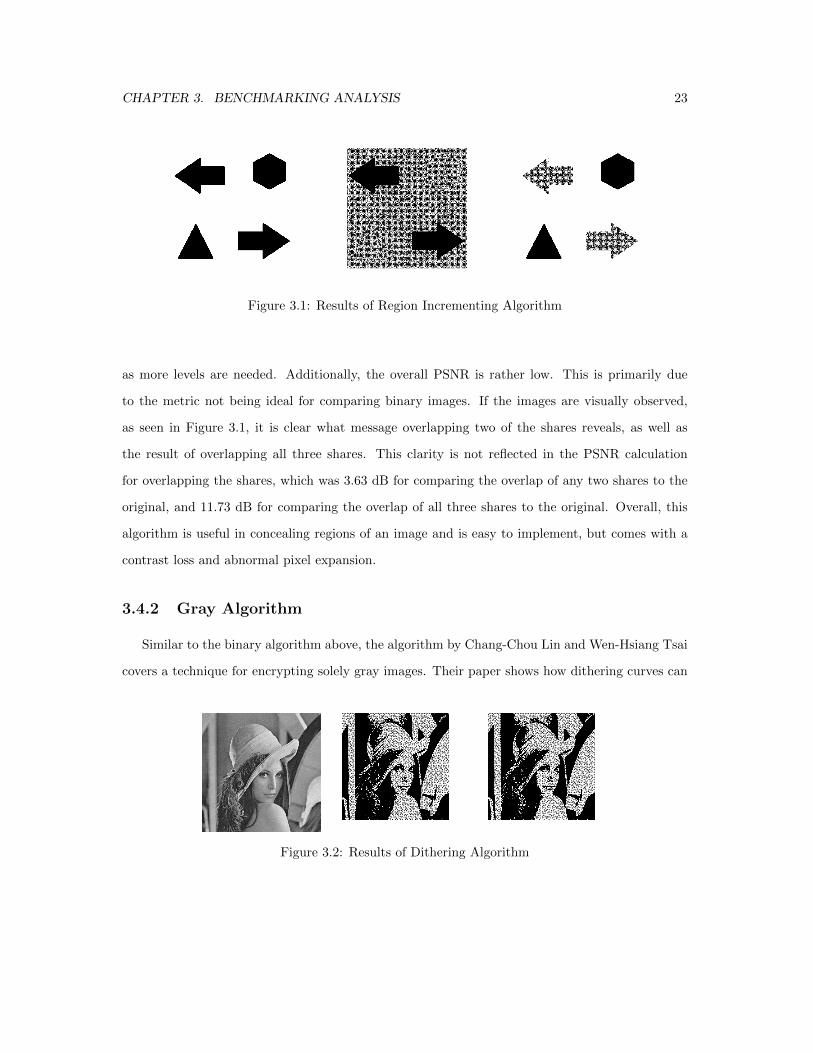
Figure 3.1: Results of Region Incrementing Algorithm
as more levels are needed. Additionally, the overall PSNR is rather low. This is primarily due
to the metric not being ideal for comparing binary images. If the images are visually observed,
as seen in Figure 3.1, it is clear what message overlapping two of the shares reveals, as well as
the result of overlapping all three shares. This clarity is not reflected in the PSNR calculation
for overlapping the shares, which was 3.63 dB for comparing the overlap of any two shares to the
original, and 11.73 dB for comparing the overlap of all three shares to the original. Overall, this
algorithm is useful in concealing regions of an image and is easy to implement, but comes with a
contrast loss and abnormal pixel expansion.
3.4.2 Gray Algorithm
Similar to the binary algorithm above, the algorithm by Chang-Chou Lin and Wen-Hsiang Tsai
covers a technique for encrypting solely gray images. Their paper shows how dithering curves can
Figure 3.2: Results of Dithering Algorithm
CHAPTER 3. BENCHMARKING ANALYSIS 24
be used to transform a gray level image into an approximate representation using only black and
white pixels. Following this transformation, the binary representation is encrypted using a given
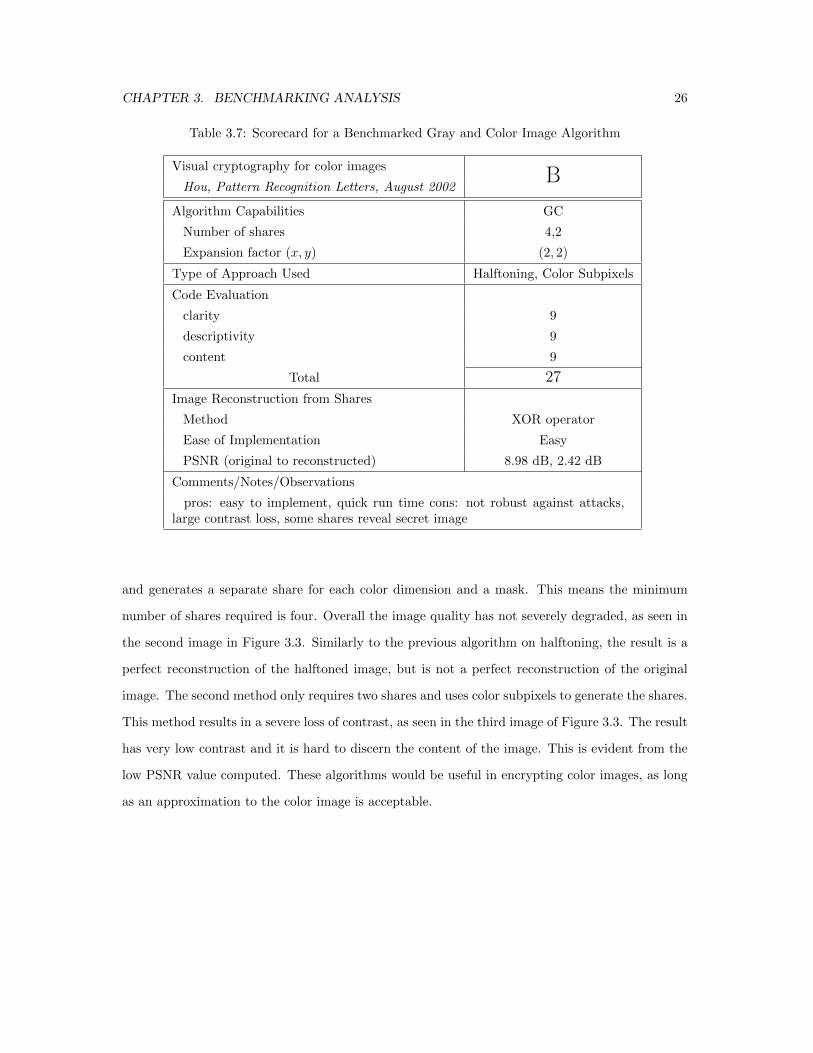
Visual Cryptography algorithm. The results of the benchmarking scheme are shown in Table 3.6.
This algorithm shows the ability of Visual Cryptography to handle gray level images and is a good
introduction to the difficulties associated with generating shares for gray images. This algorithm
represents the technique of transforming a gray image into an approximate binary image. While
this allows the image to be encrypted with the standard Visual Cryptography algorithm, it does
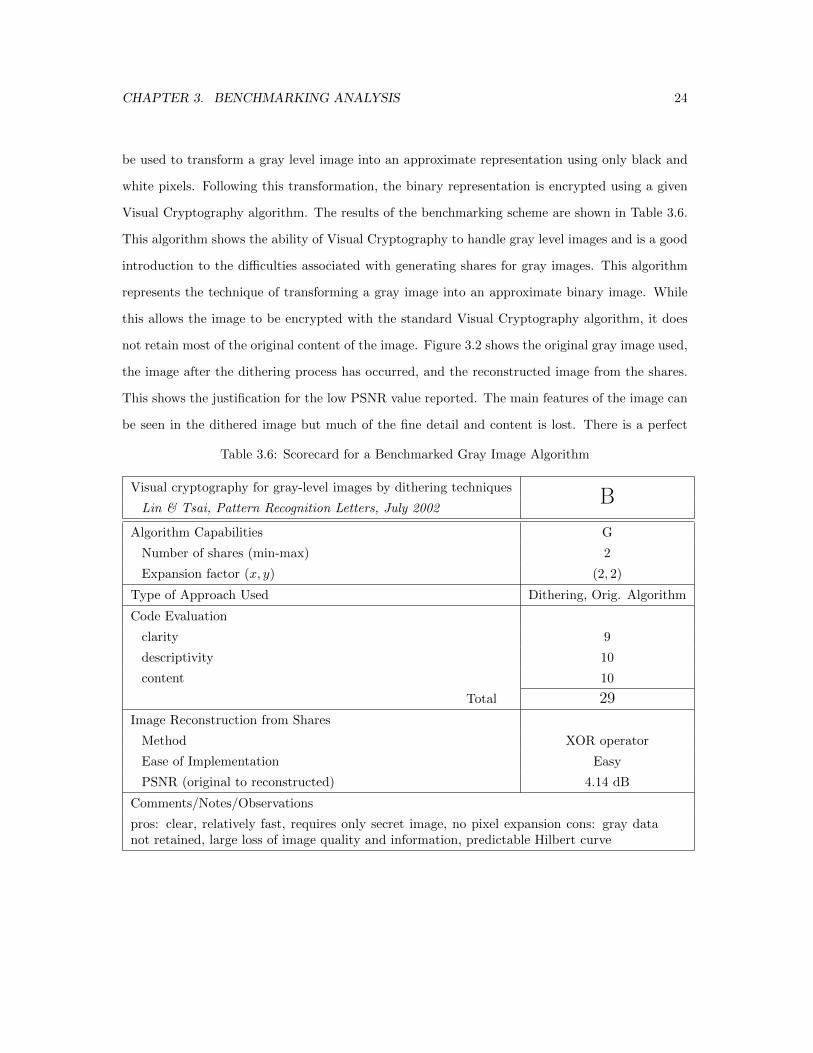
not retain most of the original content of the image. Figure 3.2 shows the original gray image used,
the image after the dithering process has occurred, and the reconstructed image from the shares.
This shows the justification for the low PSNR value reported. The main features of the image can
be seen in the dithered image but much of the fine detail and content is lost. There is a perfect
Table 3.6: Scorecard for a Benchmarked Gray Image Algorithm
Visual cryptography for gray-level images by dithering techniquesB
Lin & Tsai, Pattern Recognition Letters, July 2002
Algorithm Capabilities G
Number of shares (min-max) 2
Expansion factor (x, y) (2, 2)
Type of Approach Used Dithering, Orig. Algorithm
Code Evaluation
clarity 9
descriptivity 10
content 10
Total 29
Image Reconstruction from Shares
Method XOR operator
Ease of Implementation Easy
PSNR (original to reconstructed) 4.14 dB
Comments/Notes/Observations
pros: clear, relatively fast, requires only secret image, no pixel expansion cons: gray datanot retained, large loss of image quality and information, predictable Hilbert curve
CHAPTER 3. BENCHMARKING ANALYSIS 25
reconstruction between the dithered image and the image resulting from overlapping the shares.
While the technique is well documented and easy to implement, careful consideration needs to be
taken into account when implementing this algorithm to determine if the gray values of the image
need to be fully retained.
3.4.3 Gray and Color Algorithm
To provide the capability of encrypting gray and color images allows an algorithm to be used
in multiple scenarios and for distinctively more projects than a solely binary algorithm. The
algorithms presented by Young-Chang Hou in “Visual Cryptography for Color Images” [6] provides
several methods for concealing gray and color images in seemingly random shares. Overall, the
algorithms are easy to understand and implement with their primary method stemming from the
process of halftoning. The security of the algorithms have been researched and documented through
another paper by Leung, Ng, & Wong [9] and their results show that the image shares do not have
the proper security necessary for Visual Cryptography shares. This information would need to be
taken into consideration when deciding whether or not to use this algorithm for a given project.
The results of the benchmarking scheme are shown in Table 3.7. This algorithm benchmark
contains the information for the first two methods, separated by a comma where applicable. These
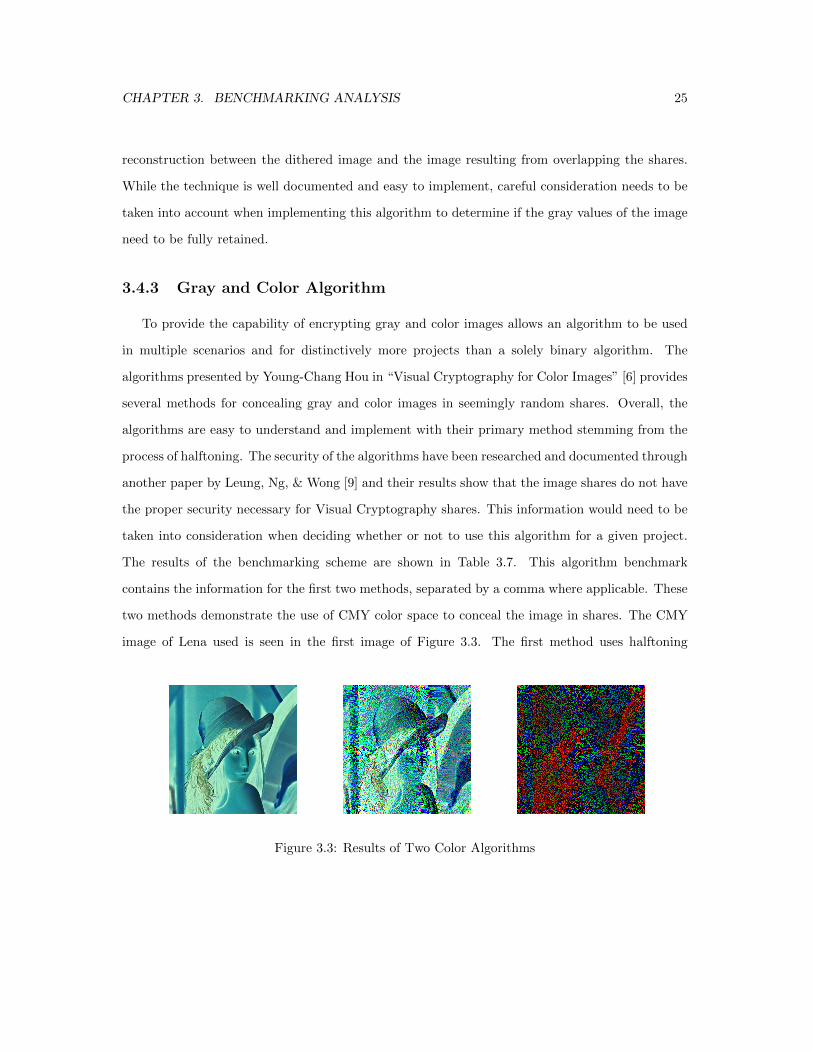
two methods demonstrate the use of CMY color space to conceal the image in shares. The CMY
image of Lena used is seen in the first image of Figure 3.3. The first method uses halftoning
Figure 3.3: Results of Two Color Algorithms
CHAPTER 3. BENCHMARKING ANALYSIS 26
Table 3.7: Scorecard for a Benchmarked Gray and Color Image Algorithm
Visual cryptography for color imagesB
Hou, Pattern Recognition Letters, August 2002
Algorithm Capabilities GC
Number of shares 4,2
Expansion factor (x, y) (2, 2)
Type of Approach Used Halftoning, Color Subpixels
Code Evaluation
clarity 9
descriptivity 9
content 9
Total 27
Image Reconstruction from Shares
Method XOR operator
Ease of Implementation Easy
PSNR (original to reconstructed) 8.98 dB, 2.42 dB
Comments/Notes/Observations
pros: easy to implement, quick run time cons: not robust against attacks,large contrast loss, some shares reveal secret image
and generates a separate share for each color dimension and a mask. This means the minimum
number of shares required is four. Overall the image quality has not severely degraded, as seen in
the second image in Figure 3.3. Similarly to the previous algorithm on halftoning, the result is a
perfect reconstruction of the halftoned image, but is not a perfect reconstruction of the original
image. The second method only requires two shares and uses color subpixels to generate the shares.
This method results in a severe loss of contrast, as seen in the third image of Figure 3.3. The result
has very low contrast and it is hard to discern the content of the image. This is evident from the
low PSNR value computed. These algorithms would be useful in encrypting color images, as long
as an approximation to the color image is acceptable.
CHAPTER 3. BENCHMARKING ANALYSIS 27
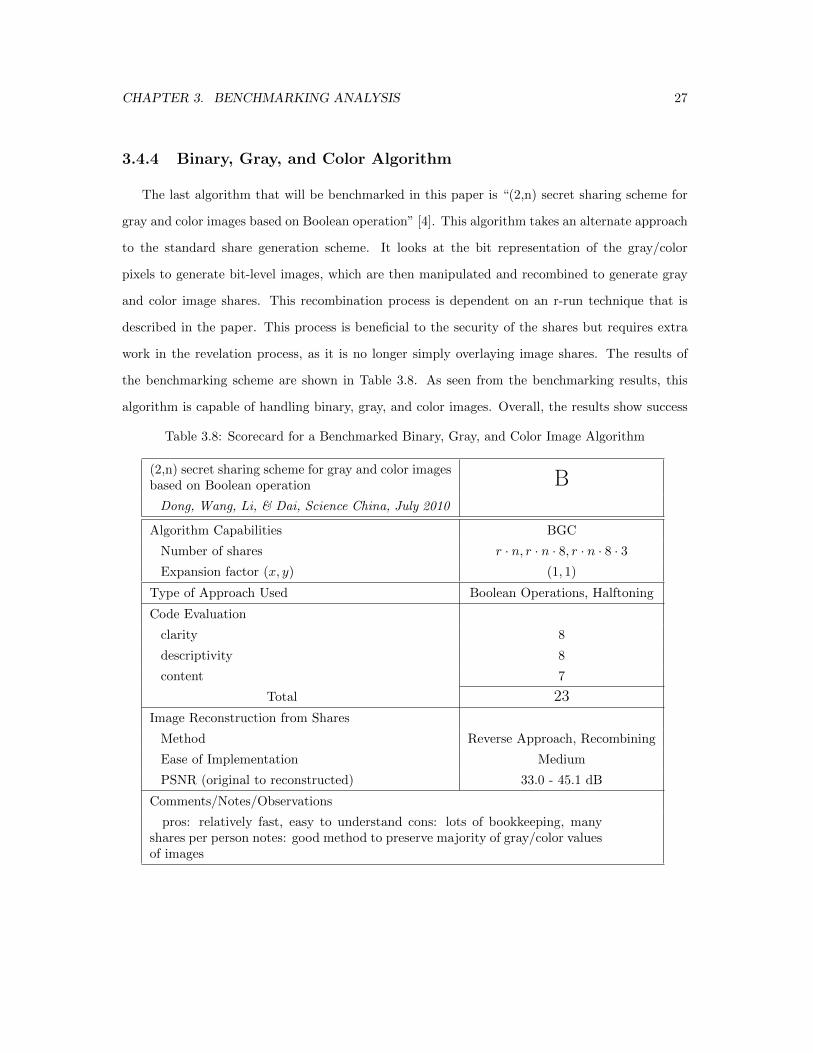
3.4.4 Binary, Gray, and Color Algorithm
The last algorithm that will be benchmarked in this paper is “(2,n) secret sharing scheme for
gray and color images based on Boolean operation” [4]. This algorithm takes an alternate approach
to the standard share generation scheme. It looks at the bit representation of the gray/color
pixels to generate bit-level images, which are then manipulated and recombined to generate gray
and color image shares. This recombination process is dependent on an r-run technique that is
described in the paper. This process is beneficial to the security of the shares but requires extra
work in the revelation process, as it is no longer simply overlaying image shares. The results of
the benchmarking scheme are shown in Table 3.8. As seen from the benchmarking results, this
algorithm is capable of handling binary, gray, and color images. Overall, the results show success
Table 3.8: Scorecard for a Benchmarked Binary, Gray, and Color Image Algorithm
(2,n) secret sharing scheme for gray and color imagesbased on Boolean operation BDong, Wang, Li, & Dai, Science China, July 2010
Algorithm Capabilities BGC
Number of shares r · n, r · n · 8, r · n · 8 · 3
Expansion factor (x, y) (1, 1)
Type of Approach Used Boolean Operations, Halftoning
Code Evaluation
clarity 8
descriptivity 8
content 7
Total 23
Image Reconstruction from Shares
Method Reverse Approach, Recombining
Ease of Implementation Medium
PSNR (original to reconstructed) 33.0 - 45.1 dB
Comments/Notes/Observations
pros: relatively fast, easy to understand cons: lots of bookkeeping, manyshares per person notes: good method to preserve majority of gray/color valuesof images
CHAPTER 3. BENCHMARKING ANALYSIS 28
in generating shares and revealing the information contained in them. However, the pseudo code
is not perfectly clear, descriptive, and complete so developing an algorithm that mimics this paper
is challenging. Once the algorithm is generated, it performs as described and gives results that
are similar to those presented in the paper. The visual results can be seen in the paper due to the
many combinations of r & n that were tested. The range of PSNR values that were reported were
for gray image shares reconstruction. Overall, this algorithm has many positive results but there
is a lot of bookkeeping that is involved. As long as multiple shares and an extra step in revelation
are acceptable, this algorithm is a good way to generate shares of binary, gray, and color images.
It also makes an effort to maintain the values of the pixels rather than simply thresholding them
or reassigning them.
3.5 Observations and Additional Information
This benchmarking process can be applied to any Visual Cryptography algorithm to assess its
capabilities and performance. These four examples show how the benchmarking process allows
a visualization of the algorithm’s strengths and weaknesses and how it compares to a standard
grading scale. Ideally, several independent assessors would provide their scoring and benchmarking
analysis and those would be complied to give an unbiased result that could be published on an
easily accessible database.
Chapter 4
Importance of Findings
The process of benchmarking allows a deeper understanding of the field of Visual Cryptography
to be gained. The results that are attained from this process allow Visual Cryptography algorithms
to be easily incorporated into a variety of projects. A proper benchmarking scheme gives Visual
Cryptography algorithms documentation and displays their capabilities and weaknesses. This
allows an informed decision to be reached on whether or not the algorithms is suited to the project
needs and goals.
4.1 Project Significance
The significance of this benchmarking process is rooted in the understanding gained about the
field of Visual Cryptography. This process works on bridging the gap between algorithm developer
and project coordinators. It provides information that is useful in developing new algorithms as well
as incorporating old algorithms into projects and tasks. Through using a benchmarking scheme,
the content, capabilities, and documentation for a given algorithm is in an easily accessible form.
This project is also significant because it is a new proposal for documenting Visual Cryptography
algorithms. It also provides general guidelines for developers on the content and information needed
to use a given algorithm in practice. These guidelines are also beneficial for project coordinators
29
CHAPTER 4. IMPORTANCE OF FINDINGS 30
to understand the various uses and capabilities of known Visual Cryptography algorithms, in
addition to current gaps in the field. A benchmarking scheme is essential to the growing field of
Visual Cryptography and will revolutionize the development, use, and expansion of the field.
4.2 Project Relevance
This benchmarking process allows a more comprehensive understanding of Visual Cryptogra-
phy. It achieves this through examining individual components, as well as the overall process, of a
Visual Cryptography algorithm. This is beneficial for the developers of new algorithms to under-
stand how their algorithm is interpreted and perceived from a reader’s perspective. Similarly, this
is beneficial to the readers to allow insight into the development of an algorithm and the proper use
of algorithms for various projects and tasks. The relevance of the benchmarking process extends
to providing a standard comparison of all Visual Cryptography algorithms. Comparison to this
standard requires input from several members of the Visual Cryptography community on their
assessment of the algorithms capabilities and weaknesses. This benchmarking scheme provides a
unification of Visual Cryptography algorithms by comparing them to the same set of standards.
Chapter 5
Conclusions
The field of Visual Cryptography has progressed steadily over the past several years. It started
as a process to encrypt binary images to conceal messages containing text and has evolved into
encrypting color images as meaningful shares to conceal messages ranging from binary text to other
color images. As this field continues to grow and expand in its capabilities, a benchmarking process
is beneficial to highlight the strengths and weaknesses of each algorithm as well as growth areas
that have not been met by the current algorithms. This benchmarking scheme has been developed
to better understand the current algorithm techniques available within the Visual Cryptography
community.
This paper outlines a proposed Visual Cryptography algorithm benchmarking scheme. Through
benchmarking a given algorithm, a scorecard is given as the result. This scorecard contains in-
formation pertaining to the algorithm and allows external readers and developers to concisely
interpret the algorithm. Some of the information provided in the scorecard includes a concise sum-
mary of the paper regarding its type of encryption used, algorithm assessment, and revelation of
results. Additionally, it notes specific strengths and areas of improvement with a write-in comments
section. This benchmarking scheme provides information about Visual Cryptography algorithms
which can be used to determine if a given algorithm is sufficient for a specific project or task.
31
CHAPTER 5. CONCLUSIONS 32
The availability of this information is beneficial for finding the ideal algorithm to use in a specific
project and identifying growth areas to be filled with current research in Visual Cryptography.
To demonstrate the use of this benchmarking scheme, the process is demonstrated on four
different algorithms. This process is shown to be successful in benchmarking those four algorithms,
and by extension all remaining Visual Cryptography algorithms. This scheme also takes into
account the foundations of Visual Cryptography to determine the ranking of the algorithms. It
focuses on examining the improvement and differences of the given algorithm compared to the
original algorithm by Naor and Shamir. The benchmarking scheme was successful for the four given
algorithms and would need to be tested on several additional algorithms to determine robustness
and effectiveness of information presented in the scorecard style. Currently, the only input provided
to generate these scorecards is from the author. Additional review and input would be required to
have scorecards that are not creator biased, but these scorecards are sufficient for demonstration
of the benchmarking process. Overall, the benchmarking scheme developed in this thesis can be
declared a successful endeavor for the Visual Cryptography community.
Chapter 6
Future Work & Expansion
The completion of this project provides an opportunity for future work and expansion related to
the benchmarking scheme presented. The primary expansion that can be executed is implementing
this benchmarking scheme on all known Visual Cryptography algorithms. This would allow the
robustness and effectiveness of the scheme to be properly evaluated. Benchmarking all known
algorithms would also complete the purpose of the scheme and allow a greater understanding of
Visual Cryptography. This would be a large commitment as proper benchmarking requires the
analysis of the paper, in addition to implementing the algorithm and comparing the results.
After the benchmarking scheme has been performed on all algorithms through the perspective
of a single person, the next natural expansion would be to accept reviews from multiple sources.
This would allow an overall understanding of Visual Cryptography algorithms and would remove
some of the author and reviewer bias. These reviews would have to be complied and averaged to
present the results in a scorecard format, similar to a single reviewer. The number of reviewers
required for each benchmarking algorithm to remove a majority of the bias should be determined
as well. It would also be recommended that the authors of the algorithm are consulted on their
own algorithm to provide an assessment of information intended for the readers. This generates
an understanding of reader interpretation compared to author intentions. This also benefits future
33
CHAPTER 6. FUTURE WORK & EXPANSION 34
developers and authors by observing how Visual Cryptography papers and algorithm development
are perceived by the Visual Cryptography community.
The last project expansion is to develop a benchmarking database. This database would compile
the results from the scorecards and present them in an easily accessible format. Within the digital
scorecard, there would be a link to the paper being benchmarked and an interactive section.
This interactive section would allow users to provide additional comments, extensive reviews, and
generous feedback on the algorithms. It would also allow users to submit code for analysis and
feedback on improvement from the database community and algorithm developers. The database
would also allow authors and developers to interact with reviewers to gain additional perspective on
their algorithms, specifically how their algorithm was perceived and implemented. The database
could also have an additional section where feedback is obtained prior to paper submission, in
addition to a section where ideas can be generated and presented to developers looking for projects.
This database would allow a true unification of the Visual Cryptography community and provide
an interactive environment dedicated to the understanding, improvement, and generation of Visual
Cryptography algorithms.
Bibliography
[1] Robert C Camp. Best practice benchmarking: The path to excellence. CMA Magazine,
72(6):10–14, July 1998.
[2] C-C Chang, W-L Tai, and C-C Lin. Hiding a secret colour image in two colour images. The
Imaging Science Journal, 53:229–240, May 2005.
[3] S. Cimato, R. De Prisco, and A. De Santis. Probabilistic visual cryptography schemes. The
Computer Journal, 49(1):97–107, December 2005.
[4] Lin Dong, DaoShun Wang, ShunDong Li, and YiQi Dai. (2,n) secret sharing scheme for gray
and color images based on boolean operation. Science China Information Sciences, pages
1–11, July 2010.
[5] Barbara Ettorre. Benchmarking: The next generation. Management Review, 82(6):10–16,
June 1993.
[6] Young-Chang Hou. Visual cryptography for color images. Pattern Recognition, 36:1619–1629,
August 2002.
[7] Ching-Sheng Hsu and Young-Chang Hou. Copyright protection scheme for digital images
using visual cryptography and sampling methods. Optical Engineering, 44(7):1–10, July 2005.
[8] Mohan Kharbanda. Benchmarking: Making it work. CMA Magazine, 67(2):30–33, March
1993.
35
BIBLIOGRAPHY 36
[9] Bert W. Leung, Felix Y. Ng, and Duncan S. Wong. On the security of a visual cryptography
scheme for color images. Pattern Recognition, 42:929–940, August 2008.
[10] Chang-Chou Lin and Wen-Hsiang Tsai. Visual cryptography for gray-level images by dithering
techniques. Pattern Recognition Letters, 24:349–358, 2003.
[11] Der-Chyuan Lou, Hong-Hao Chen, Hsien-Chu Wu, and Chwei-Shyong Tsai. A novel authen-
ticatable color visual secret sharing scheme using non-expanded meaningful shares. Displays,
32:118–134, February 2011.
[12] Moni Naor and Adi Shamir. Visual cryptography. EUROCRYPT, pages 1–12, 1994.
[13] B. Dinesh Reddy, V. Valli Kumari, KVSVN Raju, and Y.H. Prassanna Raju. Rotation
visual cryptography using basic (2,2) scheme. International Journal of Computing Science
and Communication Technologies, 3(2):594–597, January 1984.
[14] Luiz Velho and Jonas de Miranda Gomes. Digital halftoning with space filling curves. Com-
puter Graphics, 25(4):81–90, July 1991.
[15] Ran-Zan Wang. Region incrementing visual cryptography. IEEE Signal Processing Letters,
16(8):659–662, August 2009.
Related Documents